Article

Response of Soil Temperature to Soil Moisture Content and Meteorological Elements with Gravel-Sand Mulching

1
School of Civil and Water Conservancy Engineering, Ningxia University, Yinchuan 750021, China
2
College of Agriculture, Ningxia University, Yinchuan 750021, China
*
Author to whom correspondence should be addressed.
Land 2025, 14(4), 853; https://doi.org/10.3390/land14040853
Submission received: 4 March 2025 / Revised: 23 March 2025 / Accepted: 24 March 2025 / Published: 14 April 2025

Abstract

:
Soil gravel–sand mulching—an ancient farming method in arid areas—is used to cope with drought by conserving water and improving soil temperature, the latter being a key factor affecting agricultural production. The objective of this study is to ascertain the influence of soil water content and meteorological elements on soil temperature under gravel–sand mulching conditions. Field experiments, analysis of variance, Pearson correlation analysis, and other statistical methods were used to study the effects of varying soil moisture content on soil temperature at 0–25 cm depth under gravel–sand mulching conditions, and to analyze the relationships between meteorological factors and soil temperature during the temperature measurement period. In the 0–20 cm soil layer, the soil accumulated temperature decreased with an increase in soil moisture content, while the change rate of temperature increased. In the test range, the temperature conductivity of 10–15 cm soil increased with the increase in soil water content in the 20–40 cm layer. Under gravel–sand mulching conditions, soil temperature was not only related to air temperature but also positively related to water vapor pressure. When the soil moisture content was high, the soil temperature decreased with an increase in atmospheric evaporation capacity. When the soil moisture conditions were poor, the meteorological factors had an effect of increasing the soil temperature. Under gravel–sand mulching conditions, soil moisture content exhibits a significant negative correlation with both soil temperature and accumulated temperature. Higher soil moisture enhances vertical heat conduction, facilitating heat transfer from the surface to deeper layers. The 10–15 cm soil layer acts as a thermal buffer zone, regulating temperature fluctuations and mitigating extreme heat variations. However, higher air temperature leads to greater heat accumulation, while, in wetter soils, enhanced heat conduction and evaporative cooling lower soil temperature.

1. Introduction

Soil surface gravel–sand mulching reduces surface runoff, inhibits soil evaporation, and regulates soil temperature [1]. Compared with bare soil treatment, gravel–sand mulching improves soil insulation capacity and soil temperature [2]. As a comprehensive indicator of soil heat flux, soil temperature is influenced by factors such as soil moisture content [3], solar radiation, air temperature, and the characteristics of ground and spatial heat balance [4]. Changes in soil temperature directly affect soil organic matter decomposition [5], nutrient transformation and migration [6], microbial activity, and the growth and development of crop roots [7]. Soil surface gravel–sand mulching provides good soil moisture conditions for crops by retaining water and conserving moisture; better moisture conditions also affect soil temperature, thereby affecting crop growth. The soil moisture under gravel–sand mulching mainly depends on the previous year’s precipitation and the precipitation during the crop growth period of the current year. Differing precipitation between years results in different base moisture conditions which, in turn, affect soil temperature, thereby affecting crop growth. At the same time, there is a close relationship between soil temperature and meteorological elements. However, under gravel–sand mulching, solar radiation affects the soil layer temperature through the sand mulching layer, and the conduction of soil temperature is related to the soil moisture content. Therefore, studying the relationship between soil temperature and soil moisture content and meteorological elements under gravel–sand mulching conditions is of great significance for revealing the soil water–heat relationship and conduction in gravel–sand mulching land.
Changes in soil moisture affect soil temperature by altering the thermal properties of the soil [8], interacting with each other and influencing each other [9]. There is a significant correlation between soil moisture content in the 0–20 cm layer and soil temperature in the 0–20 cm layer, and there is some influence on soil temperature in the 20–40 cm layer, but it does not reach a significant level [10]. Under soil gravel–sand mulching conditions, soil moisture content in the 20–40 cm layer has a significant impact on soil temperature in the 0–40 cm layer, and the daily variation in soil temperature in the 0–25 cm soil layer is transmitted in the form of a negative–positive sine curve “S” from the surface to the deep soil. For every 5 cm increase in soil depth, the phase of the soil temperature wave is shifted by 1 h, and the temperature change in the 5 cm soil layer is the most obvious [11]. Sharmasarkar et al. [12] suggested that the distribution of soil moisture affects the soil temperature and humidity below the soil surface, thereby affecting the microclimate environment of the soil.
The characteristics of soil temperature change are closely related to meteorological factors. Air temperature is a key factor affecting soil temperature, and the surface soil temperature of farmland before sowing has a strong linear correlation with the daily average air temperature [13]. Latitude and longitude and air temperature have a good response relationship with soil temperature; of these, air temperature is the most important influencing factor, which can more directly affect the change in shallow ground temperature [14,15]. Among conventional meteorological factors, relative humidity, air temperature, wind speed, and total solar radiation have extremely significant correlations with soil temperature, while the correlation between air pressure and soil temperature is not significant [16,17]. Soil temperature is influenced by many meteorological factors [18], but the relationships between soil temperature and meteorological factors under gravel–sand mulching are complex. Under gravel–sand mulching, the near-surface air temperature is positively correlated with soil temperature, and the correlation is stronger than that for bare land [19,20]. However, under soil gravel–sand mulching, the sand layer is directly affected by solar radiation, which conducts heat to the lower soil layers; at the same time, the heat of the soil needs to be conducted to the atmosphere through the sand layer. As such, the gravel–sand mulching layer actually plays the role of a conductive medium in the process of energy interaction between the soil and the outside world.
As one of the main economic crops of local farmers, watermelon needs good water thermal conditions, and gravel–sand mulching and sand cover can provide mineral elements, such as selenium, to the watermelon and increase its nutritional value. Under rain-fed conditions, the water supply for the watermelon growth period mainly comes from precipitation during this period and from pre-sowing base moisture. The pre-sowing base moisture is closely related to the precipitation of the previous year. Different precipitation years will cause significant differences in soil base moisture (soil moisture). Different soil moisture conditions will also affect soil temperature, thereby affecting crop growth [21,22]. Previous studies have focused more on the relationship between soil moisture content and crop growth under gravel–sand mulching, and less on the relationship between soil moisture content and soil temperature. This study aims to determine the influence law of soil moisture content differences under soil surface gravel–sand mulching conditions on soil temperature at a depth of 0–25 cm, as well as exploring the relationships between meteorological factors and soil temperature under these conditions, in order to provide a theoretical basis for revealing the relationship between soil water and heat based on gravel–sand mulching.

2. Materials and Methods

2.1. Experimental Site Overview

The experimental site is located in Tuozhai Village, Xingren Town, Zhongwei City, Ningxia, in the core area of the arid zone in central Ningxia (36°56′22.52″ N, 105°15′35.26″ E) and is significantly representative, with an average elevation of 1740 m. It experiences abundant sunshine, is arid with little rainfall, has an average annual precipitation of 180 mm, and an evaporation rate of 2100 mm to 2400 mm. Soil organic matter was measured using potassium dichromate–ferrous sulfate titration; effective phosphorus was determined by NaHCO3 extraction-molybdenum antimony; effective potassium was measured with flame photometry; total nitrogen was measured using H2SO4-H2O2 distillation; soil particle size was measured with a dry sieve; and soil porosity was measured with a ring knife. The soil physical and chemical properties were determined in references [23,24]. The thickness of the gravel–sand mulching layer is 15~25 cm, and the basic physicochemical properties of the 0–20 cm soil layer are as follows: organic matter is 6.39 g kg−1, total nitrogen is 1.0 g kg−1, available phosphorus is 6.2 g kg−1, and available potassium is 88 g kg−1. The dry bulk density of the soil is 1.42 g cm−3, and the field capacity is 27.7% (by weight). The tested soil contains 25.93% sand, 63.94% silt, and 10.13% clay, with a texture classified as sandy loam (Chinese system), and a soil porosity of 48.35%.

2.2. Experimental Design

The experimental design is shown in Table 1. Different soil moisture contents were created by irrigating various amounts of water before sowing, while also setting up treatments without irrigation and without planting watermelons. The purpose of the treatment without planting watermelons was to study the effect of fallowness during the watermelon growth period on soil moisture. The plot size was 6 m × 6 m = 36 m2, with three replications, arranged in a completely randomized manner. To prevent water overflow during irrigation, a ridge of 15 cm was built around each plot, and for plots with larger irrigation volumes, intermittent irrigation was used. The plots were spaced 1 m apart to reduce water exchange between them. The field experiment was conducted from May to August 2011, with irrigation on 5 May 2011. The crop planted was watermelon, the variety being Jincheng No. 5, using the transplanting seedling method. The planting distance was 1.5 m × 2.0 m, with 12 watermelon plants per plot. The transplanting seedlings were planted on 9 May 2011, and the harvest took place on 15 August 2011. During the growth period, no further irrigation was applied to any of the treatments, and other management practices were the same as those for local watermelon field management.

2.3. Measurement Method

Soil temperature: from 9 July 2011 to 12 August 2011, a total of 35 days, the soil temperature at depths of 5, 10, 15, 20, and 25 cm was measured at 8:00, 14:00, and 20:00 daily using a mercury L-shaped right-angle thermometer (Jixing Instrument Factory, Tianjin, China) (−20 to +50 °C, with an accuracy of 0.1 °C).
Soil moisture content: Samples were collected at depths of 0–100 cm during the seedling stage, vine extension stage, flowering and fruit setting stage, fruit enlargement stage, and harvest stage of watermelon. Each 20 cm depth was considered as one sample. Soil moisture content was determined using the drying method, and the average soil moisture content before and after the temperature measurement period (during the fruit enlargement and harvest stages) was taken as the average soil moisture content during the soil temperature measurement period. The equipment for determining the soil moisture content in this test is the electric heating blast drying box.
Meteorological data: Meteorological data during the watermelon growth period were provided by the Xingren Meteorological Station of the National Basic Meteorological Station. These data included average temperature, maximum temperature, minimum temperature, evaporation, vapor pressure, wind speed, sunshine duration, air pressure, and air humidity.

2.4. Data Processing

Data were analyzed using the Excel 2023 version and the SPSS 2023 version software, and the differences in soil temperature and soil moisture content between treatments were analyzed using one-way ANOVA. For the method of multiple comparisons, we employed the LSD post hoc test; Pearson correlation analysis was used to analyze the relationships between soil temperature, soil moisture content, and meteorological elements; and Origin2021 software was used for plotting. The reference evapotranspiration (ET0) was calculated using the Penman–Monteith (P-M) formula, while the actual evaporation (ETa) was determined through the water balance method. Data standardization was performed when establishing the binary regression equation.
(1) Soil accumulated temperature was obtained by calculating the daily average of soil temperatures at 8:00, 14:00, and 20:00 and then cumulatively summing these values over time.
(2) Soil thermal diffusivity, also known as thermal conductivity or thermal diffusivity, was calculated using the one-dimensional homogeneous soil heat conduction equation as follows:
T t = α 2 T 2 z
where T represents temperature, t represents time, z represents depth, and α is the soil thermal diffusivity. The amplitude method was used to calculate soil thermal diffusivity, with the following formula:
α = ω 2 [ z 2 z 1 ln A 1 / A 2 ] 2
where ω is the Earth’s rotational angular frequency, and A1 and A2 are the amplitudes at depths z1 and z2, respectively, determined by the highest and lowest temperatures at these two depths.
(3) The soil temperature gradient formula is as follows:
G r a d T ( i j ) = T z Δ T Δ z = ( T j T i ) / Δ z
where GradT represents the soil temperature gradient between two adjacent temperature-measuring soil layers (°C/cm), i represents the depth of the upper soil layer, j represents the depth of the lower soil layer, T represents the temperature difference between the two layers (°C), and z represents the depth difference between the two layers (cm). References are given in [24,25].

3. Results

3.1. Dynamic Changes in Soil Moisture Content

Figure 1 shows the vertical distribution of soil moisture content under different water treatments (soil moisture content during soil temperature measurement). The analysis of variance revealed significant differences in soil moisture content between treatments at the 0–100 cm soil depth (p < 0.05), indicating that differences still existed despite the two months between soil temperature measurement and irrigation time. The average soil moisture content for S1, S2, S3, S4, S5, and BGS was 17.22%, 17.15%, 17.01%, 16.52%, 15.46%, and 14.09%, respectively. Compared to the fallow mode, the average soil moisture content in the 0–100 cm layer for the waterless watermelon cultivation treatment (BGS) was significantly lower than that of the fallow non-cultivation treatment (BZZ), indicating that fallow cultivation on gravel mulched land could significantly increase soil moisture content, with an increase of up to 10.98%.

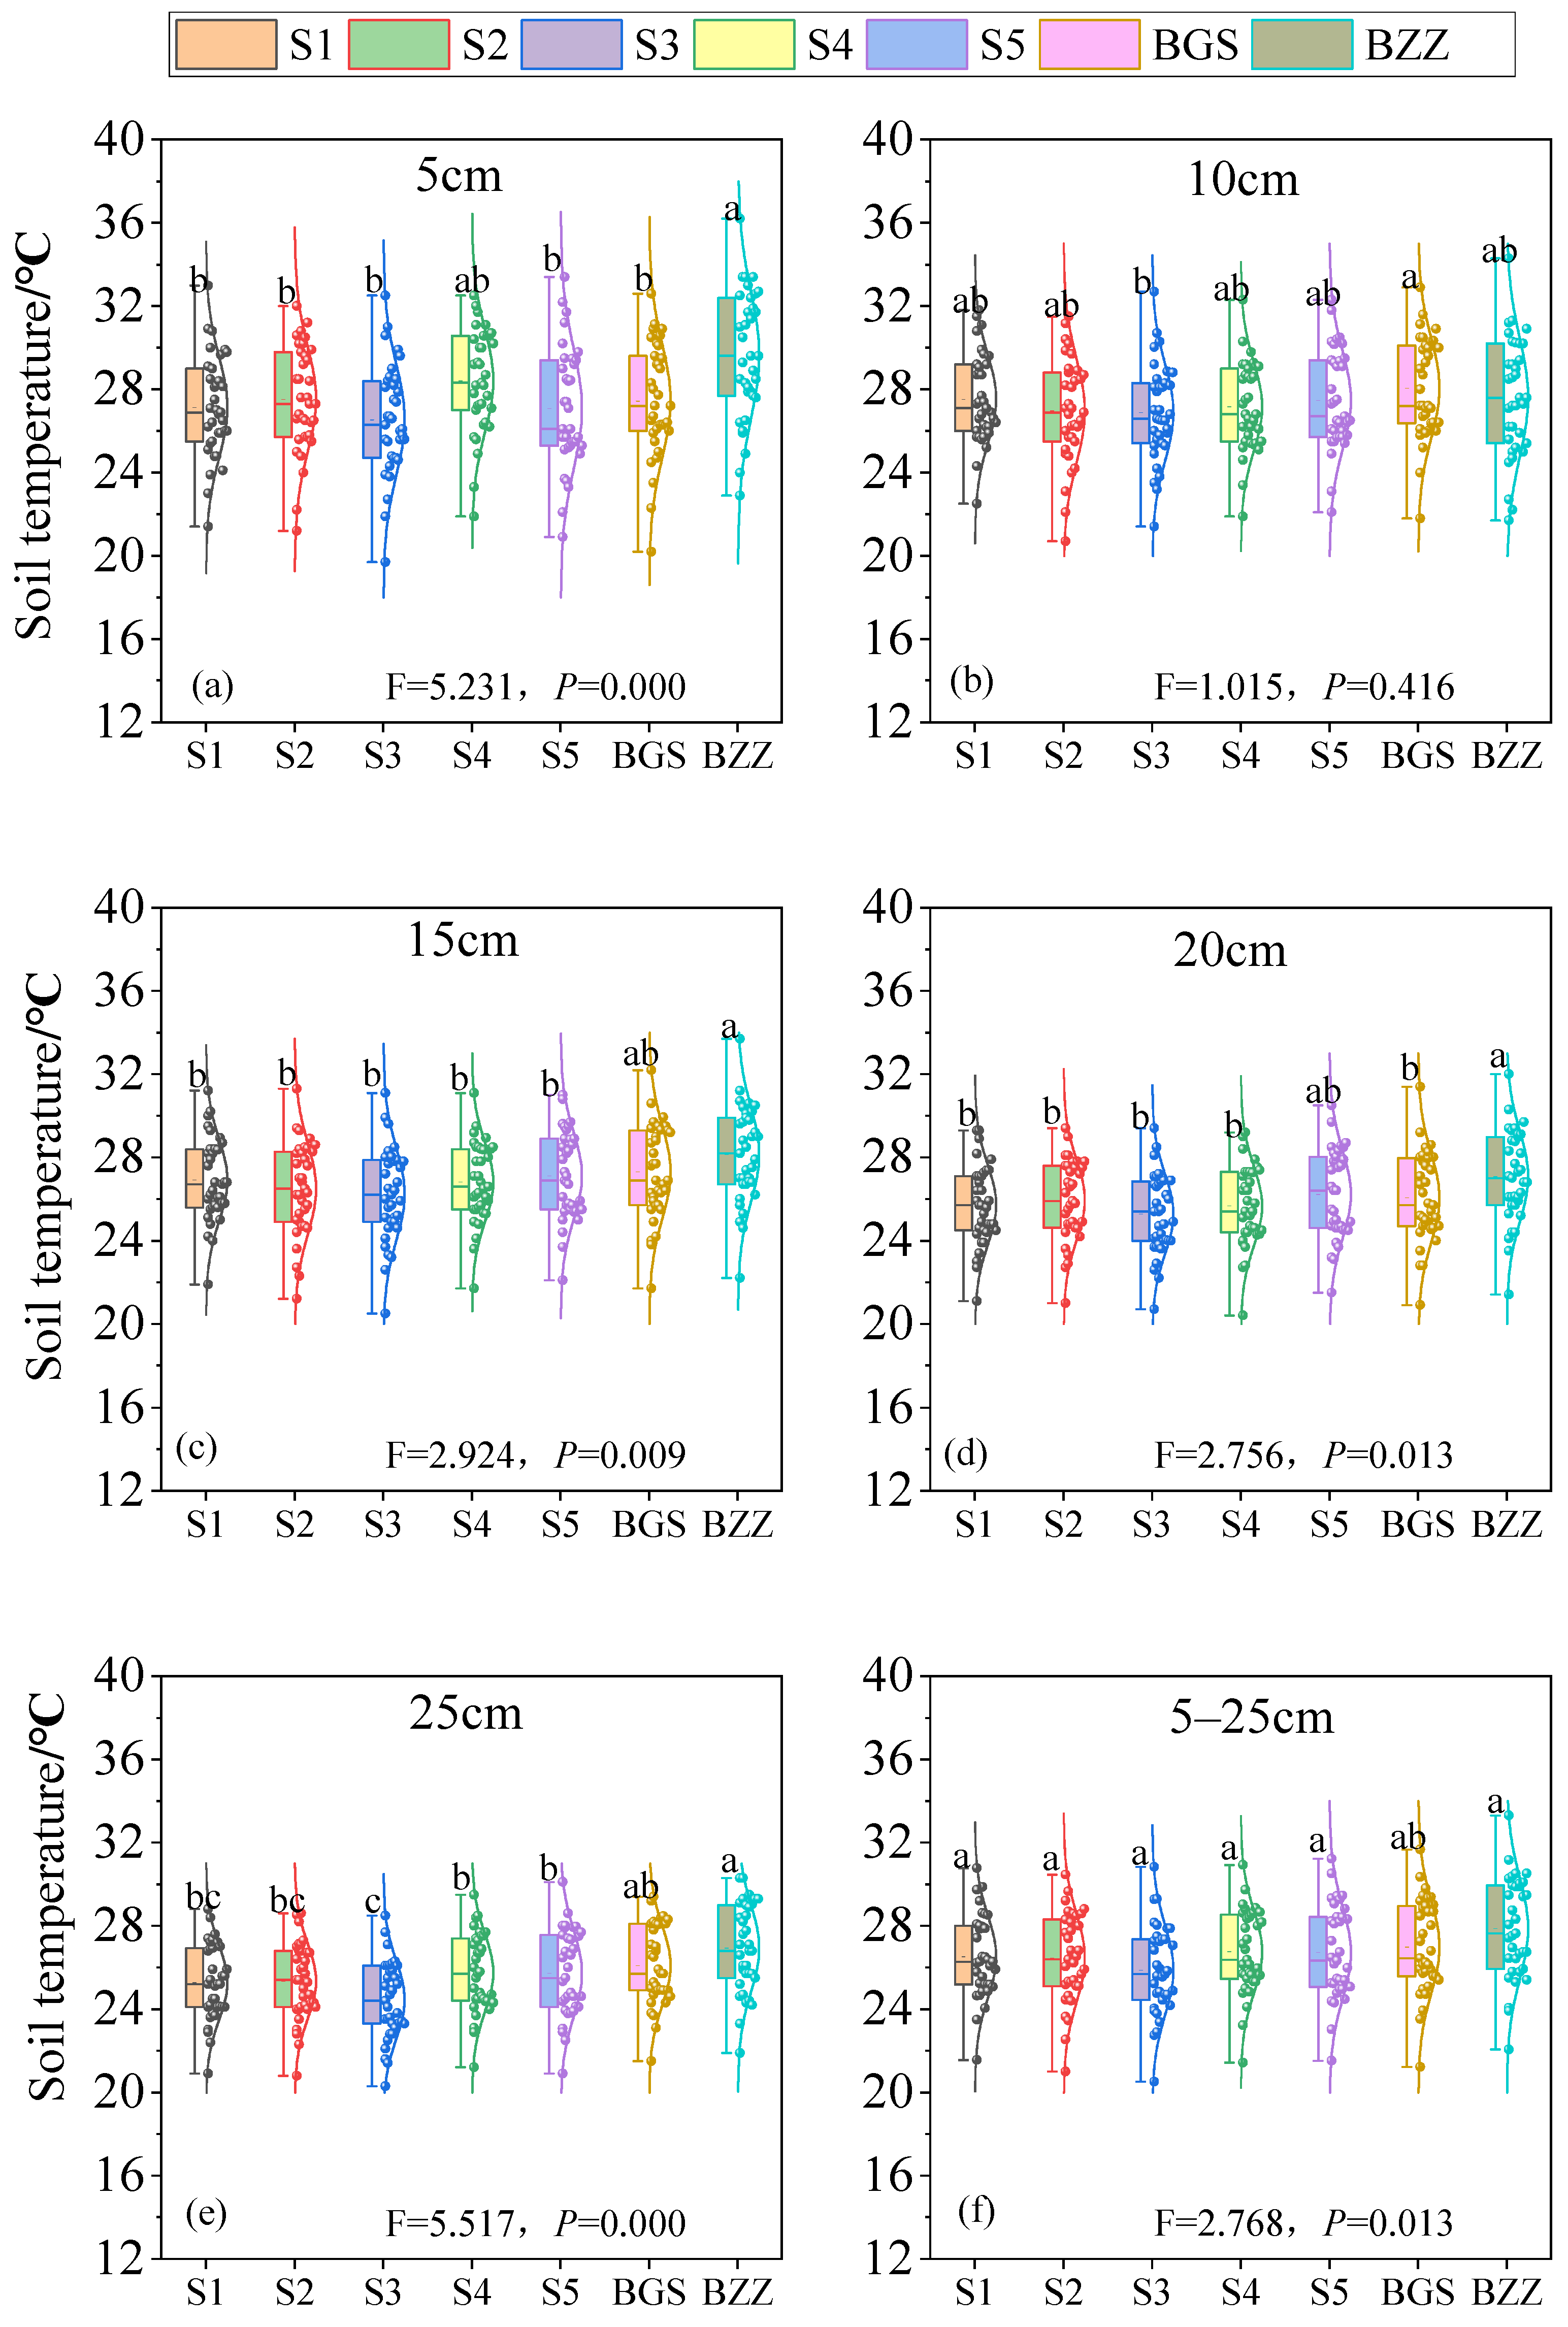
3.2. Dynamic Changes in Soil Temperature

Figure 2 shows the vertical distribution of soil temperature under different water treatments. Under watermelon cultivation, there were significant differences in soil temperature at a 0–25 cm depth under different water treatments. S4, S5, and BGS had significantly higher soil temperatures at a 25 cm depth compared to S3, indicating that lower soil moisture content led to higher soil temperature, with soil temperature having increased by approximately 0.27 °C for every 1% decrease in soil moisture content. There was no significant difference in soil temperature between S1, S2, and S3, suggesting that soil temperature differences were not pronounced when soil moisture content was high. The soil temperature at the depths of 5 cm and 20 cm under fallow mode (29.64 °C, 27.08 °C) was significantly higher than under cultivation mode (27.44 °C, 26.05 °C), indicating that fallowness could significantly increase soil temperature, with increases of 8.02% and 3.17% at 5 cm and 20 cm, respectively.
Table 2 shows the descriptive statistical characteristics of soil temperature under various treatments. The range and coefficient of variation of soil temperature tended to decrease with increasing soil depth, indicating that the variation in soil temperature decreased as soil depth increased. The minimum soil temperature increased with soil depth. The range of soil temperature in the 0–25 cm layer varied significantly under different soil moisture conditions. When the soil moisture was higher (16.5%), the range of soil temperature was smaller (10~22.1 °C); when it was lower (13.41%), the range of soil temperature was larger (11.8~24.6 °C). At the same time, the minimum soil temperature increased with increasing soil moisture, whereas the maximum temperature decreased. Therefore, the range of soil temperature decreased with increasing soil moisture.

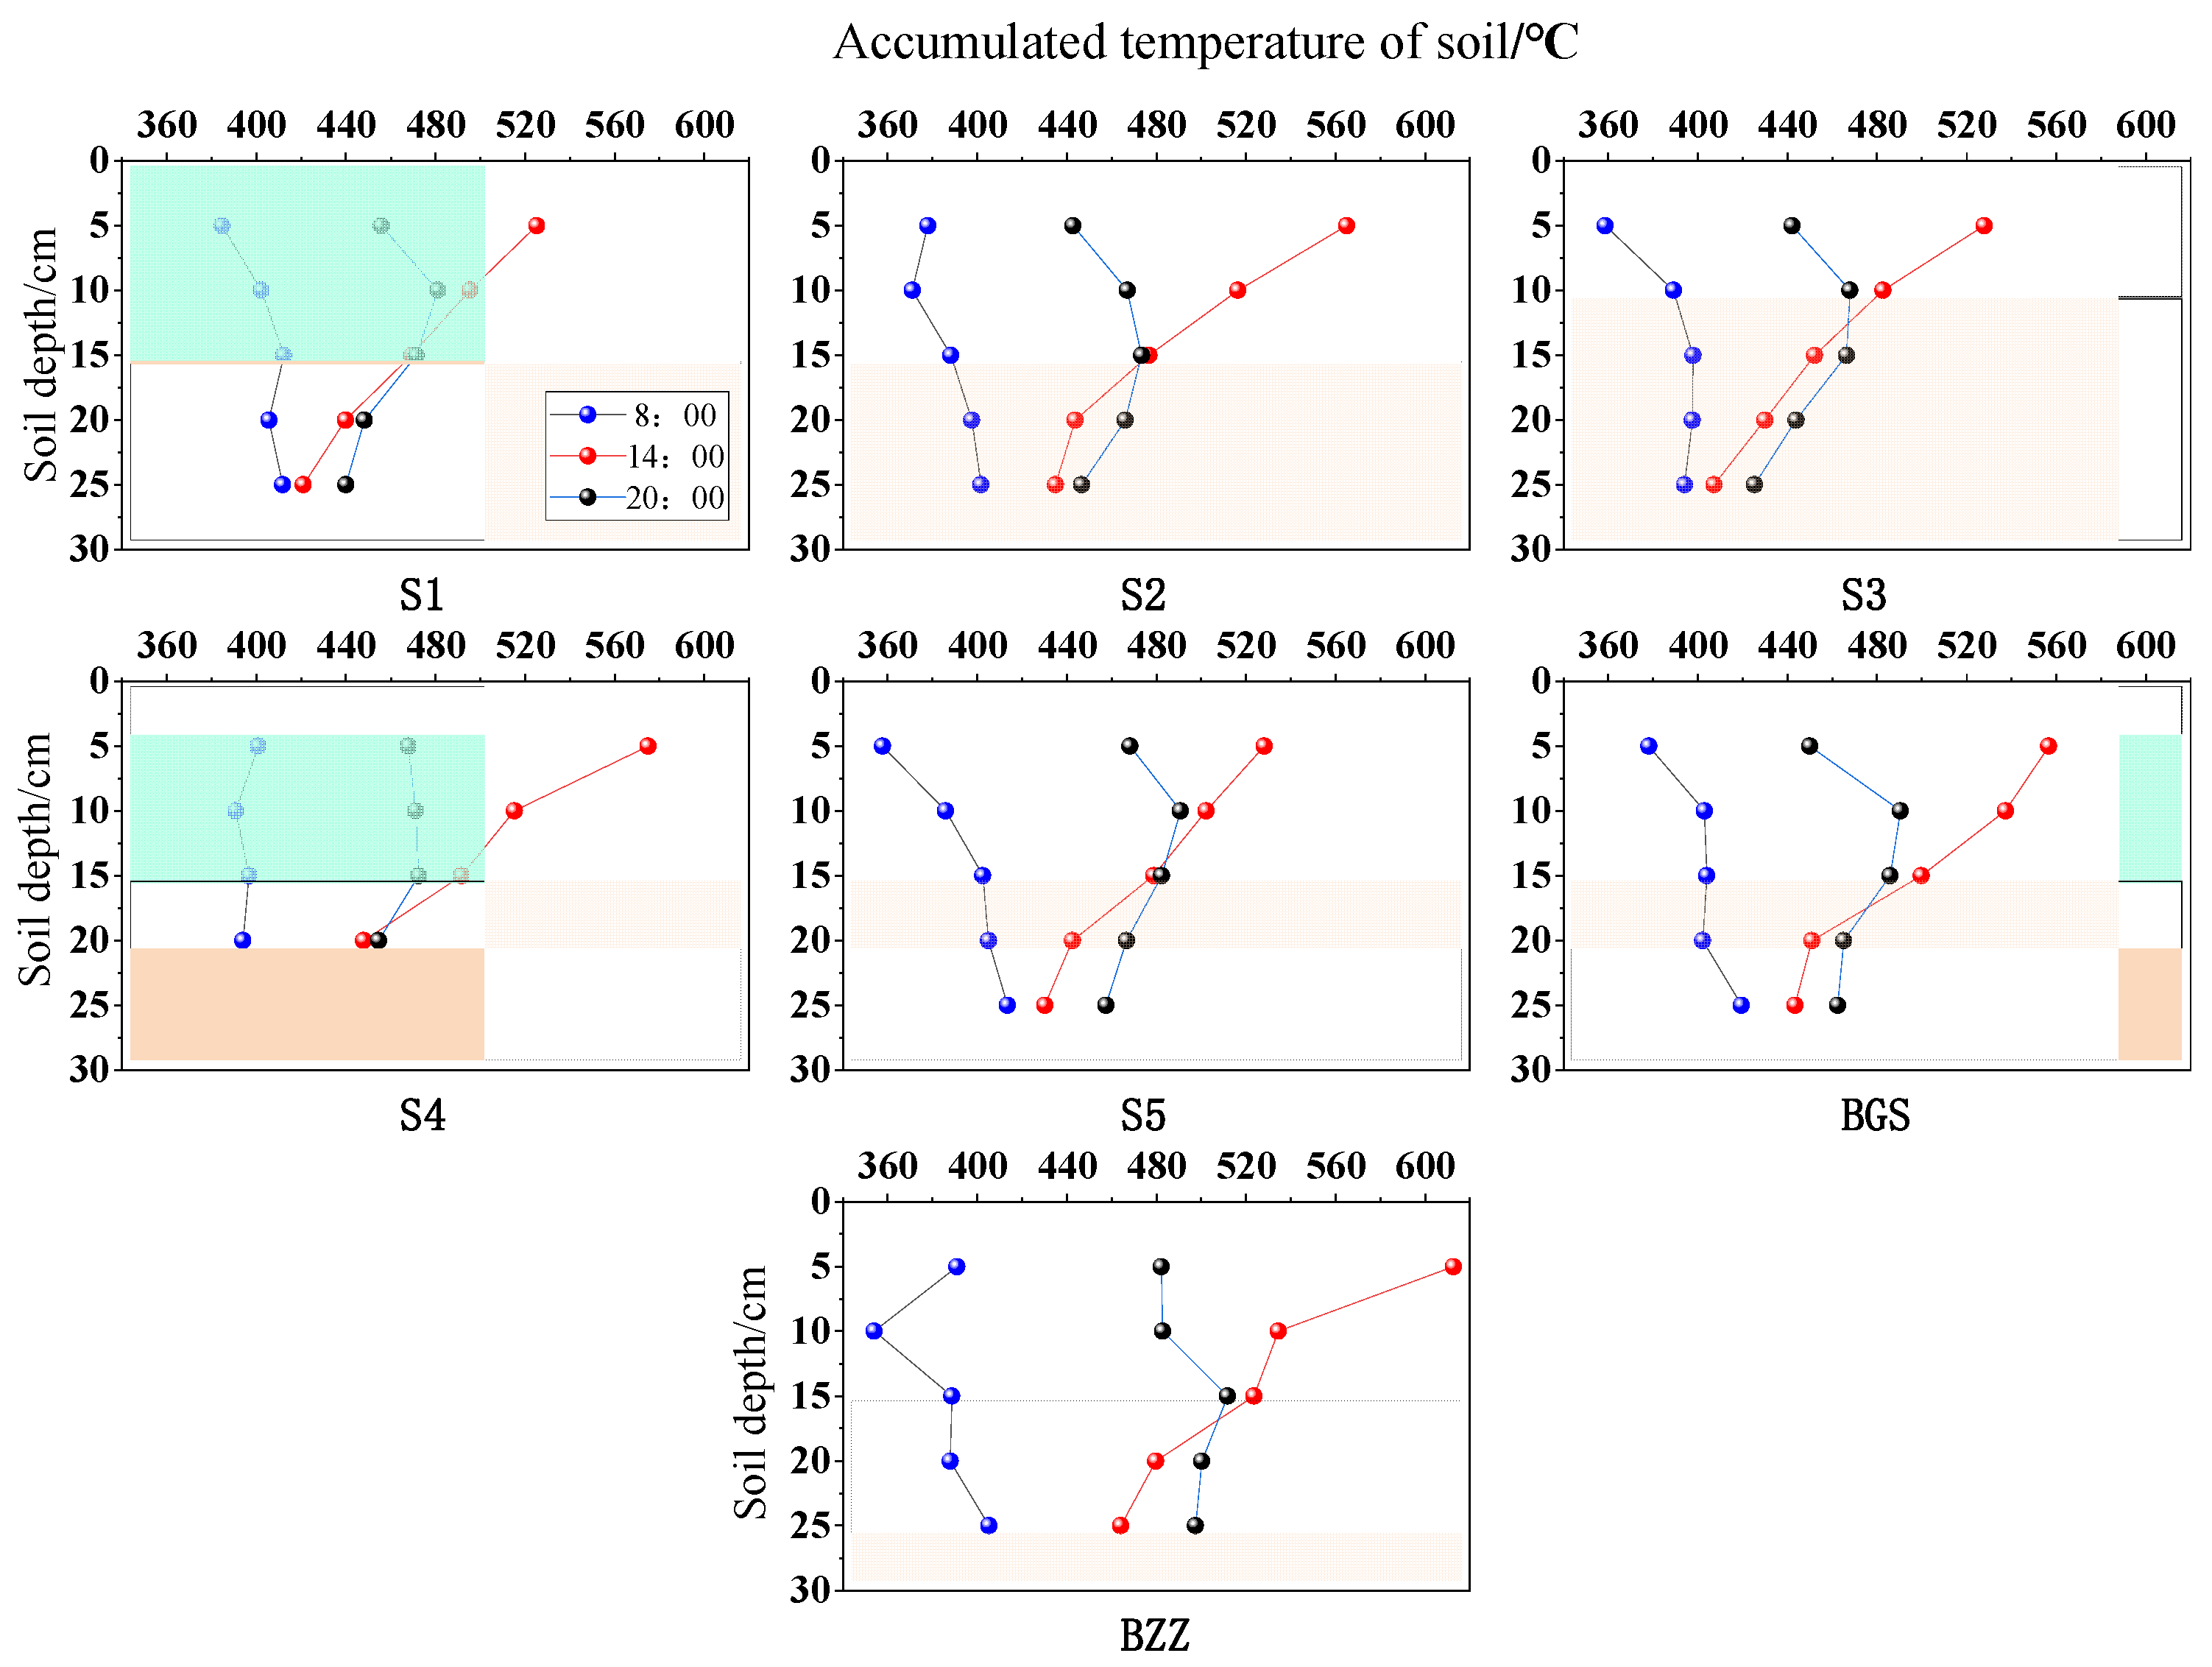
3.3. Soil Accumulated Temperature

The vertical distribution of soil accumulated temperature for each treatment is shown in Figure 3. The distribution of accumulated temperature for each treatment showed a similar trend, with the soil accumulated temperature at 8:00 being the smallest. At 14:00, the soil accumulated temperature in the 0–15 cm layer was greater than at 20:00, while in the 15–25 cm layer, the soil accumulated temperature at 14:00 was less than at 20:00. The soil accumulated temperature at 14:00 decreased with increasing soil depth.
The relationship between the average soil accumulated temperature and the soil moisture content in the 0–20 cm layer is shown in Figure 4. The relationship between soil accumulated temperature and soil moisture content is Y = −5.97 X + 1027.06 (p < 0.05, R2 = 0.83), indicating that this value was a good representative, which shows that the model can explain the change in dependent variables well and has a good fit. This fitting equation reached a significant level, indicating that soil accumulated temperature tends to decrease linearly with the increase in soil moisture content.
Through analyzing the relationship between soil thermal conductivity and soil moisture content in different soil layers, as shown in Figure 5, it can be seen that there was a very significant positive linear correlation between soil thermal conductivity in the 10–15 cm layer and soil moisture content in the 20–40 cm layer. The fitted linear regression equation is Y = −0.04 + 0.003X (p = 0.01, R2 = 0.538), indicating that the soil thermal conductivity in the 10–15 cm layer tended to increase with the increase in soil moisture content in the 20–40 cm layer under soil gravel–sand mulching conditions.

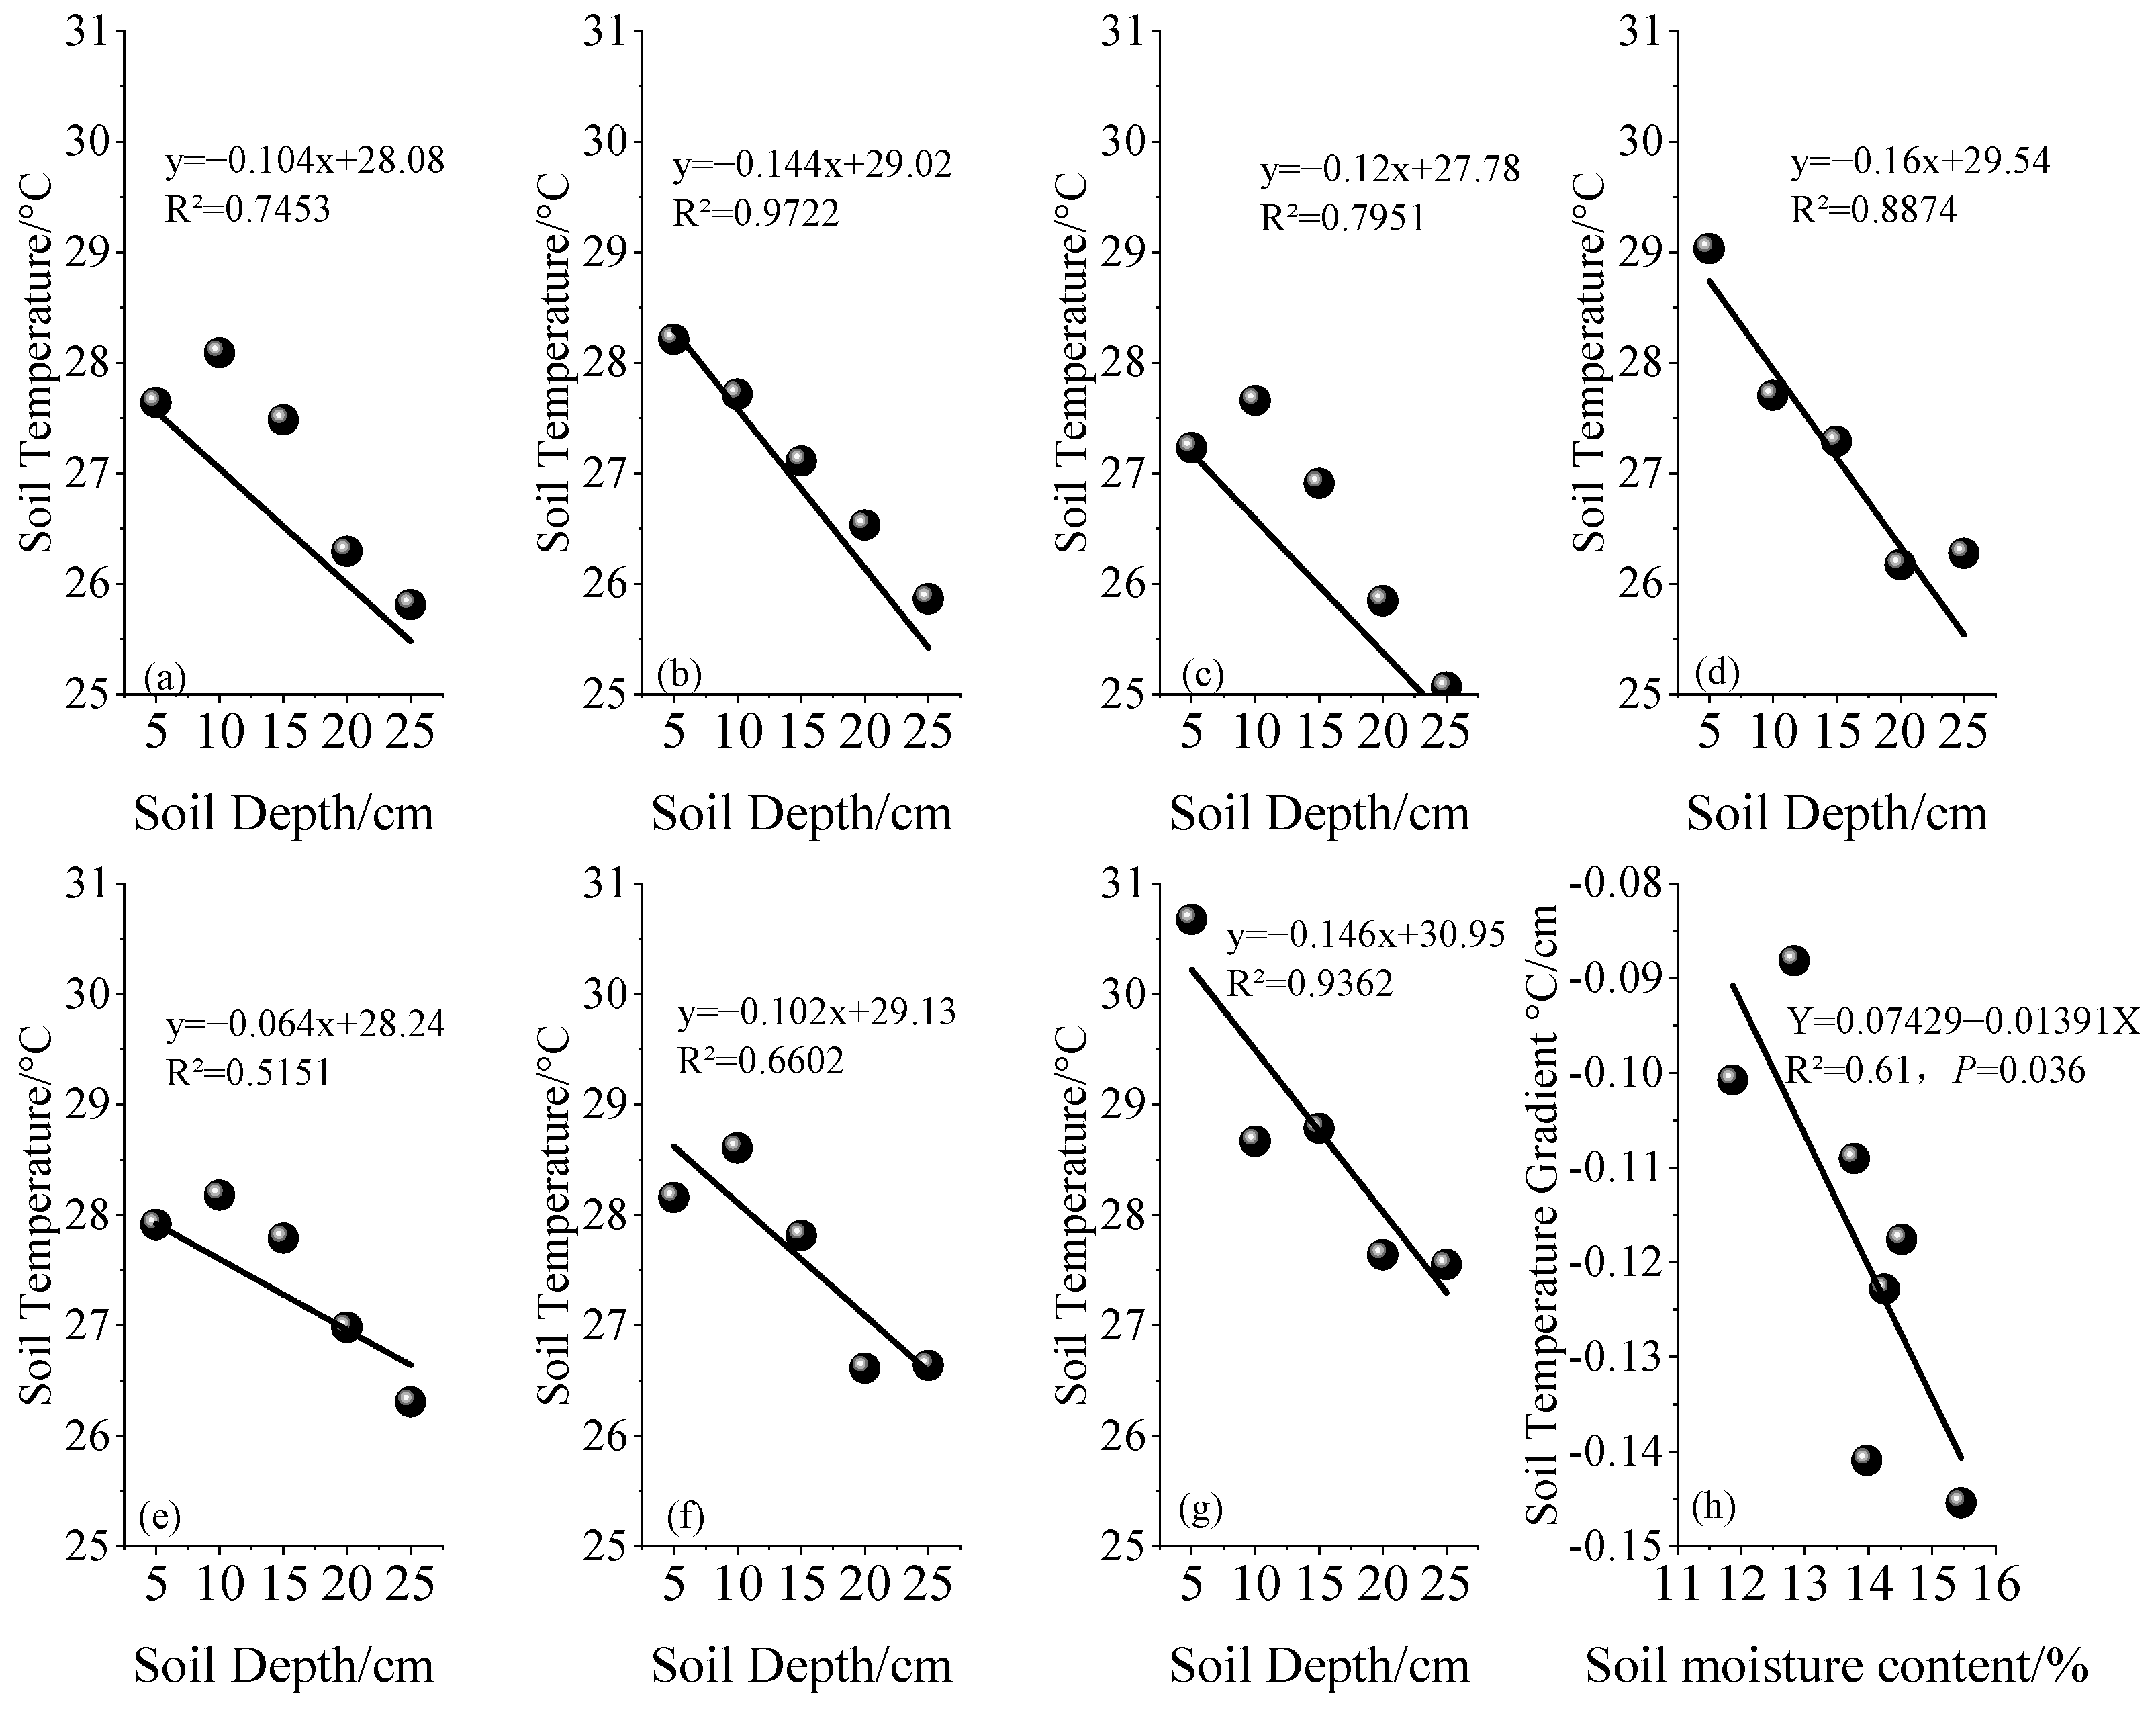
3.4. Characteristics of Soil Temperature Variation with Soil Depth

Figure 6 shows the variation in average soil temperature with depth under different soil moisture conditions. With soil temperature as the dependent variable and soil depth as the independent variable, regression analysis indicated a negative correlation between soil temperature and soil depth under different moisture conditions. The order of the coefficient of determination R2 was S2 > BZZ > S4 > S3 > S1 > BGS > S5, ranging from 0.51 to 0.97. In this linear relationship, the slope represents the rate of change in soil temperature with soil depth. The fitted regression equation for the rate of change in soil temperature and soil moisture content was Y = 0.07429 − 0.01391X (R2 = 0.61, p = 0.036), indicating that the rate of change in soil temperature increased with the increase in soil moisture content.

3.5. Relationship Between Soil Temperature and Soil Moisture Content

Figure 7 shows a correlation graph between soil temperature and soil moisture content. Under conditions of soil covered with sand, the correlation between soil temperature at 0–25 cm depth and soil moisture content at 20–40 cm depth was the best, showing a negative correlation. The correlations between soil temperature at 5, 10, 15, 20, and 25 cm depth and soil moisture content at 20–40 cm depth were −0.34, −0.58, −0.5, −0.52, and −0.47, respectively. Except for 5 cm (p < 0.05), all correlations passed the significance test at the 0.01 level. Secondly, the soil temperature at 10, 15, 20, and 25 cm depth also had a good negative correlation with soil moisture content at 0–20 cm depth. The soil layers at 10, 15 cm and 20, 25 cm depth passed the significance tests at the 0.01 and 0.05 levels, respectively. The relationship between soil temperature and soil moisture content below 40 cm depth gradually weakened with increasing depth.

3.6. Relationship Between Soil Temperature and Meteorological Factors

The heatmap in Figure 8 shows the correlation between soil temperature and meteorological elements. Under conditions of soil covered with sand, the soil temperature at various depths of 0–25 cm was extremely significantly positively correlated (p < 0.01) with average temperature, maximum temperature, minimum temperature, evaporation, vapor pressure, and wind speed, with correlation coefficients ranging from 0.58 to 0.61, 0.59 to 0.63, 0.58 to 0.62, 0.44 to 0.53, 0.59 to 0.62, and 0.45 to 0.50, respectively. Soil temperature also showed a significant (p < 0.05) positive correlation with sunshine duration, with a correlation coefficient of 0.35 to 0.42. However, there was an extremely significant (p < 0.01) negative correlation between soil temperature and air pressure, with correlation coefficients ranging from −0.59 to −0.47. Under conditions soil covered with sand, there was no significant correlation between soil temperature and air humidity at a depth of 0–25 cm.

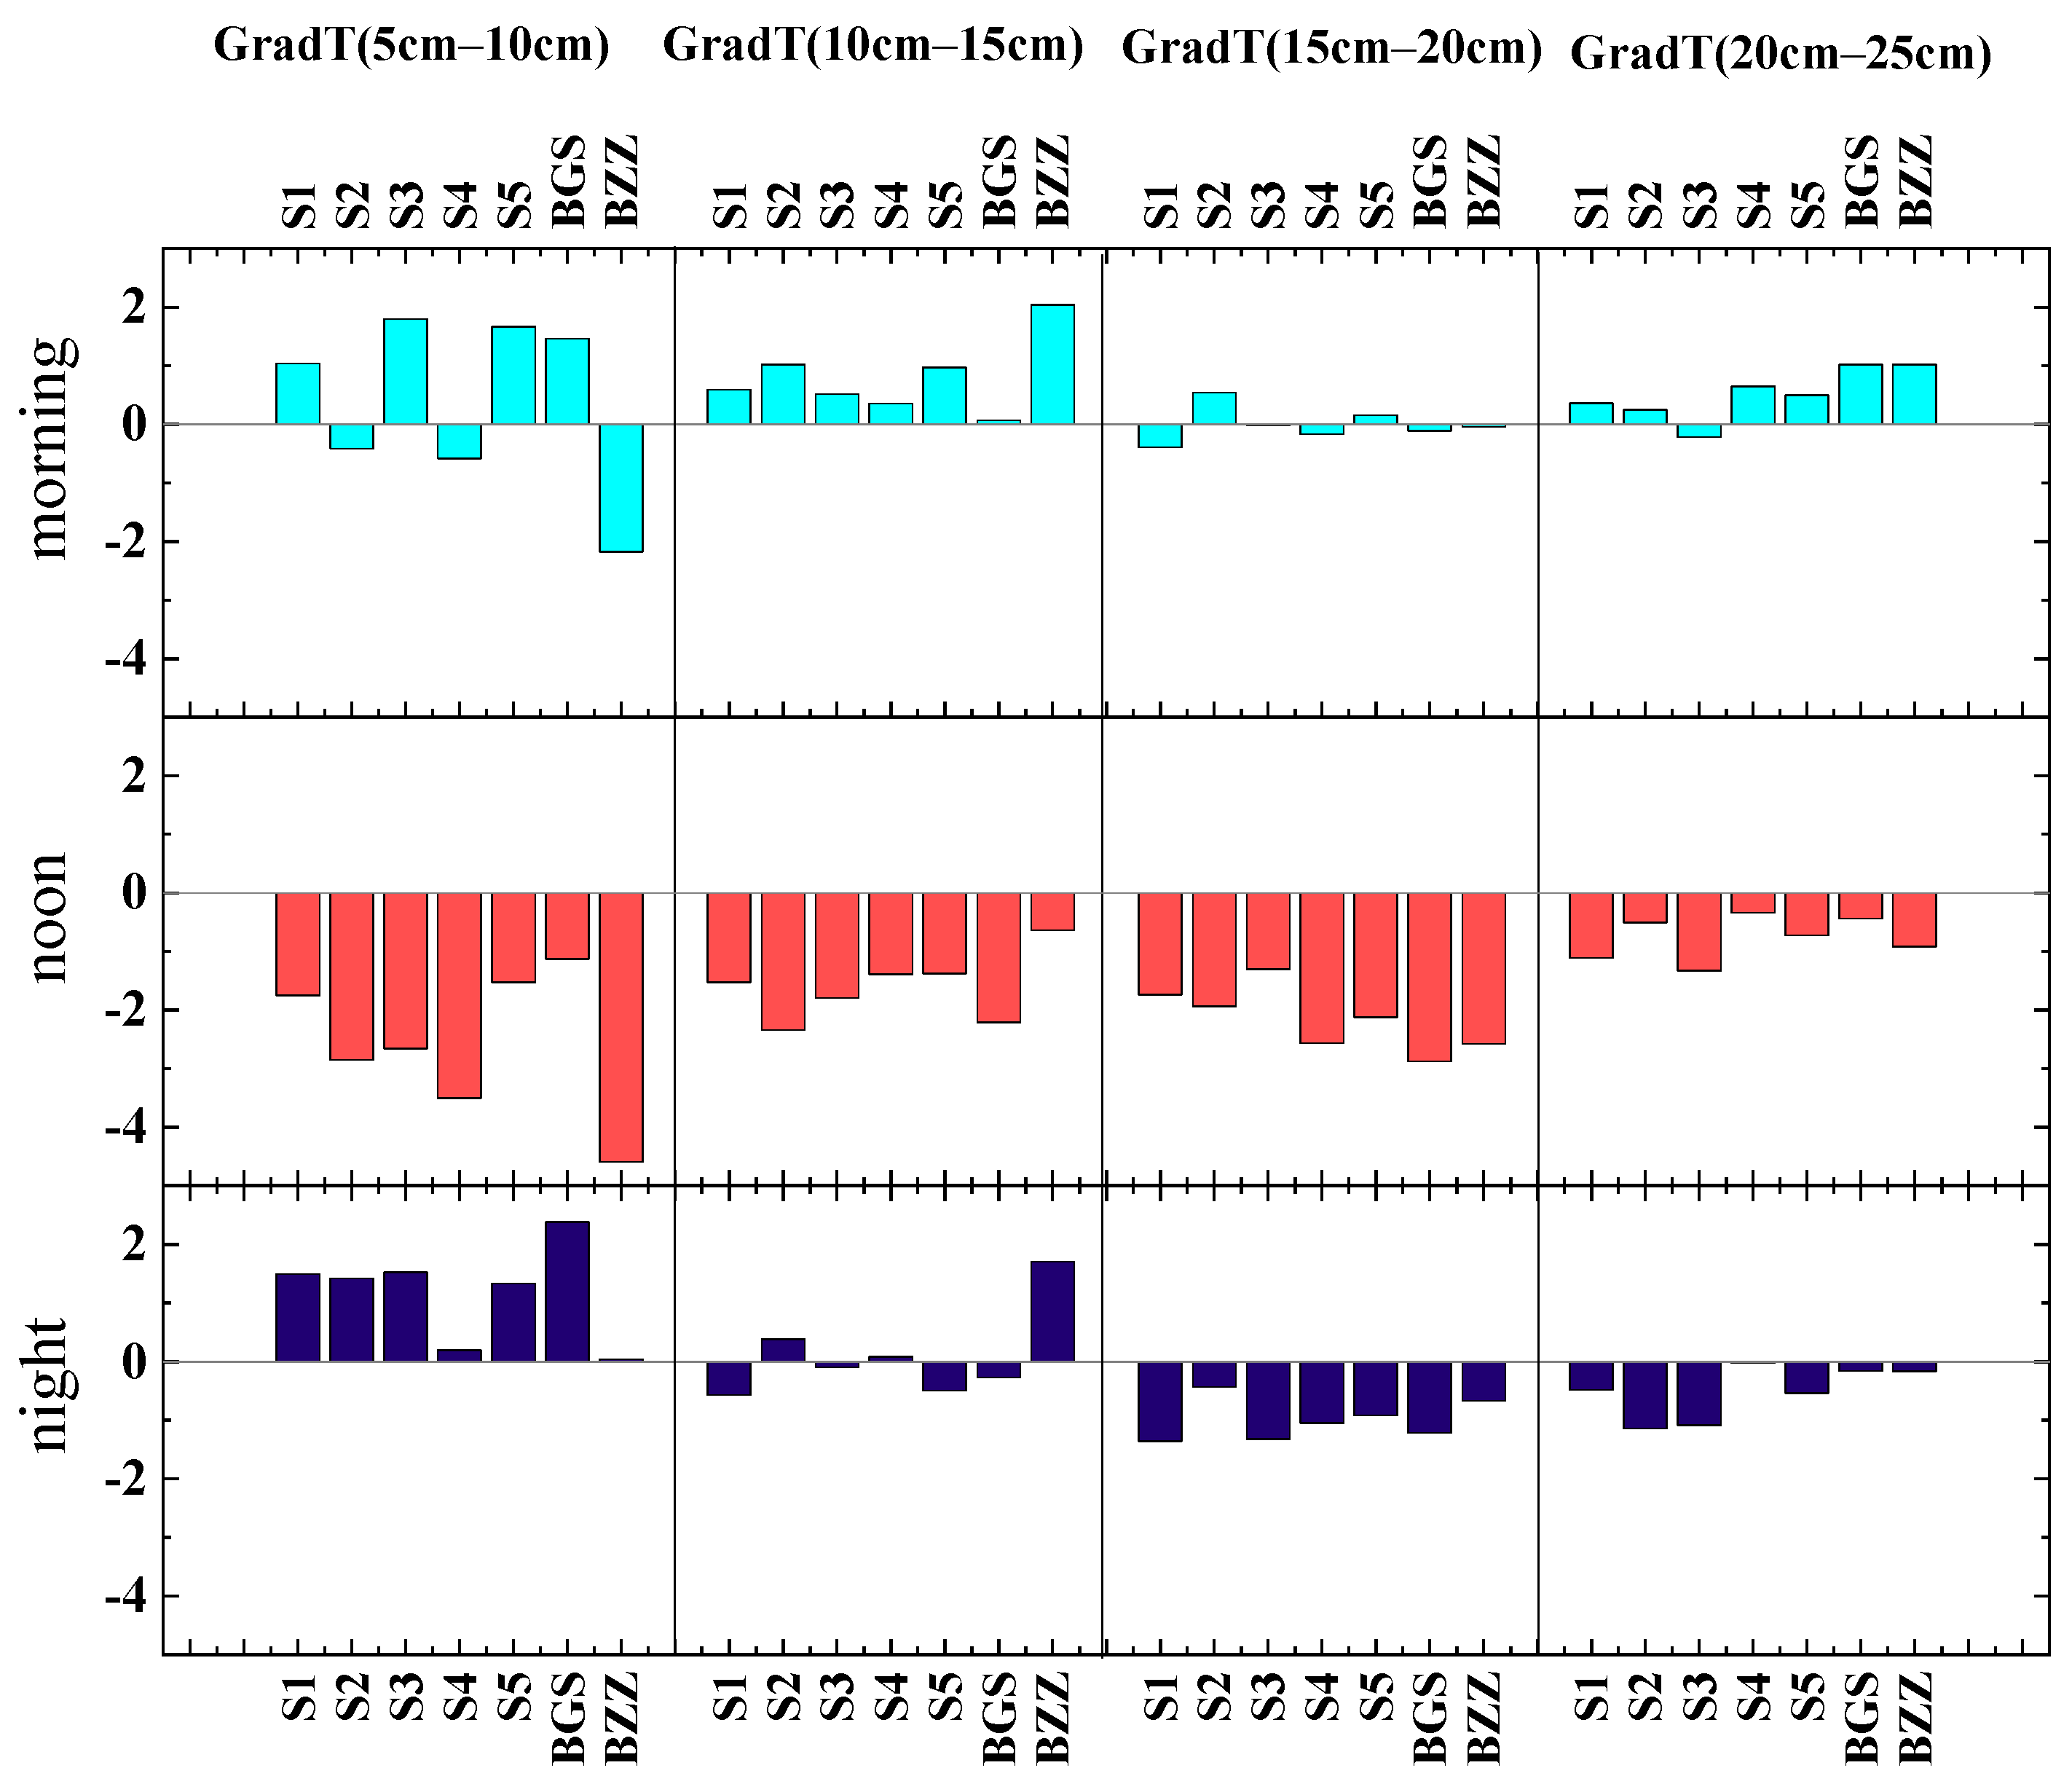
3.7. Soil Temperature Gradient

Figure 9 shows the soil temperature gradients for different water treatments in the vertical direction during the morning, noon, and evening. The soil temperature gradients for each treatment during the morning and evening had both positive and negative values, indicating inconsistent directions of heat conduction. The soil temperature gradient values at noon were greater than those in the morning and evening, but the direction of heat transfer was consistently downward. Moreover, the magnitude of the soil temperature gradient in each soil layer at noon decreased gradually with increasing soil depth, while the direction of soil temperature transfer during the morning was almost entirely upward. During the evening, the soil temperature gradients in the 5–10 cm layer were all positive, and all values were negative below 15 cm. The 10–15 cm soil layer was in a transitional phase approaching zero, with no significant heat transfer. It demonstrated that the soil temperature increased in the vertical direction from 5 cm to 10 cm, maintained the temperature and higher temperature from 10 cm to 15 cm, and gradually decreased the soil temperature below 15 cm. There was heat transfer from the 10–15 cm layer to the upper 5–10 cm and to the soil layers below 15 cm. The 10–15 cm layer near the surface had stable heat storage. Thus, 10–15 cm was identified as a buffer layer for soil heat transfer.

3.8. Relationships Among Soil Temperature, Soil Moisture Content, and the Ratio of Actual to Reference Evapotranspiration (ETa/ET0)

Reference evapotranspiration (ET0) reflects the comprehensive impact of meteorological factors, whereas actual evapotranspiration (ETa) is the result of the combined effects of soil moisture supply and meteorological factors. Therefore, the ratio of actual to reference evapotranspiration indicates the comprehensive meteorological index. Establishing the relationship between soil temperature and this ratio as well as soil moisture content (Figure 10) reveals the influence patterns of meteorological factors and soil moisture content, as well as their influence on soil temperature. By establishing a binary regression equation between soil temperature (ST) and the ratio of actual to reference evapotranspiration (ETa/ET0), and soil moisture content (SW), the equation is as follows: ST = 0.099 + 0.92 (ETa/ET0) − 0.66 (SW) − 5.7 (ETa/ET0 − 0.58) (SW − 0.54), with a root mean square error of 0.19 and R2 = 0.92. This regression equation indicates that soil temperature is positively correlated with ETa/ET0 but negatively correlated with soil moisture content and the interaction term between soil moisture content and ETa/ET0. From the coefficients, it is evident that the coefficients for soil moisture content and meteorological factors were larger, and the coefficient for the interaction term between soil moisture content and ETa/ET0 was the largest. This suggests that soil moisture content and the effects of meteorological factors jointly influence soil temperature through pathways such as crop water consumption. As shown in Figure 10, when soil moisture content is high, soil temperature decreases with an increase in ETa/ET0; when soil moisture content is moderate, soil temperature first rises and then falls with an increase in ETa/ET0; and when soil moisture content is low, soil temperature increases with an increase in ETa/ET0.

4. Discussion

4.1. Relationship Between Soil Water and Heat Under Gravel–Sand Mulching Conditions

Compared to soil, the gravel–sand mulching layer contains a large number of pores and has poor thermal conductivity, acting as an insulation layer to reduce the influence of air temperature on the temperature of the underlying soil, thereby reducing the coefficient of variation and the maximum diurnal temperature range of the soil temperature [2]. This study found that the minimum soil temperature under gravel–sand mulching conditions increases with the increase in soil moisture content, while the maximum soil temperature decreases; thus, increasing soil moisture content can reduce the amplitude of soil temperature variation. The results of this study also show that the soil cumulative temperature at 8:00 is the smallest, the soil cumulative temperature at 14:00 in the 0–15 cm layer is greater than that at 20:00, and in the 15–25 cm layer, it is less than that at 20:00. The 15 cm depth is a boundary line for soil temperature in the vertical direction, and the soil temperature under gravel–sand mulching conditions is relatively stable around 15 cm. The rate of change in soil temperature under gravel–sand mulching conditions increases with the increase in soil moisture content, possibly because under gravel–sand mulching conditions, the gravel–sand mulching layer absorbs external heat and the temperature of the gravel–sand mulching layer increases, and a higher soil moisture content accelerates the transfer of heat. Within the 0–20 cm soil layer, the higher soil moisture content under gravel–sand mulching conditions promotes the conduction of soil heat in the vertical direction. In addition, there is a significant negative correlation between soil temperature and soil moisture content in the 20–40 cm layer. Fallow sites without planting on gravel–sand mulching land can significantly increase soil moisture content, with an increase of up to 10.98%, providing good subsoil moisture conditions for the cultivation of watermelons in the following year. At the same time, fallow sites can significantly increase soil temperature, and higher soil temperature can accelerate the decomposition of soil organic matter [23,24], increasing the release of nutrients, thereby improving soil fertility. This may be one of the main reasons why fallow sites on gravel–sand mulching land promote crop growth in the following year.
On one hand, gravel–sand mulching maintains a higher soil moisture content, thereby increasing the thermal capacity of the soil which, in turn, reduces soil temperature. The results of this study also confirm the hypothesis that increasing soil moisture content reduces soil temperature. On the other hand, gravel–sand mulching on the soil surface reduces soil moisture evaporation, and soil moisture evaporation is an energy-consuming process, which also means that gravel–sand mulching can reduce energy consumption and thus increase soil temperature. Therefore, soil gravel–sand mulching has the effect of both reducing soil temperature due to increased soil moisture content and increasing temperature due to reduced moisture evaporation. How do these two conflicting effects affect the soil temperature of gravel–sand mulching land? The results of this study found that when soil moisture content is high, soil temperature decreases with the increase in ETa/ET0; when soil moisture content is moderate, soil temperature first increases and then decreases with the increase in ETa/ET0; when soil moisture content is low, soil temperature increases with the increase in ETa/ET0. The reason may be that when soil moisture content is high, the increase in atmospheric evaporation capacity will lead to a large amount of soil moisture evaporation and loss, thereby removing a large amount of heat, causing the soil temperature to decrease. When the soil moisture condition is poor, the effect of meteorological factors becomes dominant, thereby increasing soil temperature.

4.2. Relationship Between Meteorological Elements and Soil Temperature Under Gravel–Sand Mulching Conditions

Under the same solar radiation, the daily variation in soil temperature increases with the decrease in soil moisture content; this is because when soil moisture content is low, soil thermal conductivity and soil heat capacity are smaller, and soil temperature is more sensitive to atmospheric temperature; by contrast, when soil moisture content is high, heat capacity and thermal conductivity are larger, and its response to air temperature is slower [25]. This study found that under soil gravel–sand mulching conditions, soil temperature in each soil layer of 0–25 cm is extremely significantly (p < 0.01) positively correlated with average temperature, maximum temperature, minimum temperature, evaporation, vapor pressure, wind speed, etc. The results of Liu Shiling et al. [16,26,27] revealed that the main meteorological element affecting soil temperature under bare soil conditions is atmospheric temperature, but this study found that under soil gravel–sand mulching conditions, the main meteorological element affecting soil temperature in addition to air temperature is vapor pressure, and soil temperature increases with the increase in vapor pressure. The gravel–sand mulching layer weakens the direct connection between soil temperature and atmospheric temperature, and the evaporation of soil moisture on the gravel–sand mulching land mainly relies on the form of water vapor passing through the sand layer; therefore, the increase in vapor pressure reduces the evaporation of water and thus reduces energy consumption and increases soil temperature.

4.3. Characteristics of Soil Thermal Conductivity and Temperature Gradient Under Gravel–Sand Mulching Conditions

Under gravel–sand mulching conditions, soil heat conduction has obvious differences among various soil layers, and the soil temperature gradient is a physical quantity that measures the direction and intensity of heat transfer in the vertical direction of the soil [28], which can reflect the step-like [29] decrease or increase in soil temperature within the unit soil depth [30], and the change in temperature gradient has a profound impact on crop growth and development [31]. The results of this study show that the direction of heat transfer in early morning soil heat conduction is from below to the surface, which is related to the lower soil temperature of the surface in the early morning. At noon, the situation is as follows: the closer to the surface, the greater the soil temperature gradient value, and the faster the change in soil temperature; and the direction of soil heat conduction in each soil layer is downward, indicating that the soil is in a state of receiving heat at this time. At night, the 10–15 cm soil layer transfers heat to the upper 5–10 cm and lower 15 cm soil layers, which may be related to the absorption of heat by the 5–10 cm soil layer throughout the day and the conduction to the adjacent 10–15 cm soil layer. The decrease in surface temperature caused by the decrease in evening temperature confirms this analysis; the 10–15 cm soil layer has temporary heat storage.
Soil thermal conductivity is also an important parameter of soil thermal properties, which varies significantly due to differences in region and vegetation. This study found that under gravel–sand mulching conditions, the soil thermal conductivity of the 10–15 cm layer increases with the increase in soil moisture content in the 20–40 cm layer, and the increase in soil moisture content is beneficial for promoting soil temperature transfer and eliminating temperature differences between various soil layers. Related studies have shown that the higher the soil moisture content, the greater the thermal diffusivity [32,33], which also confirms the findings of this study. To further investigate soil thermal conductivity, a large number of laboratory and field experiments are needed. Soil thermal properties also include other important parameters that require further experimental research [34,35]. The influence of soil water and plant roots on the heat conduction–convection equation is the future research direction of soil temperature [36], and the study of soil temperature characteristics needs to be combined with the hysteresis of soil temperature and the dynamic characteristics of soil temperature.

5. Conclusions

(1)
In the 0–25 cm soil layer under gravel–sand mulching conditions, the soil accumulated temperature is the lowest at 8:00; within the 0–15 cm range, the soil accumulated temperature at 14:00 is greater than at 20:00; and within the 15–25 cm range, the soil accumulated temperature at 14:00 is less than at 20:00.
(2)
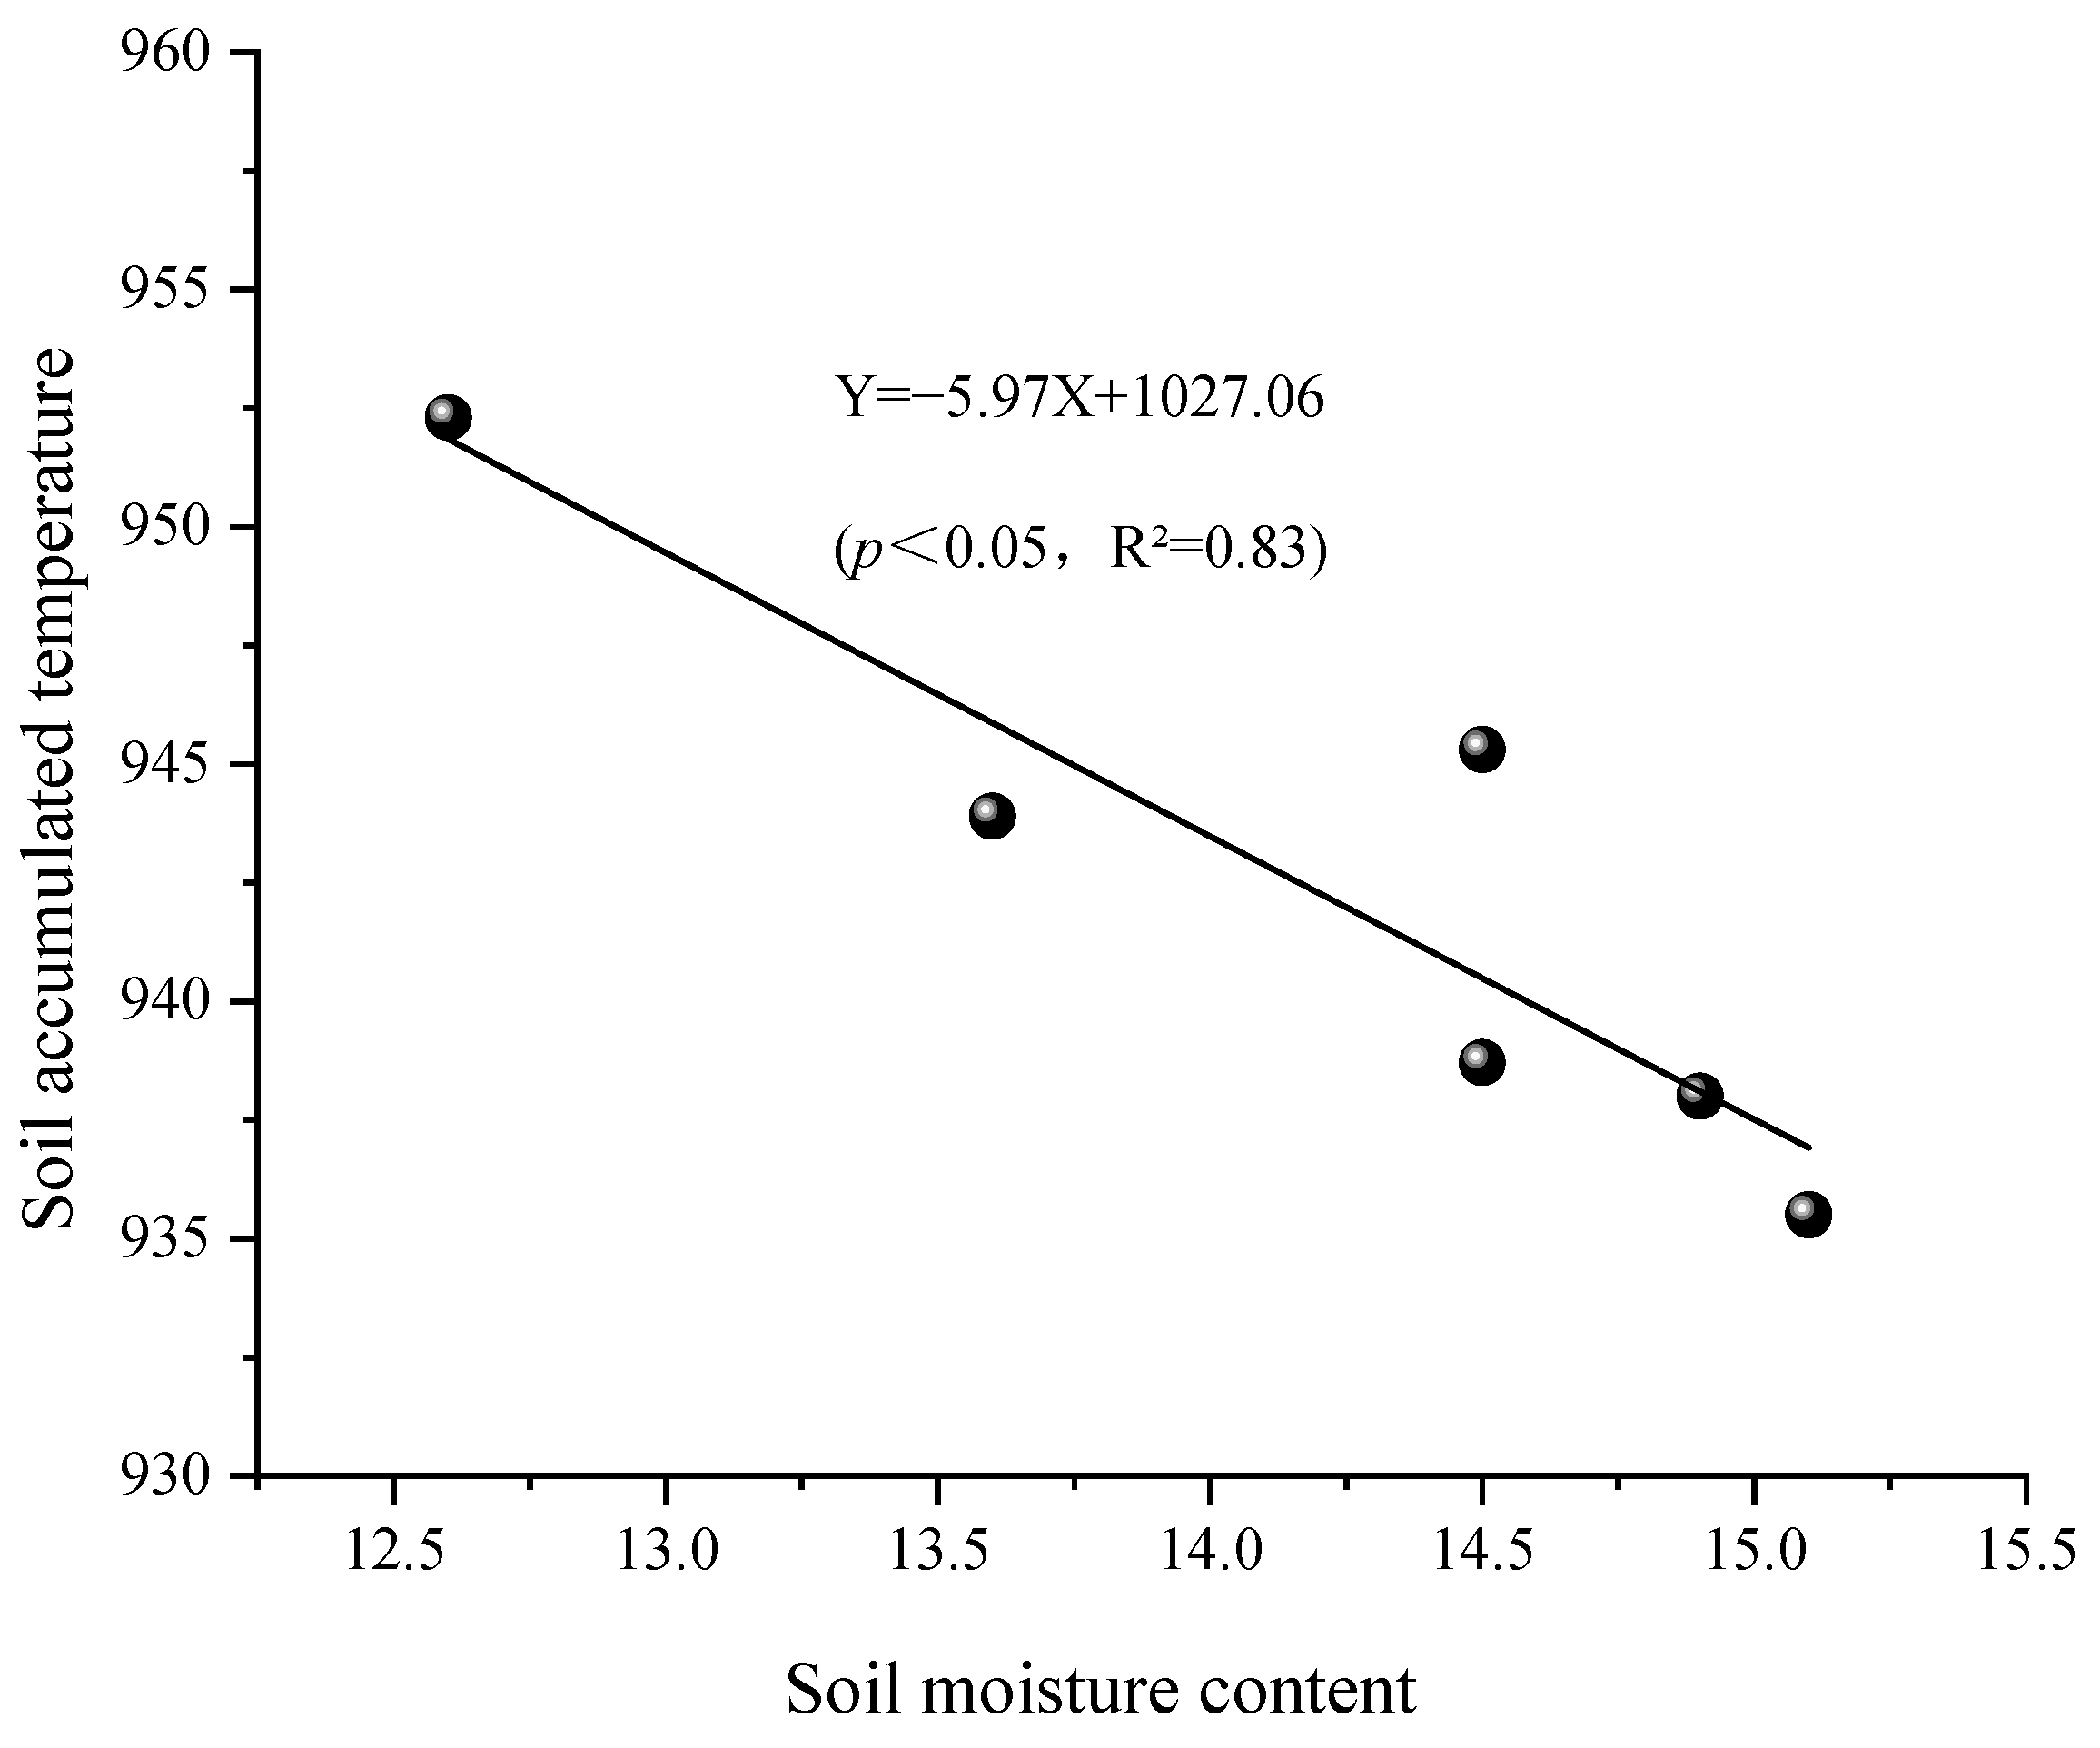
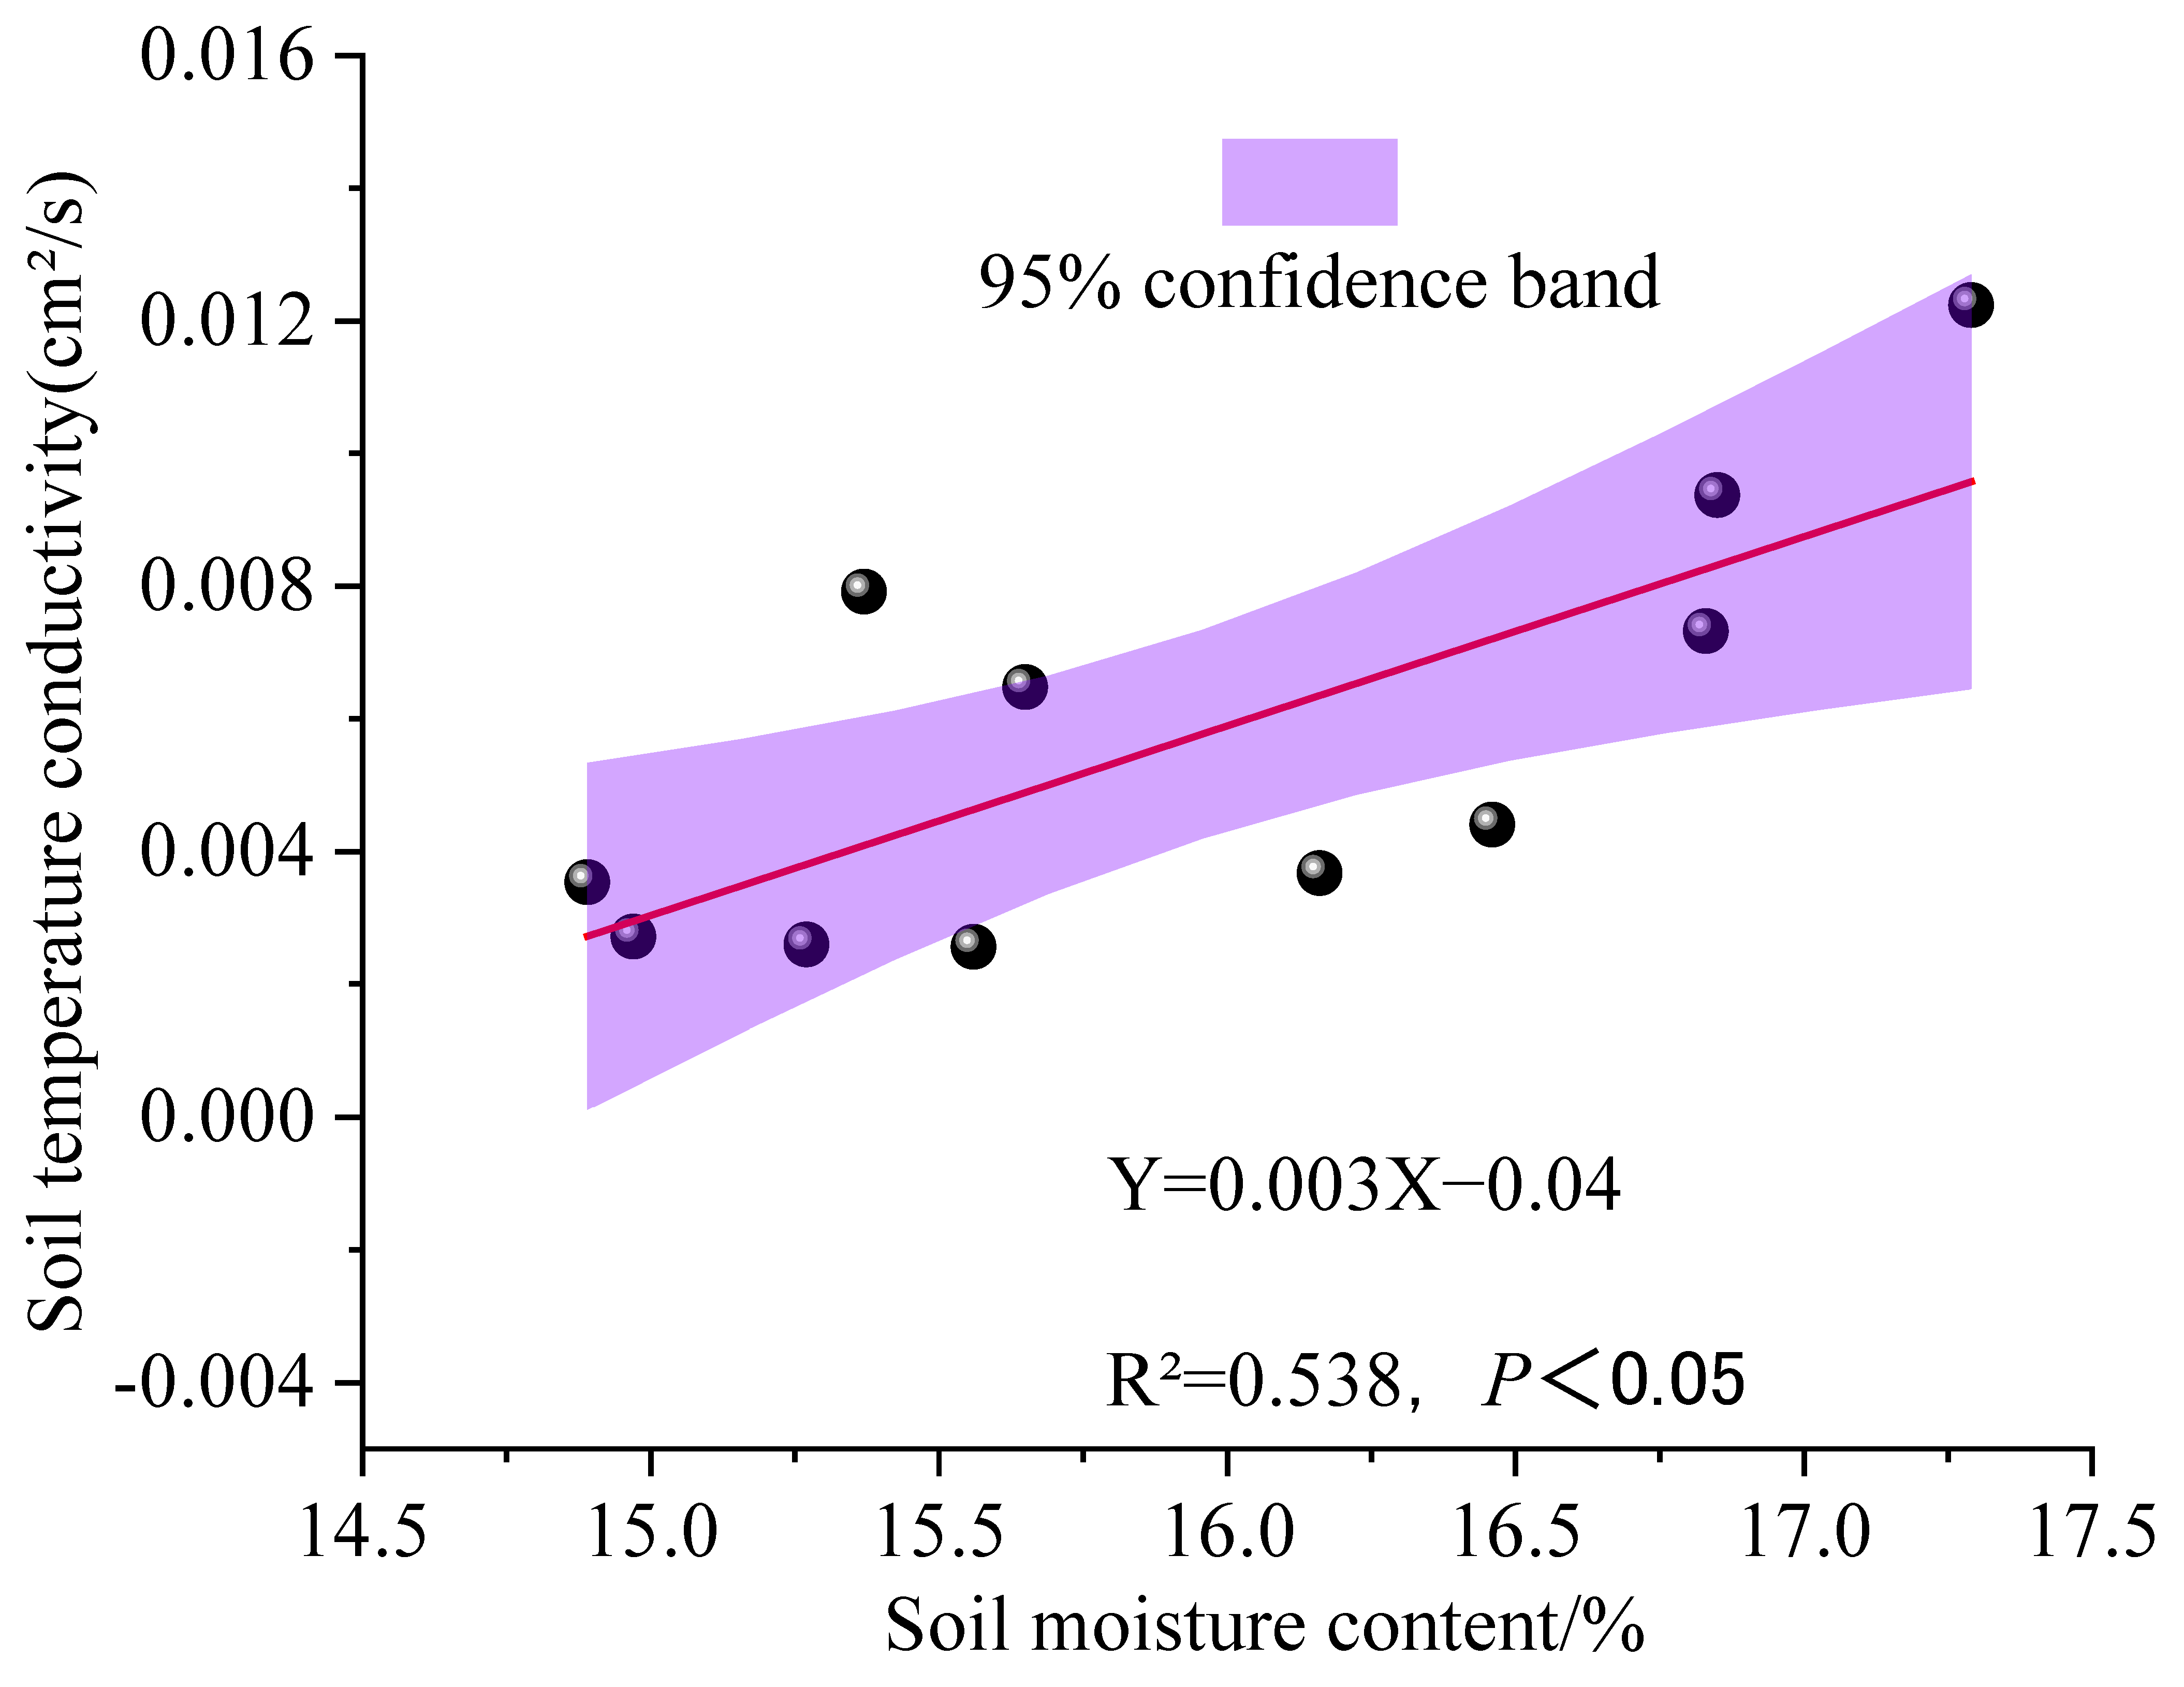
Within the 0–20 cm soil layer, the soil accumulated temperature tends to decrease with an increase in soil moisture content under gravel–sand mulching conditions but increases the rate of soil temperature variation. The soil thermal conductivity at a 10–15 cm depth under gravel–sand mulching conditions tends to increase with the increase in soil moisture content at a 20–40 cm depth, and the increase in the lower soil moisture content is beneficial for promoting the transfer of temperature in the upper soil layers and eliminating the temperature differences between soil layers.
(3)
Under gravel–sand mulching conditions, meteorological factors such as air temperature, evaporation, vapor pressure, and wind speed accelerate the thermal convection process of heat conduction in the atmosphere, and the key meteorological factors affecting soil temperature are air temperature and vapor pressure.
(4)
The 10–15 cm layer of soil heat is relatively stable and is the key buffer layer and heat storage pool for soil heat.

Author Contributions

Methodology, J.T. (Juncang Tian); Investigation, H.L.; Resources, J.T. (Juncang Tian); Data curation, Q.S.; Writing—original draft, G.H.; Writing—review & editing, J.T. (Junli Tan); Supervision, X.W. All authors have read and agreed to the published version of the manuscript.

Funding

This research was funded by The National Natural Science Foundation of China (52369010); Ningxia Natural Science Foundation project (2022AAC02013); Ningxia university first-class discipline construction (water conservancy project) project (NXYLXK2021A03). This APC is a personal contribution.

Data Availability Statement

The original contributions presented in the study are included in the article, further inquiries can be directed to the corresponding author.

Conflicts of Interest

The authors declare no conflict of interest.

References

  1. Yu, W. Study on the Influence of Sand Mulching on Soil Moisture and Temperature Regularities. Master’s Thesis, Lanzhou University of Technology, Lanzhou, China, 2016. [Google Scholar]
  2. Liu, Q.; Li, W.; Zhao, G.; Jia, Z.; An, W.; Wang, J.; Mu, M. Effects of Gravel-sand Mulching and Irrigation Amount on Soil Water and Heat and Jujube Fruit Yield in Converted Cropland. J. Agric. Resour. Environ. 2022, 39, 940–947. [Google Scholar]
  3. Di, Y.; Gao, M.F.; Li, Q.; You, J. Study on the Relationship Between Winter Wheat Canopy Temperature and Soil Moisture Under Different Irrigation Gradients. Chin. Agric. Inf. 2021, 33, 13–23. [Google Scholar]
  4. Cai, Z.; Duan, L.; Guo, R.; Liu, D. Characteristics of Soil Temperature Variation in Jiangxi Province and Its Relationship with Meteorological Elements. Chin. Agric. Sci. Bull. 2024, 40, 118–125. [Google Scholar]
  5. Wei, J. Temperature Sensitivity of Soil Organic Matter Decomposition in Forest Soils at Different Altitudes and Its Response to Exogenous Carbon Addition. Master’s Thesis, Anhui Agricultural University, Hefei, China, 2023. [Google Scholar]
  6. Zhang, Y.; Sun, X.; Guo, X. Study on Diurnal Variation Characteristics of Soil Temperature in Water Conservation Pits under Different Mulching Methods. Water-Sav. Irrig. 2013, 1, 1–5. [Google Scholar]
  7. Luo, C.; Wang, R.; Wang, L.; Xiong, C.; Wang, X.; Dai, H.; Wan, Q.; Xiao, W. Effects of Different Water and Heat Regulation Methods on Soil Temperature and Root Distribution in Apple-Soybean Intercropping System. J. Soil Water Conserv. 2023, 37, 217–226. [Google Scholar]
  8. Wang, P.; Yu, A.; Wang, Y.; Su, X.; Chai, J.; Li, Y.; Lv, H.; Shang, Y.; Yang, X. Effects of Post-wheat Green Manure Turning and Reduced Nitrogen Application on Soil Water and Heat Characteristics and Maize Yield. Acta Agron. Sin. 2023, 49, 2793–2805. [Google Scholar]
  9. Xin, J.; Gao, H.; Shao, M. Effects of Soil Temperature on Soil Water Infiltration. J. Soil Water Conserv. 2009, 23, 217–220. [Google Scholar]
  10. Zhao, J.; Hong, M.; Ma, Y.; Chen, K. Effects of Different Irrigation Treatments on Soil Temperature of Drip-irrigated Walnut Trees in Arid Areas. Res. Soil Water Conserv. 2019, 26, 327–333. [Google Scholar]
  11. Ma, Z.; Du, S.; Xue, L. Effects of Different Mulching Methods on Soil Water and Heat Effects and Watermelon Growth in Dry Sandy Fields. Acta Ecol. Sin. 2011, 31, 1295–1302. [Google Scholar]
  12. Sharmasarkar, F.C.; Sharmasarkar, S.; Miller, S.D.; Vance, G.F.; Zhang, R. Assessment of Drip and Flood Irrigation on Water and Fertilizer Use Efficiencies for Sugarbeets. Agric. Water Manag. 2001, 46, 241–251. [Google Scholar]
  13. Shen, X.; Zhang, X.; Yao, B.; Li, Q.; Xue, Z.; Dong, J.; Yi, R. Effects of Climate Change on Suitable Sowing Period for Drip-irrigated Peanuts under Mulch in Xinjiang. J. Agric. Eng. 2023, 39, 107–115. [Google Scholar]
  14. Zhang, T.; Bao, W.; Lei, Q.; Liu, X.; Du, X.; Zhou, J.; Luo, J.; Liu, H. Spatiotemporal Variation Characteristics of Soil Temperature in China from 1951 to 2010 and Its Influencing Factors. Acta Geogr. Sin. 2022, 77, 589–602. [Google Scholar]
  15. Liu, X. Study on the Characteristics and Influencing Factors of Soil Shallow Temperature Variation in Hohhot Area. For. Surv. Plan. 2023, 48, 46–51. [Google Scholar]
  16. Liu, Q.; Liu, X.; Wang, L.; Zhao, W.; Ma, J. Soil Water and Heat Characteristics of Alpine Meadow in the Middle Section of Qilian Mountains and Their Response to Meteorological Elements. J. Cent. South Univ. For. Technol. 2023, 43, 156–163. [Google Scholar] [CrossRef]
  17. Xu, Z.; Liu, S.; Li, X.; Xu, T.; Zhu, Z. 2012 Zhangye Oasis-Desert Region Water, Heat, and Carbon Flux and Meteorological Element Observation Matrix Dataset. China Sci. Data Chin. Engl. Online Ed. 2023, 8, 315–327. [Google Scholar]
  18. An, K.; Wang, Q.; Wang, W.; Wang, Z.; Chen, L.; Zhang, Z. Spatiotemporal Distribution Law of Soil Temperature in Unsaturated Zone of Arid Areas. South–North Water Transf. Water Sci. Technol. 2015, 13, 70–7383. [Google Scholar]
  19. Ariyanto, D.P.; Qudsi, Z.A.; Dewi, W.S. The Dynamic Effect of Air Temperature and Air Humidity Toward Soil Temperature in Various Lands Cover at Gunung Bromo, Karanganyar—Indonesia. IOP Conf. Ser. Earth Environ. Sci. 2021, 724, 12003. [Google Scholar] [CrossRef]
  20. Ren, T.; Jia, Z.; Wang, Z.; Lu, Y.; Liu, X. Characteristics of Soil Temperature Variation Under Plastic Film and Ground Cloth Mulching in Mu Us Desert. Agric. Res. Arid. Areas 2020, 38, 190–199+216. [Google Scholar]
  21. Tan, J.; Tian, J.; Wang, X.; Li, Y.; Zhao, X. Effects of Different Subsurface Moisture on Water Consumption Rules of Watermelon in Sand Mulching Fields. Agric. Res. Arid. Areas 2014, 32, 94–99. [Google Scholar]
  22. Tan, J.; Tian, J.; Wang, X.; Zhao, X. Effects of Subsurface Moisture on Growth and Yield of Watermelon in Sand Mulching Fields. Agric. Res. Arid. Areas 2012, 30, 26–31. [Google Scholar]
  23. Bai, H.; Huang, Y.; Li, L.; Cheng, H. Effects of Temperature and Different Organic Fertilizers on Soil Soluble Organic Matter Content. J. Mt. Agric. Biol. 2012, 31, 103–106. [Google Scholar]
  24. Yang, H.; He, N.; Li, S.; Yu, G.; Gao, Y.; Wang, R. Effects of Land Use Types on Temperature and Moisture Sensitivity of Soil Organic Matter Mineralization in Subtropical Regions of Southeast China. J. Resour. Ecol. 2016, 7, 85–91. [Google Scholar]
  25. Ren, Z.; Wang, Z.; Li, W.; Zhang, J.; Yang, W.; Jia, Z.; Li, N. Effects of Different Light Control and Irrigation Amounts on Soil Temperature Variation in Drip-irrigated Corn Fields. Acta Agric. Boreali-Occident. Sinica. J. 2019, 28, 961–971. [Google Scholar]
  26. Liu, S.; Yang, B.; Lu, L.; Zhang, P.; Lei, L. Soil Water and Heat Characteristics of Dasha Mountain in Guangxi and Their Response to Meteorological Elements. J. Cent. South Univ. For. Technol. 2018, 38, 46–52. [Google Scholar]
  27. Tang, Z.; He, Z.; Liu, H. Soil Water and Heat Characteristics of Forest-Grass Ecotone in the Middle Section of Qilian Mountains and Their Response to Meteorological Elements. Acta Ecol. Sin. 2012, 32, 52–61. [Google Scholar]
  28. Guo, Z.; Lu, Y. Diurnal Variation Law of Surface Soil Temperature. Agric. Technol. 2020, 40, 9–11. [Google Scholar]
  29. Ma, Z.; Wang, W.; Zhang, Z.; Zhao, M.; Chen, L.; Song, H.; Yu, P. Simulation Study on Diurnal Distribution Variation of Soil Water in Shallow Aerated Zone. J. Water Resour. Water Eng. 2019, 30, 245–251. [Google Scholar]
  30. Cheng, C. Study on Vertical Gradient Variation Characteristics of Secondary Oak Forest Temperature in Kongqing Mountain. Master’s Thesis, Nanjing Forestry University, Nanjing, China, 2017. [Google Scholar]
  31. Sun, L. Numerical Simulation of Soil Percolation and Pollutant Migration Under Temperature Gradient. Master’s Thesis, Yangzhou University, Yangzhou, China, 2015. [Google Scholar]
  32. Verhoef, A.; van den Hurk, B.; Jacobs, A.; Heusinkveld, B. Thermal soil properties for vineyard (EFEDA-I) and savanna (HAPEX-Sahel) sites. Agric. For. Meteorol. 1996, 78, 1–18. [Google Scholar]
  33. Su, Y. Numerical Simulation Study on Soil Heat in Sandy Land; Lanzhou University of Technology: Lanzhou, China, 2020. [Google Scholar]
  34. Jin, Z.; Wang, X.; Wu, X.; Peng, Y. Test and Analysis of Soil Thermal Parameters and Their Influencing Factors. Rock Soil Mech. 2022, 43, 1335–1340. [Google Scholar]
  35. Yang, K.; Zhao, B.; Nie, J.; Liu, H. Effects of Wheat Straw Biochar on the Thermophysical Properties of Calcic Soil in Farmland. J. Lanzhou Jiaotong Univ. 2024, 43, 108–113. [Google Scholar]
  36. Zhang, J.; Gao, Z.; Tong, B.; Wang, L. Research Progress on Soil Temperature Prediction Equations. Acta Pedol. Sin. 2023, 60, 599–609. [Google Scholar]
Figure 1. Distribution of soil water content at different soil depths under each treatment. Note: (af) represent the soil depth of 0–20 cm, 20–40 cm, 40–60 cm, 60–80 cm, 80–100 cm, and 0–100 cm.
Land 14 00853 g001
Figure 2. Soil temperature distribution in the vertical direction of each treatment. (af) represent soil depths of 5 cm, 10 cm, 15 cm, 20 cm, 25 cm, and 5–25 cm.
Land 14 00853 g002
Figure 3. Distribution of soil accumulated temperature with each treatment.
Land 14 00853 g003
Figure 4. Relationship between soil accumulated temperature and soil moisture content in 0–20 cm soil layer.
Land 14 00853 g004
Figure 5. Relationship between soil temperature conductivity (10–15 cm) and soil moisture content (20–40 cm).
Land 14 00853 g005
Figure 6. The relationship between soil temperature and soil depth with different soil moisture treatments. Soil Temperature/°C; Soil Depth/cm; Soil Temperature Gradient °C/cm. Note: (ag) represent the processing of S1, S2, S3, S4, S5, BGS, and BZZ, respectively; (h) represents the relationship between the soil temperature change rate and the moisture content.
Land 14 00853 g006
Figure 7. Correlation between soil temperature and soil moisture content. Note: ST5, ST10, ST15, ST20, and ST25 represent soil temperatures at 5 cm, 10 cm, 15 cm, 20 cm, and 25 cm depth, respectively; SW20, SW40, SW60, SW80, and SW100 represent soil moisture content at 0–20 cm, 20–40 cm, 40–60 cm, 60–80 cm, and 80–100 cm depth, respectively.
Land 14 00853 g007
Figure 8. Correlation between soil temperature and meteorological elements. Note: ST5, ST10, ST15, ST20, and ST25 represent soil temperatures at 5 cm, 10 cm, 15 cm, 20 cm, and 25 cm depth, respectively; AP represents atmospheric pressure; AT represents average temperature; HAT represents the highest temperature; LAT represents the lowest temperature; RH represents relative humidity; SD represents sunshine duration; EC represents evaporation; WVP represents water vapor pressure; and WS represents wind speed.
Land 14 00853 g008
Figure 9. Soil temperature gradients in the morning, noon, and evening with different treatments in the vertical direction.
Land 14 00853 g009
Figure 10. Relationship between soil temperature, soil moisture content, and ETa/ET0.
Land 14 00853 g010
Table 1. Experimental design and description of treatments.
Test NumberDescription
S11050 m3 hm−2 irrigation of 1050 m3 hm−2 before sowing
S2825 m3 hm−2 irrigation 825 m3 hm−2 before sowing
S3600 m3 hm−2 irrigation 825 m3 hm−2 before sowing
S4375 m3 hm−2 irrigation 825 m3 hm−2 before sowing
S5225 m3 hm−2 irrigation 825 m3 hm−2 before sowing
BGSWithout irrigation
BZZFallow and without irrigation
Table 2. Descriptive statistical characteristic values of soil temperature for each treatment.
Test No.Soil Depth
/cm
Amplitude of Variation
/°C
Minimum/°CMaximum/°CAverage/°CSkewnessKurtosisCoefficient of Variation/%
S1522.116.939.027.030.44−0.2718.22
1020.118.638.727.430.230.1314.14
1516.419.636.026.800.030.1211.02
2015.520.035.525.630.381.239.89
2510.020.230.225.18−0.06−0.408.68
S2523.516.139.627.420.52−0.7421.72
1021.516.538.026.860.01−0.6718.14
1516.318.234.526.39−0.28−0.8013.56
2012.119.031.125.85−0.31−0.6110.93
2511.919.931.825.260.05−0.179.55
S3524.515.540.026.430.45−0.4921.25
1019.618.438.026.790.25−0.1815.01
1517.019.236.226.140.030.0712.27
2012.219.932.125.190.08−0.289.94
2510.620.030.624.370.16−0.239.12
S4524.116.941.028.300.51−0.5719.82
1019.717.537.227.05−0.04−0.7114.99
1514.118.933.026.71−0.31−0.8112.32
2014.019.033.025.55−0.16−0.3810.85
2512.119.932.025.65−0.03−0.439.72
S5525.715.240.926.960.29−0.6221.32
1019.817.237.027.38−0.03−0.7616.45
1514.419.033.427.00−0.19−0.6912.48
2014.219.233.426.110.07−0.4511.38
2518.218.436.625.600.441.5211.10
BGS524.615.239.827.330.43−0.6421.79
1020.218.038.227.950.00−0.6815.99
1519.418.638.027.18−0.01−0.3713.63
2018.019.037.025.940.220.7211.64
2511.820.232.026.000.03−0.339.39
BZZ530.115.145.229.540.57−0.7225.33
1026.413.239.627.57−0.01−0.7420.94
1521.017.038.028.06−0.34−0.8416.64
2018.017.235.226.99−0.33−0.7214.79
2514.418.633.026.87−0.38−0.4512.53
Disclaimer/Publisher’s Note: The statements, opinions and data contained in all publications are solely those of the individual author(s) and contributor(s) and not of MDPI and/or the editor(s). MDPI and/or the editor(s) disclaim responsibility for any injury to people or property resulting from any ideas, methods, instructions or products referred to in the content.

