Article

A Century of Water–Socioecological Dynamics and Evolutionary Stages in Lake Victoria Basin, East Africa

1
Key Laboratory of Watershed Geographic Sciences, Nanjing Institute of Geography and Limnology, Chinese Academy of Sciences, Nanjing 210008, China
2
State Key Laboratory of Lake and Watershed Science for Water Security, Nanjing Institute of Geography and Limnology, Chinese Academy of Sciences, Nanjing 210008, China
3
College of Resources and Environment, University of Chinese Academy of Sciences, Beijing 100049, China
4
School of Geography Science, Nanjing Normal University, Nanjing 210023, China
5
Tanzania Fisheries Research Institute, Dar es Salaam P.O. Box 9750, Tanzania
6
Joint Research Station for East African Great Lakes and Urban Ecology, Nanjing Institute of Geography and Limnology, Chinese Academy of Sciences, Nanjing 210008, China
*
Author to whom correspondence should be addressed.
Land 2025, 14(4), 906; https://doi.org/10.3390/land14040906 (registering DOI)
Submission received: 5 March 2025 / Revised: 8 April 2025 / Accepted: 16 April 2025 / Published: 20 April 2025

Abstract

:
Understanding the feedback relationships and evolutionary stages of water–socioecological systems (W-SESs) is crucial for achieving sustainable development in basins. This study focuses on the Lake Victoria Basin (LVB) in East Africa, where population growth, rapid urbanization, and developing industrialization have intensified water resource supply–demand conflicts, leading to socioecological issues such as water environmental degradation and ecological conflicts. The objective of this research is to develop a theoretical framework for the Lake Victoria Basin W-SESs (LVB-WSESs) based on the SES framework, identify the main drivers and critical nodes in the evolution of the LVB-WSESs, analyze the root causes of water–society–ecology conflicts, and explore the feedback relationships and evolutionary stages of the LVB-WSESs over the past century. To achieve this, we employed an integrated qualitative and quantitative analysis of historical data combined with tipping point detection to systematically assess the dynamics of the LVB-WSESs. Our findings show that, under the drivers of climate change (with a 1 °C increase in annual temperature since 1920s), population growth (a six-fold increase since 1920s), economic development, land-use change, urbanization, and species invasion, the basin’s demand for water resources, water environments, and aquatic ecosystems has continually increased, leading to the gradual degradation and imbalance of the basin’s ecological functions. The evolution of the LVB-WSESs can be divided into five stages against the historical backdrop of societal transitions from colonial to independent democratic systems: the stable resource utilization period, the slow environmental change period (1920s–1960s), the rapid environmental imbalance period (1960s–1990s), the transition period from environmental imbalance to protection (1990s–2015), and the reconstruction period of socioecological equilibrium. This study not only enhances understanding of the long-term dynamics of the LVB-WSESs but also provides practical implications for sustainable water management in similar basins globally. It enriches the local practice of global sustainable development theories, providing new theoretical perspectives and case references for future watershed sustainable management. By identifying critical drivers and evolutionary stages, our findings can inform policy decisions and interventions to mitigate socioecological conflicts and achieve basin-level sustainability.

1. Introduction

As a key site of interaction between human societies, other organisms, and the natural environment, a basin is one of the most dynamic social–ecological systems (SESs) [1], and its essence lies in the tight integration of natural and human elements, forming an inseparable organic whole [2]. The natural ecological and hydrological processes of watersheds have been dramatically altered due to climate change and anthropogenic activities such as urbanization and population growth [3,4], leading to a series of problems such as reduced water resources, deterioration of water quality, and degradation of water ecology. Watershed science remains an important field for studying complex systems, realizing scale transitions, and modeling the synergistic evolution of human–natural systems, focusing on the linkages between human societies, basin hydrological processes, and specific global drivers such as climate change, urbanization, and international policy frameworks [5].
Social–ecological systems (SESs) refer to composite systems formed by the interaction between human societies and natural ecosystems [6]. Complex system theory focuses on the nonlinear dynamics, multi-level structures, and feedback mechanisms within systems, while integrated management represents an interdisciplinary approach aimed at coordinating socioeconomic activities with ecological conservation to promote sustainable development. Comprehensive research on social–ecological systems (SESs) aim to deepen the understanding of the complex relationships between the environment, ecosystems, natural resources, and human impacts [7]. The SES theoretical framework has been widely applied in the fields of governance of social and environmental impacts [8], vulnerability and resilience analysis of social–ecological systems [9,10], and decision-making in complex social–ecological systems [11,12,13]. Under the context of global change and intensified human activities, SESs provides an effective framework for integrated basin-scale management studies, including the construction of social–ecological indicator systems for basin classification [14], the study of a basin’s adaptive capacity to climate change [15], the impacts of urbanization on basin hydrology and water resources [16], conjugate evolution studies of basin social–ecological systems [17], and simulation analysis of water management sustainability [18]. In this study, bibliometric methods were used to analyze the Web of Science core database quantitatively on “social-ecological”, “basin”, “resource”, “water”, and “water management” using CiteSpace 6.2.R2 metrics visualization software and constructed a co-occurrence keyword network map (Figure 1). Overall, existing research mainly explored the feedback mechanisms of social–ecological systems in study areas by combining biophysical and social attributes of basins with both qualitative and quantitative analysis methods and to provide a knowledge system for basin managers to address conflicts and challenges in water and ecosystem management. This study employs long-term historical data reconstruction to systematically trace and analyze the key stages of evolution in the basin water–socioecological systems over the past century, elucidating the underlying driving mechanisms. This long-term perspective provides a novel theoretical framework for understanding the co-evolutionary dynamics of complex human–nature systems.
While current research have advanced our understanding of SESs, there remains a need for more long-term, integrated analyses of socioecological feedback mechanisms, particularly under the context of colonial transitions. This is especially relevant in regions like the Lake Victoria Basin, where historical and political contexts have played a role in shaping contemporary socioecological dynamics. The LVB is a critical case study due to its unique ecological and sociopolitical context [19]. As an important ecosystem service provider in East Africa, Lake Victoria is surrounded by the densest population in Africa. However, the management system of the basin faces challenges such as data scarcity and inefficient water management strategies, which hinder decision-making processes for balancing socioeconomic development with ecological protection [20]. These problems make the basin prone to falling into a “poverty–environment trap”, where poverty exacerbates environmental degradation and vice versa, creating a vicious cycle that is difficult to break [21]. This dynamic makes the region a typical ecologically and economically fragile area recognized by the international community. The political economy of transboundary water management further complicates these challenges, as competing priorities among riparian countries can impede coordinated decision-making processes [22]. Therefore, clarifying the complex mutual feedback relationships and evolutionary stages of the water–socioecological systems in the Lake Victoria Basin, identifying the main drivers of the system’s evolution, and then defining the priorities and solutions for future management are the key links to realize the basin’s sustainable development.

2. Study Area and Methodology
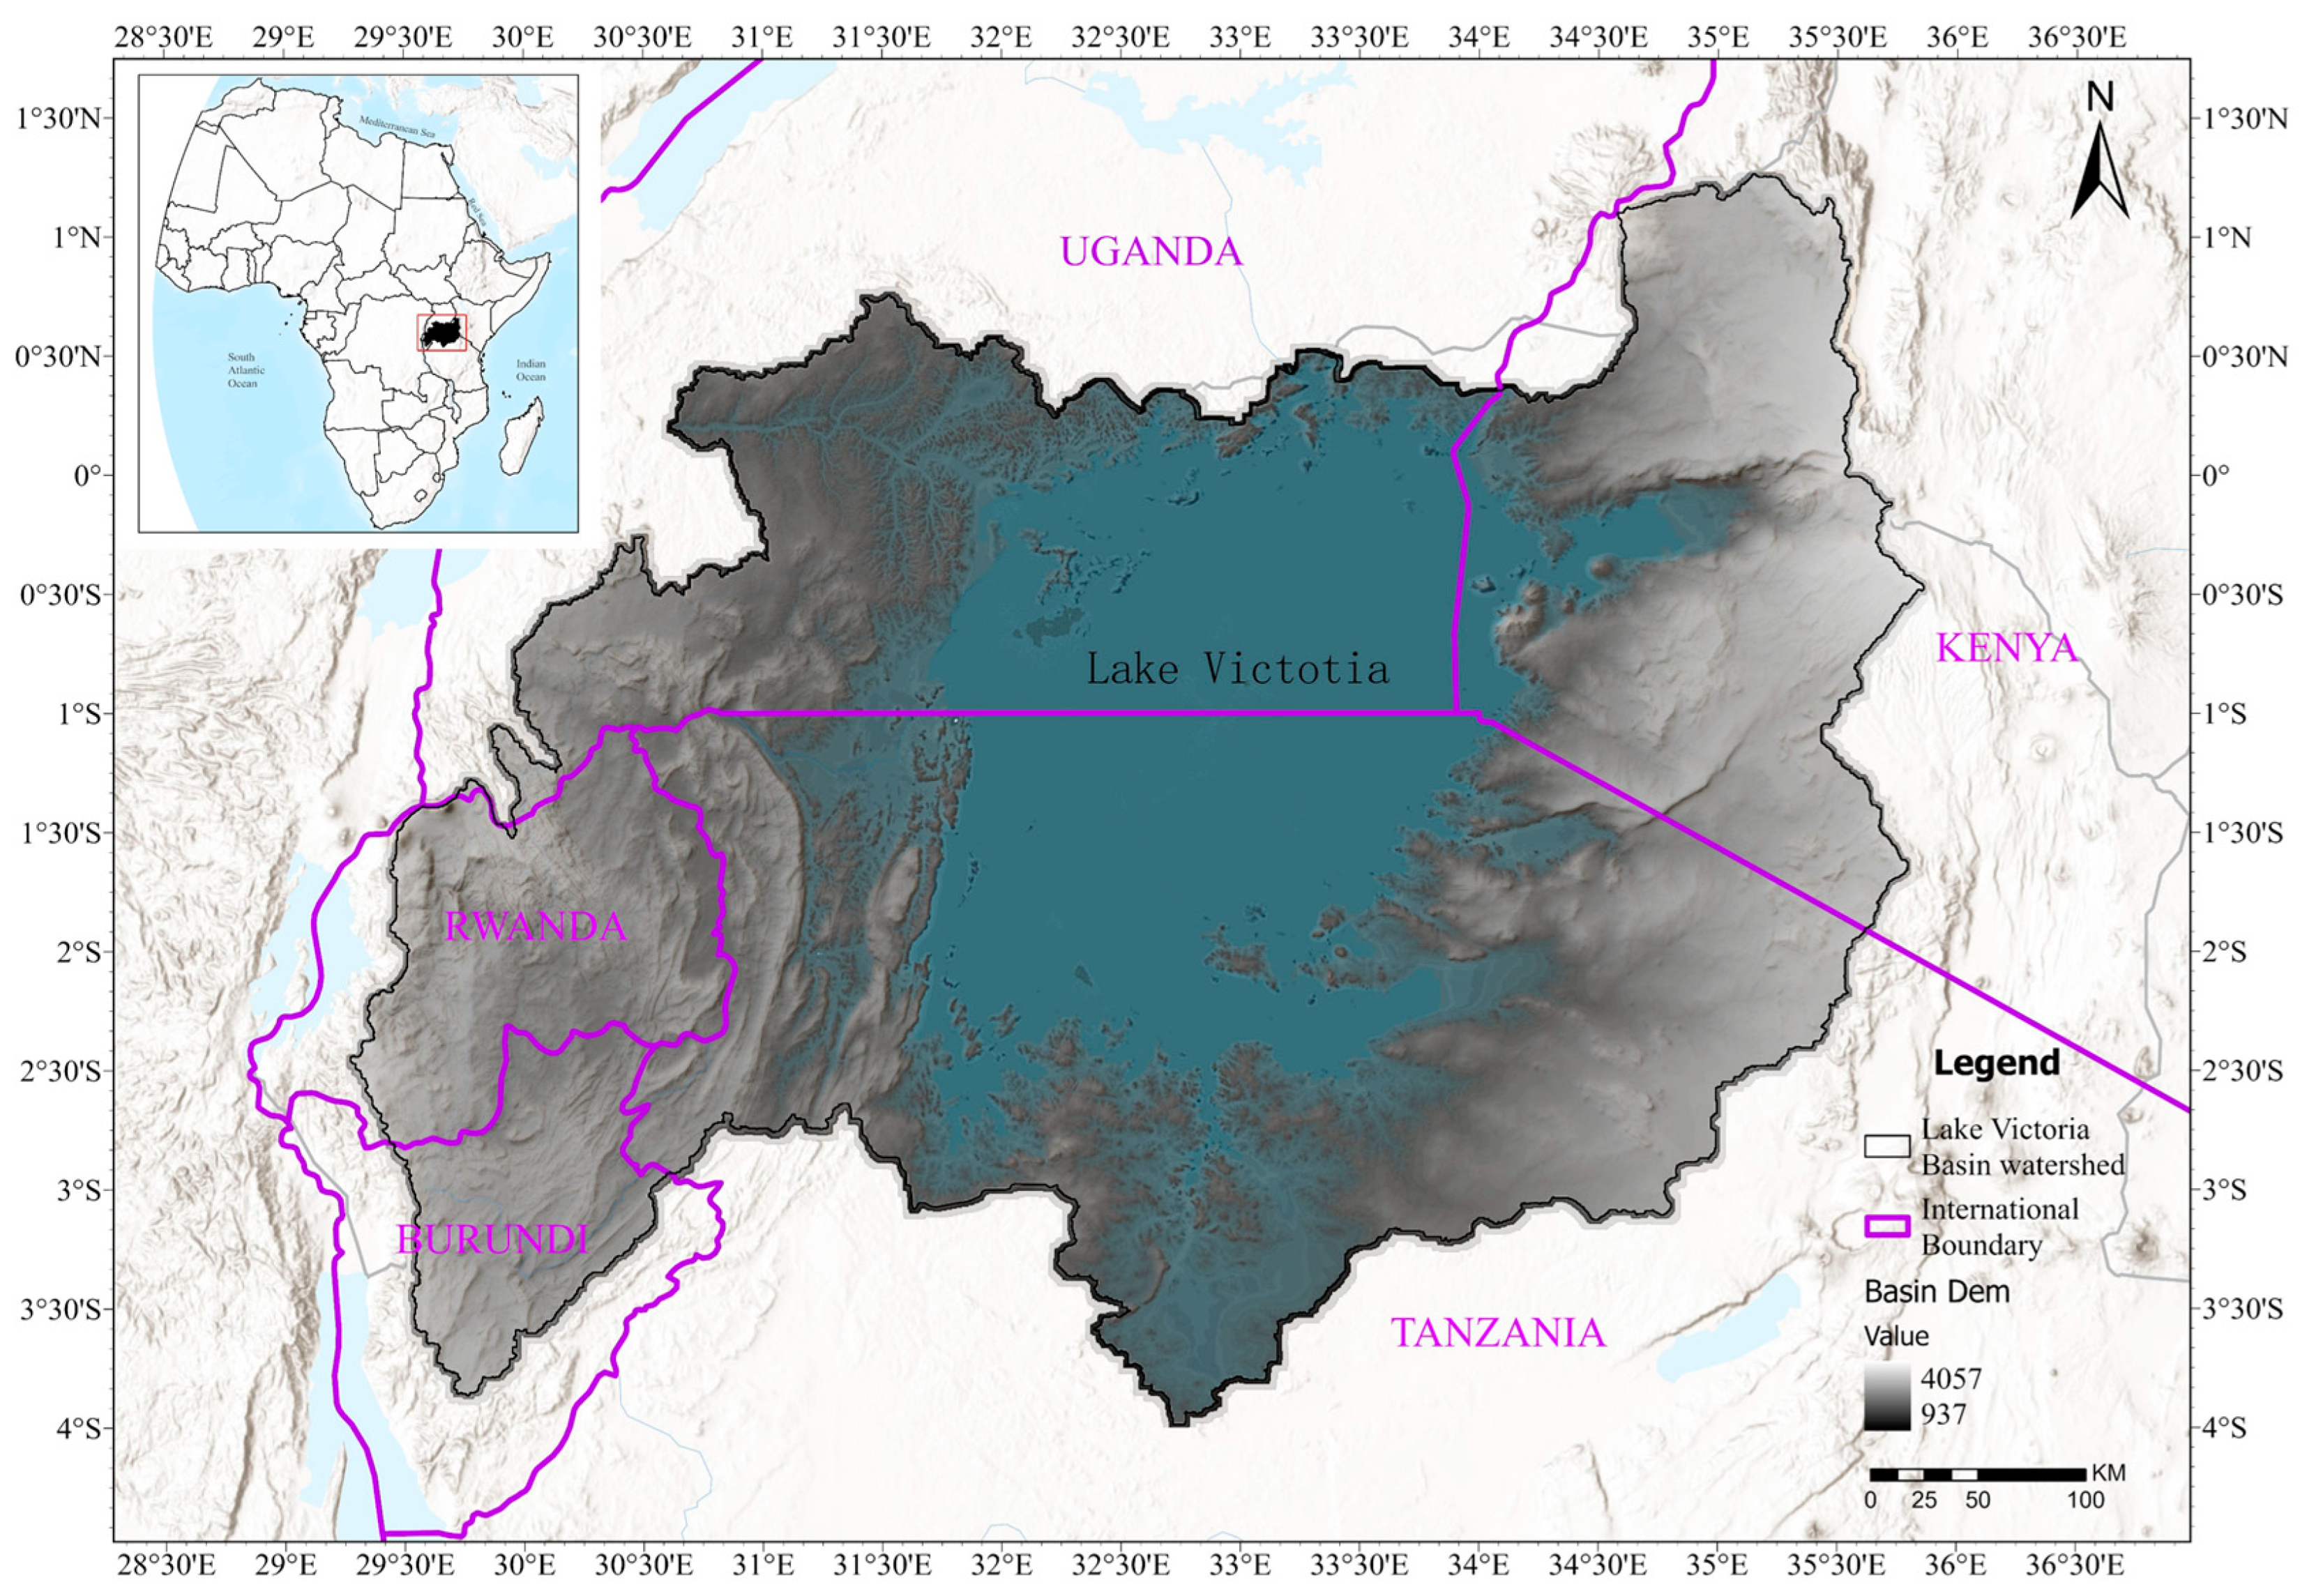
2.1. Study Area

Lake Victoria Basin (LVB) is located in the Rift Valley region of East Africa, with an altitude of 1135 m above sea level and a basin area of about 260,000 km2 (Figure 2). It covers five countries: Kenya, Uganda, Tanzania, Rwanda, and Burundi. Lake Victoria (Lake Victoria, LV) (0°20′ N–3°05′ S, 31°40′ E–34°53′ E) has an area of 68,870 km2 (about 35% of the basin area). The LV is the world’s largest tropical lake, the second largest freshwater lake, and the second largest lake in the world in terms of area among Tanzania (51%), Uganda (43%), and Kenya(6%) [23,24]. The total length of the lake’s shoreline is about 3500 km, with a maximum depth of 80 m and an average depth of 40 m [25]. Compared to other Rift Valley lakes, LV is shallow and therefore particularly sensitive to anthropogenic changes in its surroundings. LV has a water body of about 2760 km3, of which 80% comes from direct rainfall over the lake [26] and 20% from runoff inputs from the basin [27]. The basin serves as the headwater of the White Nile, a tributary of the Nile. The basin has a savannah climate, with mean annual rainfall ranging from 886 to 2609 mm, and the annual rainfall is influenced by the Intertropical Convergence Zone (ITCZ), showing a bimodal distribution, with the long rainy season lasting from March to May, and the short rainy season occurring from October to December [28,29]. The basin’s spatial rainfall is roughly characterized by higher rainfall in the north and northeast than in the south.
As a center of development and regional integration in the East African Community (EAC), the LVB has one of the highest population densities in Africa. The main sources of income in the basin include agriculture, livestock, fisheries, tourism, and mining, which support the livelihoods of over 56 million people. The LVB hosts the world’s largest inland freshwater fishery. Its water resources support diverse uses, including fisheries, irrigated agriculture, livestock, domestic water supply, and transportation [30]. Land use in the basin is dominated by agricultural land, grassland, and forest land. In contrast, built-up land is concentrated in major cities along the lake and bay, such as Kampala (Uganda), Kisumu (Kenya), Mwanza (Tanzania), and Kigali (Rwanda) [31].

2.2. Methodology

This paper analyzes the evolutionary characteristics of social–ecological systems in the LVB based on the theoretical analysis method of social–ecological systems (SESs). This paper uses literature combing, combines the availability and completeness of long-time-series data in the basin, and adopts a combination of qualitative and quantitative methods to identify the key relationships and elements [32], and the selected data indicators are presented in Table 1.
Kampala, Uganda’s largest urban capital, Mwanza, Tanzania’s largest city, and Eldoret, Kenya’s largest city, are all located in the study area. The population density of the basin is generally higher than that of the five countries around the basin. This study uses the urbanization rates of each country as published by the United Nations to characterize these countries’ urbanization processes in the study area. Based on R4.4.1, a proportional model with nonlinear least squares was fitted to the population data of the WordPop watershed from 2000 to 2020 and the population data of each country from 1949 to 2020 to generate a long time series of watershed population data. A GAM (Generalized Additive Model) model was fitted to the mean annual rainfall of the CHIRPS dataset for 1960–2004 and 2004–2020 to obtain long-time-series mean annual rainfall data for the basin. For GAM models, this study validated performance using k-fold cross-validation. While effective for modeling temporal variability, GAMs may struggle to capture extreme events or nonlinear trends beyond specified basis functions. However, given the availability of long-term rainfall data (1960–2020), GAM provided a suitable framework for modeling mean annual patterns. Therefore, the GAM model was fitted to the mean annual rainfall of the CHIRPS dataset for 1960–2004 and 2004–2020 to obtain long-time-series mean annual rainfall data for the watershed. Finally, the PELT algorithm was applied to detect tipping points for all indicator data, and linear regression was fitted to the data for each stage.
To detect tipping points in the indicator data, we applied the PELT (Pruned Exact Linear Time) algorithm. PELT was chosen due to its computational efficiency and ability to handle multiple change-point detection with minimal false positives. It is particularly suited for identifying abrupt changes in long-term datasets, aligning with our objective of analyzing socioecological transitions under colonial and post-colonial contexts. Finally, we applied the PELT algorithm to detect tipping points for all indicator data and fitted linear regression models to the data for each stage. The historical context was integrated into stage classification by considering key sociopolitical events (e.g., colonial governance changes and post-colonial economic transitions) that influenced land-use patterns and resource management in the LVB. These events guided the interpretation of tipping points, ensuring the analysis accounted for ecological dynamics and historical trajectories.

3. Results

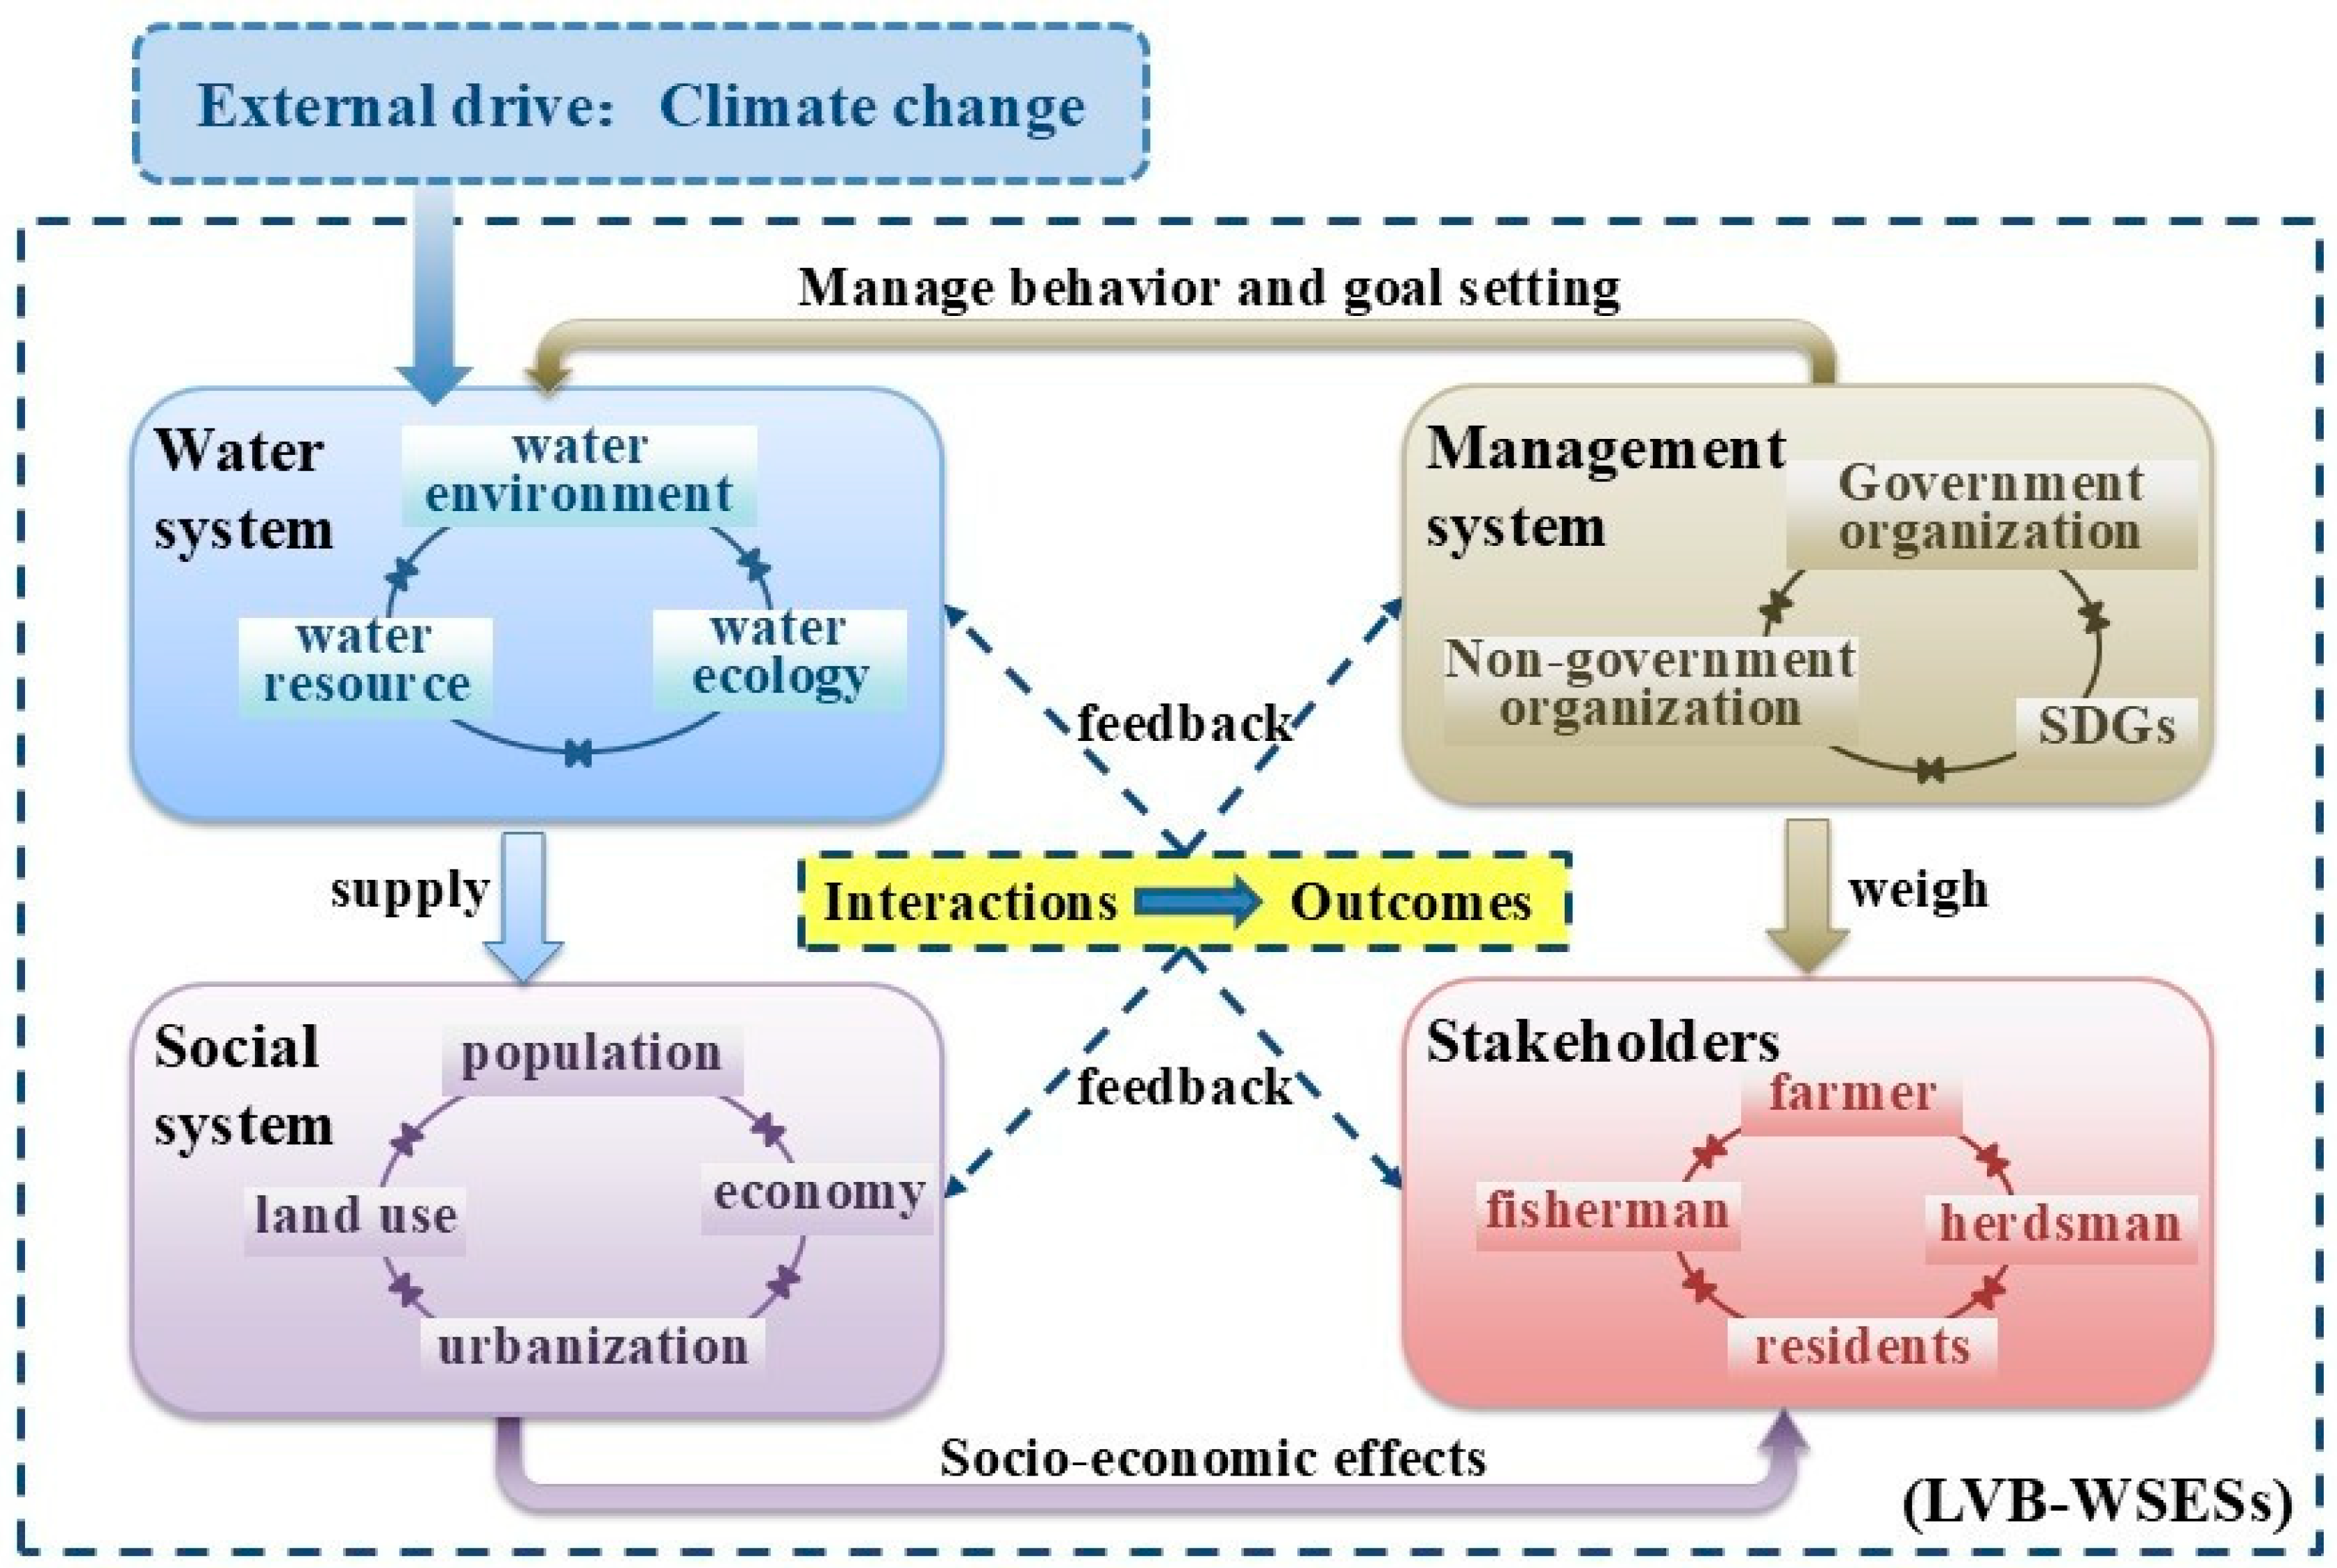
3.1. A Theoretical Analytical Framework for LVBW-SESs

We built a water-socioecological system analysis framework around the sustainable use of water resources based on the concept and framework of social–ecological system analysis. The key parameters are sorted according to the three major systems of water resources, water environment, and socioeconomics. Big data analysis and processing techniques are applied to data mining and organization of the relevant literature, research reports, government policies, and databases in the LVB. A theoretical analysis framework of the water–socioecological system in the LVB was constructed (Figure 3). The framework is centered on the water system of the basin and aims to promote the synergistic management of water quality, water ecology, and water resources in the basin and explore the relationship between the social system and the ecosystems under the core of the water system. The water system serves as the central nexus mediating bidirectional feedback between social systems (e.g., water governance and economic activities) and ecosystems (e.g., aquatic biodiversity and biogeochemical cycles). The water system mediates bidirectional feedback mechanisms between social and ecological subsystems through three constitutive pathways: (i) Institutional governance structures, including governmental and non-governmental organizations, regulate water resource allocation through policy instruments (e.g., dam operations, SDGs implementation), thereby modifying hydrological regimes and ecosystem service provision. (ii) Stakeholder activities conducted by farmers, fishermen, and residents alter land–water interface dynamics through livelihood practices, generating measurable impacts on aquatic environmental quality that subsequently feedback into management systems. (iii) Resultant socioecological outcomes, particularly trade-offs between economic development and ecological degradation, establish critical tension points that drive adaptive policy cycles, completing the coupled human–water system feedback loop.
The LVB-WSESs framework serves two key purposes: it guides the selection of critical variables examined in subsequent sections and it offers an analytical lens for interpreting complex feedback mechanisms. For instance, the framework enables rigorous assessment of how land-use modifications affect water systems, as well as the socioecological impacts of invasive species. By effectively linking theoretical foundations with empirical observations, this framework strengthens both the reliability and practical value of our research findings.

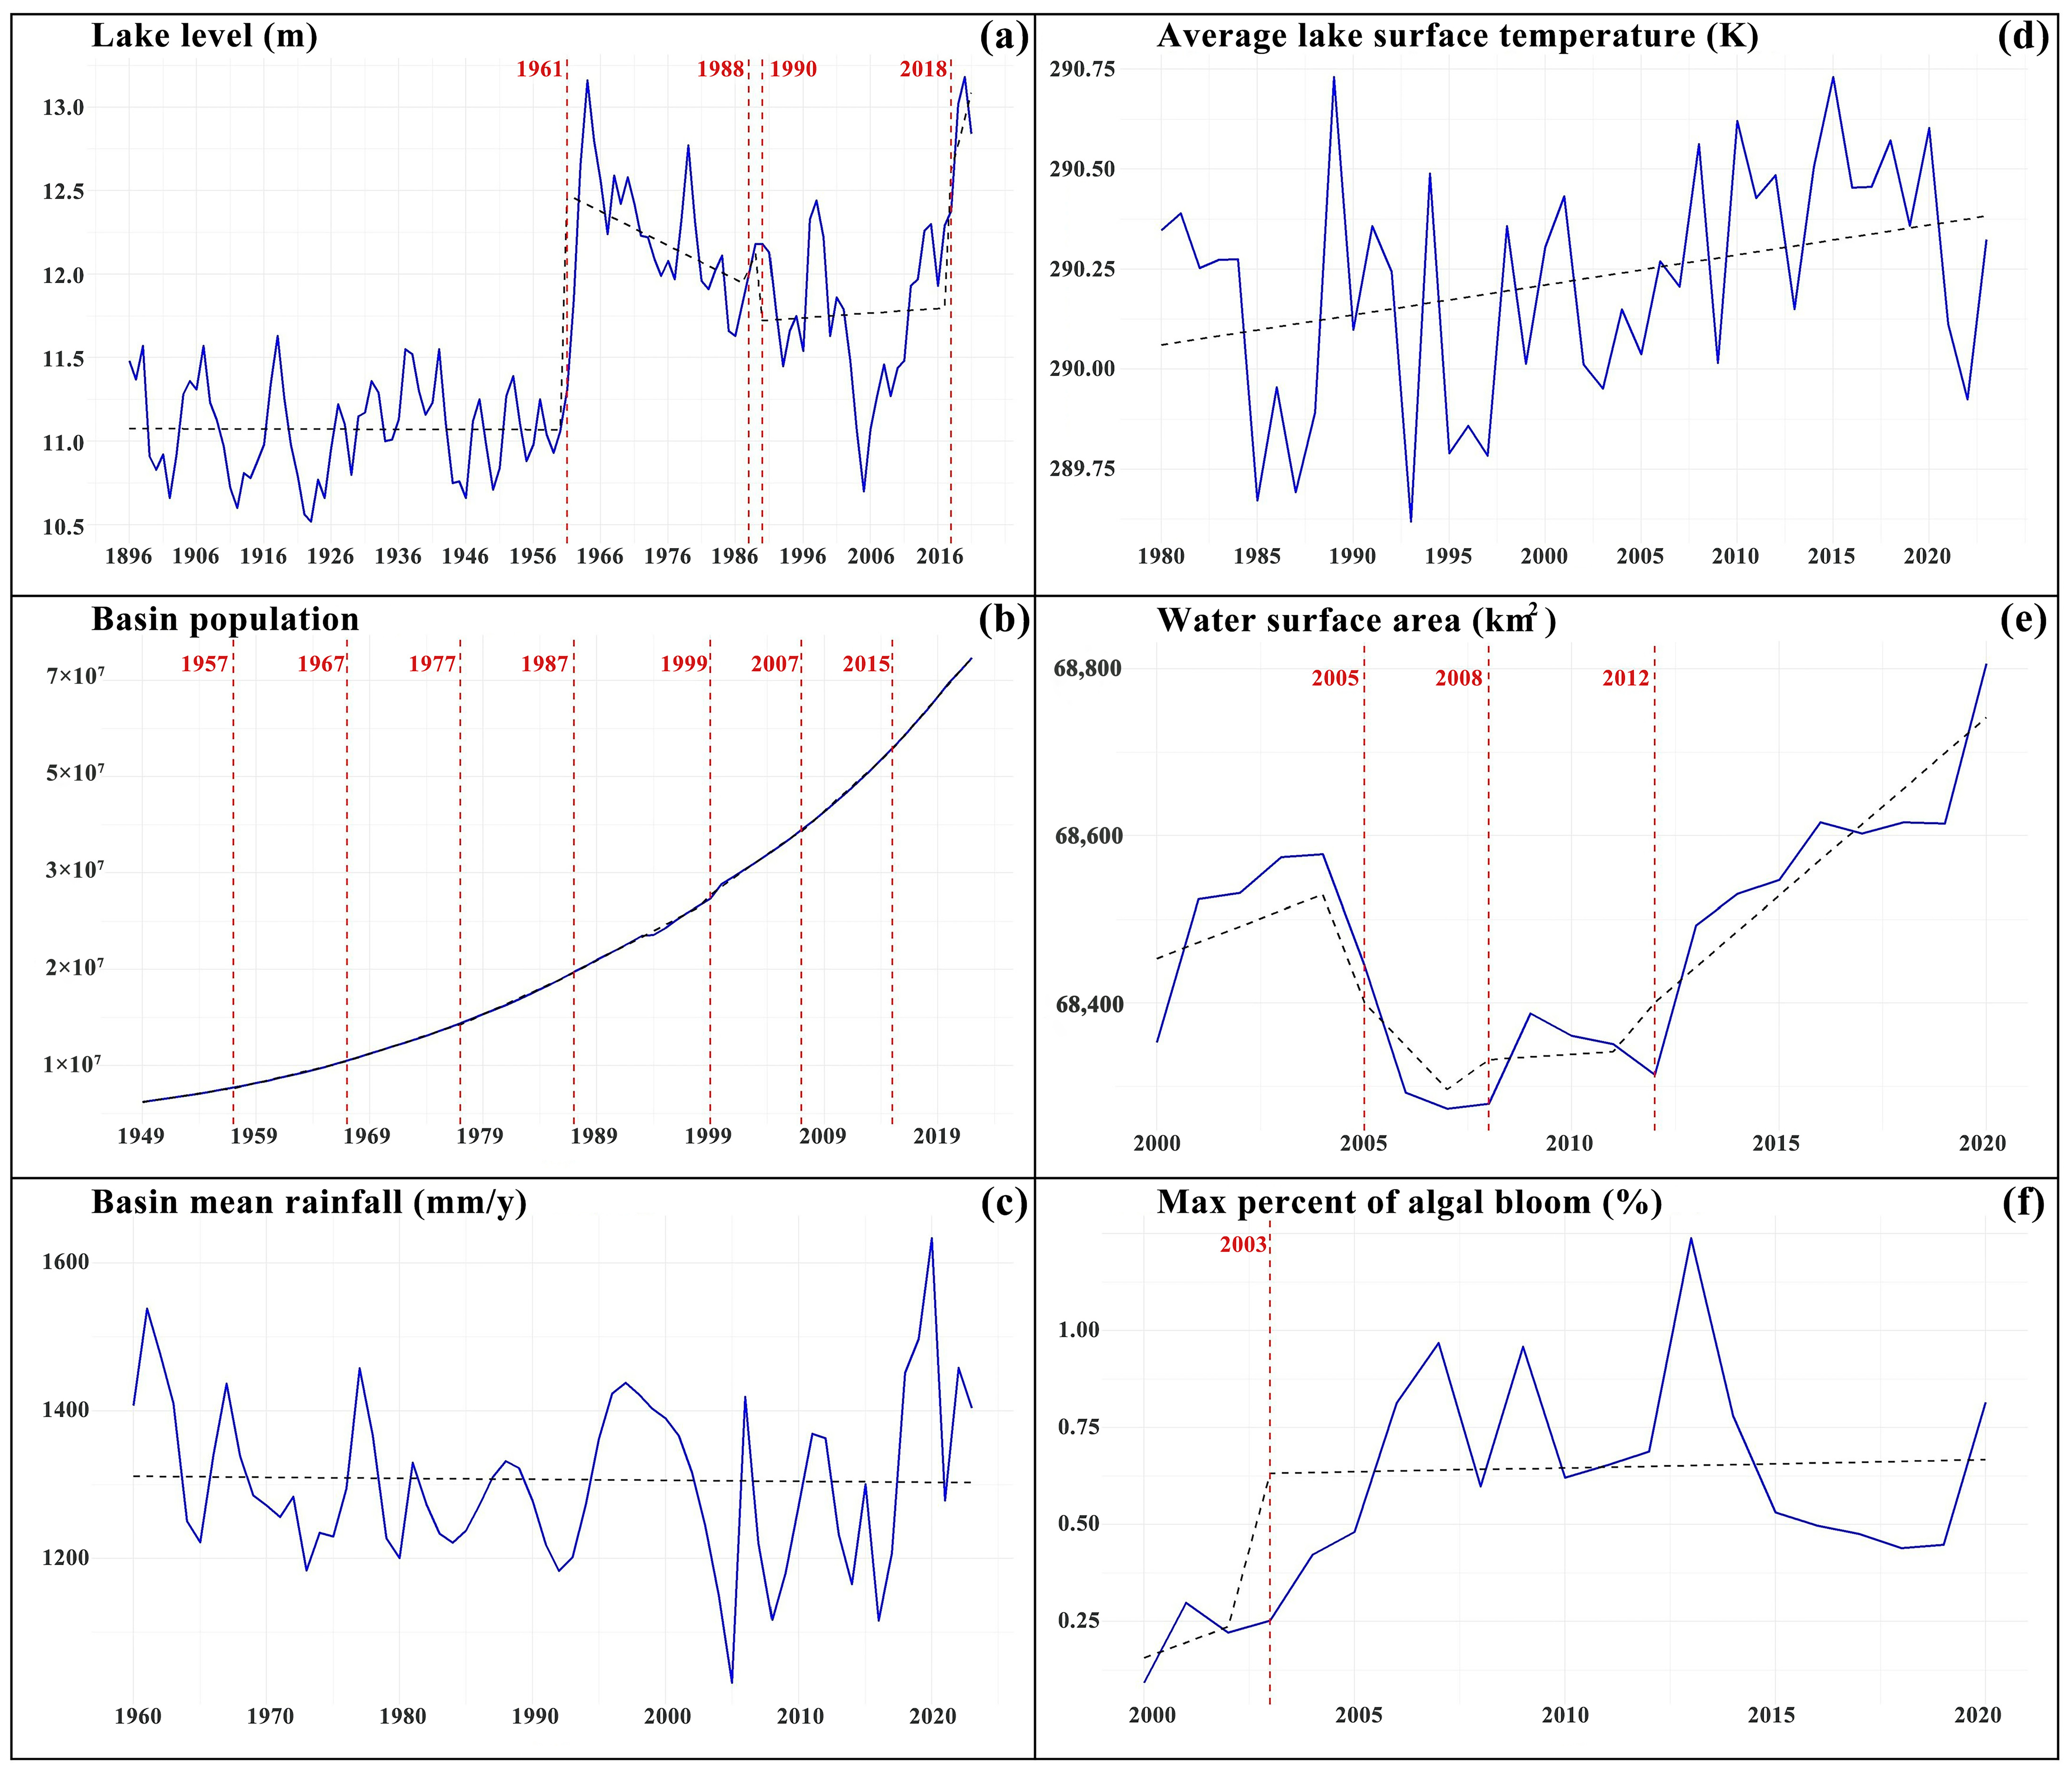
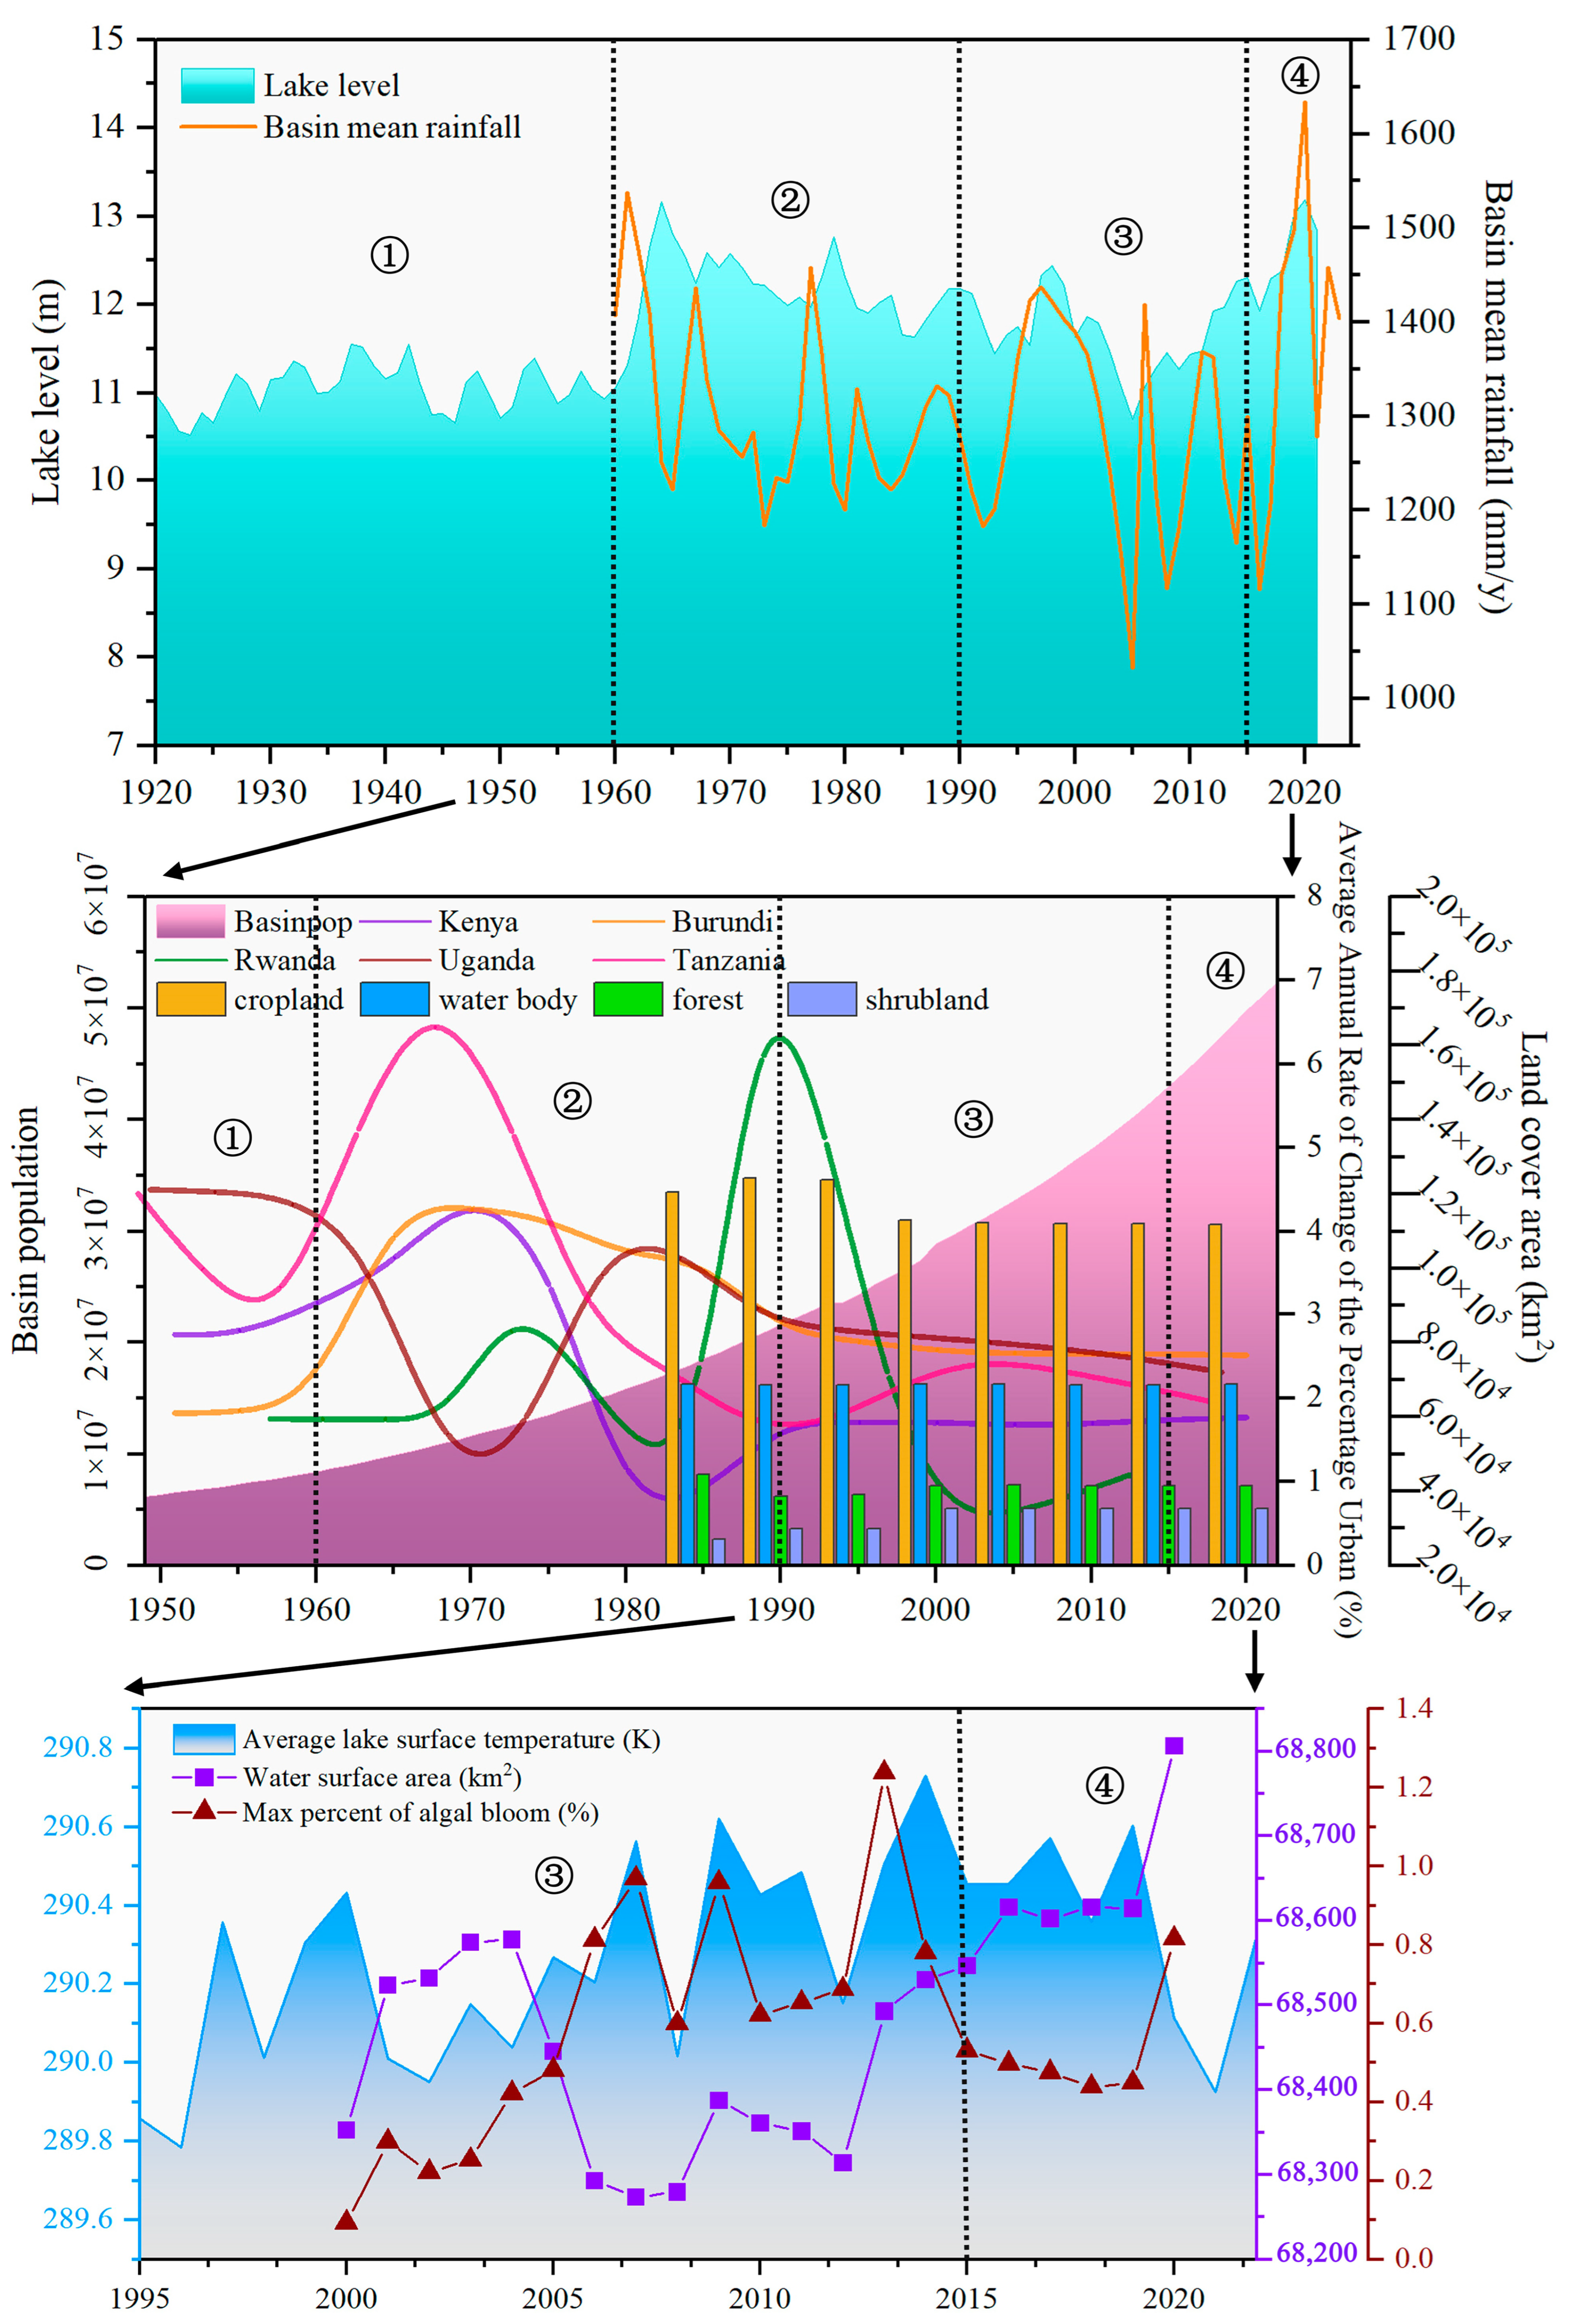
3.2. Characterization of Changes in Key Elements of Water–Social Ecosystems in the Lake Victoria Basin in the Last 100 Years

Unlike the Nile’s reliance on highland discharges [43] or Lake Chad’s river-dominated regime [44], the LVB’s rainfall-dependent water balance makes it uniquely responsive to ITCZ variability. In terms of the characteristics of changes in key elements of the LVB water system, the water level of LV has varied by more than 3.2 m over the last 100 years, broadly showing a fluctuating trend of increasing, decreasing, and then increasing (Figure 4a). This multidecadal variability reflects both natural climate fluctuations and increasing human influence, particularly after the 1960s. The abrupt rainfall years could not be identified in the long-time-series data (Figure 4c) based on the available literature. Combing and analyzing the rainfall anomalies of some years showed that rainfall anomalies in the basin in the past 100 years were 1985–1986, 1997–1998, 2007, 2010–2011, 2012–2013, and 2015–2016, and the drought periods were 2000–2001, 2004–2006, 2014–2015 [24], and 2022 [45]. The lake level reached a record high in the early 1960s, followed by a general decline from the mid-1960s to 2006, including a 2.5-meter decline between 2000 and 2006. This decline period coincided with both drought conditions (2000–2001 and 2004–2006). Thereafter, the lake level showed a slow upward trend, rising by about 3 m between 2006 and 2021, and in May 2020, it was 13.46 m, a new record, exceeding the highest level of 13.39 m measured in 1964 by about 7 cm, a recovery potentially linked to both increased rainfall and improved water management practices through LVBC interventions.
The monthly mean area of the lake showed a more pronounced seasonal variation, with a maximum from June to August and a minimum from September to November. The annual mean surface water extent of LV (Figure 4e) has shown a decreasing and then increasing trend over the last 20 years, with the 2006 minimum corresponding to both climatic and anthropogenic pressures. The surface temperature (Figure 4d) has shown an increasing trend in the last 40 years, consistent with both regional climate warming and land-use changes, while cyanobacterial outbreaks increased in frequency (Figure 4f), likely exacerbated by agricultural runoff from expanding farmlands.
Characterizing the changes in the key elements of the LVB socioecological system, the population of the watershed (Figure 4b) showed a significant growth trend. The period around the 1960s marked the end of colonial rule, leading to increased resource exploitation and land-use intensification, which exacerbated pressures on the basin’s ecosystems. This demographic and political transition fundamentally altered the basin’s socioecological trajectory, visible in both the tipping point analysis and the accelerating land conversion rates documented post-1960. As of 2022, the average population density of the entire watershed was about 201.4 people/km2, ranking among Africa’s highest population densities.
The compounding effects of population growth manifested through interconnected environmental pressures: agricultural over-exploitation (Figure 5(b1)), the degradation of agricultural lands into water body encroachment (Figure 5(b2)), deforestation (Figure 5(b3)), and shrublands (Figure 5(b4)). These changes occurred alongside rapid urban expansion (Figure 5(a1–a5)), collectively driving a systematic transformation of ecological land types. The land shows a clear trend of degradation, manifested in the gradual transformation of ecological land types, such as forest land, grassland, and wetland, into agricultural and construction land types, forming a degradation sequence from primary forests to closed forest land, open forest land, open grassland, cropland, and then to construction land [46]. In the 1990s, the establishment of basin cooperation mechanisms aimed to address shared water resource challenges, but implementation gaps and lack of local stakeholder involvement limited their effectiveness.
The tipping point analysis revealed distinct phases of transformation in both the water system and socioecological system, identifying common breakpoints around the 1960s, 1975s, 1985s, 1990s, 2000s, and 2015s. These findings underscore a complex interplay between natural drivers (e.g., climate variability) and anthropogenic factors (e.g., population growth, urbanization). Notably, our analysis demonstrates that ecological degradation in the basin was not solely driven by population pressure or economic activities but was also significantly shaped by historical processes such as colonial land-use policies and international interventions. For example, post-colonial agricultural intensification and urban expansion during the 1960s–1980s coincided with significant shifts in water availability patterns. Additionally, there is evidence of a time lag of approximately 10–15 years between socioeconomic drivers (e.g., population growth, urbanization) and their ecological impacts (e.g., land-use changes, water quality degradation). For instance, the rapid population increase in the 1960s and 1970s likely contributed to the observed land-use changes in the 1980s. Based on these findings and considering the colonial historical background of the LVB and international interventions (e.g., by the United Nations and the LVBC), this paper preliminarily classifies the water–socioecological systems of the LVB over the past 100 years into four distinct phases (①–④), as illustrated in Figure 6.

3.3. Impacts of Climate Change on LVB Water System

Climate change places additional pressure on water availability, water accessibility, and water demand in the LVB [45]. An analysis of the literature related to climate change and water resource changes in recent years reveals that climate change (mainly in terms of precipitation and monsoon variations [47]) and anthropogenic factors (e.g., dam regulation, hydropower generation, and irrigation [48]) have combined to cause changes in the physical form of the lake (e.g., water level, area, and shoreline) [49]. Figure 7 illustrates the conceptualized relationship between climate change and the LVB water system.
Lake level fluctuations are the result of lake water balance. Approximately 80% of LV’s water input comes from direct rainfall on the lake surface. While evapotranspiration and dams outflows account for nearly the entire water output [50,51], these processes exhibit relatively low interannual variability. Thus, precipitation has been suggested to be the main determinant controlling seasonal and inter-annual variations in lake water levels [52,53]. In addition, precipitation patterns and LV water storage in the basin have been shown to be strongly correlated with large-scale climatic phenomena such as the Indian Ocean Monsoon, the El Niño-Southern Oscillation, and the Indian Ocean Dipole [54,55]. However, with the continuous socioeconomic development of the basin, changes in human water demand and anthropogenic activities, especially the operation of dams, have perturbed the seasonal hydrological status of the lake. Specifically, some researchers have argued that dam operations such as increased discharges from Kiira Dam during certain periods significantly alteredLV’s water balance and seasonal fluctuations [48,56].
In terms of the relationship between lake level and rainfall, in the early 1960s, several consecutive years of heavy rainfall led to record-high lake levels [57]. Influenced by the abnormal activity of the monsoon system, in the last hundred years, rainfall surged in years such as 1964, 1998, and 2020, which in turn triggered large-scale flooding disasters [33,58]. Among these disasters, the 2020 floods severely affected several communities around Kenya, Uganda, and Tanzania, forcing tens of thousands of people to relocate [59]. In terms of the relationship between lake levels, water storage, and hydraulic facilities, a general decline in lake levels occurred between the mid-1960s and 2006, mainly due to the expansion of the Owen Fall/Nalubale Dam and increased discharges from Kiira Dam during that period [60]. The expansion of dams was considered to have caused a decrease in water storage between 2003, and LV water storage declined by an average of 38.2 mm per year between 2003 and 2006 [61]. The decline in water levels resulted in a reduction in the area of 31%, 10%, 21%, and 44% in the areas of Birinzi, Wenham Bay, Eminpasha Bay, and Mwanza Bay, respectively [62]. In addition, lake water and watershed temperatures show some fluctuations under the influence of external climate change. According to the results of three periods of lake water temperature observations in 1927, 1999–2001, and 2005–2008, the surface and bottom water temperatures of LV have increased by 1.0 °C and 1.3 °C, respectively, over the last 80 years [63].
Changes in lake levels, water storage, and temperature externally driven by climate change and interventions by water utilities not only lead to reduced water resources, shoreline changes, altered water body area, and soil erosion caused by flood hazards. It also affected economic activities, such as agriculture, fisheries, hydropower generation, and transportation [64], as well as human health and well-being with profound effect [47]. As a result of lagging environmental management responses in transboundary watersheds, forest and wetland systems have degraded [65], and fish-rearing habitats are impaired [66,67]. Food insecurity and public health threats are also becoming increasingly evident, ultimately leading to the deterioration of the aquatic environment and water ecology of the LVB water system, manifested mainly in the form of eutrophication of water bodies and loss of biodiversity [48].

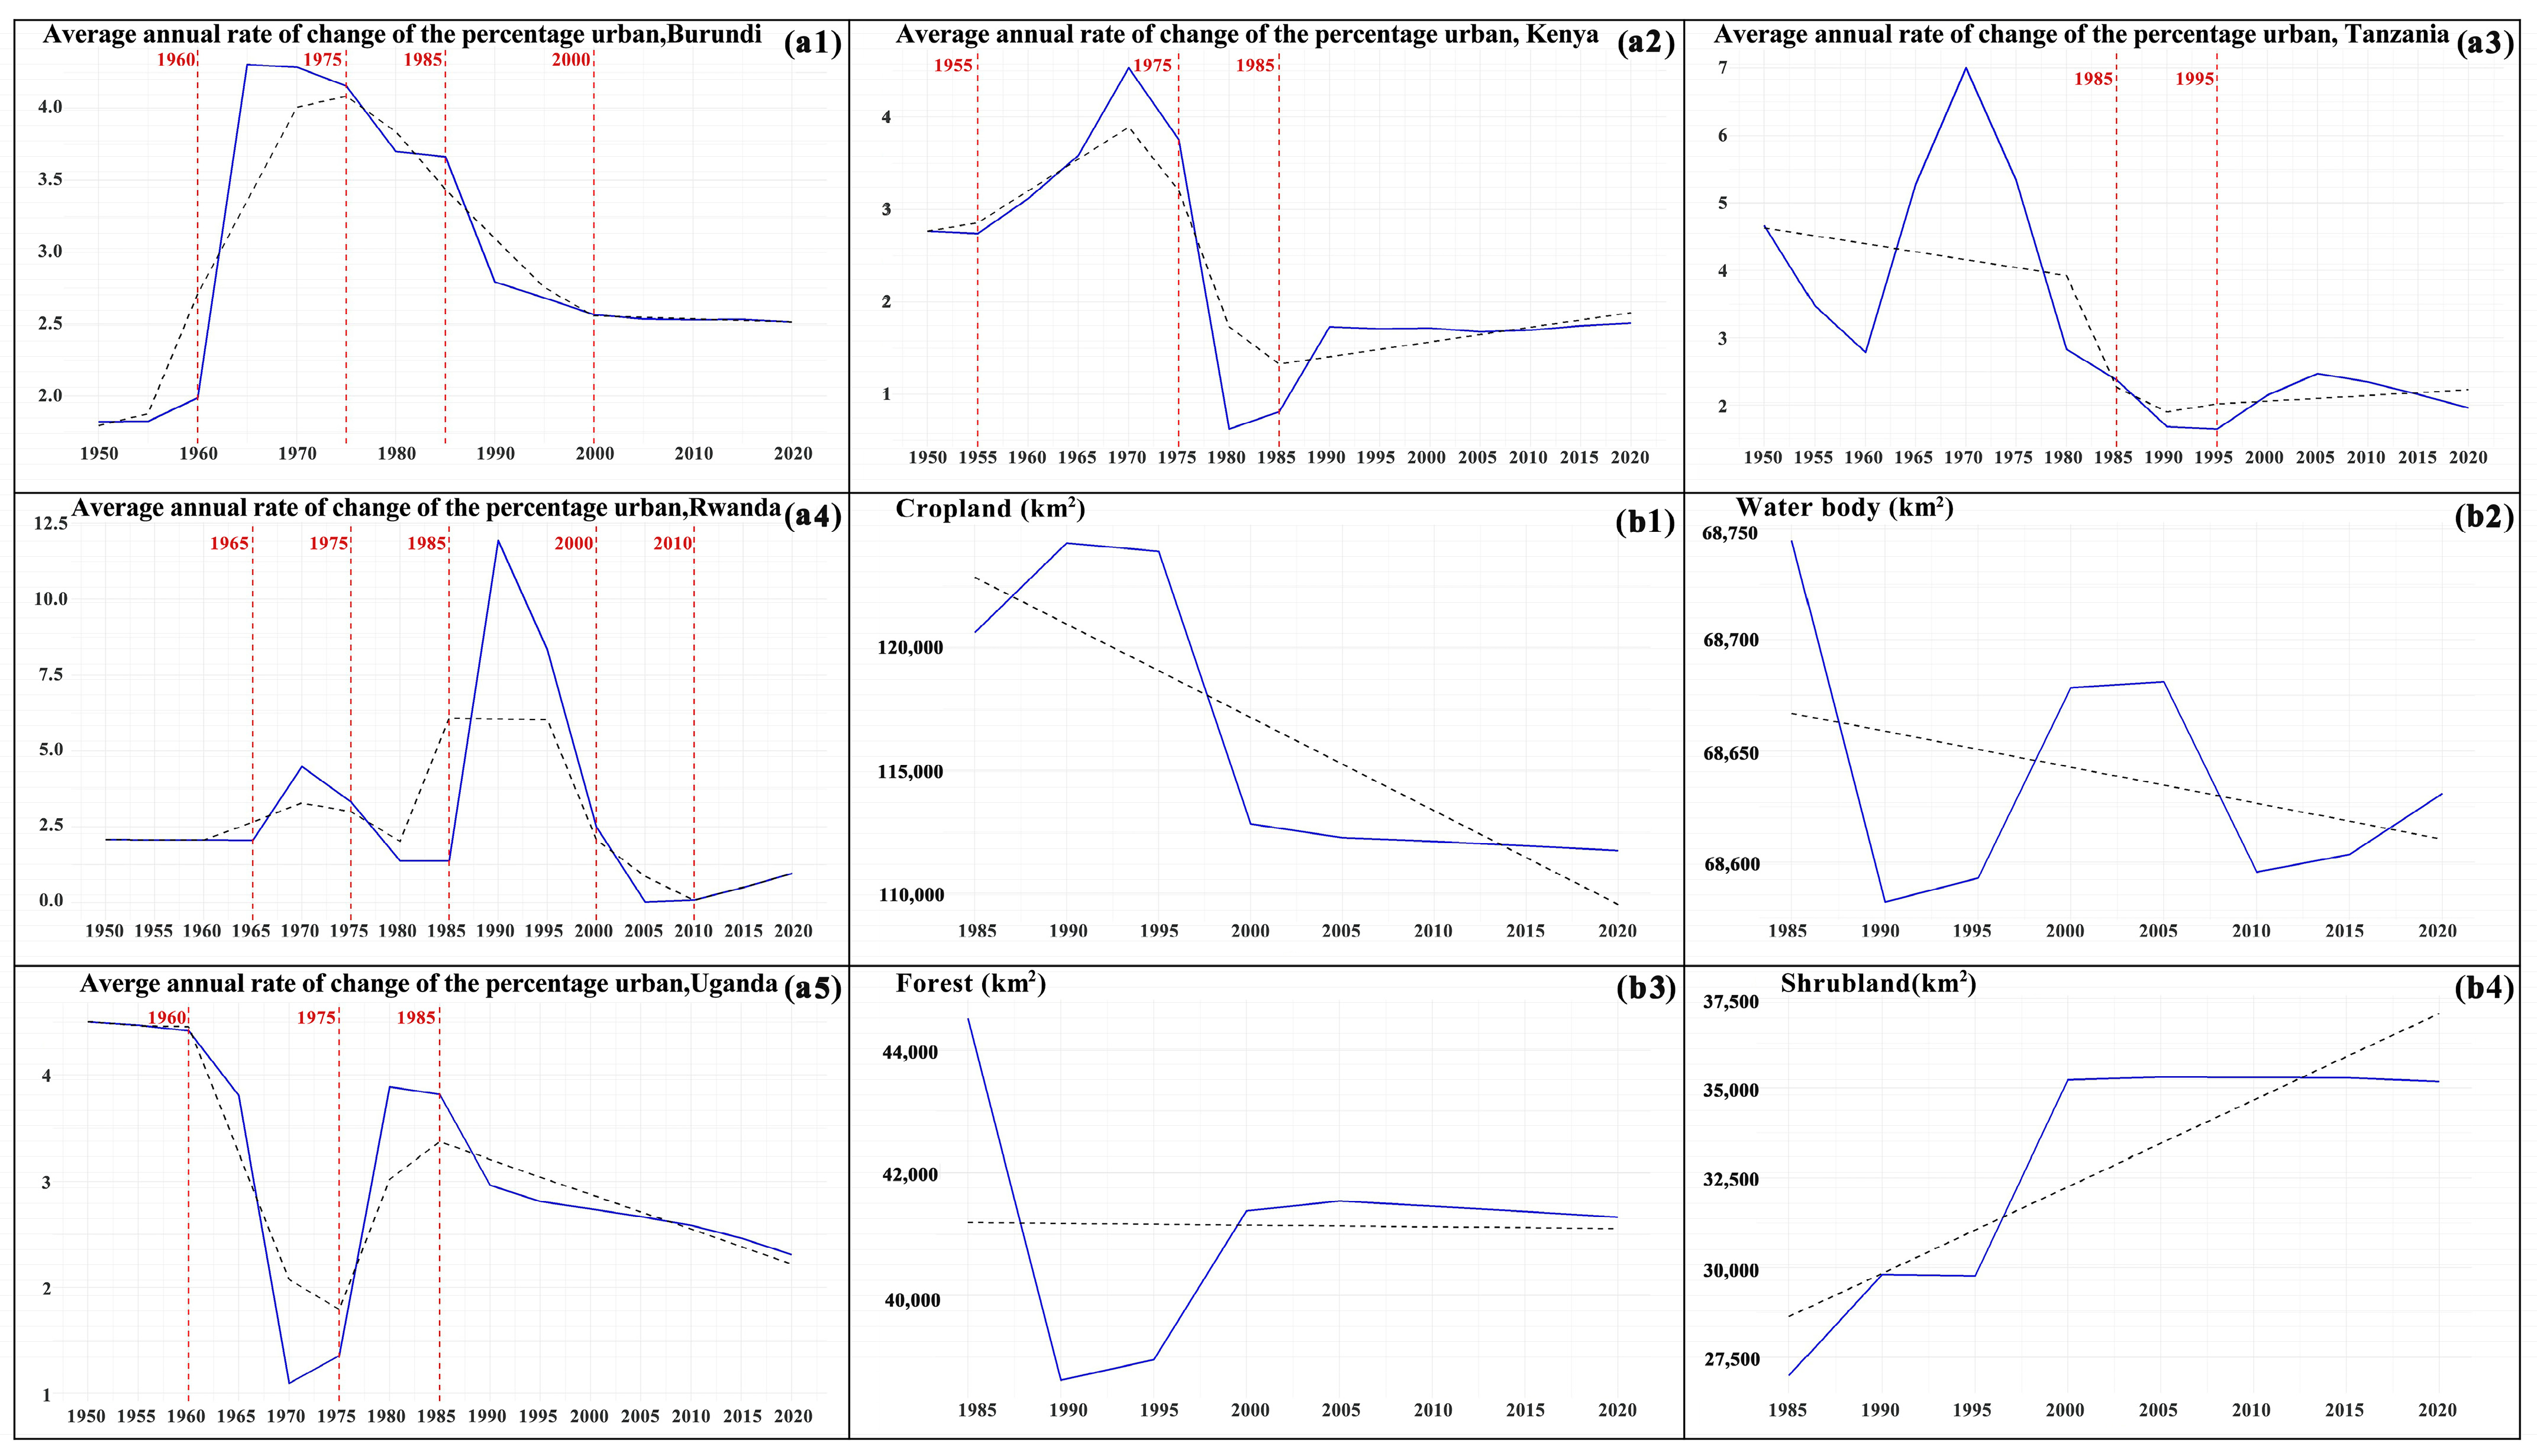
3.4. Feedback Between Basin Land-Use Changes, Urbanization, and the Water Environment

Eutrophication is the primary problem facing LV [68,69,70]. The eutrophication problem in LV is closely related to land-use changes (increase in agricultural land and decrease in forest cover) associated with population growth in the basin, industrial discharges that lack effective management, and uncontrolled urban expansion [71,72]. Some literature review showed that the eutrophication problem of LV waters is closely related to the land-use transformation and urbanization process during the historical development of the basin.
The problem of eutrophication in LV began in the 1960s [73]. As shown by paleolimnological studies, phosphorus concentrations in the lake increased significantly from 1.1 to 2.9 μmoles L−1 between the 1960s and 1990s, and eutrophication became noticeable by the late 1980s [73,74]. Since the 1920s, influenced by historical factors such as colonization and missions, the natural economic state of the East African region was broken, and the population began to increase steadily [75,76]. The colonial regime cleared the forests and wetlands around the lake for human production and livelihood, and space for agriculture and urban development gradually expanded into the catchment [77,78]. In the mid-1960s, urbanization was characterized by the uncontrolled spread of informal settlements that lacked planning. Following the successive attainment of independence by Kenya, Uganda, and Tanzania in the basin during this period, the newly formed governments extended the focus of their urban development programs from large cities to rural areas [72]. These changes likely influenced land-use patterns and water resource management practices, contributing to the observed shifts in water system parameters (e.g., lake level fluctuations). Unmanaged extensive agriculture and urban expansion led to the loss of more than half of the watershed’s wetland area between 1985 and 2010 and the degradation of wetlands into settlements, farmland, and even wastewater and garbage discharges [79], while deforestation was mainly for settlement, agricultural development, and energy needs. Annual deforestation rates reached 3%, 0.2%, 0.3%, 1.7%, and 0.8% in Uganda, Burundi, Kenya, Rwanda, and Tanzania, respectively, between 2000 and 2015 due to energy shortages and demand for fuel charcoal [80].
Agriculture is a core economic activity in the LVB, with about 80% of the basin’s population dependent on agriculture for their livelihoods and up to 60% of the rural population dependent on rain-fed agriculture. Africa’s backward, small-scale mixed farming practices have led to widespread destruction of forest, wetland, and grassland ecosystems [81]. At the same time, the spread of modern agriculture in Africa has led to the overuse of water resources and pollution from pesticides and fertilizers, exacerbating the eutrophication of water bodies and declining biodiversity [82,83]. Fertilizers and pesticides in agriculture, urban sewage, and domestic waste are major sources of pollutants. About 75% of the nitrogen content of rivers flowing into the lake comes from agriculture. In comparison, about 80% of the phosphorus content comes from municipal, industrial effluent, agricultural drainage, and untreated sewage discharges from villages and small settlements [67]. Nutrient pollution, including nitrogenous and phosphorus contaminants, primarily originates from agricultural runoff in agricultural regions across Kenya, Uganda, and Tanzania, as well as domestic sewage and industrial wastewater discharged by lakeside industries such as food processing, leather making, and chemical industries, particularly in industrial concentration district like Kampala, Entebbe, Musaka, and other cities along the lake. Table 2 lists the major pollutants and their sources in LV. Excessive nutrient inputs to the lake from agricultural runoff and urban and industrial wastewater discharges have led to the deterioration of water quality [84,85] and elevated risk to water security in the basin [86]. Fundamental changes in the trophic structure of lakes have led to algal blooms, which not only lead to the collapse of local fish populations [87] and a reduction in biodiversity [88] but also pose a serious threat to the health and livelihoods of local fishermen and farming communities [89,90].
Increased human activities, such as population growth, settlement expansion, and industrialization development, will also lead to a significant increase in water use [91,92]. The use of water resources by different stakeholders, especially small agricultural users who, as the largest water users, rely on traditional informal irrigation management with irrigation efficiency below 20% [93], has also contributed to the issue. Conflicts between small agricultural water users and large-scale commercial farms (coffee, sisal, flowers, sugarcane, etc.) in terms of water access capacity and opportunities occur due to the lack of coordinated water planning and inefficient water use. As key active elements in social–ecological systems, the claims of different stakeholder groups at the social level should be considered fully by social–ecological system managers to develop effective and equitable governance rules [94].
Table 2. Overview of the main pollutants released from the LVB and their sources.
WastesMajor SourcesStudy LocationReference
Heavy metals
Pb, Cd, Cu, Zn, Cr
Emissions from industrial production, metallurgy, chemical industry, electroplating, and leather industry.Industrial areas around Lake Victoria, such as Entebbe and Kampala (Uganda), Kisumu (Kenya), Musaka (Tanzania), and Kenyan River Basin Rivers and Sediment.[95,96,97,98]
Fertilizers, pesticides in agriculture, urban sewage, and domestic waste.Non-point agricultural operations, urban and rural settlements, rift valley lakes in Kenya, Mwanza Bay Wetlands (Tanzania).[99,100,101,102]
Hg, CrEmissions from gold mining and tanning industry.Tanzania Gold Mining Area, Napoleon and Winam Gulfs, Kampala, and Kisumu.[103,104,105]
Nutrient pollution
Nitrogenous and Phosphorus contaminants
Agricultural runoffAgricultural regions in Kenya, Uganda, and Tanzania.[106]
Domestic sewage and industrial wastewater.Kampala (Uganda), Kisumu (Kenya), and other cities along the lake.[87,107,108]
Lakeside Industry (Wastewater discharge from food processing, leather making, and chemical industries, especially phosphorus emissions).Industrially concentrated areas such as Kampala, Entebbe, and Musaka.[109,110]

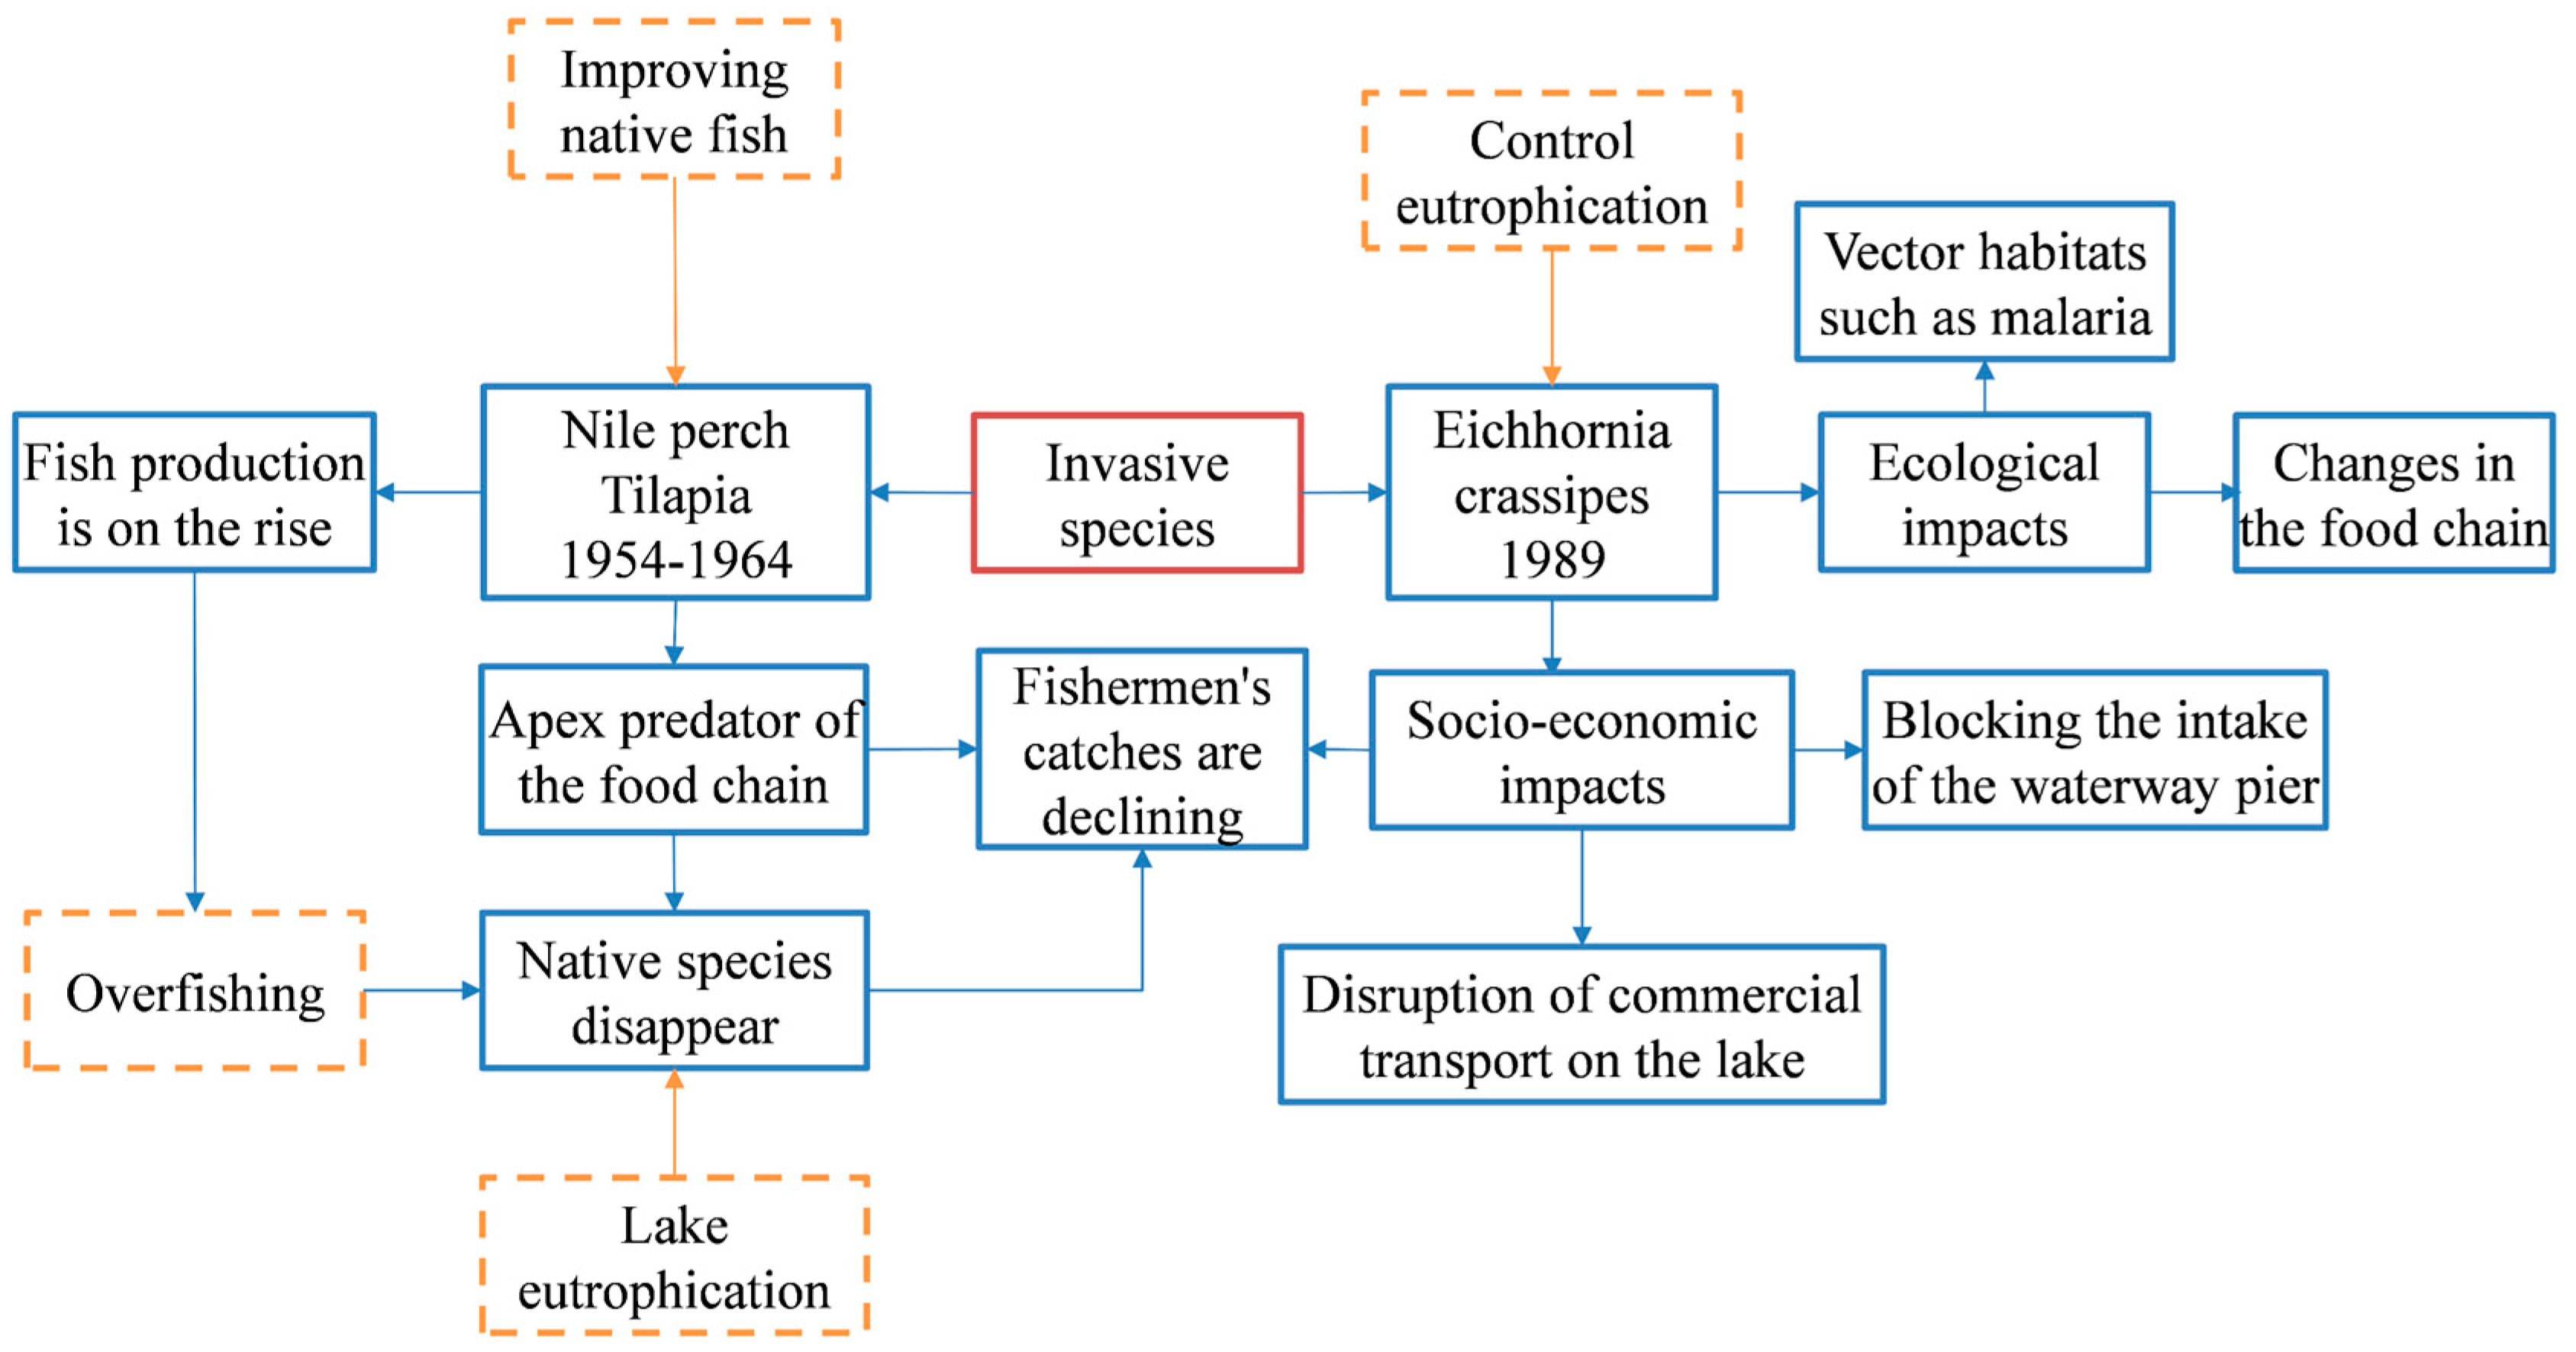
3.5. Relationship Between Water Ecological Degradation and Species Invasions

The introduction of invasive species and overfishing are key drivers that exacerbate the deterioration of the LV aquatic ecosystem and the decline of biodiversity [111,112]. Within our LVBW-SES framework, the invasion of alien species is a critical component of the water ecological subsystem, directly impacting the lake’s biodiversity and trophic structure. Figure 8 illustrates the conceptualized relationships between the relevant factors. Since their introduction in the late 1950s, Nile perch (Lates niloticus) and tilapia (Oreochromis niloticus) quickly became top predators in the food chain. This introduction led to the rapid reproduction of exotic species in the late 1970s and early 1980s, triggering overfishing of local fisheries. The result was the extinction or near-extinction of hundreds of native fish species and a shift in the fishery structure from diversification to homogenization dominated by Nile perch, tilapia, and carp [113,114].
In the 1990s, the rapid spread of exotic water hyacinths became a notable manifestation of the deterioration of LV’s water ecology [115]. Although the spread of water hyacinth has been suppressed to a certain extent by biological and physical management means since the late 1990s [116]; for example, during the early 2000s, the Lake Victoria Environmental Management Project (LVEMP) was established by the United Nations Development Program (UNDP) to address environmental challenges such as eutrophication and biodiversity loss. But the possibility of its re-emergence still exists [74], and the threat to the biodiversity of the lake and its surrounding areas has not yet been addressed effectively. The invasion of invasive species not only destroys the ecological balance of the lake but also exacerbates the loss of biodiversity, causing far-reaching negative impacts on the life and economic development of residents.

4. Discussion

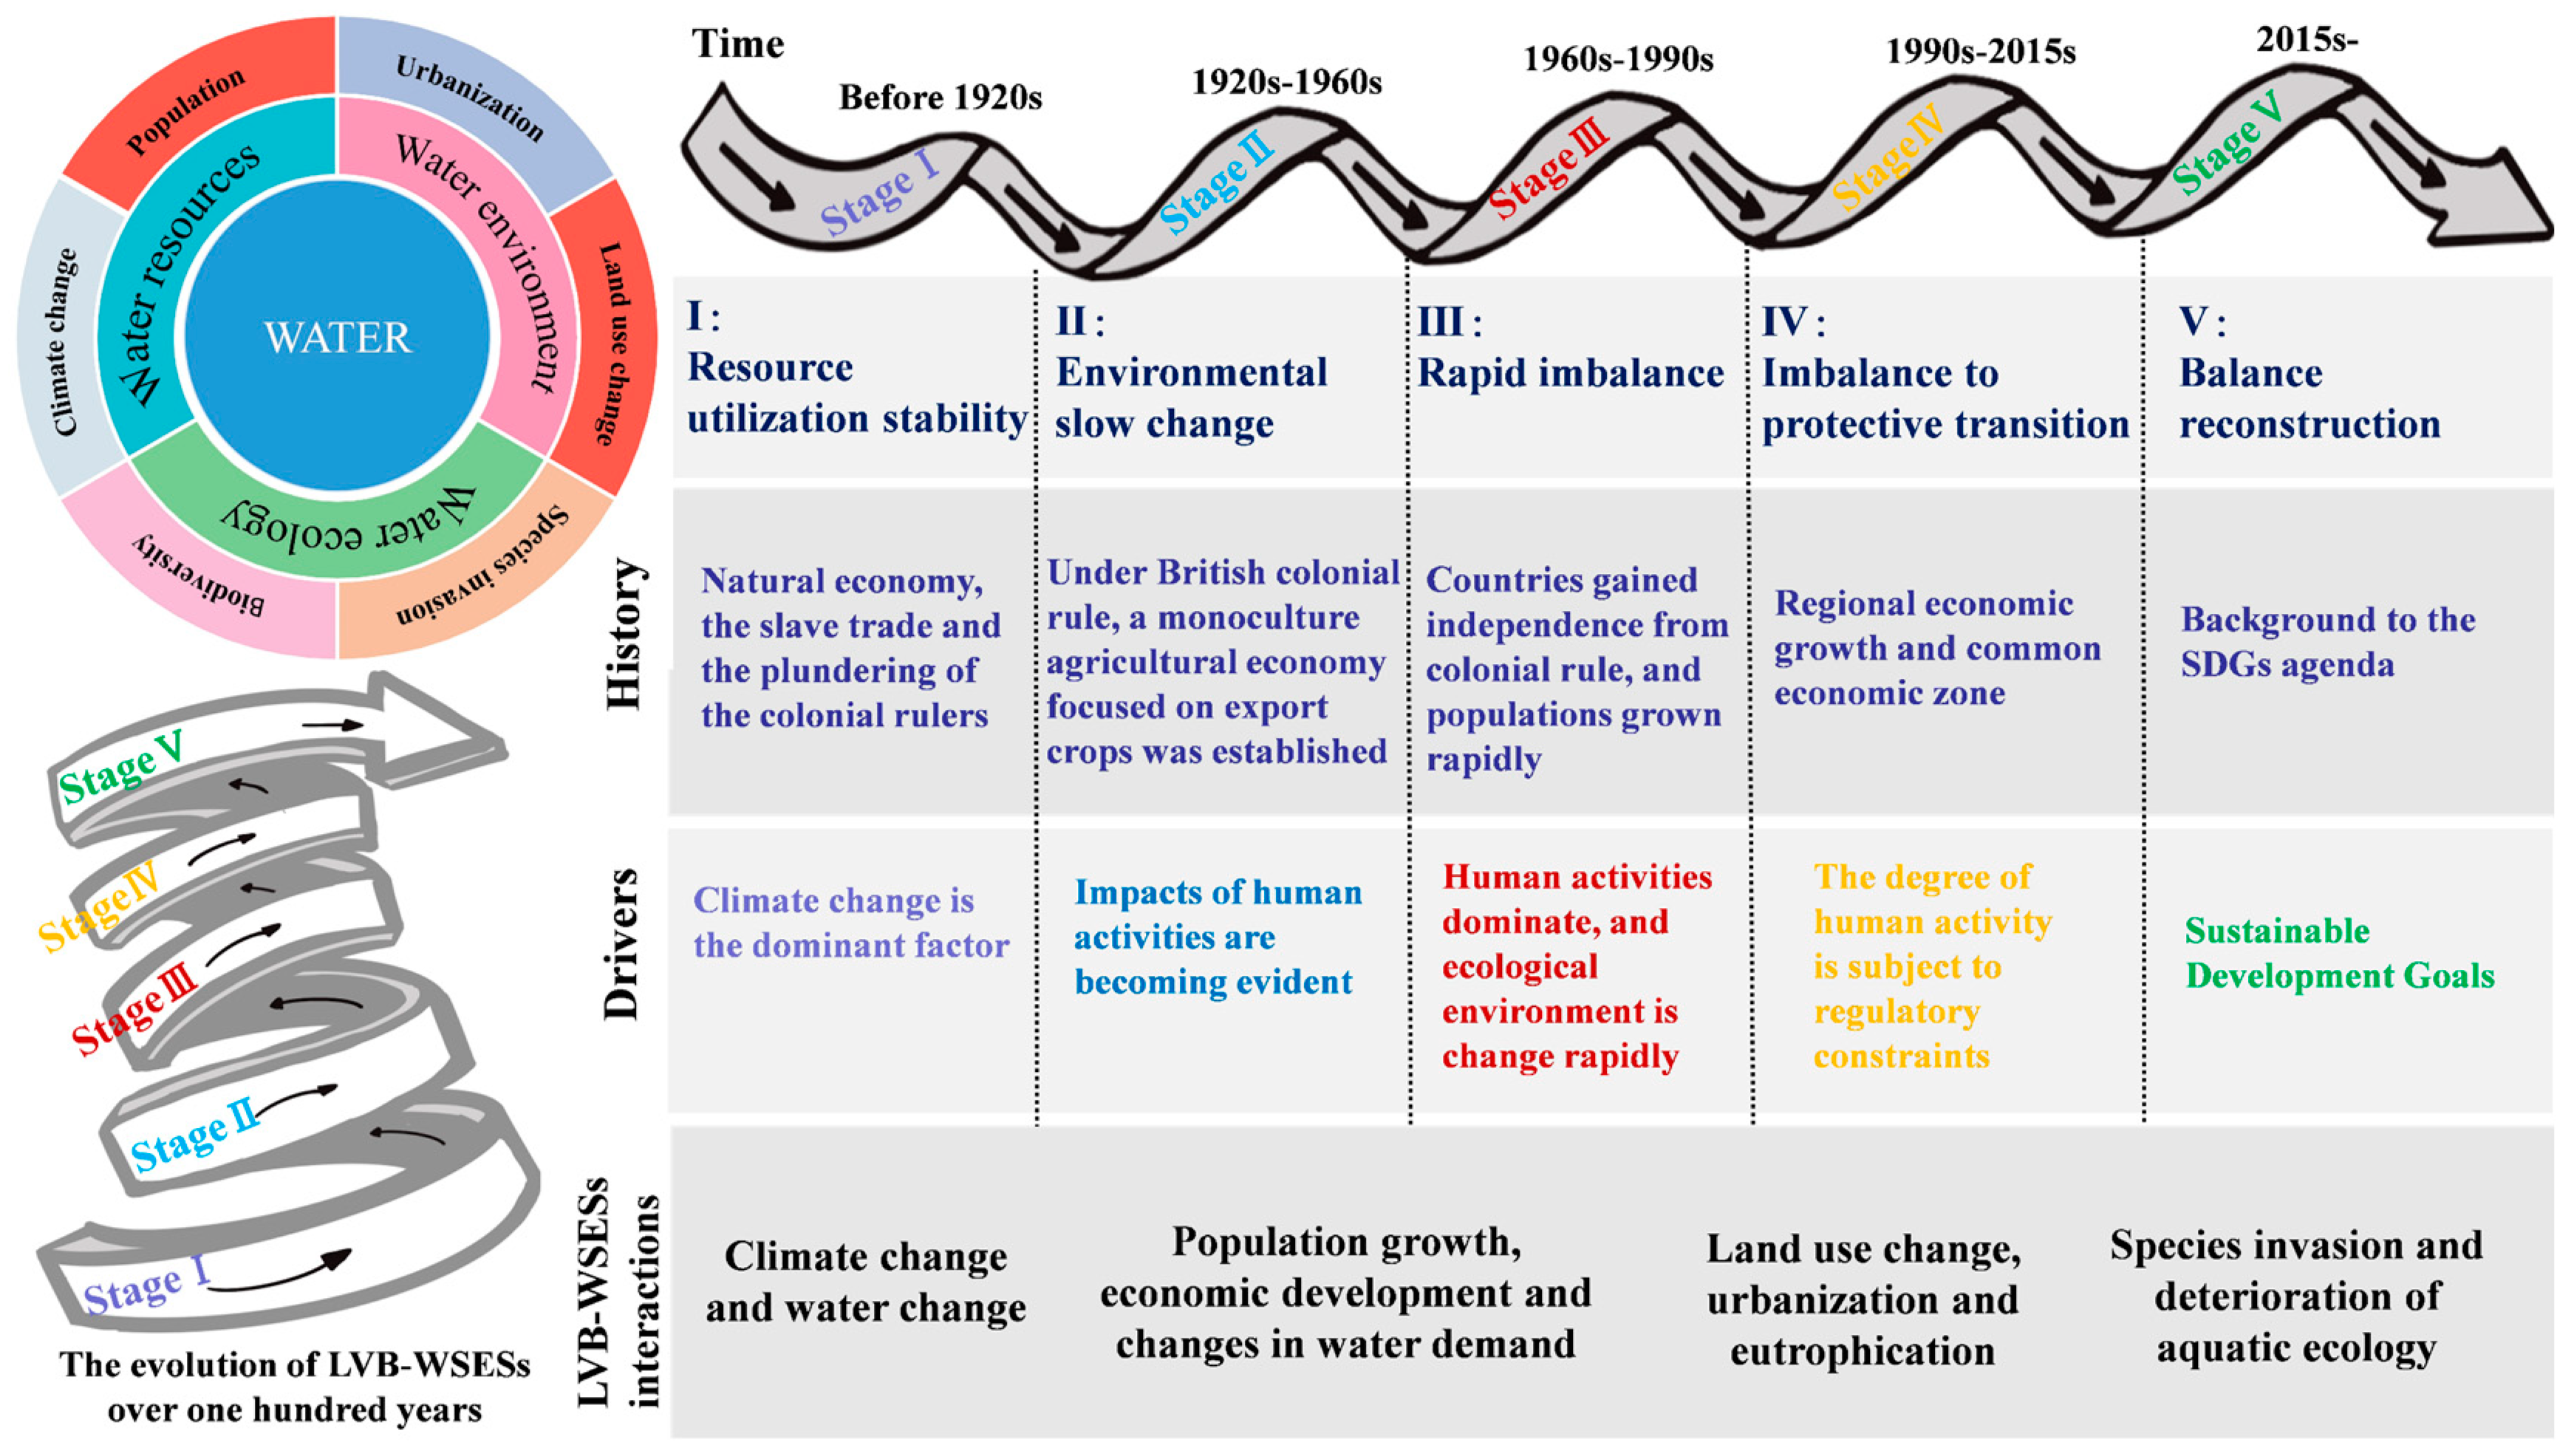
4.1. Stages in the Evolution of LVB Water–Social Ecosystems in the Last 100 Years

Findings from the LVB indicate the occurrence of dynamic and complex interactions between the basin’s water, social, and ecological systems over the last hundred years and that the impacts of human activities in the social system on the other systems have been particularly significant. Studies have been conducted to verify the feasibility of determining the regime shift approach for social–ecological systems (SESs) by analyzing the changes in the relationships among their components [117]. Thus, this paper combined the changing characteristics of the water–socioecological systems with social needs and historical context to identify the cyclic phases of water–socioecological systems evolution in the LVB in the last 100 years (Figure 9): pre-1920s, 1920s to 1960s, 1960s to 1990s, 1990s to 2015, and 2015 to present. These five stages include the stable resource utilization period, the slow environmental change period, the rapid environmental imbalance period, the transition period from environmental imbalance to protection, and the reconstruction period of socioecological equilibrium.
The first stage (before the 1920s) was “the stable resource utilization period”. The LVB was primarily a natural economy. During this period, the basin experienced slave trade and plundering by colonial rulers, and because of the long period of isolation from the outside world, the socioecological development lagged, and the overall change was slow.
The second stage (1920s to 1960s) was the “the slow environmental change period”. Under British colonial rule, the LVB gradually developed a single cultivation agricultural based on the export of cash crops. The large-scale production of cotton, sisal, and coffee plantations by the colonizers provided industrial raw materials and sales markets for the host country, promoting the gradual development of the basin’s socioecological development. However, monoculture practices led to soil degradation and biodiversity loss, as evidenced by widespread soil erosion in coffee plantations during this time [118]. This period underscores the risks of relying on single-crop economies.
The third stage (1960s to 1990s) was the “the rapid environmental imbalance period”. During this period, the major countries in the LVB gained independence from colonial rule one after another, and the population grew rapidly. The basin underwent rapid and profound socioecological changes driven by external influences and domestic economic development needs. The expansion of arable land and construction land, while meeting food and development needs, came at the cost of declining forest cover and degradation of wetlands, leading to increasingly prominent environmental problems. This stage highlights critical failures in land-use planning and resource exploitation without long-term ecological consideration, as seen in deforestation and wetland degradation. Such practices caused severe biodiversity loss and water quality decline in LV, documented by the decline of native fish species like Lates niloticus [114].
The fourth stage (1990s to 2015) is “the transition period from environmental imbalance to protection”. The water–socioecological systems of the LVB was once caught in a vicious circle due to the continuation of the problems left over from the third phase. While promoting economic development, countries gradually began to recognize the enduring legacy on deforestation, wetland destruction, and invasive species on ecosystem degradation. In this context, the basin was officially designated as a Regional Economic Growth Zone and an Area of Common Economic Interest for the people of East Africa, and the socioecological system entered a transitional phase from imbalance to conservation. Despite progress in recognizing environmental issues during this period, challenges arose in implementing conservation policies without local community involvement, as seen in conflicts over fishery management on Mfangano Island. This highlights the importance of integrating local stakeholders into conservation efforts [119].
The fifth stage (2015 to present) is “the reconstruction period of socioecological equilibrium”. Driven by the Sustainable Development Goals agenda, projects such as afforestation, wetland restoration, and water ecology management have been gradually implemented in the LVB. Recent studies indicate that between 2015 and 2020, approximately 3000 hectares of wetlands were restored in the basin, with vegetation coverage increasing by over 15% in some areas [120]. Although countries still need to balance their priorities between economic development and environmental protection, monitoring data shows improvements in water quality indicators such as reduced phosphorus concentrations (down by ~20%) and increased biodiversity metrics like a 10% rise in aquatic plant species diversity [121]. These efforts underscore the basin’s gradual transition toward socioecological equilibrium.

4.2. Implications for Watershed Management

This case study of the LVB is of great significance in watershed management. As a multi-scale and dynamic hierarchical structure, the social–ecological system provides an integrated perspective for exploring the interactions between social systems and ecosystems, which avoids the isolated analysis of a single system (social or ecological). The “water–socioecological systems” aims to consider the synergistic development strategies of the three systems comprehensively. Compared to “socio-hydrology” theory, the WSES framework provides a more comprehensive perspective because it explicitly incorporates ecological feedback and social needs into water resource management strategies. Feedback within the system indicates that efficient allocation of water resources not only helps to provide stability for socioeconomic development but also maintains and enhances the health of the ecosystems. At the same time, socioeconomic development also improves the efficiency of water use and promotes ecological restoration. However, in the case of LV, for example, the introduction of exotic species (Nile perch and tilapia) in the late 1950s, while meeting the social demand for increased fish supply at the time, neglected the negative impacts on native fish and lake ecosystems and seriously harmed biodiversity. Integrated management is a coordinated approach that integrates policies, practices, and stakeholders across sectors (e.g., water resource management, land-use planning, and ecological conservation) to achieve sustainable outcomes for water–socioecological systems. Considering system externalities, strengthening this integrated management framework not only promotes the sustainable governance of water resources and ecosystems in transboundary basins but also provides a critical pathway toward realizing high-quality development in the LVB.
This case study of the LVB also raises a key question: how much of society’s needs can the ecosystem sustain in the future? The LV water–socioecological systems is facing sustainability challenges in the context of environmental change. Concretely, in the context of climate change, population growth, and urbanization, the mismatch between societal demands and ecosystem carrying capacity has become increasingly pronounced in the LVB. For instance, agricultural expansion within the basin has led to reduced forest cover and wetland degradation, posing significant threats to lake ecosystems and water quality. Concurrently, the over-exploitation of fishery resources has impacted local livelihood security and food safety. Therefore, there is an urgent need to strike a balance between socioeconomic development and ecological conservation in the LVB to ensure sustainable resource utilization. Addressing these challenges requires a deeper understanding of inter-system feedback and interaction processes, improving the adaptive capacity of the system, and taking adaptive decisions to avoid ecological degradation or falling into poverty–environmental traps (e.g., LV eutrophication and watershed land degradation, among other issues). Therefore, for similar ecologically endowed areas such as the LVB, we should be vigilant and avoid falling into the “compensation trap” pattern. Many cases have shown that the “pollute first, clean up later” model of development is very costly. For example, the rapid socioeconomic development following China’s reform and opening-up policy in the 1980s presented significant challenges to maintaining the ecological integrity of Lakes Taihu and Chaohu as freshwater ecosystems within the Yangtze River Basin [122,123]. Despite later realizing the importance of ecological civilization construction and investing more than RMB 100 billion in governance, ecosystem recovery still takes a long time [124]. If institutional reforms lead to the loss of ecological resilience, the cost of restoring ecological stability will be even higher. This underscores the importance of proactive planning and preventive management in achieving sustainable development.

5. Conclusions

This study proposes a theoretical framework for the study of basin water–socioecological systems, and from a basin perspective, it integrates water system, social, and ecosystem changes to reveal the dynamic patterns of change in the water, social, and ecological systems, and the inter-system feedback relationships in the LVB in East Africa over one hundred years. This study clarified that resource utilization in the LVB has gone through five stages of evolution: a period of naturally stable utilization, a period of slow change, a period of rapid imbalance, a transition period from imbalance to conservation, and a period of gradual re-establishment of ecological balance.
The results of this study indicate that significant feedback loops driven by social demands in the LVB-WSESs have occurred for nearly a century. Social demands have contributed to the increasing scale and rate of anthropogenic activities that have reshaped the relationships between water, social, and ecological systems in the basin, particularly after the 1960s. Measures taken in response to climate change, urbanization, and economic development (e.g., construction of water facilities, deforestation, expansion of arable land and construction land, introduction of exotic fish species, etc.) while meeting social demands in the short term have caused severe damage to ecosystems. The lag in corresponding social policies has further exacerbated system imbalances, leading to socioecological systems going through different stages of evolution. While certain drivers can be managed at the local level, achieving sustainable development of watershed resources remains a daunting challenge in the absence of transboundary watershed cooperation.
From the perspective of comprehensive basin-wide management, it has become both necessary and urgent to develop transboundary management strategies to mitigate the risks posed by human activities to water–socioecological systems. Achieving this objective can be realized through strengthening regional cooperation mechanisms, promoting adaptive management, and implementing ecological restoration and conservation measures. For example, we recommend that riparian nations establish a transboundary governance framework that integrates watershed management, ecological restoration, and sustainable development goals. Such a framework could include mechanisms for coordinated water resource allocation, joint monitoring of ecosystem health, and shared funding for conservation efforts. By formulating flexible management strategies that account for dynamic demands driven by climate change and socioeconomic development, the system’s adaptive capacity can be enhanced. Additionally, ecological restoration measures such as afforestation, wetland rehabilitation, and invasive species control can improve the functioning of basin ecosystems. These approaches are not only applicable to the LVB but also provide valuable references for sustainable development in other similar regions. As a typical case of a gradual transition from ecological degradation to conservation under anthropogenic intervention, we hope that this LVB study will serve as a warning for other similar areas and promote more sustainable development practices.

Author Contributions

Conceptualization, X.Z. and Q.G.; methodology, X.Z.; software, X.Z., M.W. and S.J.; validation, Q.G.; formal analysis, X.Z. and M.W.; investigation, X.Z., M.W., S.J., Q.G.; resources, Q.G. and I.A.K.; data curation, X.Z.; writing—original draft preparation, X.Z.; writing—review and editing, X.Z. and Q.G.; visualization, X.Z. and M.W.; supervision, Q.G.; project administration, Q.G. and I.A.K.; funding acquisition, Q.G. All authors have read and agreed to the published version of the manuscript.

Funding

This research was funded by International Partnership Program of Chinese Academy of Sciences, grant number 045GJHZ2024045FN.

Data Availability Statement

The original contributions presented in the study are included in the article, further inquiries can be directed to the corresponding author.

Conflicts of Interest

The authors declare no conflicts of interest.

References

  1. Mosaffaie, J.; Salehpour Jam, A.; Tabatabaei, M.R.; Kousari, M.R. Trend Assessment of the Watershed Health Based on DPSIR Framework. Land Use Policy 2021, 100, 104911. [Google Scholar] [CrossRef]
  2. Vörösmarty, C.J.; Green, P.; Salisbury, J.; Lammers, R.B. Global Water Resources: Vulnerability from Climate Change and Population Growth. Science 2000, 289, 284–288. [Google Scholar] [CrossRef] [PubMed]
  3. Jun, X.; Chen, Y.D. Water Problems and Opportunities in the Hydrological Sciences in China. Hydrol. Sci. J. 2001, 46, 907–921. [Google Scholar] [CrossRef]
  4. Sivapalan, M.; Savenije, H.H.G.; Blöschl, G. Socio-hydrology: A New Science of People and Water. Hydrol. Process. 2012, 26, 1270–1276. [Google Scholar] [CrossRef]
  5. Vörösmarty, C.J.; Pahl-Wostl, C.; Bunn, S.E.; Lawford, R. Global Water, the Anthropocene and the Transformation of a Science. Curr. Opin. Environ. Sustain. 2013, 5, 539–550. [Google Scholar] [CrossRef]
  6. Ostrom, E. A General Framework for Analyzing Sustainability of Social-Ecological Systems. Science 2009, 325, 419–422. [Google Scholar] [CrossRef]
  7. Berkes, F.; Kislalioglu, M.; Folke, C.; Gadgil, M. Minireviews: Exploring the Basic Ecological Unit: Ecosystem-like Concepts in Traditional Societies. Ecosystems 1998, 1, 409–415. [Google Scholar] [CrossRef]
  8. Challies, E.; Newig, J.; Lenschow, A. What Role for Social–Ecological Systems Research in Governing Global Teleconnections? Glob. Environ. Chang. 2014, 27, 32–40. [Google Scholar] [CrossRef]
  9. Birkmann, J. Risk and Vulnerability Indicators at Different Scales: Applicability, Usefulness and Policy Implications. Environ. Hazards 2007, 7, 20–31. [Google Scholar] [CrossRef]
  10. Bolaños-Valencia, I.; Villegas-Palacio, C.; López-Gómez, C.P.; Berrouet, L.; Ruiz, A. Social Perception of Risk in Socio-Ecological Systems. A Qualitative and Quantitative Analysis. Ecosyst. Serv. 2019, 38, 100942. [Google Scholar] [CrossRef]
  11. Santana, S.E.; Barroso, G.F. Integrated Ecosystem Management of River Basins and the Coastal Zone in Brazil. Water Resour. Manag. 2014, 28, 4927–4942. [Google Scholar] [CrossRef]
  12. Elsawah, A.M.; Qin, H. Lower Bound of Centered L 2 -Discrepancy for Mixed Two and Three Levels U -Type Designs. J. Stat. Plan. Inference 2015, 161, 1–11. [Google Scholar] [CrossRef]
  13. Kanyuuru, C.K.; Mburu, J.; Njoka, J. Adaptation of Institutional Arrangements to Management of Northern Rangelands of Kenya. Environ. Dev. Sustain. 2017, 19, 67–82. [Google Scholar] [CrossRef]
  14. Mayer, A.; Winkler, R.; Fry, L. Classification of Watersheds into Integrated Social and Biophysical Indicators with Clustering Analysis. Ecol. Indic. 2014, 45, 340–349. [Google Scholar] [CrossRef]
  15. Mahabadi, S.A.; Bavani, A.R.M.; Bgheri, A. Improving Adaptive Capacity of Social-Ecological System of Tashk-Bakhtegan Lake Basin to Climate Change Effects—A Methodology Based on Post-Modern Portfolio Theory. Ecohydrol. Hydrobiol. 2018, 18, 365–378. [Google Scholar] [CrossRef]
  16. Kalantari, Z.; Santos Ferreira, C.S.; Page, J.; Goldenberg, R.; Olsson, J.; Destouni, G. Meeting Sustainable Development Challenges in Growing Cities: Coupled Social-Ecological Systems Modeling of Land Use and Water Changes. J. Environ. Manag. 2019, 245, 471–480. [Google Scholar] [CrossRef] [PubMed]
  17. Yu, G.; Li, M.; Tu, Z.; Yu, Q.; Jie, Y.; Xu, L.; Dang, Y.; Chen, X. Conjugated Evolution of Regional Social-Ecological System Driven by Land Use and Land Cover Change. Ecol. Indic. 2018, 89, 213–226. [Google Scholar] [CrossRef]
  18. Cabello, V.; Willaarts, B.A.; Aguilar, M.; Del Moral Ituarte, L. River Basins as Social-Ecological Systems: Linking Levels of Societal and Ecosystem Water Metabolism in a Semiarid Watershed. Ecol. Soc. 2015, 20, 20. [Google Scholar] [CrossRef]
  19. Lufafa, A.; Tenywa, M.M.; Isabirye, M.; Majaliwa, M.J.G.; Woomer, P.L. Prediction of Soil Erosion in a Lake Victoria Basin Catchment Using a GIS-Based Universal Soil Loss Model. Agric. Syst. 2003, 76, 883–894. [Google Scholar] [CrossRef]
  20. Olaka, L.A.; Odada, E.O.; Trauth, M.H.; Olago, D.O. The Sensitivity of East African Rift Lakes to Climate Fluctuations. J. Paleolimnol. 2010, 44, 629–644. [Google Scholar] [CrossRef]
  21. Adger, W.N.; Vincent, K. Uncertainty in Adaptive Capacity. Comptes Rendus Géosci. 2005, 337, 399–410. [Google Scholar] [CrossRef]
  22. Castro, J.E. Water Governance in the Twentieth-First Century. Ambient. Soc. 2007, 10, 97–118. [Google Scholar] [CrossRef]
  23. Dobiesz, N.E.; Hecky, R.E.; Johnson, T.B.; Sarvala, J.; Dettmers, J.M.; Lehtiniemi, M.; Rudstam, L.G.; Madenjian, C.P.; Witte, F. Metrics of Ecosystem Status for Large Aquatic Systems—A Global Comparison. J. Gt. Lakes Res. 2010, 36, 123–138. [Google Scholar] [CrossRef]
  24. Awange, J.L.; Saleem, A.; Sukhadiya, R.M.; Ouma, Y.O.; Kexiang, H. Physical Dynamics of Lake Victoria over the Past 34 Years (1984–2018): Is the Lake Dying? Sci. Total Environ. 2019, 658, 199–218. [Google Scholar] [CrossRef] [PubMed]
  25. Njiru, M.; Mkumbo, O.C.; van der Knaap, M. Some Possible Factors Leading to Decline in Fish Species in Lake Victoria. Aquat. Ecosyst. Health Manag. 2010, 13, 3–10. [Google Scholar] [CrossRef]
  26. Kizza, M.; Rodhe, A.; Xu, C.-Y.; Ntale, H.K.; Halldin, S. Temporal Rainfall Variability in the Lake Victoria Basin in East Africa during the Twentieth Century. Theor. Appl. Climatol. 2009, 98, 119–135. [Google Scholar] [CrossRef]
  27. Awange, J.L.; Sharifi, M.A.; Ogonda, G.; Wickert, J.; Grafarend, E.W.; Omulo, M.A. The Falling Lake Victoria Water Level: GRACE, TRIMM and CHAMP Satellite Analysis of the Lake Basin. Water Resour. Manag. 2008, 22, 775–796. [Google Scholar] [CrossRef]
  28. Kizza, M.; Westerberg, I.; Rodhe, A.; Ntale, H.K. Estimating Areal Rainfall over Lake Victoria and Its Basin Using Ground-Based and Satellite Data. J. Hydrol. 2012, 464–465, 401–411. [Google Scholar] [CrossRef]
  29. Nicholson, S.E. Climate and Climatic Variability of Rainfall over Eastern Africa. Rev. Geophys. 2017, 55, 590–635. [Google Scholar] [CrossRef]
  30. Song, Y.; Semazzi, F.H.M.; Xie, L.; Ogallo, L.J. A Coupled Regional Climate Model for the Lake Victoria Basin of East Africa. Int. J. Climatol. 2004, 24, 57–75. [Google Scholar] [CrossRef]
  31. Olokotum, M.; Mitroi, V.; Troussellier, M.; Semyalo, R.; Bernard, C.; Montuelle, B.; Okello, W.; Quiblier, C.; Humbert, J.-F. A Review of the Socioecological Causes and Consequences of Cyanobacterial Blooms in Lake Victoria. Harmful Algae 2020, 96, 101829. [Google Scholar] [CrossRef] [PubMed]
  32. Prodanovic, P.; Simonovic, S.P. An Operational Model for Support of Integrated Watershed Management. Water Resour. Manag. 2010, 24, 1161–1194. [Google Scholar] [CrossRef]
  33. Pietroiusti, R.; Vanderkelen, I.; Otto, F.E.L.; Barnes, C.; Temple, L.; Akurut, M.; Bally, P.; Van Lipzig, N.P.M.; Thiery, W. Possible Role of Anthropogenic Climate Change in the Record-Breaking 2020 Lake Victoria Levels and Floods. Earth Syst. Dyn. 2024, 15, 225–264. [Google Scholar] [CrossRef]
  34. Wang, X.; Shi, K.; Qin, B.; Zhang, Y.; Woolway, R.I. Disproportionate Impact of Atmospheric Heat Events on Lake Surface Water Temperature Increases. Nat. Clim. Chang. 2024, 14, 1172–1177. [Google Scholar] [CrossRef]
  35. Wu, G.; Chen, C.; Liu, Y.; Fan, X.; Niu, H.; Liu, Y. Developing a High-Resolution Seamless Surface Water Extent Time-Series over Lake Victoria by Integrating MODIS and Landsat Data. Remote Sens. 2023, 15, 3500. [Google Scholar] [CrossRef]
  36. Ma, J.; Loiselle, S.; Cao, Z.; Qi, T.; Shen, M.; Luo, J.; Song, K.; Duan, H. Unbalanced Impacts of Nature and Nurture Factors on the Phenology, Area and Intensity of Algal Blooms in Global Large Lakes: MODIS Observations. Sci. Total Environ. 2023, 880, 163376. [Google Scholar] [CrossRef]
  37. Funk, C.; Peterson, P.; Landsfeld, M.; Pedreros, D.; Verdin, J.; Shukla, S.; Husak, G.; Rowland, J.; Harrison, L.; Hoell, A.; et al. The Climate Hazards Infrared Precipitation with Stations—A New Environmental Record for Monitoring Extremes. Sci Data 2015, 2, 150066. [Google Scholar] [CrossRef]
  38. World Population Prospects. Available online: https://population.un.org/wpp/ (accessed on 4 March 2025).
  39. Open Spatial Demographic Data and Research. Available online: https://www.worldpop.org/ (accessed on 4 March 2025).
  40. United Nations. 2018 Revision of World Urbanization Prospects. Available online: https://www.un.org/en/desa/2018-revision-world-urbanization-prospects (accessed on 4 March 2025).
  41. Zhang, X.; Liu, L.; Chen, X.; Gao, Y.; Xie, S.; Mi, J. GLC_FCS30: Global Land-Cover Product with Fine Classification System at 30 m Using Time-Series Landsat Imagery. Earth Syst. Sci. Data 2021, 13, 2753–2776. [Google Scholar] [CrossRef]
  42. McGinnis, M.D.; Ostrom, E. Social-Ecological System Framework: Initial Changes and Continuing Challenges. Ecol. Soc. 2014, 19, 30. [Google Scholar] [CrossRef]
  43. Shahin, M.M.A. Hydrology of the Nile Basin; Elsevier: Amsterdam, The Netherlands, 1985; ISBN 978-0-08-088756-2. [Google Scholar]
  44. Lemoalle, J.; Bader, J.-C.; Leblanc, M.; Sedick, A. Recent Changes in Lake Chad: Observations, Simulations and Management Options (1973–2011). Glob. Planet. Chang. 2012, 80–81, 247–254. [Google Scholar] [CrossRef]
  45. Pavur, G.; Lakshmi, V. Observing the Recent Floods and Drought in the Lake Victoria Basin Using Earth Observations and Hydrological Anomalies. J. Hydrol. Reg. Stud. 2023, 46, 101347. [Google Scholar] [CrossRef]
  46. Wasige, J.E.; Groen, T.A.; Smaling, E.; Jetten, V. Monitoring Basin-Scale Land Cover Changes in Kagera Basin of Lake Victoria Using Ancillary Data and Remote Sensing. Int. J. Appl. Earth Obs. Geoinf. 2013, 21, 32–42. [Google Scholar] [CrossRef]
  47. Nyeko-Ogiramoi, P. Trend and Variability in Observed Hydrometeorological Extremes in the Lake Victoria Basin. J. Hydrol. 2013, 489, 56–73. [Google Scholar] [CrossRef]
  48. Getirana, A.; Jung, H.C.; Van Den Hoek, J.; Ndehedehe, C.E. Hydropower Dam Operation Strongly Controls Lake Victoria’s Freshwater Storage Variability. Sci. Total Environ. 2020, 726, 138343. [Google Scholar] [CrossRef] [PubMed]
  49. Umwali, E.D.; Chen, X.; Ma, X.; Guo, Z.; Mbigi, D.; Zhang, Z.; Umugwaneza, A.; Gasirabo, A.; Umuhoza, J. Integrated SSP-RCP Scenarios for Modeling the Impacts of Climate Change and Land Use on Ecosystem Services in East Africa. Ecol. Model. 2025, 504, 111092. [Google Scholar] [CrossRef]
  50. Piper, B.S.; Plinston, D.T.; Sutcliffe, J.V. The Water Balance of Lake Victoria. Hydrol. Sci. J. 1986, 31, 25–37. [Google Scholar] [CrossRef]
  51. Sewagudde, S. Lake Victoria’s Water Budget and the Potential Effects of Climate Change in the 21st Century. Afr. J. Trop. Hydrobiol. Fish. 2009, 12, 22–30. [Google Scholar] [CrossRef]
  52. Mistry, V.V.; Conway, D. Remote Forcing of East African Rainfall and Relationships with Fluctuations in Levels of Lake Victoria. Int. J. Climatol. 2003, 23, 67–89. [Google Scholar] [CrossRef]
  53. Sene, K.; Houghton Carr, H.; Tych, W. Reflections on Almost a Century of Hydrological Studies on Africa’s Largest Lake. Proc. Int. Assoc. Hydrol. Sci. 2021, 384, 141–147. [Google Scholar] [CrossRef]
  54. Omondi, P.; Awange, J.L.; Ogallo, L.A.; Okoola, R.A.; Forootan, E. Decadal Rainfall Variability Modes in Observed Rainfall Records over East Africa and Their Relations to Historical Sea Surface Temperature Changes. J. Hydrol. 2012, 464–465, 140–156. [Google Scholar] [CrossRef]
  55. Omondi, P.; Awange, J.L.; Ogallo, L.A.; Ininda, J.; Forootan, E. The Influence of Low Frequency Sea Surface Temperature Modes on Delineated Decadal Rainfall Zones in Eastern Africa Region. Adv. Water Resour. 2013, 54, 161–180. [Google Scholar] [CrossRef]
  56. Muyodi, F.J.; Bugenyi, F.W.B.; Hecky, R.E. Experiences and Lessons Learned from Interventions in the Lake Victoria Basin: The Lake Victoria Environmental Management Project. Lakes Reserv. Sci. Policy Manag. Sustain. Use 2010, 15, 77–88. [Google Scholar] [CrossRef]
  57. Kite, G.W. Recent Changes in Level of Lake Victoria / Récents Changements Enregistrés Dans Le Niveau Du Lac Victoria. Hydrol. Sci. Bull. 1981, 26, 233–243. [Google Scholar] [CrossRef]
  58. Anyah, R.O.; Semazzi, F.H.M. Variability of East African Rainfall Based on Multiyear Regcm3 Simulations. Int. J. Climatol. 2007, 27, 357–371. [Google Scholar] [CrossRef]
  59. Shinhu, R.J.; Amasi, A.I.; Wynants, M.; Nobert, J.; Mtei, K.M.; Njau, K.N. Assessing the Impacts of Land Use and Climate Changes on River Discharge towards Lake Victoria. Earth 2023, 4, 365–383. [Google Scholar] [CrossRef]
  60. Vanderkelen, I.; Van Lipzig, N.P.M.; Thiery, W. Modelling the Water Balance of Lake Victoria (East Africa)—Part 2: Future Projections. Hydrol. Earth Syst. Sci. 2018, 22, 5527–5549. [Google Scholar] [CrossRef]
  61. Awange, J.L.; Anyah, R.; Agola, N.; Forootan, E.; Omondi, P. Potential Impacts of Climate and Environmental Change on the Stored Water of Lake Victoria Basin and Economic Implications: Impacts of Climate Change on Waters of Lake Victoria. Water Resour. Res. 2013, 49, 8160–8173. [Google Scholar] [CrossRef]
  62. Awange, J. Lake Victoria Monitored from Space; Springer International Publishing: Cham, Switzerland, 2021; ISBN 978-3-030-60550-6. [Google Scholar]
  63. Marshall, B.; Ezekiel, C.; Gichuki, J.; Mkumbo, O.; Sitoki, L.; Wanda, F. Global Warming Is Reducing Thermal Stability and Mitigating the Effects of Eutrophication in Lake Victoria (East Africa). Nat. Preced. 2009. [Google Scholar] [CrossRef]
  64. Coughlan De Perez, E.; Van Aalst, M.; Choularton, R.; Van Den Hurk, B.; Mason, S.; Nissan, H.; Schwager, S. From Rain to Famine: Assessing the Utility of Rainfall Observations and Seasonal Forecasts to Anticipate Food Insecurity in East Africa. Food Sec. 2019, 11, 57–68. [Google Scholar] [CrossRef]
  65. Kansiime, F.; Saunders, M.J.; Loiselle, S.A. Functioning and Dynamics of Wetland Vegetation of Lake Victoria: An Overview. Wetl. Ecol. Manag. 2007, 15, 443–451. [Google Scholar] [CrossRef]
  66. Lung’ayia, H.; Sitoki, L.; Kenyanya, M. The Nutrient Enrichment of Lake Victoria (Kenyan Waters). Hydrobiologia 2001, 458, 75–82. [Google Scholar] [CrossRef]
  67. Kiwango, Y.A.; Wolanski, E. Papyrus Wetlands, Nutrients Balance, Fisheries Collapse, Food Security, and Lake Victoria Level Decline in 2000–2006. Wetl. Ecol. Manag. 2008, 16, 89–96. [Google Scholar] [CrossRef]
  68. Witte, F.; Silsbe, G.M.; Hecky, R.E.; Goudswaard, P.C.; Guildford, S.J.; Kishe-Machumu, M.A.; Wanink, J.H. Did the Loss of Phytoplanktivorous Fish Contribute to Algal Blooms in the Mwanza Gulf of Lake Victoria? Hydrobiologia 2012, 679, 283–296. [Google Scholar] [CrossRef]
  69. Cornelissen, I.J.M.; Silsbe, G.M.; Verreth, J.A.J.; Van Donk, E.; Nagelkerke, L.A.J. Dynamics and Limitations of Phytoplankton Biomass along a Gradient in Mwanza Gulf, Southern Lake Victoria (Tanzania). Freshw. Biol. 2014, 59, 127–141. [Google Scholar] [CrossRef]
  70. Kabenge, M.; Wang, H.; Li, F. Urban Eutrophication and Its Spurring Conditions in the Murchison Bay of Lake Victoria. Environ. Sci. Pollut. Res. 2016, 23, 234–241. [Google Scholar] [CrossRef]
  71. Wang, H.; Wang, T.; Toure, B.; Li, F. Protect Lake Victoria through Green Economy, Public Participation and Good Governance. Environ. Sci. Technol. 2012, 46, 10483–10484. [Google Scholar] [CrossRef] [PubMed]
  72. Njagi, D.M.; Routh, J.; Odhiambo, M.; Luo, C.; Basapuram, L.G.; Olago, D.; Klump, V.; Stager, C. A Century of Human-Induced Environmental Changes and the Combined Roles of Nutrients and Land Use in Lake Victoria Catchment on Eutrophication. Sci. Total Environ. 2022, 835, 155425. [Google Scholar] [CrossRef] [PubMed]
  73. Hecky, R.E. The Eutrophication of Lake Victoria. SIL Proc. 1922–2010 1993, 25, 39–48. [Google Scholar] [CrossRef]
  74. Hecky, R.E.; Mugidde, R.; Ramlal, P.S.; Talbot, M.R.; Kling, G.W. Multiple Stressors Cause Rapid Ecosystem Change in Lake Victoria. Freshw. Biol. 2010, 55, 19–42. [Google Scholar] [CrossRef]
  75. Maitima, J.M.; Olson, J.M.; Mugatha, S.M.; Mugisha, S.; Mutie, I.T. Land Use Changes, Impacts and Options for Sustaining Productivity and Livelihoods in the Basin of Lake Victoria. J. Sustain. Dev. Afr. 2010, 12, 1520–5509. [Google Scholar]
  76. Owiyo, P. The Effect of Dominion Irrigation Project on Environmental Conservation in Yala Swamp, Siaya District, Kenya. Int. J. Sci. Res. 2012, 3, SEP14549. [Google Scholar]
  77. Shadle, B.L. Rape in the Courts of Gusiiland, Kenya, 1940s–1960s. Afr. Stud. Rev. 2008, 51, 27–50. [Google Scholar] [CrossRef]
  78. Sondou, T.; Aholou, C.C.; Chenal, J. Territorial Coherence Through Urban Planning, Myth or Reality: Analysis of Planning Instruments in Ho (Ghana) and Kpalimé (Togo). Land 2025, 14, 81. [Google Scholar] [CrossRef]
  79. Mugo, J.N.; Karanja, N.N.; Gachene, C.K.; Dittert, K.; Nyawade, S.O.; Schulte-Geldermann, E. Assessment of Soil Fertility and Potato Crop Nutrient Status in Central and Eastern Highlands of Kenya. Sci. Rep. 2020, 10, 7779. [Google Scholar] [CrossRef] [PubMed]
  80. Food and Agriculture Organization of the United Nations. The State of Food and Agriculture 2015: Social Protection and Agriculture—Breaking the Cycle of Rural Poverty; The State of Food and Agriculture; UN: New York, NY, USA, 2015; ISBN 978-92-1-047314-9. [Google Scholar]
  81. Bullock, E.L.; Healey, S.P.; Yang, Z.; Oduor, P.; Gorelick, N.; Omondi, S.; Ouko, E.; Cohen, W.B. Three Decades of Land Cover Change in East Africa. Land 2021, 10, 150. [Google Scholar] [CrossRef]
  82. Jayne, T.S.; Chamberlin, J.; Headey, D.D. Land Pressures, the Evolution of Farming Systems, and Development Strategies in Africa: A Synthesis. Food Policy 2014, 48, 1–17. [Google Scholar] [CrossRef]
  83. Gidey, E.; Mhangara, P. An Application of Machine-Learning Model for Analyzing the Impact of Land-Use Change on Surface Water Resources in Gauteng Province, South Africa. Remote Sens. 2023, 15, 4092. [Google Scholar] [CrossRef]
  84. Matagi, S.V. Some Issues of Environmental Concern in Kampala, the Capital City of Uganda. Environ. Monit. Assess. 2002, 77, 121–138. [Google Scholar] [CrossRef]
  85. Ngupula, G.; Ezekiel, C.; Kimirei, I.; Mboni, E.; Kashindye, B. Physical and Chemical Characteristics of the Tanzanian Inshore and Offshore Waters of Lake Victoria in 2005–2008. Afr. J. Aquat. Sci. 2012, 37, 339–345. [Google Scholar] [CrossRef]
  86. Twesigye, C.K. The Impact of Land Use Activities on Vegetation Cover and Water Quality in the Lake Victoria Watershed. Open Environ. Eng. J. 2011, 4, 66–77. [Google Scholar] [CrossRef]
  87. Verschuren, D.; Johnson, T.C.; Kling, H.J.; Edgington, D.N.; Leavitt, P.R.; Brown, E.T.; Talbot, M.R.; Hecky, R.E. History and Timing of Human Impact on Lake Victoria, East Africa. Proc. Biol. Sci. 2002, 269, 289–294. [Google Scholar] [CrossRef] [PubMed]
  88. Ntiba, M.J.; Kudoja, W.M.; Mukasa, C.T. Management Issues in the Lake Victoria Watershed. Lakes Reserv. Sci. Policy Manag. Sustain. Use 2001, 6, 211–216. [Google Scholar] [CrossRef]
  89. Haande, S.; Rohrlack, T.; Semyalo, R.P.; Brettum, P.; Edvardsen, B.; Lyche-Solheim, A.; Sørensen, K.; Larsson, P. Phytoplankton Dynamics and Cyanobacterial Dominance in Murchison Bay of Lake Victoria (Uganda) in Relation to Environmental Conditions. Limnologica 2011, 41, 20–29. [Google Scholar] [CrossRef]
  90. Sitoki, L.; Kurmayer, R.; Rott, E. Spatial Variation of Phytoplankton Composition, Biovolume, and Resulting Microcystin Concentrations in the Nyanza Gulf (Lake Victoria, Kenya). Hydrobiologia 2012, 691, 109–122. [Google Scholar] [CrossRef]
  91. Tsamo, C.; Meali, D.S.; Assaouka, H.T. Studying the Impact of Anions Pre-Generated Iron Corrosion Products on the Efficiency of Contaminant Removal in Fe0/H2O Systems. J. Environ. Sci. Eng. B 2018, 7, 1–10. [Google Scholar] [CrossRef]
  92. Blakime, T.-H.; Adjonou, K.; Komi, K.; Hlovor, A.K.D.; Gbafa, K.S.; Zoungrana, J.-B.B.; Polorigni, B.; Kokou, K. Dynamics of Built-Up Areas and Challenges of Planning and Development of Urban Zone of Greater Lomé in Togo, West Africa. Land 2024, 13, 84. [Google Scholar] [CrossRef]
  93. Nakawuka, P.; Langan, S.; Schmitter, P.; Barron, J. A Review of Trends, Constraints and Opportunities of Smallholder Irrigation in East Africa. Glob. Food Secur. 2018, 17, 196–212. [Google Scholar] [CrossRef]
  94. Berthet, E.T.; Bretagnolle, V.; Gaba, S. Place-Based Social-Ecological Research Is Crucial for Designing Collective Management of Ecosystem Services. Ecosyst. Serv. 2022, 55, 101426. [Google Scholar] [CrossRef]
  95. Onyari, J.M.; Wandiga, S.O. Distribution of Cr, Pb, Cd, Zn, Fe and Mn in Lake Victoria Sediments, East Africa. Bull. Environ. Contam. Toxicol. 1989, 42, 807–813. [Google Scholar] [CrossRef]
  96. Scheren, P.A.G.M.; Bosboom, J.C.; Njau, K.K.; Lemmens, A.M.C. Assessment of Water Pollution in the Catchment Area of Lake Victoria, Tanzania. J. East. Afr. Res. Dev. 1995, 25, 129–143. [Google Scholar]
  97. Muwanga, A.; Barifaijo, E. Impact of Industrial Activities on Heavy Metal Loading and Their Physico-Chemical Effects on Wetlands of Lake Victoria Basin (Uganda). Afr. J. Sci. Technol. 2010, 7. [Google Scholar] [CrossRef]
  98. Shen, Q.; Friese, K.; Gao, Q.; Kimirei, I.A.; Kishe, M.A.; Chen, C.; Zhang, L.; Yu, C.; Wu, G.; Liu, Y. Accumulation Characteristics and Ecological Implications of Heavy Metals in Surface Sediments of the Mwanza Gulf, Lake Victoria. Environ. Monit. Assess. 2022, 194, 756. [Google Scholar] [CrossRef]
  99. Makundi, I.N. A Study of Heavy Metal Pollution in Lake Victoria Sediments by Energy Dispersive X-Ray Fluorescence. J. Environ. Sci. Health Part A 2001, 36, 909–921. [Google Scholar] [CrossRef]
  100. Lalah, J.O.; Ochieng, E.Z.; Wandiga, S.O. Sources of Heavy Metal Input into Winam Gulf, Kenya. Bull. Environ. Contam. Toxicol. 2008, 81, 277–284. [Google Scholar] [CrossRef] [PubMed]
  101. Ochieng, E.Z.; Lalah, J.O.; Wandiga, S.O. Analysis of Heavy Metals in Water and Surface Sediment in Five Rift Valley Lakes in Kenya for Assessment of Recent Increase in Anthropogenic Activities. Bull. Environ. Contam. Toxicol. 2007, 79, 570–576. [Google Scholar] [CrossRef] [PubMed]
  102. Machiwa, J. Nature of Suspended Particulate Matter and Concentrations of Heavy Metals in Sediment in the Southern Part of Lake Victoria, East Africa. Afr. J. Aquat. Sci. 2010, 35, 95–101. [Google Scholar] [CrossRef]
  103. Ikingura, J.R.; Akagi, H. Monitoring of Fish and Human Exposure to Mercury Due to Gold Mining in the Lake Victoria Goldfields, Tanzania. Sci. Total Environ. 1996, 191, 59–68. [Google Scholar] [CrossRef]
  104. Campbell, L.M.; Hecky, R.E.; Nyaundi, J.; Muggide, R.; George Dixon, D. Distribution and Food-Web Transfer of Mercury in Napoleon and Winam Gulfs, Lake Victoria, East Africa. J. Gt. Lakes Res. 2003, 29, 267–282. [Google Scholar] [CrossRef]
  105. Ochieng, E.Z.; Lalah, J.O.; Wandiga, S.O. Heavy Metals in Water and Surface Sediments in Winam Gulf of Lake Victoria, Kenya. Bull. Environ. Contam. Toxicol. 2006, 77, 459–468. [Google Scholar] [CrossRef]
  106. Nyenje, P.M.; Foppen, J.W.; Uhlenbrook, S.; Kulabako, R.; Muwanga, A. Eutrophication and Nutrient Release in Urban Areas of Sub-Saharan Africa—A Review. Sci. Total Environ. 2010, 408, 447–455. [Google Scholar] [CrossRef]
  107. Bakyayita, G.K.; Norrström, A.C.; Kulabako, R.N. Assessment of Levels, Speciation, and Toxicity of Trace Metal Contaminants in Selected Shallow Groundwater Sources, Surface Runoff, Wastewater, and Surface Water from Designated Streams in Lake Victoria Basin, Uganda. J. Environ. Public Health 2019, 2019, 6734017. [Google Scholar] [CrossRef] [PubMed]
  108. Oguttu, H.W.; Bugenyi, F.W.; Leuenberger, H.; Wolf, M.; Bachofen, R. Pollution Menacing Lake Victoria. Water SA 2008, 34, 89–98. [Google Scholar] [CrossRef]
  109. Kitaka, N.; Harper, D.M.; Mavuti, K.M. Phosphorus Inputs to Lake Naivasha, Kenya, from Its Catchment and the Trophic State of the Lake. In Lake Naivasha, Kenya: Papers Submitted by Participants at the Conference “Science and the Sustainable Management of Shallow Tropical Waters” Held at Kenya Wildlife Services Training Institute, Naivasha, Kenya, 11–16 April 1999 Together with Those from Additional Studies on the Lake; Harper, D.M., Boar, R.R., Everard, M., Hickley, P., Eds.; Springer: Dordrecht, The Netherlands, 2002; pp. 73–80. ISBN 978-94-017-2031-1. [Google Scholar]
  110. Odada, E.O.; Olago, D.O.; Kulindwa, K.; Ntiba, M.; Wandiga, S. Mitigation of Environmental Problems in Lake Victoria, East Africa: Causal Chain and Policy Options Analyses. Ambio 2004, 33, 13–23. [Google Scholar] [CrossRef]
  111. Lung’Ayia, H.B.O.; M’Harzi, A.; Tackx, M.; Gichuki, J.; Symoens, J.J. Phytoplankton Community Structure and Environment in the Kenyan Waters of Lake Victoria. Freshw. Biol. 2000, 43, 529–543. [Google Scholar] [CrossRef]
  112. Juma, D.W.; Wang, H.; Li, F. Impacts of Population Growth and Economic Development on Water Quality of a Lake: Case Study of Lake Victoria Kenya Water. Environ. Sci. Pollut. Res. 2014, 21, 5737–5746. [Google Scholar] [CrossRef]
  113. Barel, C.D.N.; Dorit, R.; Greenwood, P.H.; Fryer, G.; Hughes, N.; Jackson, P.B.N.; Kawanabe, H.; Lowe-McConnell, R.H.; Nagoshi, M.; Ribbink, A.J.; et al. Destruction of Fisheries in Africa’s Lakes. Nature 1985, 315, 19–20. [Google Scholar] [CrossRef]
  114. Ogutu-Ohwayo, R. The Decline of the Native Fishes of Lakes Victoria and Kyoga (East Africa) and the Impact of Introduced Species, Especially the Nile Perch, Lates niloticus, and the Nile Tilapia, Oreochromis niloticus. Environ. Biol. Fishes 1990, 27, 81–96. [Google Scholar] [CrossRef]
  115. Mailu, A.M. Preliminary Assessment of the Social, Economic and Environmental Impacts of Water Hyacinth in the Lake Victoria Basin and the Status of Control. In Biological and Integrated Control of Water Hyacinth, Eichhornia crassipes, Proceedings of the Second Meeting of the Global Working Group for the Biological and Integrated Control of Water Hyacinth, Beijing, China, 9–12 October 2000; Australian Centre for International Agricultural Research: Canberra, Australia, 2001. [Google Scholar]
  116. Wanda, F.; Namukose, M.; Matuha, M. Water Hyacinth Hotspots in the Ugandan Waters of Lake Victoria in 1994–2012: Implications for Management. Afr. J. Aquat. Sci. 2015, 40, 101–106. [Google Scholar] [CrossRef]
  117. Wu, X.; Wei, Y.; Fu, B.; Wang, S.; Zhao, Y.; Moran, E.F. Evolution and Effects of the Social-Ecological System over a Millennium in China’s Loess Plateau. Sci. Adv. 2020, 6, eabc0276. [Google Scholar] [CrossRef]
  118. Jaramillo, J.; Setamou, M.; Muchugu, E.; Chabi-Olaye, A.; Jaramillo, A.; Mukabana, J.; Maina, J.; Gathara, S.; Borgemeister, C. Climate Change or Urbanization? Impacts on a Traditional Coffee Production System in East Africa over the Last 80 Years. PLoS ONE 2013, 8, e51815. [Google Scholar] [CrossRef]
  119. Nunan, F. The Political Economy of Fisheries Co-Management: Challenging the Potential for Success on Lake Victoria. Glob. Environ. Chang. 2020, 63, 102101. [Google Scholar] [CrossRef]
  120. Mamboleo, M.; Lukhabi, D.K.; Mwenga, M.; Lomodei, E. Lake Victoria. In Aquatic Biomes; Elsevier: Amsterdam, The Netherlands, 2025; pp. 169–182. ISBN 978-0-443-15726-4. [Google Scholar]
  121. Nyamweya, C.; Lawrence, T.J.; Ajode, M.Z.; Smith, S.; Achieng, A.O.; Barasa, J.E.; Masese, F.O.; Taabu-Munyaho, A.; Mahongo, S.; Kayanda, R.; et al. Lake Victoria: Overview of Research Needs and the Way Forward. J. Gt. Lakes Res. 2023, 49, 102211. [Google Scholar] [CrossRef]
  122. Kong, X.; He, Q.; Yang, B.; He, W.; Xu, F.; Janssen, A.B.G.; Kuiper, J.J.; Van Gerven, L.P.A.; Qin, N.; Jiang, Y.; et al. Hydrological Regulation Drives Regime Shifts: Evidence from Paleolimnology and Ecosystem Modeling of a Large Shallow Chinese Lake. Glob. Chang. Biol. 2017, 23, 737–754. [Google Scholar] [CrossRef] [PubMed]
  123. Lin, Q.; Zhang, K.; Shen, J.; Liu, E. Integrating Long-Term Dynamics of Ecosystem Services into Restoration and Management of Large Shallow Lakes. Sci. Total Environ. 2019, 671, 66–75. [Google Scholar] [CrossRef]
  124. Qin, B.; Paerl, H.W.; Brookes, J.D.; Liu, J.; Jeppesen, E.; Zhu, G.; Zhang, Y.; Xu, H.; Shi, K.; Deng, J. Why Lake Taihu Continues to Be Plagued with Cyanobacterial Blooms through 10 Years (2007–2017) Efforts. Sci. Bull. 2019, 64, 354–356. [Google Scholar] [CrossRef]
Figure 1. Distribution of high-frequency keywords in the research literature on water–socioecological systems.
Land 14 00906 g001
Figure 2. The location of Lake Victoria Basin.
Land 14 00906 g002
Figure 3. The LVB-WSESs framework to reveal the water–socioecological dynamics (adapted from [42]).
Land 14 00906 g003
Figure 4. Tipping-point detection and trends of key elements of systems in the LVB. (The blue solid line is the original data, the red dotted line and red marks are the years of tipping points detected by the data, and the black dotted line is the linear fitting model of each stage).
Land 14 00906 g004
Figure 5. Tipping-point detection and trends of urbanization and land use in the LVB. (The blue solid line is the original data, the red dotted line and red marks are the years of tipping points detected by the data, and the black dotted line is the linear fitting model of each stage).
Land 14 00906 g005
Figure 6. W-SESs changes in the Lake Victoria Basin over one hundred years.
Land 14 00906 g006
Figure 7. Links between the LVB climate change and the occurrence of LVB–water system.
Land 14 00906 g007
Figure 8. Feedback relationship between water ecological deterioration and species invasion.
Land 14 00906 g008
Figure 9. The evolution of the LVB-WSESs over one hundred years.
Land 14 00906 g009
Table 1. Data sources.
CategorySubcategoriesDataAcquisition YearReference
Water systemWater resourceLake level (m)1896–2022[33]
Lake surface water temperature(K)1979–2022[34]
Mean water area (km2)2000–2020[35]
Water
environment
Maximum algal blooms area2000–2020[36]
Ecological
system
Mean rainfall (mm/year)1960–2004[28]
Mean rainfall (mm/year)2004–2020[37]
Social system Total population1949–2022[38,39]
Average annual rate of change in the percentage urban (%)1950–2020[40]
Land use and land cover1985–2020[41]
Disclaimer/Publisher’s Note: The statements, opinions and data contained in all publications are solely those of the individual author(s) and contributor(s) and not of MDPI and/or the editor(s). MDPI and/or the editor(s) disclaim responsibility for any injury to people or property resulting from any ideas, methods, instructions or products referred to in the content.

