Abstract
Rural areas are undergoing a transformation, shifting from traditional agriculture to green and leisure industries, driven by urban–rural imbalances and environmental challenges. This transition, however, presents the growing conflicts between preserving spatial features and promoting industrial development. Based on the unique rural spatial typology of polders, this study integrated theories from cultural, landscape, ecological, economic, and social perspectives to construct a conceptual framework of the interactive relationship between spatial features (SFs) and industrial development (ID). Then, an evaluation index system was constructed to measure the current status of SFs and ID, using data from field surveys, satellite imagery, and 2020 yearbooks, with the Gaochun Polder District, Nanjing (China), as the case study. Next, the coupling coordination degree (CCD) model and a scenario analysis based on orthogonal design were applied to assess the coherence and development between SFs and ID, and to identify strategies for optimizing rural industrial development. The results show that (1) the current SFs and ID are in the break-in and basic coordination stage, with ID lagging behind SFs, and (2) the 25 scenarios generated through orthogonal design were categorized into three groups: high-level coordination with synchronization between the two systems, high-level coordination but ID lagging behind SFs, and basic coordination where ID lags behind SFs. To achieve a high-level coordination with synchronization, specific strategies were proposed to enhance agricultural input–output benefits, improve agricultural scale–quality benefits, and, overall, protect the SF system while making minor adjustments to the village dwelling subsystem. Therefore, the findings provide recommendations for traditional polder villages to optimize their rural industries while preserving the distinctive SFs of the rural cultural landscape.
1. Introduction
Polders are low-lying areas reclaimed from water, typically consisting of farms, dikes, networks of rivers and canals, and rural settlements. These areas are commonly found in flood-prone plains along rivers and lakes with well-developed river systems, showcasing human ingenuity in water management and agricultural development [1]. As a unique type of rural space, polder areas occupy a relatively small proportion of rural land but hold special significance in water resource management, agricultural production, and ecological conservation. They possess important ecological, economic, social, and cultural values. The spatial features (SFs) of polder areas are shaped by interconnected elements such as water networks, land use (e.g., farmland, fish ponds), hydraulic infrastructure, and ecological environments. These features serve as key carriers of the cultural and ecological values of polder areas, forming the basis for their regional identity, recognition, and development. Additionally, polder areas are distinct geographical units based on artificial dike systems for flood control. Their industrial development (ID) is characterized by water dependency, complexity, and vulnerability. Their industrial layout is closely tied to hydraulic infrastructure, with traditional agriculture, aquaculture, and handicrafts coexisting in a multi-sectoral system. However, the entire ecological–economic system is susceptible to climate change and human activities.
Polders are distributed in countries such as the Netherlands, China, Bangladesh, and Germany. Within these polders, rural spaces are undergoing profound socio-economic transformations [2]. This process of rural development has been marked by changes in agricultural production methods, land use patterns, economic conditions, and social structures, along with a reduction in population density [3,4]. However, this development has led to several challenges in rural spatial conservation, including the disappearance of traditional village spaces and landscapes, the abandonment of homesteads, a reduction in arable land [5], a fragmentation of agricultural landscapes [6], and a decline in ecological carrying capacity [7]. For instance, the Netherlands faces challenges such as wetland loss, water stress, insufficient technical and financial support for restructuring traditional agricultural systems, population decline and aging, as well as difficulties in preserving cultural heritage [8]. In addition to these issues, Germany grapples with uneven rural development, reduced agricultural subsidies, environmental pollution, and ecological degradation [9]. Furthermore, Bangladesh contends with rising sea levels and flooding, a mono-structured agricultural sector, rural overpopulation, and inadequate infrastructure and educational resources [10].
China faces challenges similar to those of developed European countries, including rural population decline and aging, increasing pressure to transition traditional industries to green industries, difficulties in preserving traditional culture and SFs, and ecological degradation. Taking the Gaochun Polder District, China, as an example, due to individual crab farmers’ reliance on offline transactions, losses are widespread, leading most farmers to lease their polder fields to specialized cooperatives. This has resulted in over half of the population migrating to cities for work, exacerbating rural depopulation and the abandonment of residential areas [11]. Additionally, the concentrated production layout has partially disrupted the original polder space and rural landscape. The blind expansion and homogenization of high-economic-value aquaculture have caused water pollution, reduced ecological resilience, and intense homogeneous competition. Meanwhile, leisure industries, such as agritourism, are still small-scale and have failed to effectively drive the transition of traditional agriculture to tertiary industries.
These intertwined issues have placed polder areas under dual pressures: the need for industrial transformation and the risk of losing SFs and ecological degradation. In this context, a core challenge has emerged: how to vigorously promote the transition of traditional agriculture while minimizing the negative impacts of ID on SFs, thereby achieving a balance between space and industry [12,13,14]. Research indicates that without systematic intervention, the unique SFs and ecological values of polder areas may suffer irreversible damage within years, jeopardizing long-term regional sustainable development goals.
Previous studies on rural space have mainly focused on three dimensions: (1) Morphological typology has focused on the quantitative analysis of settlement patterns [15], spatial–temporal evolution in cropland use [16,17], and typological classifications for spatial reconfiguration [18]. However, studies on polder landscapes remain limited to macro-scale distribution patterns [19], with insufficient attention to micro-scale hydrology–land use interactions unique to polders. (2) Cultural landscape: scholars have decoded cultural imprints in spatial forms and the spatial anchoring effects of ritual activities [20], examined traditional farming wisdom in spatial organization [21], and analyzed socio-demographic impacts on spatial textures and the spatial reproduction of conservancy as cultural symbols [22]. Yet, a systematic framework for interpreting the cultural landscape heritage of the “water–polder–settlement” is lacking, overlooking its role in shaping spatial evolution. (3) Ecosystem dynamics: research highlights ecological drivers of landscape patterns [23], evaluates conservation policies [24,25], and models agroecosystem services [26]. While the Social–Ecological Systems (SES) framework has advanced our understanding of resilience mechanisms in anthropogenic–natural hybrid ecosystems (e.g., polders) [27], its persistent neglect of cultural–landscape dimensions prevents a holistic analysis of polders as truly integrated “cultural–landscape–ecological continuum systems”.
Current research on rural industries can also be synthesized into three interrelated dimensions: (1) Economic efficiency: studies focus on industrial restructuring, such as efficiency gains from transitioning traditional agriculture to secondary and tertiary industries [28,29], and the effects of key factors like “manpower–land–capital” [7]. Yet systematic quantification is lacking for polder-specific land–water–industry linkages (e.g., circular agroecological systems). (2) Social–institutional dynamics: research examines policy-driven effects, such as land transfer and subsidies for industrial clustering [30,31], but micro-scale evidence is scarce on how polder multi-actor networks (water associations, farmers, firms) shape industrial transitions. (3) Technological innovation: while digital technologies (e-commerce, smart farming) reconfigure value chains [32,33] and coordinate water conservancy projects with industries [34], adaptive polder technologies (flood-resistant crops, water-saving irrigation) and their socio-economic fit remain understudied.
Recently, the relationship between rural socio-economic development and spatial protection has become a core issue in sustainable rural development. Studies on rural space–industry interaction can be divided into two main aspects: (1) From a functional configuration perspective, the proportions of rural production–life–ecology (PLE) spaces were analyzed using the coupled coordination degree (CCD) [35]. For instance, Zhao, T. used various methods, such as Spearman correlation analysis, spatial autocorrelation analysis, and cold hotspot identification, to develop a regional evaluation model for PLE spaces [36]. (2) From a spatial governance perspective, Sun et al. studied the transformation mechanism and interrelationship of “population, land, industry, and urban-rural relationships” in rural areas, emphasizing the social relationship network and its intrinsic value in rural space governance [37].
Regarding methodology, the CCD model, system dynamics model [38], entropy weighting method [39], indicator evaluation system [40], spatial autocorrelation analysis [36], and Kuznets curves [41] are frequently employed in studies investigating two or more systems. The CCD model, in particular, is widely used to quantitatively assess the synergistic effect within the system, measure the consistency and development levels of two systems [42], and evaluate interactions, such as those between the economy and the environment, urbanization and ecology, or regional development and resource utilization. This model is valued for its simplicity, comprehensiveness, and intuitive results. For instance, Zhu, C. applied the CCD model to explore the interaction between rural transformation and e-commerce, while using the Kuznets curve model to quantify its impact on agricultural benefits [41]. Additionally, Ge, D. analyzed the evolutionary characteristics of the coupled relationship between farmland utilization types and the rural development status at the county and village levels, using the coupled conceptual model. Ge also explored the mechanisms of change in rural human–land relations and the coupled regulation strategy [43].
To summarize, the existing studies have mostly adopted a single perspective, focusing either on a rural spatial or industrial perspective, while limited attention has been given to the interaction between rural spaces and industry, especially in unique rural contexts like polder areas. Additionally, studies on rural space often emphasize morphological typology [15,18], cultural landscapes [20,21], and ecosystems [23,24,25,26], yet few studies have holistically integrated their cultural, landscape, and ecological values. Even fewer dissect the distinct characteristics and significance of polder systems through their micro-scale spatial components. Similarly, studies on rural industries focus on conventional economic efficiency [7,28], social institutions [30,31], and technological innovation [32,33,34], but fail to treat SFs—a resource embodying “culture–landscape–ecology” synergies—as a driver of development. This oversight has led to insufficient research on the industrial expression of SFs. Methodologically, few studies combine CCD models with scenario analysis (SA) for predictive purposes.
Therefore, this research selects the Gaochun Polder District as a case study, an area with distinctive natural and historical–cultural features but marked conflicts between ID and SF conservation. The purpose of this paper is to investigate the coupling coordination relationship between polder-based SFs and ID, proposing strategies to optimize ID while preserving distinctive SFs. The study addresses the following core questions: (1) How to quantitatively assess SFs and ID? (2) How to establish the relationship between SFs and ID? (3) How to find the optimal balance between conservation and development, promoting rural industrial transformation while preserving rural SFs? More specifically, the research objectives are threefold: (1) To comprehensively evaluate the SF and ID systems by establishing an indicator evaluation system, adopting an integrated subjective–objective approach, and utilizing 2020 satellite imagery, survey data, and statistical data for the Gaochun Polder District—assessing SFs from cultural and landscape perspectives, while evaluating ID from economic and social dimensions. (2) To investigate the interactive relationship between SF and ID systems using a coupling coordination degree model. (3) To employ orthogonal matrices for scenario generation, combining the coupling coordination model with scenario analysis to predict the evolution of SF-ID coupling coordination relationships, ultimately formulating strategies to steer both systems toward high-level coordinated and synchronous development scenarios.
The paper is structured as follows: Section 2 introduces the research object and data sources. Section 3 explains the methodology, which includes building a comprehensive evaluation system for SFs and ID using an AHP, creating a CCD model, and conducting an SA based on orthogonal design. Section 4 presents the empirical results, discussing the current situation, coupling coordination characteristics, and predicted regulatory scenarios. Finally, Section 5 summarizes the main conclusions.
2. Theoretical Framework
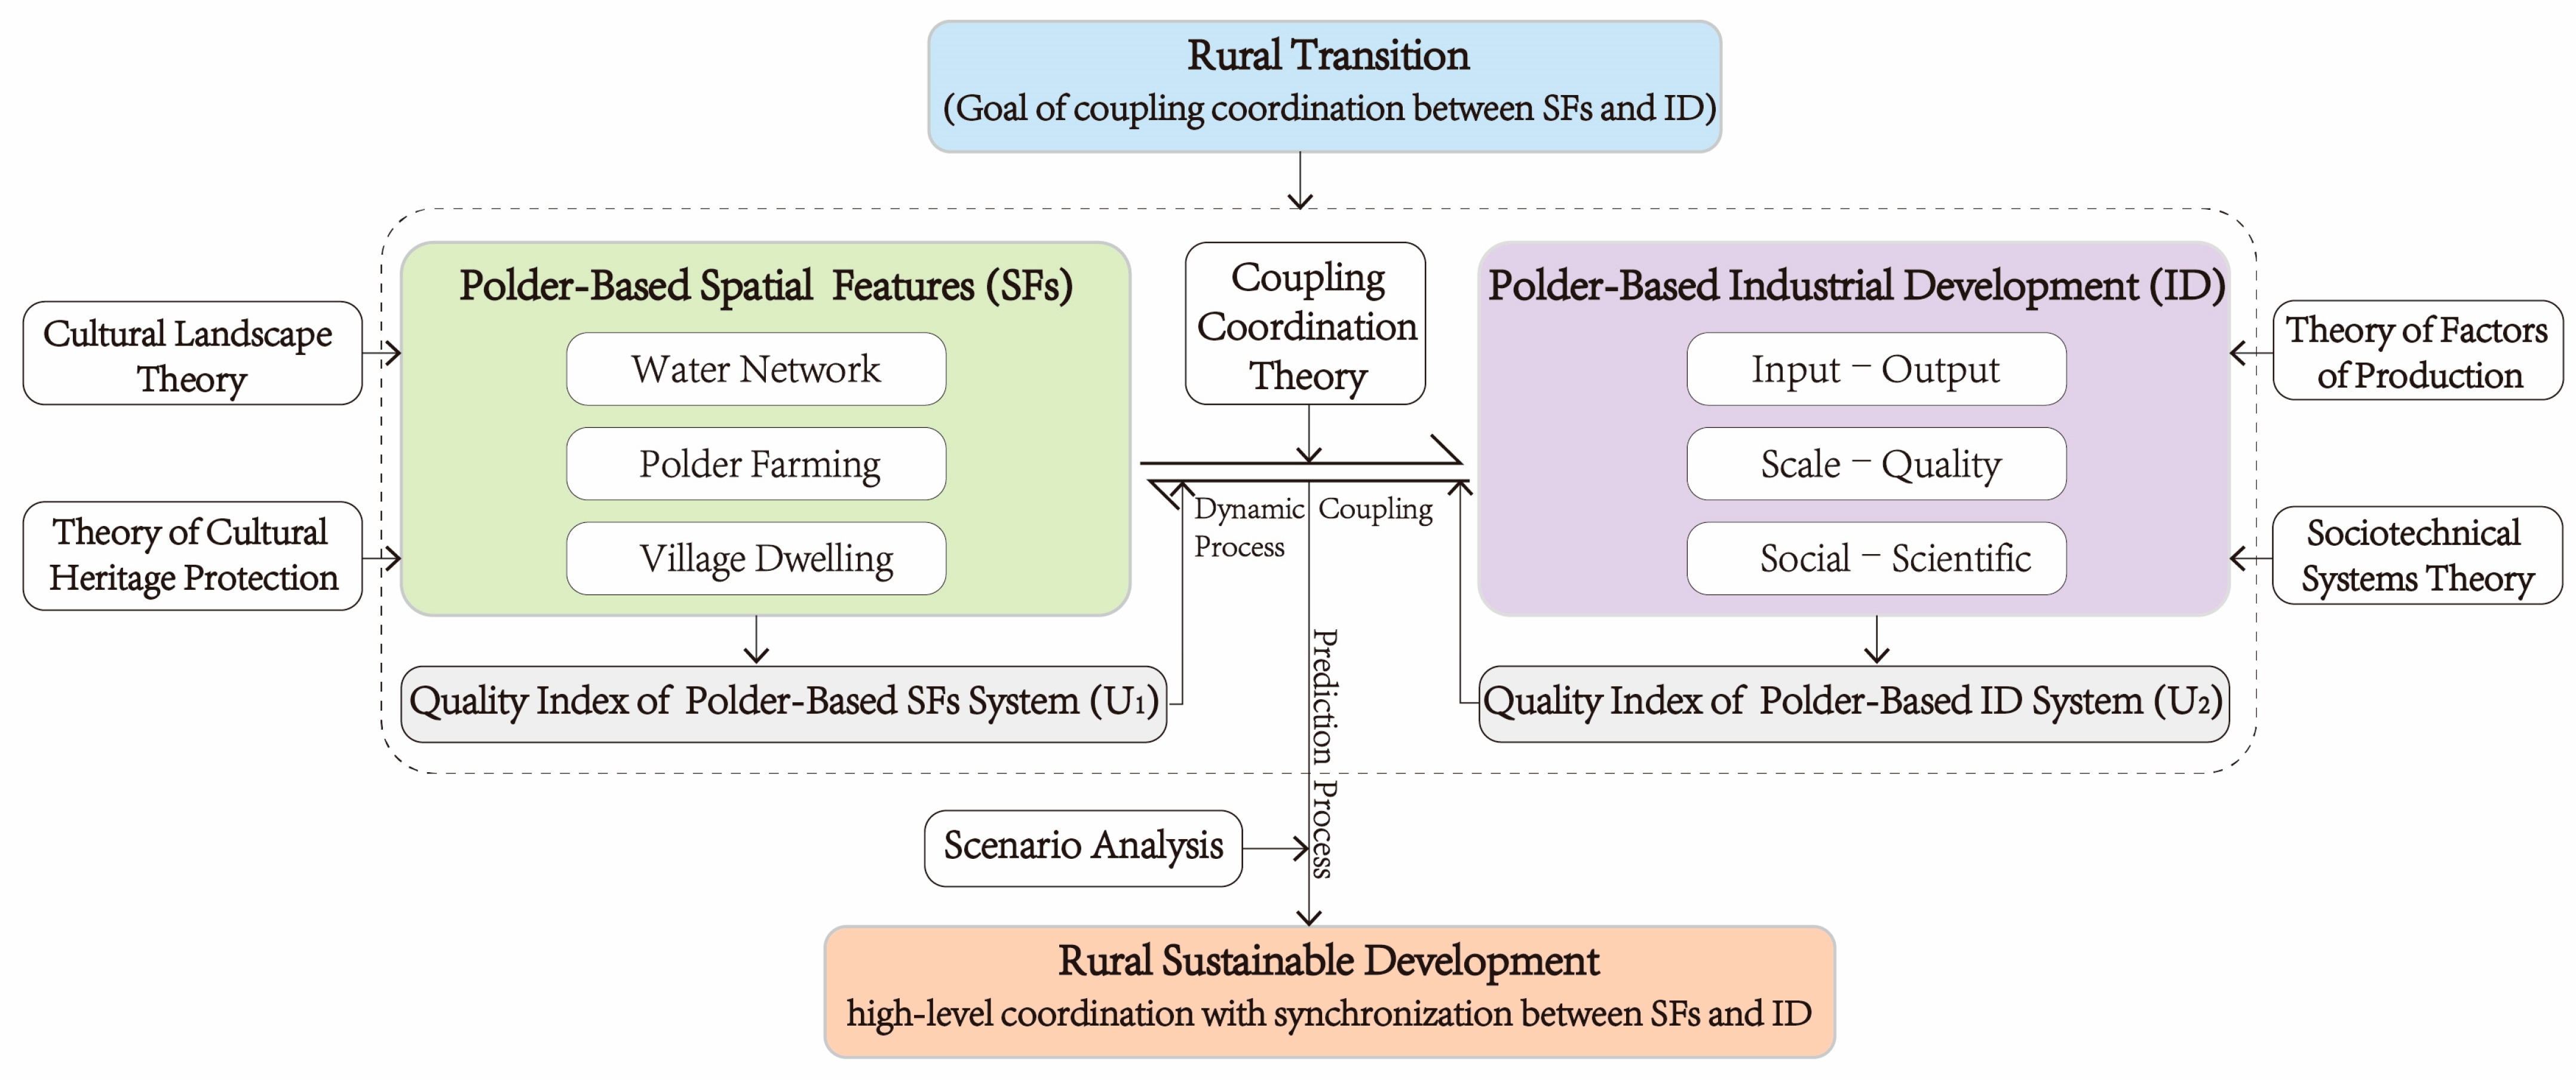
The coupling relationship between polder-based SFs and ID is a complex system involving culture, landscape, ecology, economy, and society [44]. This study focuses on polder regions, unique agricultural areas formed through land reclamation. The conceptual framework in Figure 1 illustrates the composition and interactions of these subsystems.
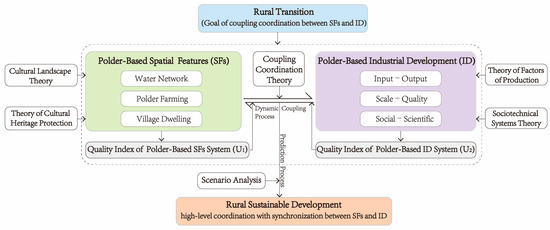
Figure 1.
Conceptual framework.
Polder space is divided into water networks, agricultural fields, and settlement habitats. Consequently, from a “cultural–landscape–ecological” perspective grounded in cultural landscape theory and cultural heritage conservation theory, this study identifies key indicators for evaluating SFs. Cultural landscape theory emphasizes the interaction between natural and human-made landscapes and advocates holistic conservation [45], making it suitable for assessing the integration of natural (e.g., water systems, polder) and human elements (e.g., settlements), as well as landscape richness and integrity. Cultural heritage conservation theory focuses on preserving the historical, artistic, and scientific values of cultural heritage [46], aligning with the evaluation of water infrastructure, traditional dwellings, and iconic structures. These theories inform an assessment framework that includes the integration, richness, integrity, preservation status, and functional use of spatial elements.
From an “economic–social–technological” perspective, polder-based ID is analyzed through the theory of production factors and sociotechnical systems theory. The theory of production factors highlights the roles of land, labor, capital, and technology [47], providing a basis for analyzing factor inputs and efficiency. Sociotechnical systems theory emphasizes the interaction between technology and social systems [48], explaining the social demand for technological applications and their adaptability. These theories support an assessment framework that measures both the current state of industry and its impact on rural social development.
Polder-based ID involves complex processes, such as population movement, changes in agricultural practices, the introduction of green and leisure industries, increased non-agricultural employment, and rising income and consumption levels, significantly impacting SFs [49]. For example, centralized production layouts can disrupt the organic structures and scales of polders, while intensive farming may degrade ecosystems [50]. Urban–rural income disparities can lead to population loss and abandoned homesteads, damaging traditional architecture [51]. Conversely, growing cultural heritage awareness and conservation policies strengthen SFs. Rural ecotourism and leisure agriculture, based on local features, can enhance the interaction between SFs and ID. In summary, ID influences spatial conservation through socio-economic factors, while rural space shapes ID through resource endowments, ecological functions, and policy interventions [52]. Thus, the complex interplay between ID and SFs involves mutual support and constraints. To analyze this relationship, we use CCD methods for quantification and SA to predict changes in coordination levels, aiming to identify pathways that balance industrial transformation with spatial conservation.
3. Materials and Methods
3.1. Study Area and Data Sources
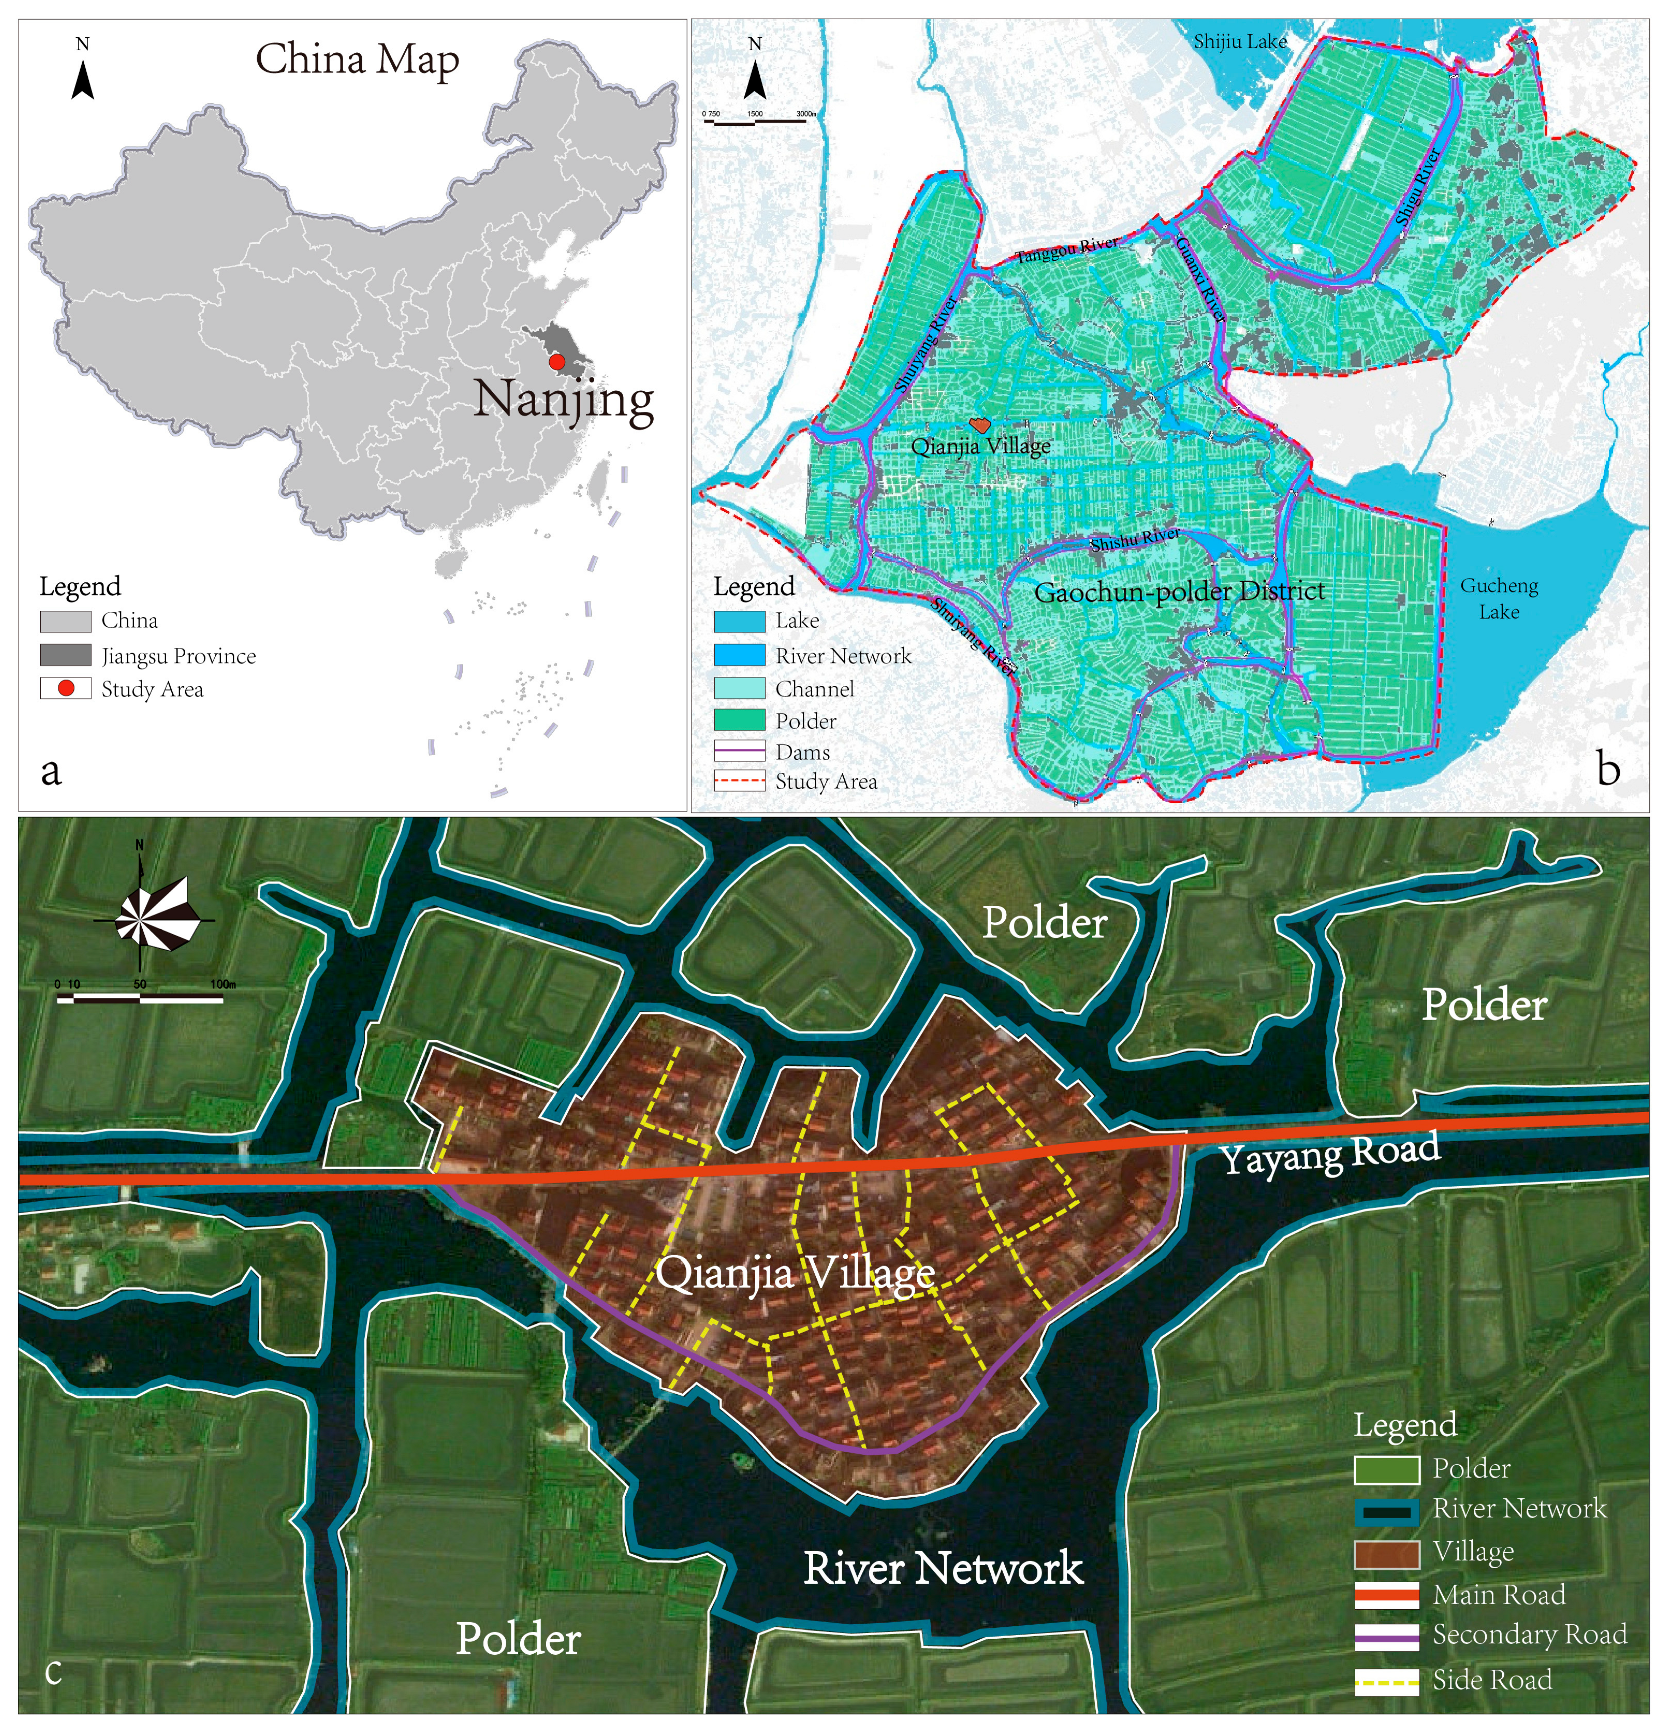
The Gaochun Polder District is located in southern Nanjing, Jiangsu Province, along the southeast coast of China (118°46′ E, 32°03′ N) (Figure 2). It is the earliest polder associated with Taihu Lake, the largest freshwater lake in China. The polders originated during the Three Kingdoms period (220–280 A.D.), when polders were constructed around water systems for farming to meet the demand for war supplies. Later, during the Tang and Song Dynasties (618–1279 AD), large-scale campaigns were conducted to surround the ancient Danyang Lake and turn it into farmland. Over thousands of years, both natural changes and human modifications shaped the Jiangnan spatial features of “living by water”, “building with fields”, and “harmonious development among people, water, and fields”. Meanwhile, the region has developed an industrial system dominated by specialty aquaculture, supported by various agricultural and forestry cash crops. However, rapid urbanization and the growth of rural tourism [2] have brought several challenges, including the reduction of the polder–water areas, a decline in soil hydrological quality, the loss of traditional rural customs and lifestyles, an over-reliance on tourism that weakens crisis resilience, and intensified homogeneous competition.
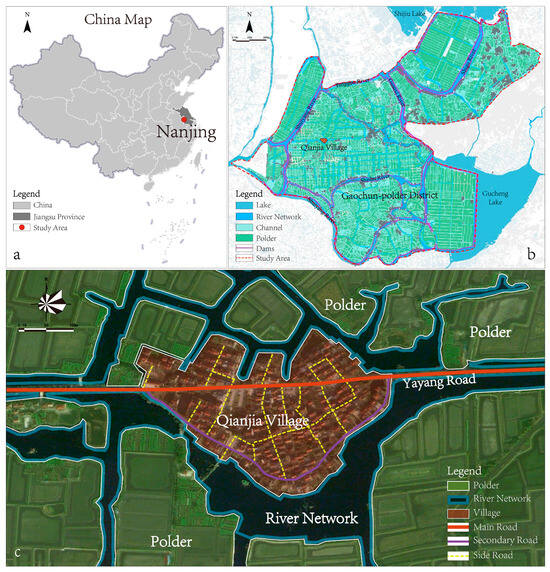
Figure 2.
Study area: (a) the location of the study area in China; (b) the boundary of the Gaochun Polder District and the location of Qianjia Village in the Gaochun Polder District; (c) spatial patterns and spatial elements in Qianjia Village. Source: self-drawn by the author. (a,c) Adapted from remote sensing satellite maps, (b) drawn by overlaying government data and map crawling.
The Gaochun Polder District covers approximately 272 km2 and includes 291 natural villages. In this study, we focused on Qianjia Village, a typical polder field spatial unit, as the primary research object. Its location and spatial elements are shown in Figure 2. The village has formed an overall spatial pattern characterized by “enclosing fields internally, encircling water externally, and cohabiting along the river”. Regarding the polder–water pattern, Qianjia Village is located in a low-lying area, surrounded by rivers that form an intricate network. The abundant waterways isolate the land, creating an internally enclosed farming area with dikes, while the external watershed is utilized as both a natural barrier and a source of irrigation water. In terms of settlement layout, the village is centrally located within the polder and is separated by a high dike, forming an island-like cluster. The internal streets and alleys are dense and narrow, connecting to the external areas via roads. The traditional architectural style features gray tiles, red columns, and double-pitched-roof courtyard-style buildings with Ma Tau Walls, such as the Yongzhen Buddhist Nunnery and Qianjia Ancestral Hall. In this study, we obtained spatial and land use data for the village through field research and satellite imagery from the China National Geographic Information Public Service Platform1. Additionally, we gathered data on the subjective perceptions of SFs through interviews and questionnaires from 153 villagers and 15 experts in October 2021.
In terms of economic and industrial development, Qianjia Village relies heavily on its abundant polder–water resources. Agriculture is the main industry, with a focus on aquaculture and aquatic plant cultivation, including fish, shrimp, turtle, and crab farming, as well as growing aquatic crops like water chestnuts, lotus roots, gorgonians, and mizuna. However, the industrial and service base remains underdeveloped, with only one small garment processing workshop, a few convenience stores, and limited service facilities for rural tourism. Socio-economic and industrial data for Qianjia Village were collected from the Gaochun Statistical Yearbook (2020), field interviews, and questionnaires. Collective-level data were obtained from the yearbook. For instance, in 2020, the village had 243 households, with 795 registered residents, and a collective village income of CNY 1,898,300. Individual-level data were gathered through questionnaires. On average, each villager owned about 1 mu (0.16 acres) of fields, 3.5 mu (0.58 acres) of water ponds, and 1.8 mu (0.30 acres) of agriculture and forestry land. The annual per capita income ranged from about CNY 30,000 to 80,000, with agricultural income accounting for 52.28% of the total income. Specific information on agricultural brands, scientific and technical personnel, and farmer training was collected through field interviews. Additionally, the land area data were sourced from the village plan and the Rural Property Rights Trading Service Center2. Detailed crop income information came from Nanjing Daily3, while data on e-commerce development were based on Chang (2018) [53]. These datasets serve as the objective basis for quantitatively measuring ID (corresponding to Objective 1).
3.2. Methods
3.2.1. Measurement of Polder-Based SFs and ID
Construction of a Comprehensive Evaluation Index System
We constructed a comprehensive evaluation index system (CEIS) to assess the level of SFs and ID quantitatively. This system serves as the basis for evaluating their coupled coordination. The CEIS was established in two parts: an SF system () and an ID system (). includes indicators such as the ecological landscape quality of water resources [54] and the richness of water conservancy facilities, reflecting the resource quality and protection level of the water network conservancy subsystem (). It also includes indicators such as the polders’ landscape quality and morphological pattern completeness, representing the characteristics of agricultural production sites in the polder farming subsystem (). Additionally, indicators related to settlement site selection, street patterns, public spaces, public buildings, and traditional residential buildings reflect the characteristics and vitality of living spaces in the village dwelling subsystem (). includes indicators such as agricultural income and agricultural land area, reflecting agricultural input–output benefits () [55]. It also includes indicators like the number of brands and the level of e-commerce, representing agricultural scale–quality benefits (). Furthermore, indicators such as the level of village infrastructure, the proportion of agricultural population, the number of science and technology personnel [56], and the number of farmer trainings [57] reflect socio-scientific benefits () [58]. The details are shown in Table A1.
The standard setting of is based on a 5-level Likert scale, with reference to the literature and relevant theories (e.g., cultural heritage preservation theory, landscape preservation theory, etc.), and is divided on the basis of degree (degree of perception, degree of use, and degree of preservation). In the specific content, auxiliary assessments of factors such as quantity and type can be drawn upon to solve the uncertainty of subjective perception, such as the degree of preservation of water conservancy facilities. is determined based on references to the literature, relevant theories, and data on the current state of regional and national development. The criteria for assigning points to indicators are shown in Table 1 and Table 2.

Table 1.
Indicator scoring criteria of polder-based SF system.
Table 2.
Indicator scoring criteria of polder-based ID system.
For scoring indicators for SFs and ID, the classified assignment method [59], natural breakpoint method [60], and combined subjective–objective method [34] are frequently used. Since the evaluation indicators for primarily reflect subjective perceptions and human experiences, the subjective scoring method [61] was applied to assign scores, thereby quantifying SFs (addressing Research Question 1/Objective 1). Data on the subjective perception of SFs were collected from 153 villagers and 15 experts through questionnaires and interviews in 2021. For , current income, area, quantity, and share values were treated as objective indicators, and the objective scoring method [62] was applied to assign values, thereby quantitatively assessing the ID system (addressing Research Question 1/Objective 1). All scores were assigned on a percentage scale, divided into five equal gradients: very poor (0–19), poor (20–39), average (40–59), good (60–79), and excellent (80–100).
AHP to Determine Indicator Weights
The determination of indicator weights () is commonly conducted using methods like the entropy weight method [63], the AHP [36], and principal component analysis [64]. In this study, the AHP was chosen as an analytical method to decompose a complex problem into layers of influencing factors. It is widely used in research fields such as agroforestry, environment studies, and social sciences, including the evaluation of disaster emergency response capacity [65], eco-environmental quality [34], and historical public spaces [66]. The process for determining indicator weights using the AHP is as follows:
- Based on the pairwise comparison of indicators within the system conducted by five members who participated in the field research and mapping of the Shijiu Lake–Gucheng Lake polder area, the relative importance of each level’s indicators to the objectives of the previous level was determined.
- Next, the relative importance of each factor was converted into a numerical scale using a 1~9 scale method. A judgment matrix was then created and the normalized eigenvector of the largest eigen root was derived to determine the weights.
- After checking for consistency, the arithmetic average of the five weighting results calculated by five experts was used as the final indicator weights for the SF and ID systems.
Comprehensive Evaluation Index of SFs and ID
The comprehensive evaluation index, frequently used to assess the levels of development of multiple systems, is then derived from the quality indices of the systems. The quality index of each system or subsystem is an evaluation value based on the current status and is calculated using the measurement value and weight of each indicator, as shown in Formula (1). The comprehensive evaluation index is calculated using Formula (2).
where represents the quality index of system (SFs or ID) (Objective 1 results provide the necessary data for the Objective 2 solution); indicates the weight of indicator ; is the standardized measurement value of evaluation indicator ; and is the total number of indicators in the system. represents the comprehensive evaluation index of the SFs and ID systems, reflecting the overall effects and levels of and (Objective 1 results provide the necessary data for the Objective 2 solution); and denote the determined coefficients. In this study, SFs and ID are treated as equally important components of the rural development system. Therefore, the values of and are both set to 0.5.
3.2.2. CCD Model
Various contradictions and complex interactions exist between rural space and industry during the development process. Industrial transformation can promote the intensive and efficient use of resources, but it may also result in the destruction of SFs. Traditional SFs offer diverse pathways for ID, such as rural tourism, whereas the destruction of fragile spatial systems can limit industrial development. Therefore, the concept of “coupling” is introduced to study the interaction between space and industry. Achieving their coupling coordination serves as the foundation for addressing issues related to rural conservation and development [67] (addressing Research Question 2/Objective 2). The CCD model [63], which shows the degree of interaction between two systems, is expressed by the following formulas:
where is the coupling degree of two systems (range from 0 to 1), which reflects the extent of mutual influence between and (addressing Research Question 2/Objective 2). Based on the characteristics of changes in the coupling degree and the classification criteria established by related researchers [41,68], is categorized into four stages: low coupling stage (0.0–0.3), antagonistic stage (0.3–0.6), break-in stage (0.6–0.9), and high coupling stage (0.9–1.0).
represents the value of the CCD (range from 0 to 1), reflecting both the degree of interaction between and and the consistency of their development levels (addressing Research Question 2/Objective 2). A unified standard for the interval division of has not been established in related studies. For instance, Zhu, C. divided into five intervals [41], whereas He, J. et al. used four intervals [63], although their segmentation values are not inconsistent. Therefore, this study, referencing the above segmentation values and the law of normal distribution, sets the middle two values at 0.2 and 0.8. Consequently, is divided into four intervals: serious incoordination (0–0.2), slight incoordination (0.2–0.5), basic coordination (0.5–0.8), and high-level coordination (0.8–1). Additionally, by combining the interval differences between and , the synchronization of SFs and ID (), the lagging of ID (), and the lagging of SFs (), the coupling coordination of the two systems is categorized into 12 types (Table A2).
3.2.3. Scenario Analysis Based on Orthogonal Design
Scenario analysis [69] is a research method used to generate multiple scenarios based on potential development trends of key influencing factors, predict their outcomes, and identify the optimal scenarios for comparison [70]. This method is widely used in studies of socio-economic development [71], carbon emission [72], and ecological resource protection [73]. For example, Cui D. developed nine scenarios combining socio-economic development models with water conservation measures for simulation and assessment [38]. In scenario design, the CA–Markov model [74] and orthogonal design [75,76] are commonly used for scenario generation.
This study adopts the scenario analysis method to calculate the CCD of SFs and ID across various scenarios, aiming to identify the optimal scenario for the future rural transformation and development, while prioritizing the protection of SFs and the promotion of ID (addressing Research Question 3/Objective 3). An orthogonal design is used to establish scenario settings, regulating six subsystems (factors) in both the SF system (water network conservancy, polder farming, and village dwelling subsystems) and the ID system (input–output benefit, scale–quality benefit, and social–scientific benefit subsystems). Each subsystem is assigned five adjustment ranges (Table 3): Level 1 (slight decrease), Level 2 (maintaining current status), Level 3 (slight improvement), Level 4 (moderate improvement), and Level 5 (significant improvement). Then, the orthogonal design table is created based on two rules:
Table 3.
Description of the parameters related to five adjustment ranges for SFs and ID.
- Each subsystem (column) must include the same number of individual improvement ranges (from 1 to 5), i.e., five times.
- Any two columns must contain 25 unique number pairs (i.e., (1,1), (1,2), (1,3), (1,4), (1,5), (2,1), (2,2), (2,3), (2,4), (2,5), (3,1), (3,2), (3,3), (3,4), (3,5), (4,1), (4,2), (4,3), (4,4), (4,5), (5,1), (5,2), (5,3), (5,4) and (5,5)), appearing only once, to create an orthogonal design table (Table 4).
Table 4. Subsystem quality indices and CCD for 25 regulation scenarios based on orthogonal table.
After that, the orthogonal design table generates 25 regulation scenarios. The CCD and types of these scenarios are calculated and classified, and the key indicator factors that significantly affect the CCD are identified, providing a basis for further research (the dataset is generated for Research Question 3/Objective 3).
4. Results
Using Qianjia Village in the Gaochun Polder District as a case study, this research conducted an empirical analysis of the interaction between polder-based SFs and ID. The analysis included the results of the comprehensive evaluation, coupling coordination, and scenario prediction for the SF and ID systems. After classifying the 25 scenarios generated by the orthogonal design table, strategies and recommendations were proposed to improve the coupling coordination between spatial protection and ID. These strategies were based on the target scenario types and the indicators significantly influencing the CCD.
4.1. Results of Systematic and Comprehensive Evaluations
According to the index assignment standards in Table 1 and Table 2, values were assigned to the indices of the SFs and ID systems of Qianjia Village, and their weights were determined using the AHP method and expert scoring (Table 5). Then, the SFs system quality index () for Qianjia Village was calculated as 0.80 through Formula (1), representing a favorable evaluation, as the measurement values of most indicators within the SF system ranged from 60 to 85 points. Key indicators with higher weights, such as settlement siting and morphology fit (x7) and traditional residential building style compatibility (x11), showed relatively high levels. Conversely, indicators with lower weights, like hydrological heritage conservation status (x4) and public space function and vitality (x9), had less impact on due to their lower measurement values.
Table 5.
Indicator weights, current measurement values, and comprehensive evaluation results of the SFs and ID systems in Qianjia Village.
The ID system quality index () was calculated as 0.31, reflecting a poor evaluation. Most of the ID system indicators scored from 20 to 40 points, which was considered low. Several indicators, with the lowest measurement values, such as the number of agricultural brands (y5) and the surface area of pit ponds (y4), fell within the range of 0 to 19 points. Given their high weights, these indicators further contributed to the reduction in . Only two indicators, the level of agricultural e-commerce development (y7) and the level of infrastructure and amenities (y10), showed relatively high measurement values, in the range of 60 to 79 points. However, their medium weights limited their ability to improve significantly. Finally, the comprehensive evaluation index (T) for the SFs and ID systems of Qianjia Village was calculated to be 0.55 using Formula (2) (addressing Research Question 1/Objective 1).
4.2. Results of the Coupling Coordination Analysis
The coupling degree () and CCD () of the SF and ID systems in Qianjia Village were calculated by Equations (3) and (4). Based on the measurement results, the characteristics of the coupling coordination between SFs and ID in Qianjia Village were as follows (addressing Research Question 2/Objective 2):
- Lagging ID: The difference between the quality index of the ID system () and the SFs system () was 0.49, significantly exceeding 0.1. According to the coupling coordination type division (Table A2), this indicates that agricultural development in Qianjia Village lagged behind the SFs system.
- Coupling degree: The coupling degree was 0.89, falling within the break-in stage (). This indicates that the lag in ID negatively impacted the quality improvement of the SFs system, while the SFs system positively influenced ID. The interaction between the two systems was gradually strengthening, moving toward a mutually beneficial and balanced state.
- CCD: The CCD was 0.71, which falls within the basic coordination interval (). This suggested that, due to the mutual influence of the SFs and ID systems in Qianjia Village, rural industries were gradually adopting more intensive and efficient production methods while increasingly focusing on protecting traditional polder-based SFs. However, further efforts are required to improve the level of ID to ensure synergy and consistency between the two systems.
4.3. Results of Scenario Prediction Analysis
4.3.1. 25 Regulation Scenarios
Among the 25 scenarios in the orthogonal design table (Table 4), the 9th scenario showed a lower coupling degree (). In this scenario, while the comprehensive quality index of SFs system () increased significantly, a decrease in the input–output benefit subsystem caused a minimal change in the comprehensive quality index of the ID system (). This widened the gap between the two systems, leading to a reduction in the coupling degree (). Conversely, 15 scenarios demonstrated a significant increase in the coupling degree (). These scenarios mainly involved improvements in the ID system, such as in the input–output benefit subsystem or the scale–quality benefit subsystem.
According to the interval of the CCD (), 11 scenarios were elevated to the high-level coordination interval (), indicating that SFs and ID were highly coordinated with a significant positive correlation. This improvement was due to a significant increase in the quality index of the ID system (), which reduced the gap between and and effectively increased the CCD. These findings were consistent with those reported by Yang, Y. [77]. Further analysis revealed that, regardless of changes in the SFs’ subsystems, the CCD could be effectively improved by moderately or significantly increasing the quality indices of the input–output benefit subsystem () and the scale–quality benefit subsystem () of the ID system. This was particularly evident in scenarios 7 and 22. Therefore, advanced agricultural machinery and automated equipment should be introduced, and biological and information technology should be fully utilized. A mechanism for equal land exchange between urban and rural areas should also be explored to boost the input–output benefit. Additionally, special and branded agriculture should be promoted, rural specialties should be developed for online sales, and a coordinated agricultural industry chain should be established to improve the scale–quality benefit.
However, 14 scenarios remained in the basic coordination interval (), indicating that SFs and ID were basically coordinated. These scenarios were characterized by an unchanged or slightly reduced SF system, along with only a small increase in the ID system. As a result, the difference between the two systems () remained relatively large, and the improvement in the CCD was limited.
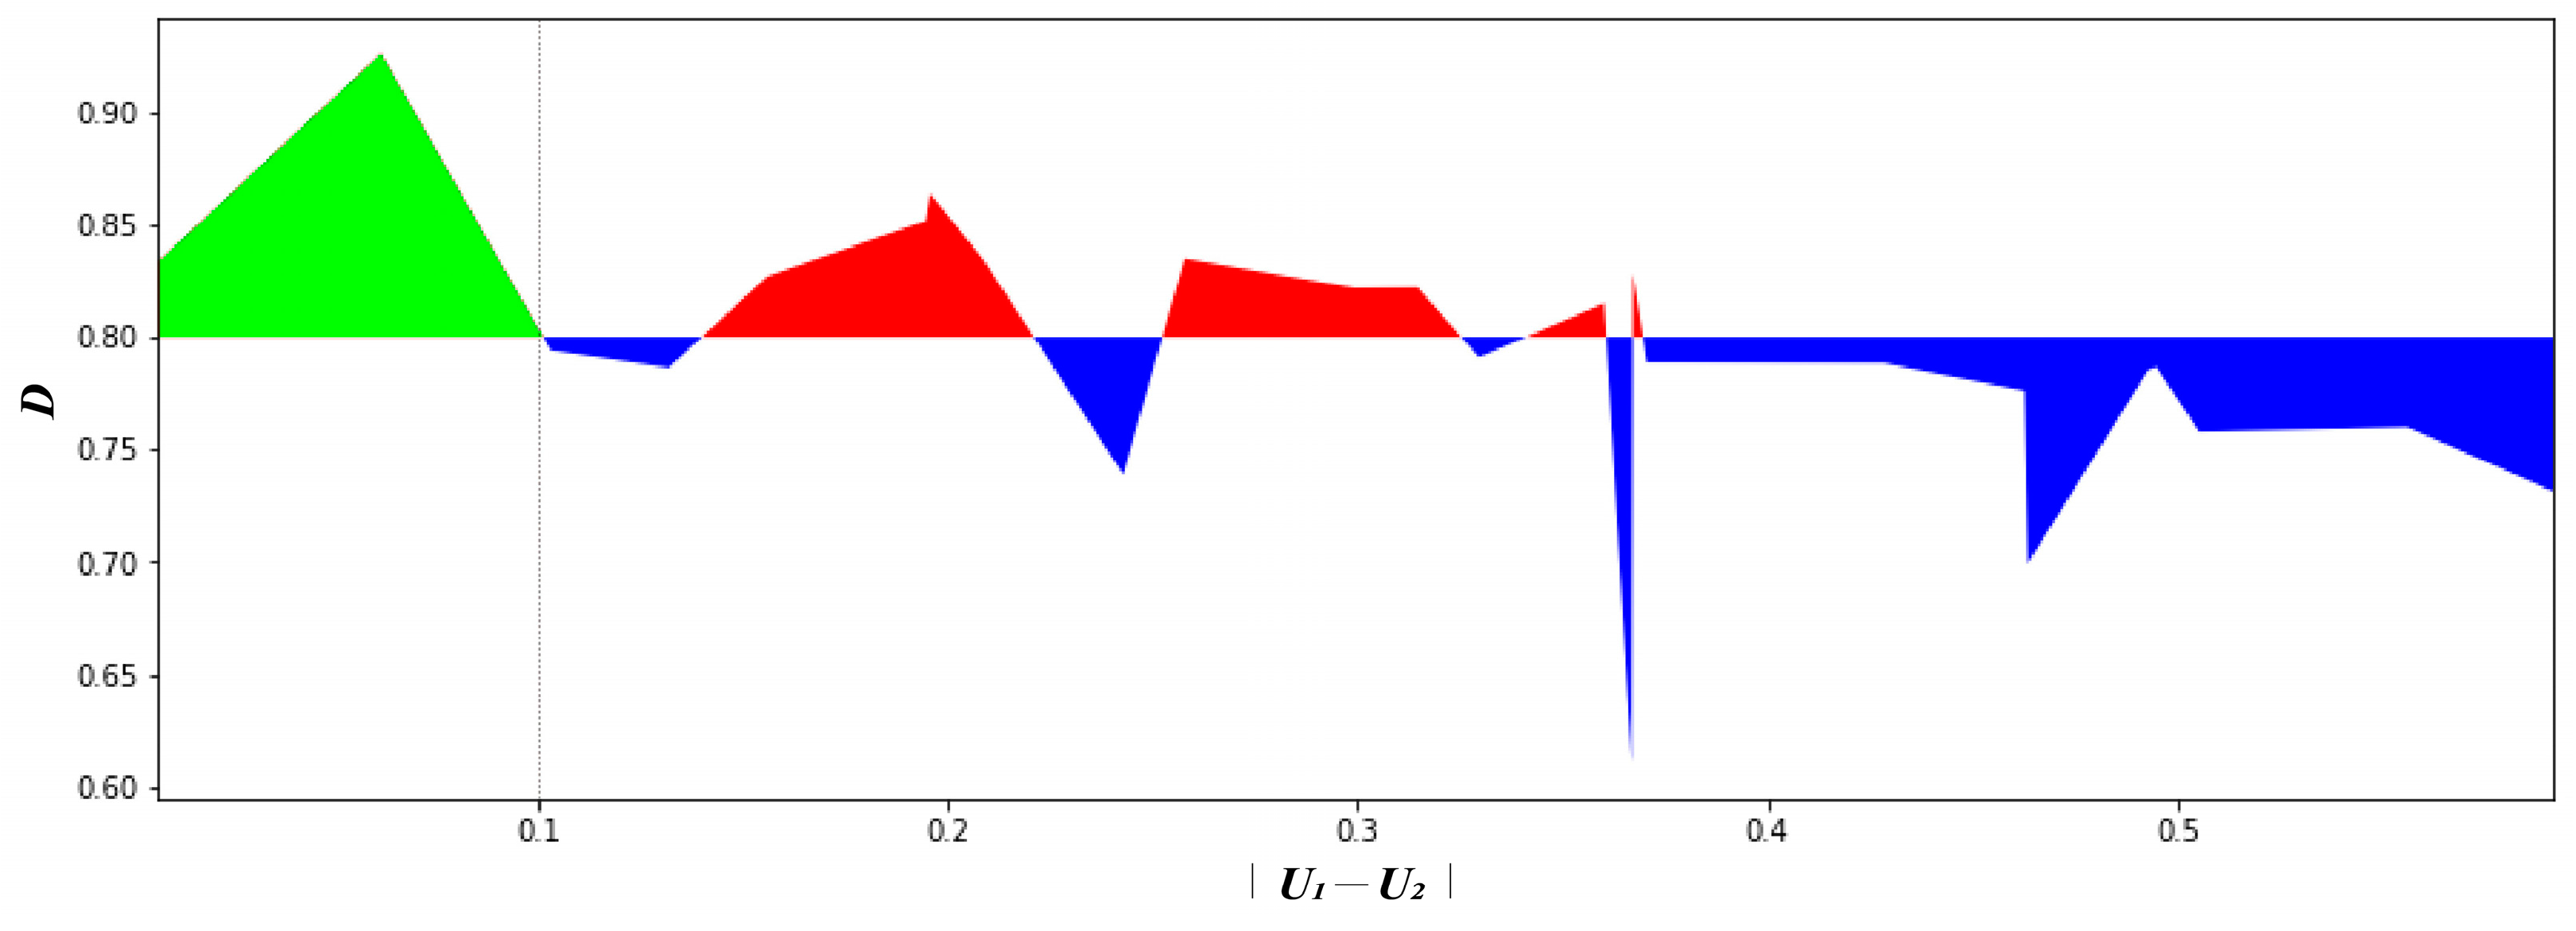
The distribution of the 25 regulation scenario types is shown in Figure 3. The vertical axis represents the CCD, while the horizontal axis shows the absolute difference between the quality indices of the two systems. Additionally, the classification of the scenarios was determined by the horizontal line , which divides basic coordination () from high-level coordination (). The vertical line, , marks the boundary between synchronized and unsynchronized scenarios. The 25 scenarios were classified into three categories: the green area represents high-level coordination and synchronization between the two systems, the red area shows high-level coordination with ID lagging behind SFs, and the blue area represents basic coordination with ID lagging behind SFs. Most scenarios were found in the blue area, which corresponds to the current situation. Only three scenarios (scenarios 5, 14, and 22) were in the green area, representing the target type of high-level coordination with synchronization between and (addressing Research Question 3/Objective 3).

Figure 3.
Typology of 25 regulation scenarios. Three scenario categories: green (high coordination), red (high coordination with ID lag), and blue (basic coordination with ID lag).
4.3.2. Strategies and Recommendations
Based on a comparison of different regulation scenarios with current measurement results, three strategies for improving the balance between SF protection and ID transformation were proposed (addressing Research Question 3/Objective 3):
- Enhancing agricultural input–output benefits
The goal is to increase the total income of village agriculture. This can be achieved by promoting efficient rice–shrimp aquaculture and expanding the industrial chain. Specific measures include introducing the rice–shrimp technology model, developing areas for rice–shrimp co-cultivation, diversifying agricultural products, and adding interactive experience activities like science education, fishing, and sightseeing.
- 2.
- Improving agricultural scale–quality benefits
This strategy aims to enhance agricultural production scale, promote rural e-commerce, and increase agricultural branding through phased implementation.
- Short-term goals: Build on the existing three farmer cooperatives to improve scaled production, achieving specialization and modernized management. Train farmers through vocational programs led by agricultural technicians. Consolidate fragmented land, strengthen infrastructure, and establish a smart network platform.
- Medium-term goals: Enhance rural e-commerce with a robust logistics and e-commerce platform. Use policy support and industrial foundations to create a cooperative network to expand sales channels and support individual farmers. Accelerate the entry of agricultural products into the market, increasing overall village agricultural income.
- Long-term goals: Strengthen agricultural branding and online promotion to enhance competitiveness. Introduce specialized agricultural companies to designate high-standard aquaculture zones for green, high-quality aquatic farming. Develop a distinctive local aquatic product brand, distinct from the existing “Gucheng Lake Crab” brand. Combine local aquatic crops to cultivate multiple agricultural brands, creating a strong brand effect.
- 3.
- Overall protection of the SF system and moderate improvement of the village dwelling subsystem
Villagers’ awareness of the SFs of polders and their overall protection consciousness need to be enhanced. Efforts should be made to moderately improve the harmony of traditional residential architecture and the quality of public spaces. Public service facilities should be optimized, and a few leisure and sightseeing service functions should be introduced, such as establishing an exhibition area showcasing the habitat of the polder village and a village station along the slow-walking tour route in the polder area.
5. Discussion
Exploring the interaction between SFs and ID in polder areas is crucial for rural sustainable development. While coupling coordination theory is widely used to analyze socio-economic and ecological interactions, few studies have examined the coupling between micro-level SFs and traditional agricultural development, especially in polder areas. Our findings show that Qianjia Village’s SFs and ID were in the break-in and basic coordination stages (, ), with ID lagging behind SFs (). This aligns with findings from most studies on the coupling coordination between the socio-economy and the ecological environment. For example, Zhu et al. [41] found that the rural transition and agricultural eco-environment in Zhejiang exhibited significant spatial variability and a U-shaped evolution trend, with the CCD transitioning from uncoordinated to basically coordinated states. Most coupling coordination types shifted from agricultural eco-economy lagging to rural transition lagging. Tomal Mateusz [57] observed that urban municipalities in Poland generally had higher local development indices and CCD, while rural areas lagged behind. Similarly, Cui et al. [38] observed barely balanced development () between the social economy and the water environment in Kunming due to high water consumption and pollution. These similarities may stem from the fact that SFs and ecological environments are vulnerable to economic development but also hold potential for positive feedback. Regions with different development levels should be further explored to compare causes and effects.
Analysis of CCD changes across different scenarios revealed that agricultural input–output benefits and scale–quality benefits had the greatest impact on the coupling system, followed by the village dwelling subsystem. While minor improvements in the village dwelling subsystem had limited effects, even slight declines could significantly harm SFs. Similar driving factors were identified in other studies, such as that of Liu et al. [76], who found that population and economy had greater impacts on landscape sustainability than climate and agriculture in Tibet, and that of Tang [58], who highlighted economic benefits and ecological quality as key factors in tourism–environment coupling in Heilongjiang. Tomal Mateusz [57] identified infrastructure and environment as the main obstacles to sustainable development in Polish municipalities. However, Cui et al. [38] noted that socio-economic patterns directly influenced population and GDP dynamics, while water conservation efforts had limited effects. Furthermore, Wang, G. [78] emphasized that at medium-to-high industrial development levels, production functions, technology, financing, and organizational structures become essential, while public and living functions are critical at higher levels.
6. Conclusions
This study focused on the coupling coordination of polder-based SFs and ID in the Gaochun Polder District, China. Various data sources were utilized, including field research photos, questionnaire data, yearbook data, and satellite maps, to assess the current quality level of the SFs and ID systems in the region through the comprehensive evaluation index system. The CCD model was employed to examine the interaction between SFs and ID, and 25 scenarios generated by the orthogonal design table were applied to predict future industrial transformations. The results showed that the coupling degree of SFs and ID in the district was in the break-in stage, with the CCD falling within the basic coordination range, and ID lagging behind SFs. A scenario analysis revealed that ID played a crucial role in improving the CCD. The improvement in input–output benefits and scale–quality benefits had a greater impact than the social–scientific benefits. Therefore, the focus during industrial upgrading should be on input–output benefits first. On the other hand, the SFs were in better condition than the ID in their current status. While further improvements in SFs had a smaller impact on the CCD, even a slight reduction in an SF subsystem, like the village dwelling subsystem, could have a significant negative impact.
The findings of this study have significant implications for protecting traditional villages, transforming rural industries, and shaping related policies. Firstly, for rural areas like Qianjia Village of the Gaochun Polder District—located on the periphery of major cities and significantly affected by urban–rural disparities, where space embodies cultural, ecological, landscape, and social values, and where agriculture dominates but faces transformation—the focus should remain on ID, particularly in enhancing input–output benefits and scale–quality benefits. At the same time, there should be a focus on the coupling coordinated development of SF protection and ID transformation. Specifically, this can be achieved by extending the agricultural value chain, building agricultural brands, promoting large-scale production, and improving e-commerce sales. Such measures aim to increase rural agricultural income and address issues like a singular industrial structure and insufficient development motivation. Secondly, to address the loss of SFs and ecosystem damage caused by urbanization and rural tourism development, it is essential to combine overall protection with targeted improvements. Efforts should focus on recognizing the overall value of the SF system and raising villagers’ awareness of its protection to maintain SFs in polder areas. Additionally, priority should be given to safeguarding village dwelling spaces, focusing on improving the compatibility of traditional residential building styles and enhancing the quality of public spaces, as these SF elements are densely concentrated and most vulnerable to damage.
This research has certain limitations. While the study provides a detailed analysis of Qianjia Village in the Gaochun Polder District, it is important to recognize that variations in industrial foundations and geographic conditions among villages inevitably lead to differences in development potential and direction. Therefore, the conclusions of this study are specifically applicable to rural areas where agriculture is the dominant industry and which possess distinct spatial and industrial characteristics. Second, the study is limited by the availability of industrial data at the village level. Only one year’s data were collected, using field investigations and yearbook sources. This constraint made it impossible to determine evolutionary trends, and the evaluation of spatial features (SFs) involved a degree of subjectivity. Additionally, incorporating a broader range of spatial and industrial indicators could enhance future research.
Author Contributions
Conceptualization, D.W. and W.Z.; methodology, W.Z., H.X. and D.W.; software, D.W.; validation, D.W., W.Z. and Y.Z.; formal analysis, D.W.; investigation, H.X. and D.W.; resources, W.Z.; data curation, D.W.; writing—original draft preparation, D.W.; writing—review and editing, W.Z., D.W. and Y.Z.; visualization, D.W.; supervision, W.Z.; project administration, W.Z.; funding acquisition, W.Z. All authors have read and agreed to the published version of the manuscript.
Funding
This research received no external funding.
Data Availability Statement
The original contributions presented in this study are included in the article. Further inquiries can be directed to the corresponding author(s).
Acknowledgments
Thank you to everyone who contributed to this study.
Conflicts of Interest
The authors declare no conflicts of interest.
Abbreviations
The following abbreviations are used in this manuscript:
| SF | spatial features |
| ID | industry development |
| AHP | Analytic Hierarchy Process |
| CCD | coupling coordination degree |
| SA | scenario analysis |
| PLE | production–life–ecology |
Appendix A
Table A1.
Evaluation index system of polder-based SFs and ID.
Table A1.
Evaluation index system of polder-based SFs and ID.
| System | Subsystem | Indicators | Interpretation of Indicators |
|---|---|---|---|
| rural spatial feature (S1) | Water network conservancy () | Richness of water resources (x1) | Types and quantities of water resources |
| Ecological landscape quality of water resources (x2) | Ecological level of water resources, including landscape perception and contamination degree | ||
| Abundance of hydraulic facility (x3) | Types and quantities of water facilities | ||
| Hydrological heritage conservation status (x4) | Preservation quality of the hydraulic heritage, including physical integrity and utilization, etc. | ||
| Polder farming () | Polder landscape quality (x5) | Landscape quality of dike fields and dike ponds | |
| Integrity of polder pattern (x6) | Integrity of polder morphology pattern and hierarchical system | ||
| Village dwelling () | Settlement siting and morphology fit (x7) | Closeness of the settlement site to polder–water network, and fitness of settlement form for polder morphology | |
| Integrity of street pattern (x8) | Integrity of the street pattern and hierarchical system | ||
| Public space function and vitality (x9) | Landscape quality, functionality, frequency, and number of daily users of public spaces | ||
| Public building quality and style specificity (x10) | Quality of construction work and functional adaptability of public buildings, style specificity such as the recognizability of regional features and integrity of appearance, as well as frequency and number of daily users, reflecting the level of vitality | ||
| Traditional residential building style compatibility (x11) | Percentage of the number of residential buildings that have a harmonious relationship with the site (polder–water network), recognizability, compatibility of overall architectural style, quality of project and age of construction (or restoration) | ||
| Structure iconicity and vibrancy (x12) | Identity, monumentality and symbolism of structure style, uniqueness of form and structure, and frequency and number of daily users | ||
| rural industrial development (S2) | Input–output benefit () | Per capita net income of villagers (y1*) (CNY ten thousand) | Compared with the country, the province, the city, and the region, the annual per capita net income level of villagers |
| Total income of village agriculture (y2*) (%) | Share of total annual village agricultural income in total annual village income | ||
| Per capita area of agricultural forestry land (y3*) (mu) | Per capita area of agricultural and forestry land, about 1.38 mu (0.23 acres) in China in 2019 | ||
| Surface area of pit ponds (y4*) (hectares) | Surface area of pits and ponds, about 6,418,600 hectares in China in 2019 | ||
| Scale–quality benefit () | Number of agricultural brands (y5*) (number) | Number of agricultural product brands with regional characteristics and competitiveness | |
| Level of agricultural large-scale production (y6*) (%) | Proportion of large-scale business by new agricultural business entities or village collectives such as large professional households, family farms, farmers’ cooperatives, agricultural industrialization leading enterprises, etc. | ||
| Level of agricultural e-commerce (y7*) (%) | Size of the electronic sales network formed, number of business entities engaged in e-commerce, share of agricultural products sold online | ||
| Per capita area of facility agricultural land (y8*) (m2/person) | Total area of land used for facility agriculture divided by total village population | ||
| Social–scientific benefit () | Proportion of population employed in agriculture, forestry, and fisheries (y9*) (%) | Proportion of villagers engaged in agriculture, forestry, animal husbandry, and fishery to the total number of villagers | |
| Infrastructure and amenities level (y10) (%) | Improvement and quality level of various infrastructure and welfare facilities | ||
| Number of agricultural professionals (y11*) (persons) | Number of scientific and technical personnel specialized in agriculture | ||
| Number of trainings of new vocational farmers (y12*) (times) | Number of training sessions organized for new vocational farmers |
Note: y* indicates an assigned score based on objective data. Water resources include lakes, river and canal networks, ponds, etc.; water conservancy facilities include dikes, culverts, steep gates, etc.; public buildings include small religious buildings, ancestral halls, villagers’ activity centers, etc.; structures include pagodas, piers, barges, etc.; and rural infrastructures include rainwater and sewage pipeline networks, sewage treatment stations, living and production facilities, domestic and public toilets, electric power and telecommunication facilities, fitness and activity facilities, parking lots, sanitary stations, and information stations for farmers, etc.
Table A2.
The classification of the coupling coordination degree.
Table A2.
The classification of the coupling coordination degree.
| Level () | Type | Development Modes Between Subsystems | |
|---|---|---|---|
| 0 < ≤ 0.2 | Serious incoordination | 0 ≤ ∣ − ∣ ≤ 0.1 | Serious incoordination |
| − > 0.1 | Serious incoordination with lagging | ||
| − > 0.1 | Serious incoordination with lagging | ||
| 0.2 < ≤ 0.5 | Slight incoordination | 0 ≤ ∣ − ∣ ≤ 0.1 | Low-level incoordination |
| − > 0.1 | Low-level incoordination with lagging | ||
| − > 0.1 | Low-level incoordination with lagging | ||
| 0.5 < ≤ 0.8 | Basic coordination | 0 ≤ ∣ − ∣ ≤ 0.1 | Basic coordination |
| − > 0.1 | Basic coordination with lagging | ||
| − > 0.1 | Basic coordination with lagging | ||
| 0.8 < ≤ 1.0 | High-level coordination | 0 ≤ ∣ − ∣ ≤ 0.1 | High-level coordination |
| − > 0.1 | High-level coordination with lagging | ||
| − > 0.1 | High-level coordination with lagging | ||
Notes
| 1 | https://www.tianditu.gov.cn/ (accessed on 18 October 2021). |
| 2 | http://gc.jsnc.gov.cn/jygg/yxzrsq/index.html (accessed on 18 October 2021). |
| 3 | https://www.sohu.com/a/165152776_718281 (accessed on 18 October 2021). |
References
- Segeren, W.A. Introduction to polders of the world. Water Int. 1983, 8, 51–54. [Google Scholar] [CrossRef]
- Liu, Y.S.; Li, Y.H. Revitalize the world’s countryside. Nature 2017, 548, 275–277. [Google Scholar] [CrossRef]
- Capo, E. Transformation and development in Italian rural society. Sociol. Rural. 1995, 35, 297–308. [Google Scholar] [CrossRef]
- Long, H.L.; Zou, J.; Pykett, J.; Li, Y.R. Analysis of rural transformation development in China since the turn of the new millennium. Appl. Geogr. 2011, 31, 1094–1105. [Google Scholar] [CrossRef]
- Tang, Y.; Yuan, Y.Y.; Tian, B.Q. Analysis of the Driving Mechanism of Land Comprehensive Carrying Capacity from the Perspective of Urban Renewal. Land 2023, 12, 1377. [Google Scholar] [CrossRef]
- Bhandari, H.; Mishra, A.K. Impact of demographic transformation on future rice farming in Asia. Outlook Agric. 2018, 47, 125–132. [Google Scholar] [CrossRef]
- Long, H.L.; Tu, S.S.; Ge, D.Z.; Li, T.T.; Liu, Y.S. The allocation and management of critical resources in rural China under restructuring: Problems and prospects. J. Rural Stud. 2016, 47, 392–412. [Google Scholar] [CrossRef]
- Nijhuis, S.; Bing, H. Polderscapes: The landscape architecture of the Dutch Lowlands. Landsc. Archit. 2016, 8, 38–57. [Google Scholar]
- Tuitjer, G.; Steinführer, A. The scientific construction of the village: Framing and practicing rural research in a trend study in Germany, 1952—2015. J. Rural Stud. 2021, 82, 489–499. [Google Scholar] [CrossRef]
- Reinhard, S.; Naranjo, M.A.; Polman, N.; Hennen, W. Modelling choices and social interactions with a threshold public good: Investment decisions in a polder in Bangladesh. Land Use Policy 2022, 113, 105886. [Google Scholar] [CrossRef]
- Wang, J.L.; Gao, M.X.; Guo, H.H.; Chen, E.Y. Spatiotemporal distribution and historical evolution of polders in the Dongting Lake area, China. J. Geogr. Sci. 2016, 26, 1561–1578. [Google Scholar] [CrossRef]
- Zhao, F.; Zhu, C.Q.; Zhang, J.E. Is Land Expropriation to Keep Agricultural Use an Effective Strategy for the Conservation of an Urban Agricultural Heritage System? Evidence from China. Land 2023, 12, 363. [Google Scholar] [CrossRef]
- Tan, R.; Beckmann, V.; van den Berg, L.; Qu, F. Governing farmland conversion: Comparing China with the Netherlands and Germany. Land Use Policy 2009, 26, 961–974. [Google Scholar] [CrossRef]
- Holmes, J.; Argent, N. Rural transitions in the Nambucca Valley: Socio-demographic change in a disadvantaged rural locale. J. Rural Stud. 2016, 48, 129–142. [Google Scholar] [CrossRef]
- Pan, Y.; Bai, J.Y.; Turner, S. History in Points, Lines and Polygons: Time Depth in the Landscape of Guangdong Province, Southern China. Land 2023, 12, 1979. [Google Scholar] [CrossRef]
- Li, L.Y.; Wang, L.; Qi, Z.X. The spatiotemporal variation of farmland use transition and its critical influential factors in coordinated urban-rural regions: A case of Chongqing in western China. Sustain. Cities Soc. 2021, 70, 102921. [Google Scholar] [CrossRef]
- Long, H.L.; Liu, Y.S.; Wu, X.Q.; Dong, G.H. Spatio-temporal dynamic patterns of farmland and rural settlements in Su–Xi–Chang region: Implications for building a new countryside in coastal China. Land Use Policy 2009, 26, 322–333. [Google Scholar] [CrossRef]
- Long, H.L.; Li, Y.R.; Liu, Y.S.; Woods, M.; Zou, J. Accelerated restructuring in rural China fueled by ‘increasing vs. decreasing balance’ land-use policy for dealing with hollowed villages. Land Use Policy 2012, 29, 11–22. [Google Scholar] [CrossRef]
- Guo, W.; Hou, X. From land consolidation to comprehensive planning summary and implications of the evolution of rural landscape renovation in The Netherlands. Landsc. Archit. 2016, 9, 115–120. [Google Scholar]
- Fan, J.; Zheng, B.; Zhang, B.; Huang, Z.; Liu, J. Research on the Revitalization Path of Ethnic Villages Based on the Inheritance of Spatial Cultural Genes—Taking Tujia Village of Feng Xiang Xi in Guizhou Province as a Case Study. Sustainability 2023, 15, 1303. [Google Scholar] [CrossRef]
- Yang, W.L.; Fan, B.; Tan, J.B.; Lin, J.; Shao, T. The Spatial Perception and Spatial Feature of Rural Cultural Landscape in the Context of Rural Tourism. Sustainability 2022, 14, 4370. [Google Scholar] [CrossRef]
- Ji, Z.X.; Xu, Y.Q.; Sun, M.X. Spatiotemporal characteristics and dynamic mechanism of rural settlements based on typical transects: A case study of Zhangjiakou City, China. Habitat Int. 2022, 123, 102545. [Google Scholar] [CrossRef]
- Zheng, J.; Na, L.S.; Liu, B.L.; Zhang, T.T.; Wang, H. An Ecological Service System Based Study on Suburban Rural Landscape Multifunction. Land 2021, 10, 232. [Google Scholar] [CrossRef]
- Li, H.B.; Yuan, Y.; Zhang, X.L. Evolution and transformation mechanism of the spatial structure of rural settlements from the perspective of long-term economic and social change: A case study of the Sunan region, China. J. Rural Stud. 2019, 93, 234–243. [Google Scholar] [CrossRef]
- Nolf, C.; Xie, Y.; Vannoorbeeck, F.; Chen, B. Delta Management in Evolution: A Comparative Review of the Yangtze River Delta and Rhine-Meuse-Scheldt Delta. Asia-Pac. J. Reg. Sci. 2021, 5, 597–624. [Google Scholar] [CrossRef]
- Verhoeven, J.T.A.; Setter, T.L. Agricultural Use of Wetlands: Opportunities and Limitations. Ann. Bot. 2010, 105, 155–163. [Google Scholar] [CrossRef]
- Ishtiaque, A.; Sangwan, N.; Yu, D.J. The robust-yet-fragile nature of partly engineered social-ecological systems: A case study of coastal Bangladesh. Ecol. Soc. 2017, 22, 5. [Google Scholar] [CrossRef]
- Zhang, H.; Wu, D.L. The Impact of Transport Infrastructure on Rural Industrial Integration: Spatial Spillover Effects and Spatio-Temporal Heterogeneity. Land 2022, 11, 1116. [Google Scholar] [CrossRef]
- Laks, I.; Walczak, Z. Efficiency of polder modernization for flood protection. case study of golina polder (Poland). Sustainability 2020, 12, 8056. [Google Scholar] [CrossRef]
- Zhang, L.M.; Ge, D.Z.; Sun, P.; Sun, D.Q. The transition mechanism and revitalization path of rural industrial land from a spatial governance perspective: The case of Shunde district, China. Land 2021, 10, 746. [Google Scholar] [CrossRef]
- Yin, J.; Zhao, X.; Zhang, W.J.; Wang, P. Rural land use change driven by informal industrialization: Evidence from Fengzhuang village in China. Land 2020, 9, 190. [Google Scholar] [CrossRef]
- Tong, T.T.; Yu, T.H.E.; Cho, S.H.; Jensen, K.; Ugarte, D.D. Evaluating the spatial spillover effects of transportation infrastructure on agricultural output across the United States. J. Transp. Geogr. 2013, 30, 47–55. [Google Scholar] [CrossRef]
- Tu, S.S.; Long, H.L. Rural restructuring in China: Theory, approaches and research prospect. J. Geogr. Sci. 2017, 27, 1169–1184. [Google Scholar] [CrossRef]
- Dewan, C.; Mukherji, A.; Buisson, M.-C. Evolution of water management in coastal Bangladesh: From temporary earthen embankments to depoliticized community-managed polders. Water Int. 2015, 40, 401–416. [Google Scholar] [CrossRef]
- Zou, L.L.; Liu, Y.S.; Wang, J.Y.; Yang, Y.Y. An analysis of land use conflict potentials based on ecological-production-living function in the southeast coastal area of China. Ecol. Indic. 2021, 122, 107297. [Google Scholar] [CrossRef]
- Zhao, T.Y.; Cheng, Y.N.; Fan, Y.Y.; Fan, X.N. Functional tradeoffs and feature recognition of rural production–living–ecological spaces. Land 2022, 11, 1103. [Google Scholar] [CrossRef]
- Sun, P.; Zhou, L.; Ge, D.Z. How does spatial governance drive rural development in China’s farming areas? Habitat Int. 2021, 109, 102320. [Google Scholar] [CrossRef]
- Cui, D.; Chen, X.; Xue, Y.L.; Li, R.; Zeng, W.H. An integrated approach to investigate the relationship of coupling coordination between social economy and water environment on urban scale—A case study of Kunming. J. Environ. Manag. 2019, 234, 189–199. [Google Scholar] [CrossRef]
- Feng, G.; Zhang, M. The Coupling Coordination Development of Rural E-commerce and Rural Revitalization: A Case Study of 10 Rural Revitalization Demonstration Counties in Guizhou. Procedia Comput. Sci. 2022, 199, 407–414. [Google Scholar] [CrossRef]
- Tang, Z. An integrated approach to evaluating the coupling coordination between tourism and the environment. Tour. Manag. 2015, 46, 11–19. [Google Scholar] [CrossRef]
- Zhu, C.M.; Lin, Y.; Zhang, J. Exploring the relationship between rural transition and agricultural eco-environment using a coupling analysis: A case study of Zhejiang Province, China. Ecol. Indic. 2021, 127, 107733. [Google Scholar] [CrossRef]
- Liu, W.; Zhou, W.; Lu, L.X. An innovative digitization evaluation scheme for Spatio-temporal coordination relationship between multiple knowledge driven rural economic development and agricultural ecological environment—Coupling coordination model analysis based on Guangxi. J. Innov. Knowl. 2022, 7, 100208. [Google Scholar] [CrossRef]
- Ge, D.Z.; Wang, Z.H.; Tu, S.S. Coupling analysis of greenhouse-led farmland transition and rural transformation development in China’s traditional farming area: A case of Qingzhou City. Land Use Policy 2019, 86, 113–125. [Google Scholar] [CrossRef]
- Zhang, X.; Li, Y.; Wang, Z. The Mechanism of Socio-Spatial Evolution in Rural Areas Driven by the Development of the Planting Industry—A Case Study of Yuezhuang Village in Shandong Province, China. Land 2023, 12, 456–470. [Google Scholar]
- Taylor, K. Cultural Landscapes and Asia: Reconciling International and Southeast Asian Regional Values. Landsc. Res. 2009, 34, 7–31. [Google Scholar] [CrossRef]
- UNESCO. Operational Guidelines for the Implementation of the World Heritage Convention; UNESCO World Heritage Centre: Paris, France, 1992. [Google Scholar]
- World Bank. World Development Report 2008: Agriculture for Development; World Bank: Washington, DC, USA, 2008. [Google Scholar]
- Geels, F.W.; Schot, J. Typology of Sociotechnical Transition Pathways. Res. Policy 2007, 36, 399–417. [Google Scholar] [CrossRef]
- Long, H.; Zhang, Y.; Tu, S. Rural vitalization in China: A perspective of land consolidation. J. Geogr. Sci. 2019, 29, 517–530. [Google Scholar] [CrossRef]
- Zou, L.; Liu, Y.; Wang, Y.; Hu, X. Assessment and analysis of agricultural nonpoint source pollution loads in China: 1978–2017. J. Environ. Manag. 2020, 263, 110400. [Google Scholar] [CrossRef]
- Liu, Z.; Liu, Y.; Chen, Z. Neglected idle rural residential land (IRRL) in metropolitan suburbs: Spatial differentiation and influencing factors. J. Rural Stud. 2020, 78, 163–175. [Google Scholar]
- Su, Y.; He, S.; Wang, K.; Amir, R.S.; Zhang, L.; Zhang, J.; Zhang, M.; Gan, M. Quantifying the sustainability of three types of agricultural production in China: An emergy analysis with the integration of environmental pollution. J. Clean. Prod. 2020, 252, 119650. [Google Scholar] [CrossRef]
- Chang, Y. Brand Communication Plan for Gucheng Lake Crabs in Gaochun District, Nanjing, from the Second Half of 2017 to the First Half of 2018. Master’s Thesis, Nanjing University, Nanjing, China, 26 April 2018. [Google Scholar]
- Jia, K.Y.; Qiao, W.F.; Chai, Y.B. Spatial distribution characteristics of rural settlements under diversified rural production functions: A case of Taizhou, China. Habitat Int. 2020, 102, 102201. [Google Scholar] [CrossRef]
- Chen, S.; Kwak, Y.; Zhang, L.; Mosey, G.; Deal, B. Tightly Coupling Input Output Economics with Spatio-Temporal Land Use in a Dynamic Planning Support System Framework. Land 2021, 10, 78. [Google Scholar] [CrossRef]
- Ma, L.B.; Liu, S.C.; Fang, F. Evaluation of urban-rural difference and integration based on quality of life. Sustain. Cities Soc. 2019, 54, 101877. [Google Scholar] [CrossRef]
- Tomal, M. Evaluation of coupling coordination degree and convergence behaviour of local development: A spatiotemporal analysis of all Polish municipalities over the period 2003-2019. Sustain. Cities Soc. 2021, 71, 102992. [Google Scholar] [CrossRef]
- Tang, D.Z.; Mao, M.Y.; Shi, J.G.; Hua, W.W. The Spatio-Temporal Analysis of Urban-Rural Coordinated Development and Its Driving Forces in Yangtze River Delta. Land 2021, 10, 495. [Google Scholar] [CrossRef]
- Bernués, A.; Rodríguez-Ortega, T.; Alfnes, F.; Clemetsen, M.; Eik, L.O. Quantifying the multifunctionality of fjord and mountain agriculture by means of sociocultural and economic valuation of ecosystem services. Land Use Policy 2015, 48, 170–178. [Google Scholar] [CrossRef]
- Andersen, P.S.; Vejre, H.; Dalgaard, T.; Brandt, J. An indicator-based method for quantifying farm multifunctionality. Ecol. Ind. 2013, 25, 166–179. [Google Scholar] [CrossRef]
- Zhou, J.Y.; He, P.W.; Qin, Y.J.; Ren, D.D. A selection model based on SWOT analysis for determining a suitable strategy of prefabrication implementation in rural areas. Sustain. Cities Soc. 2019, 50, 101715. [Google Scholar] [CrossRef]
- Zou, B.L.; Mishra, A.K.; Luo, B.L. Grain subsidy, off-farm labor supply and farmland leasing: Evidence from China. China Econ. Rev. 2020, 62, 101293. [Google Scholar] [CrossRef]
- He, J.Q.; Wang, S.J.; Liu, Y.Y.; Ma, H.T.; Liu, Q.Q. Examining the relationship between urbanization and the eco-environment using a coupling analysis: Case study of Shanghai, China. Ecol. Indic. 2017, 77, 185–193. [Google Scholar] [CrossRef]
- Chen, Y.; Liu, T.; Ge, Y. Examining social vulnerability to flood of affordable housing communities in Nanjing, China: Building long-term disaster resilience of low-income communities. Sustain. Cities Soc. 2021, 71, 102939. [Google Scholar] [CrossRef]
- Lv, J.; Ge, S.J. Industrial Land Performance Assessment Based on Fuzzy Analytic Hierarchy Process. Math. Probl. Eng. 2022, 2022, 1384583. [Google Scholar] [CrossRef]
- Zagroba, M.; Szczepanska, A.; Senetra, A. Analysis and Evaluation of Historical Public Spaces in Small Towns in the Polish Region of Warmia. Sustainability 2020, 12, 8356. [Google Scholar] [CrossRef]
- Tanguay, G.A.; Rajaonson, J.; Lefebvre, J.F.; Lanoie, P. Measuring the sustainability of cities: An analysis of the use of local indicators. Ecol. Indic. 2010, 10, 407–418. [Google Scholar] [CrossRef]
- Yang, Y.; Hu, N. The spatial and temporal evolution of coordinated ecological and socioeconomic development in the provinces along the Silk Road Economic Belt in China. Sustain. Cities Soc. 2019, 47, 101466. [Google Scholar] [CrossRef]
- Hashemi, F.; Olesen, J.E.; Dalgaard, T.; Borgesen, C.D. Review of scenario analyses to reduce agricultural nitrogen and phosphorus loading to the aquatic environment. Sci. Total Environ. 2016, 573, 608–626. [Google Scholar] [CrossRef]
- Hendry, D.F.; Pretis, F. Analysing differences between scenarios. Int. J. Forecast. 2022, 39, 754–771. [Google Scholar] [CrossRef]
- Van Dijk, M.; Morley, T.; Rau, M.L.; Saghai, Y. A meta-analysis of projected global food demand and population at risk of hunger for the period 2010–2050. Nat. Food 2021, 2, 494–501. [Google Scholar] [CrossRef]
- Wu, Z.H.; Zhou, L.H.; Wang, Y.B. Prediction of the Spatial Pattern of Carbon Emissions Based on Simulation of Land Use Change under Different Scenarios. Land 2022, 11, 1788. [Google Scholar] [CrossRef]
- Wang, Y.R.; Song, J.X.; Sun, H.T. Coupling interactions and spatial equilibrium analysis of water-energy-food in the Yellow River Basin, China. Sustain. Cities Soc. 2023, 88, 104293. [Google Scholar] [CrossRef]
- Zhang, Y.; Chang, X.; Liu, Y.F. Urban expansion simulation under constraint of multiple ecosystem services (MESs) based on cellular automata (CA)-Markov model: Scenario analysis and policy implications. Land Use Policy 2021, 108, 105667. [Google Scholar] [CrossRef]
- Cai, Y.P.; Cai, J.Y.; Xu, L.Y. Integrated risk analysis of water-energy nexus systems based on systems dynamics, orthogonal design and copula analysis. Renew. Sustain. Energy Rev. 2019, 99, 125–137. [Google Scholar] [CrossRef]
- Liu, H.; Liu, Y.X.; Wang, C.X.; Zhao, W.W.; Liu, S.L. Landscape pattern change simulations in Tibet based on the combination of the SSP-RCP scenarios. J. Environ. Manag. 2021, 292, 112783. [Google Scholar] [CrossRef] [PubMed]
- Yang, Y.Y.; Bao, W.K.; Liu, Y.S. Coupling coordination analysis of rural production-living-ecological space in the Beijing-Tianjin-Hebei region. Ecol. Indic. 2020, 117, 106512. [Google Scholar] [CrossRef]
- Wang, G.; Li, X.Q.; Gao, Y.J.; Zeng, C.; Wang, B.K.; Li, X.Y.; Li, X.T. How does land consolidation drive rural industrial development? Qualitative and quantitative analysis of 32 land consolidation cases in China. Land Use Policy 2023, 130, 106664. [Google Scholar] [CrossRef]
Disclaimer/Publisher’s Note: The statements, opinions and data contained in all publications are solely those of the individual author(s) and contributor(s) and not of MDPI and/or the editor(s). MDPI and/or the editor(s) disclaim responsibility for any injury to people or property resulting from any ideas, methods, instructions or products referred to in the content. |
© 2025 by the authors. Licensee MDPI, Basel, Switzerland. This article is an open access article distributed under the terms and conditions of the Creative Commons Attribution (CC BY) license (https://creativecommons.org/licenses/by/4.0/).