Article

Exploring the Spatiotemporal Driving Forces of Vegetation Cover Variations on the Loess Plateau: A Comprehensive Assessment of Climate Change and Human Activity

1
School of Information Engineering, China University of Geosciences, Beijing 100083, China
2
School of Economics and Management, China University of Geosciences, Beijing 100083, China
3
Observation and Research Station of Beijing Fangshan Comprehensive Exploration, Ministry of Natural Resources, Beijing 100083, China
4
Technology Innovation Center for Territory Spatial Big-Data, Ministry of Natural Resources of the People’s Republic of China, Beijing 100036, China
*
Author to whom correspondence should be addressed.
Land 2025, 14(5), 929; https://doi.org/10.3390/land14050929
Submission received: 10 March 2025 / Revised: 20 April 2025 / Accepted: 22 April 2025 / Published: 24 April 2025

Abstract

:
Vegetation dynamics and their underlying driving mechanisms have emerged as a prominent research focus in ecological studies of the Chinese Loess Plateau (CLP). Current investigations, however, employ simplified methodologies in analyzing the influencing factors, limiting their capacity to comprehensively elucidate the intricate and multidimensional mechanisms that govern vegetation transformations. Utilizing fractional vegetation cover (FVC) datasets spanning 2000 to 2021, this research applies both XGBoost-SHAP and Geodetector approaches for comparative analysis of the driving factors and precise quantification of climatic change (CC) and human activity (HA). The results indicate that: (1) The CLP has experienced an annual FVC increase of 0.62%, with 95.1% of the region demonstrating statistically significant vegetation improvement. (2) Precipitation and land use emerge as the primary determinants of FVC spatial distribution, with their interactive effects substantially exceeding the impacts of individual factors. (3) While both XGBoost-SHAP and Geodetector methodologies consistently identify the primary driving factors, notable discrepancies exist in their assessment of temperature’s relative importance, revealing complementary dimensions of ecological complexity captured by different analytical paradigms. (4) Approximately 94.3% of FVC variations are jointly influenced by HA and CC, with anthropogenic factors predominating at a contribution of 67%. Land use modifications, particularly transitions among cropland, grassland, and forests, constitute the principal mechanism of human influence on vegetation patterns. This investigation enhances the understanding of vegetation responses under combined natural and anthropogenic pressures, offering valuable insights for ecological rehabilitation and sustainable development strategies on the CLP.

1. Introduction

As of 2023, the global greening trend continues to strengthen, with vegetation cover approaching historical peak levels [1]. Satellite remote sensing data indicate that between 2000 and 2017, the global leaf area index (LAI) significantly increased, with China contributing to 25% of this increase, accounting for 6. 6% of the global vegetation area [2]. This trend demonstrates that China has played a key role in the global greening process [3]. In particular, the revegetation process occurring across the Chinese Loess Plateau (CLP) has emerged as a pivotal component in facilitating regional ecological enhancement and contributing significantly to worldwide vegetation expansion.
Vegetation is a fundamental component of land-based ecosystems, fulfilling a crucial function in processes such as storing soil moisture [4], mitigating soil erosion [5], and regulating regional ecological cycles [6]. Amid global change, the precise assessment of spatial and temporal variations in vegetative coverage represents a fundamental prerequisite for maintaining ecological system sustainability [7]. Climate change (CC) and human activity (HA) are the key driving forces influencing vegetation changes, a conclusion that has been widely validated at both regional and global scales [8,9,10,11]. Therefore, vegetative characteristics have been widely recognized as critical bioindicators for monitoring and evaluating the impacts of both climatic variations and anthropogenic disturbances. In recent years, analyzing vegetation reactions to CC and HA has become a central focus in ecological research [12,13], which is of great significance for deeply analyzing vegetation dynamics and its response mechanisms to environmental factors.
Climate factors play a pivotal role in regulating plant physiological processes and ecosystem dynamics [14,15], among which thermal conditions and hydrological patterns exert particularly significant influences on phytological development. Temperature serves as a fundamental determinant of plant phenological cycles, whereby elevated temperatures can prolong the vegetative period, optimize photosynthetic capacity, and augment water use efficiency, thereby promoting biomass accumulation and vegetation productivity [16,17]. However, when temperatures exceed the optimal range for vegetation growth, respiration rates increase, leading to accelerated nutrient consumption and thus limiting growth [18]. Precipitation is another crucial element that affects vegetation dynamics [19]. Precipitation increases soil moisture, maintains the water balance, and promotes root activity [20]. Especially in semi-arid and arid areas, vegetation in the ecosystem is highly sensitive to precipitation changes. Therefore, precipitation becomes the primary factor regulating vegetation dynamics in arid environments [21].
Human activity profoundly influences the spatial distribution and dynamic evolution of vegetation [22,23,24]. Environmental conservation strategies, including comprehensive soil–water conservation programs, ecological rehabilitation projects, and holistic basin management approaches, have demonstrated significant potential in enhancing habitat quality and facilitating ecological system regeneration [25,26]. However, anthropogenic interventions such as urbanization, population migration, and land use changes often lead to the destruction of natural vegetation, exacerbating regional ecological vulnerability [27,28]. While existing research has documented the profound influence of anthropogenic activities on vegetation coverage patterns, the precise mechanisms through which human interventions govern vegetation dynamics have yet to be comprehensively elucidated through systematic analysis.
Although many scholars have studied the driving factors behind vegetation cover changes on the CLP, the existing research mostly relies on single methods [29,30,31], leading to significant uncertainties and lack of generalizability in the results. Therefore, this study attempts to combine the machine learning model XGBoost-SHAP, the spatial statistical model Geodetector, and traditional regression model residual analysis to form a multidimensional, comprehensive framework for exploring the driving mechanisms of vegetation cover spatial changes.
This study focuses on the evolutionary mechanisms of CLP ecosystem and systematically carries out the following innovative research: (1) it conducts a comprehensive assessment of the spatiotemporal heterogeneity characteristics and evolutionary patterns of regional FVC; (2) it reveals the complex causes of spatial differentiation in vegetation cover through comparative analysis of XGBoost-SHAP and Geodetector models, providing complementary dimensions for interpreting the driving factors; and (3) it investigates the interactive relationship between CC and HA and further dissects the detailed impact mechanisms of human activity on vegetation succession. The research findings offer scientific proof and strategic guidance for enhancing ecosystem services and developing sustainable growth plans for the CLP.

2. Materials and Methods

2.1. Study Area

The CLP encompasses approximately 635,000 square kilometers. Its topography exhibits higher elevation in the northwest that gradually declines toward the southeast, characterized by an arid to semi-arid climate. The annual precipitation displays significant variation, from 200 mm in the northwest to 700 mm in the southeast, with roughly 70% concentrated during the summer months [29,32]. The average yearly temperature fluctuates between 4.3 °C in the northwest and 14.3 °C in the southeast, showing an upward trend of approximately 0.04–0.06 °C per year [33]. The vegetation types mainly consist of forests, grasslands, and cultivated lands (Figure 1b).

2.2. Data Sources

The vegetation cover data were sourced from MODIS-NDVI images (250 m resolution, 16-day intervals) via Google Earth Engine (GEE). The temperature and precipitation data came from the ERA5 monthly reanalysis dataset on GEE, with temperature converted from Kelvin to Celsius by subtracting 273.15. The DEM data were derived from the SRTM dataset (90 m resolution) on GEE, with the slope and aspect calculated accordingly. The population density data were taken from the LandScan global dataset (https://landscan.ornl.gov/, accessed on 20 December 2024). The GDP data were sourced from the Institute of Geographic Sciences and Natural Resources Research, Chinese Academy of Sciences (https://www.resdc.cn/, 25 December 2024). The land use data were obtained from the CLCD Land Use Classification Dataset [34].

2.3. Methods

2.3.1. Fractional Vegetation Cover

Vegetation cover is the proportion of regional area occupied by the vertical projection of vegetation (leaves, stems, branches), with FVC estimable via the pixel binary model. The calculation formula for FVC is [35]:
F V C = ( N D V I i N D V I s o i l ) / ( N D V I v e g N D V I s o i l ) .
To assess the restoration of vegetation cover, the vegetation cover increment is also calculated, as follows:
FVC   increment = F V C 2021 F V C 2000 .

2.3.2. Trend Analysis of FVC

The Theil–Sen slope statistic formula is as follows [36,37]:
β = M e d i a n X j X i j i , j > i ,
where X j and X i represent the FVC value of different years.
The Mann–Kendall statistical method was employed to evaluate the temporal patterns and their statistical significance within the sequential dataset [38,39]:
S = i = 1 n 1 J = i + 1 n s i g n X j X i ,
v a r S = n n 1 2 n + 5 18 ,
s i g n X j X i = 1 , X j X i > 0 0 , X j X i = 0 1 , X j X i < 0 ,
where n is the length of the dataset, sign is the sign function, and X i and X j are the sample time series data.
Statistical significance of temporal trends was established at three confidence intervals: 90% (Z > 1.65), 95% (Z > 1.96), and 99% (Z > 2.58), with the present investigation adopting the 95% confidence level as its analytical criterion.
Finally, the integration of Theil–Sen slope estimation outcomes with Mann–Kendall statistical significance assessments yielded a comprehensive classification scheme comprising five distinct categories (Table 1).

2.3.3. XGBoost-SHAP

To mitigate the deficiency of the Geodetector model in disregarding the mutual influences among driving parameters, the XGBoost-SHAP method can be used to calculate the contribution of each factor to vegetation cover. This approach provides an interpretative capability similar to the q-value of the Geodetector model, while also revealing the nonlinear interactions between variables, thus enhancing the interpretability of the study. Developed by Chen and Guestrin (2016) as an enhanced ensemble methodology derived from gradient boosting decision trees, XGBoost (eXtreme Gradient Boosting) underwent theoretical refinement through Lundberg and Lee’s subsequent proposition of SHAP (SHapley Additive exPlanation) in 2017 [40,41]. The SHAP methodology provides a quantitative framework for evaluating individual feature contributions to predictive outcomes, representing model predictions as an additive combination of Shapley values derived from each input variable:
g x = φ o + M j = 1 φ j ,
where g x represents the model value, φ o denotes the constant explaining the model, and φ j indicates the Shapley value for each feature.

2.3.4. Geographical Detector

Functioning as an analytical system, Geodetector enables systematic identification of spatial differentiation characteristics and probabilistic attribution of their determinant factors.
(1)
Factor detector
q = 1 h = 1 L N h σ h 2 N σ 2
The q-statistic quantifies the explanatory power of predictor X on the geospatial distribution of FVC, with values bounded between 0 and 1.
(2)
Interaction detector
The interaction detector quantifies the explanatory power of the regional variable FVC during interaction between factors X i and X j . First, the q-values of each of the two factors X i and X j are calculated separately, q( X i ) and q( X j ), then the q-value of the two-factor interaction can be calculated, q ( X i X j ), and then q( X i ), q( X j ), and q( X i X j ) are compared [42].

2.3.5. Partial Correlation Analysis

Partial correlation methodology enables the measurement of direct relationships between two variables while statistically eliminating the influence of additional confounding factors. The formula is as follows:
R x y = i = 1 n x i x ¯ y i y ¯ i = 1 n x i x ¯ 2 i = 1 n y i y ¯ 2 ,
R x y , z = R x y R x z × R y z ( 1 R x z 2 ) ( 1 R y z 2 ) ,
where x i denotes the FVC in year i, with x ¯ representing its 2000–2021 FVC mean; y i indicates the growing season temperature/precipitation, and y ¯ is the multi-year average. The partial correlation coefficient is bounded within [−1, 1], with statistical significance evaluated via t-test:
t = R n k 2 1 R 2 .

2.3.6. Residual Analysis

Developed by Evans et al. (2004), residual analysis provides a robust framework for quantifying anthropogenic contributions to vegetation dynamics [43]. The discrepancy between the actual FVC values and the predicted values quantifies the effects of HA and CC on vegetative changes:
F V C C C = a × T E P + b × P R E + c ,
F V C H A = F V C O B S F V C C C ,
F V C s l o p e = n × i = 1 n i F V C i i = 1 n i i = 1 n F V C i   n × i = 1 n i 2 ( i = 1 n i ) 2 ,
where a and b are the regression coefficients of FVC with respect to temperature and precipitation, c is the regression constant, and T E P and P R E represent temperature and precipitation, respectively. The terms F V C C C and F V C O B S represent the predicted value and actual observed value, respectively. F V C H A is the discrepancy between F V C C C and F V C O B S , which indicates the impact of HA on FVC. F V C s l o p e is the slope of FVC. Based on the trend analysis of residuals, the driving factors of FVC are categorized into six types, with the specific calculation method outlined as follows in Table 2.

3. Results

3.1. Spatiotemporal Changes of FVC in the CLP

Since the comprehensive implementation of afforestation projects, the CLP has shown a trend of greening. During 2000–2021, the CLP’s FVC exhibited interannual variability ranging from 0.34 to 0.49. Interannual comparisons revealed peak growth (11.39%) in 2002 versus the steepest decline (−8.37%) in 2015. The changes in FVC can be divided into two stages: 2001–2011 (+0.55% yr−1) and 2012–2021 (+0.49% yr−1). Overall, from 2000 to 2021, the average trend rate of vegetation cover on the CLP was 0.62% yr−1 (R2 = 0.8597), and 47.6% of the region showed a vegetation cover growth rate that exceeded the average growth rate of the entire CLP, suggesting notable revegetation and progressive environmental health improvement (Figure 2).
The CLP manifested pronounced spatial disparities in FVC dynamics during 2000–2021. Areas with more than 50% greening (measured by FVC) first showed improvement in the southeast and then expanded toward the northwest (Figure 3a). A total of 95.1% of the region exhibited a greening trend, while browning areas were primarily concentrated in cities such as Xi’an, Taiyuan, and Yinchuan (Figure 3b). There were notable differences in changes across provinces, with Shaanxi (10.13%) and Shanxi (8.53%) showing the largest FVC increments. Together, these two provinces contributed to one-third of the total greening on the CLP, while the FVC changes in Henan province were not significant (Figure 3g). Notably, the National Key Ecological Function Zone (NKEFZ) showed a vegetation increment of 10.17%, surpassing the increments in both Shaanxi and Shanxi provinces (Figure 3g). Additionally, the Sen slope distribution map revealed that 94.64% of the region exhibited a greening trend, with browning areas primarily located around urban areas (Figure 3c). Based on the Mann–Kendall significance test results, this study classified vegetation cover change trends into five categories: significant increase, slight increase, no change, slight decrease, and significant decrease (Figure 3d). Areas with significant and slight increases in vegetation cover were the most widespread, accounting for 58% of the regional area, mainly distributed in the eastern and southern parts of the Loess Plateau. Areas with significant and slight decreases in vegetation cover occupied only 1% of the regional area, scattered around the periphery of the Loess Plateau, primarily associated with urban construction. This confirmed that the ecological environment of the Loess Plateau has been developing in a positive direction over the past 20 years. These research findings strengthen the interpretation of spatiotemporal trends in vegetation cover on the Loess Plateau and enhance the robustness of the study.

3.2. Identification of Dominant Factors in FVC Spatial Distribution

3.2.1. Key Factor Analysis Based on XGBoost-SHAP

The XGBoost-SHAP algorithm was applied to identify the key factors influencing vegetation cover, with SHAP values computed to assess their relative importance (Figure 4). These factors fell into three categories, climate, terrain, and human activity, encompassing precipitation, temperature, elevation, slope, aspect, population density, GDP, and land use. The results showed that precipitation (0.440) and land use (0.244) had the highest SHAP values, making them the primary determinants of vegetation cover. Slope (0.077), elevation (0.052), population density (0.042), and temperature (0.037) followed in importance. By contrast, GDP and aspect had the lowest SHAP values, indicating minimal influence.

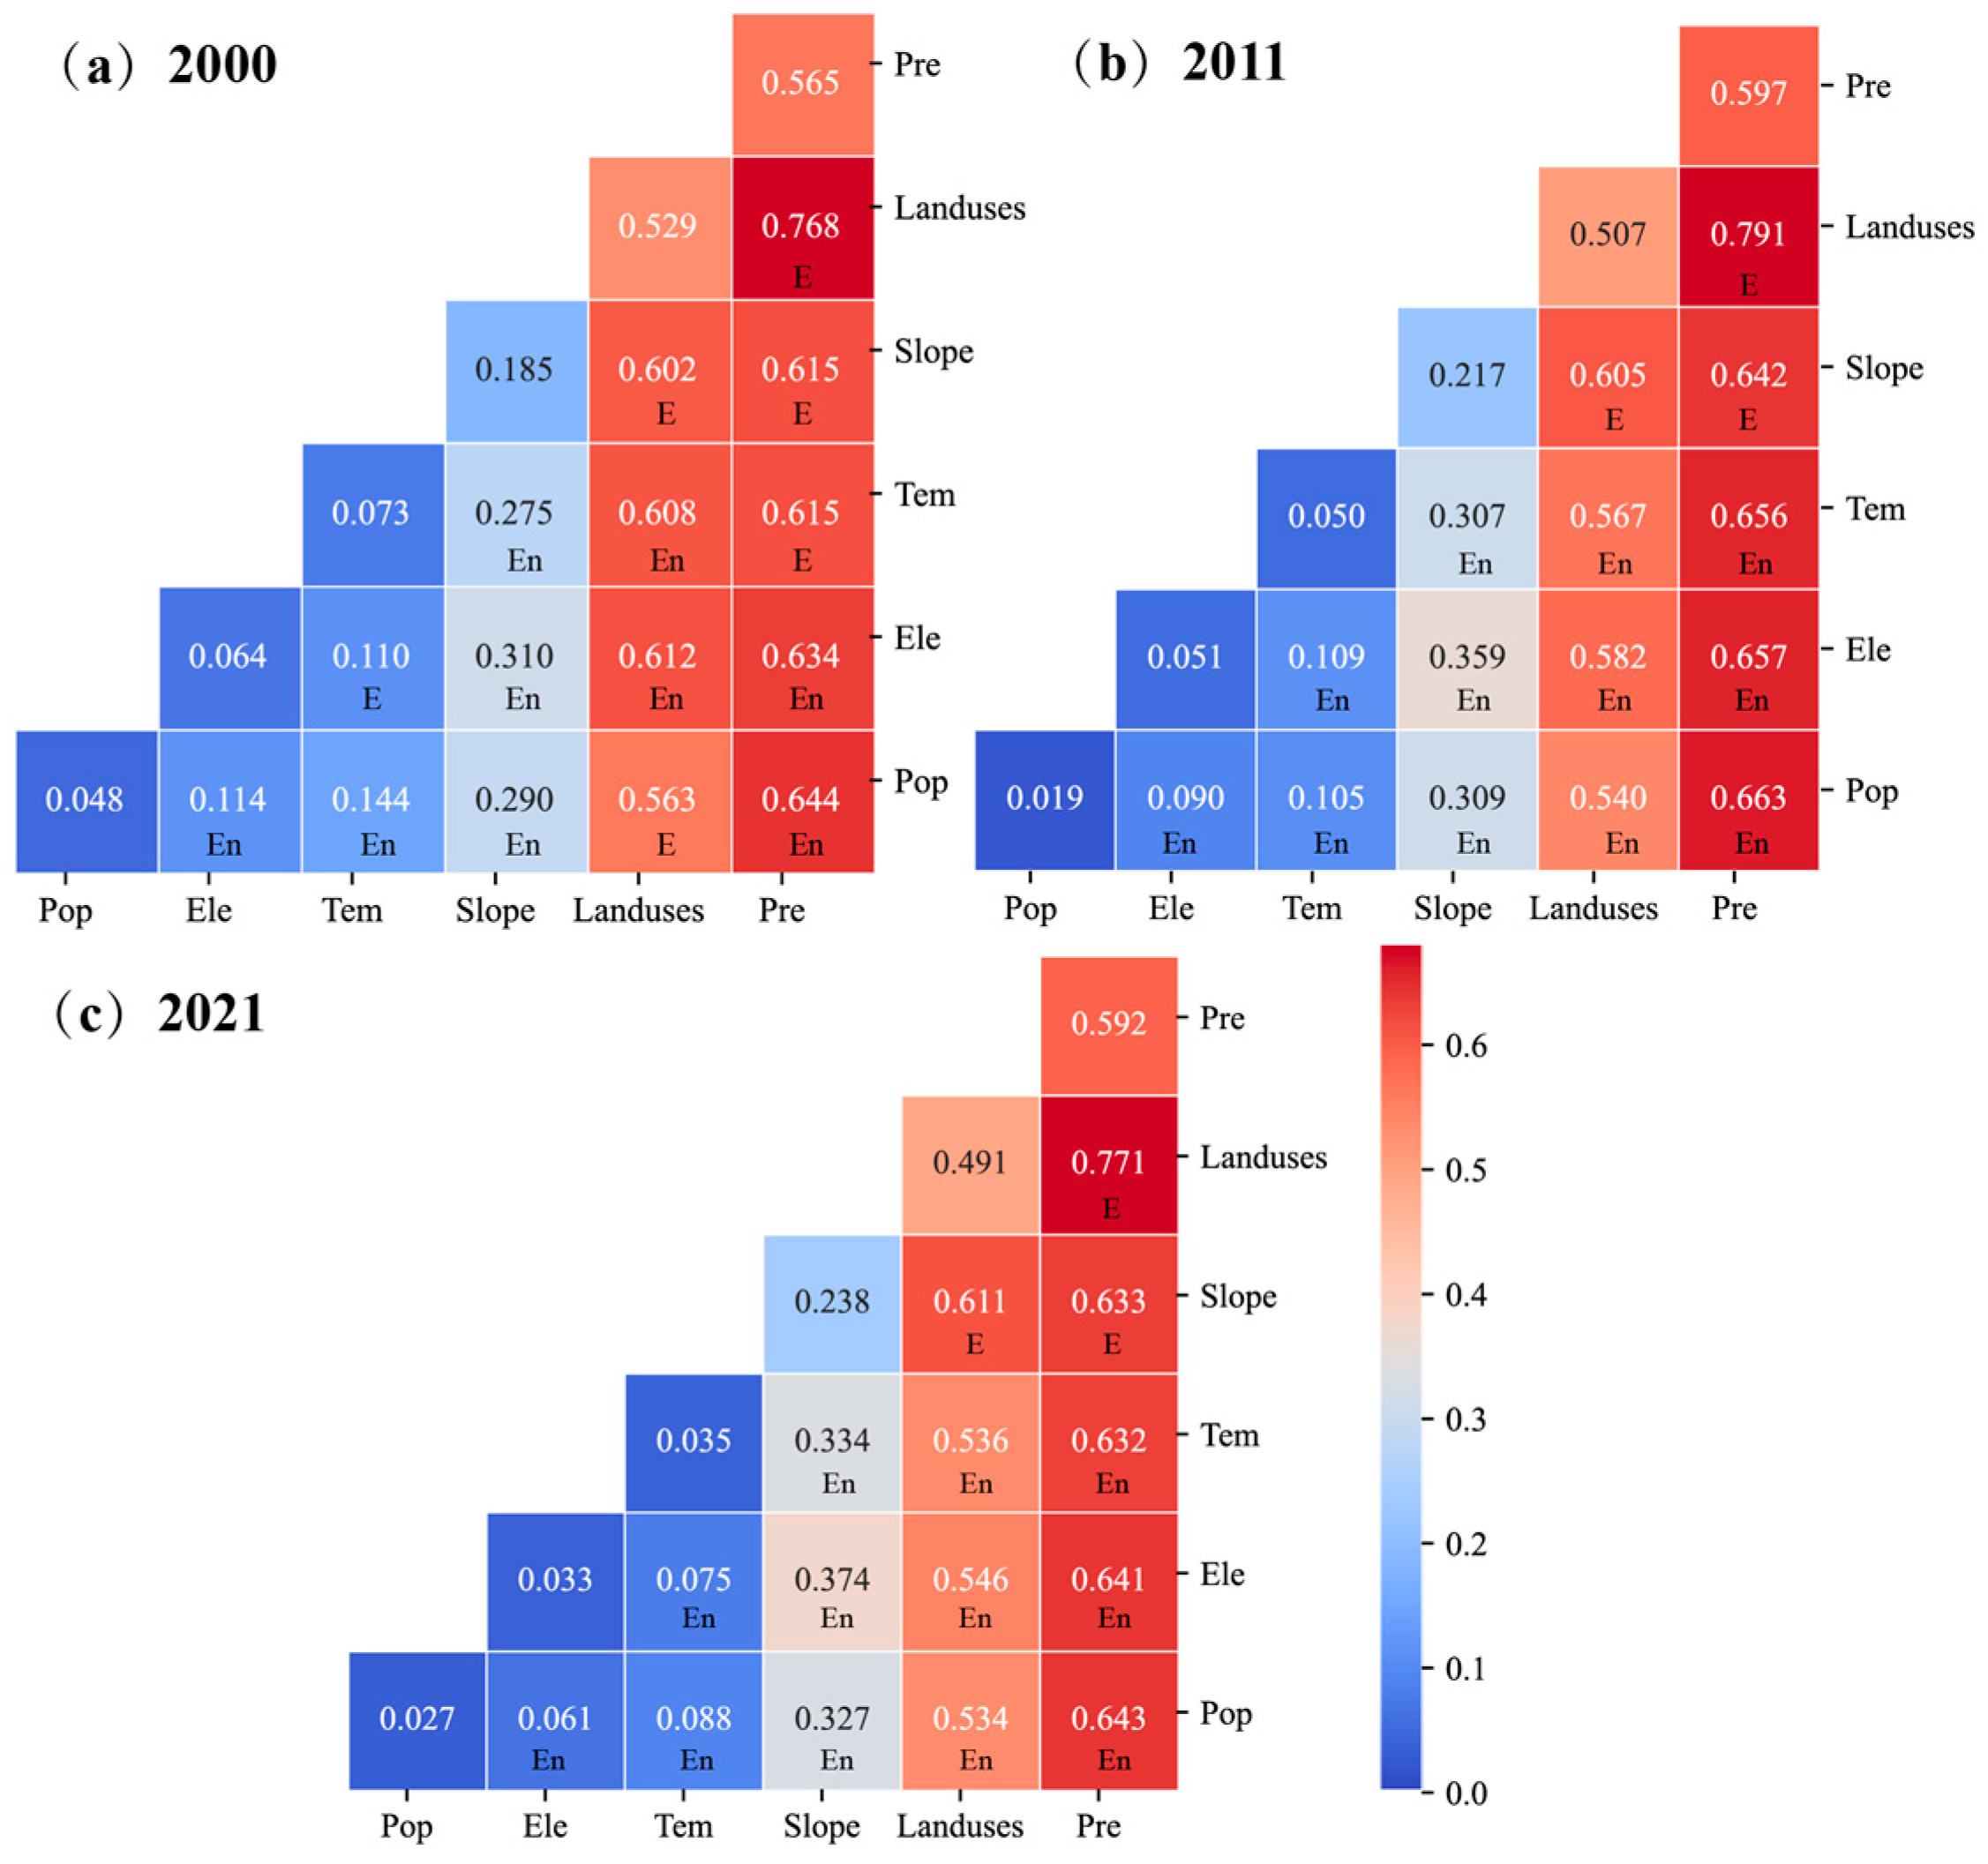
3.2.2. Driving Mechanisms of Spatial Differentiation Revealed by Geodetector

The spatial differentiation of FVC across the CLP was investigated using Geodetector’s factor detection module, which quantified determinant influences through q-statistic analysis to identify the primary spatial distribution drivers. GDP and aspect were excluded due to insignificant values. Figure 5 illustrates the factor weight changes in 2000, 2011, and 2021. The results indicated that from 2000 to 2021, all factors significantly influenced FVC (p < 0.01). Precipitation emerged as the primary driver, emphasizing moisture conditions as a key constraint on vegetation distribution. Land use ranked second in importance. The average q-value rankings were: precipitation (0.5845) > land use (0.5091) > slope (0.2136) > temperature (0.0527) > elevation (0.0493) > population density (0.0312). The q-values for temperature, elevation, and population density ranged from 0.019 to 0.073, indicating a relatively minor impact. Overall, precipitation and land use were the core drivers of FVC spatial distribution on the CLP.

3.2.3. Multi-Factor Interactions and Their Synergistic Effects

Using interaction detectors, the strength and types of interactions among the factors driving FVC changes were quantitatively assessed. The results indicated significant two-factor and nonlinear enhancement effects, where interactions between any two factors had a stronger impact on FVC than individual factors alone (Figure 6). After interaction analysis, the top three factor combinations explaining FVC in 2021 were precipitation and land use (q = 0.771), precipitation and population density (q = 0.643), and precipitation and elevation (q = 0.641). These findings underscored the combined influence of natural factors (e.g., precipitation, elevation) and human activity (e.g., land use, population density) on FVC distribution, highlighting that spatial heterogeneity on the CLP results from complex factor interactions rather than isolated effects.

3.3. The Influences of CC and HA on FVC and Their Relative Contributions

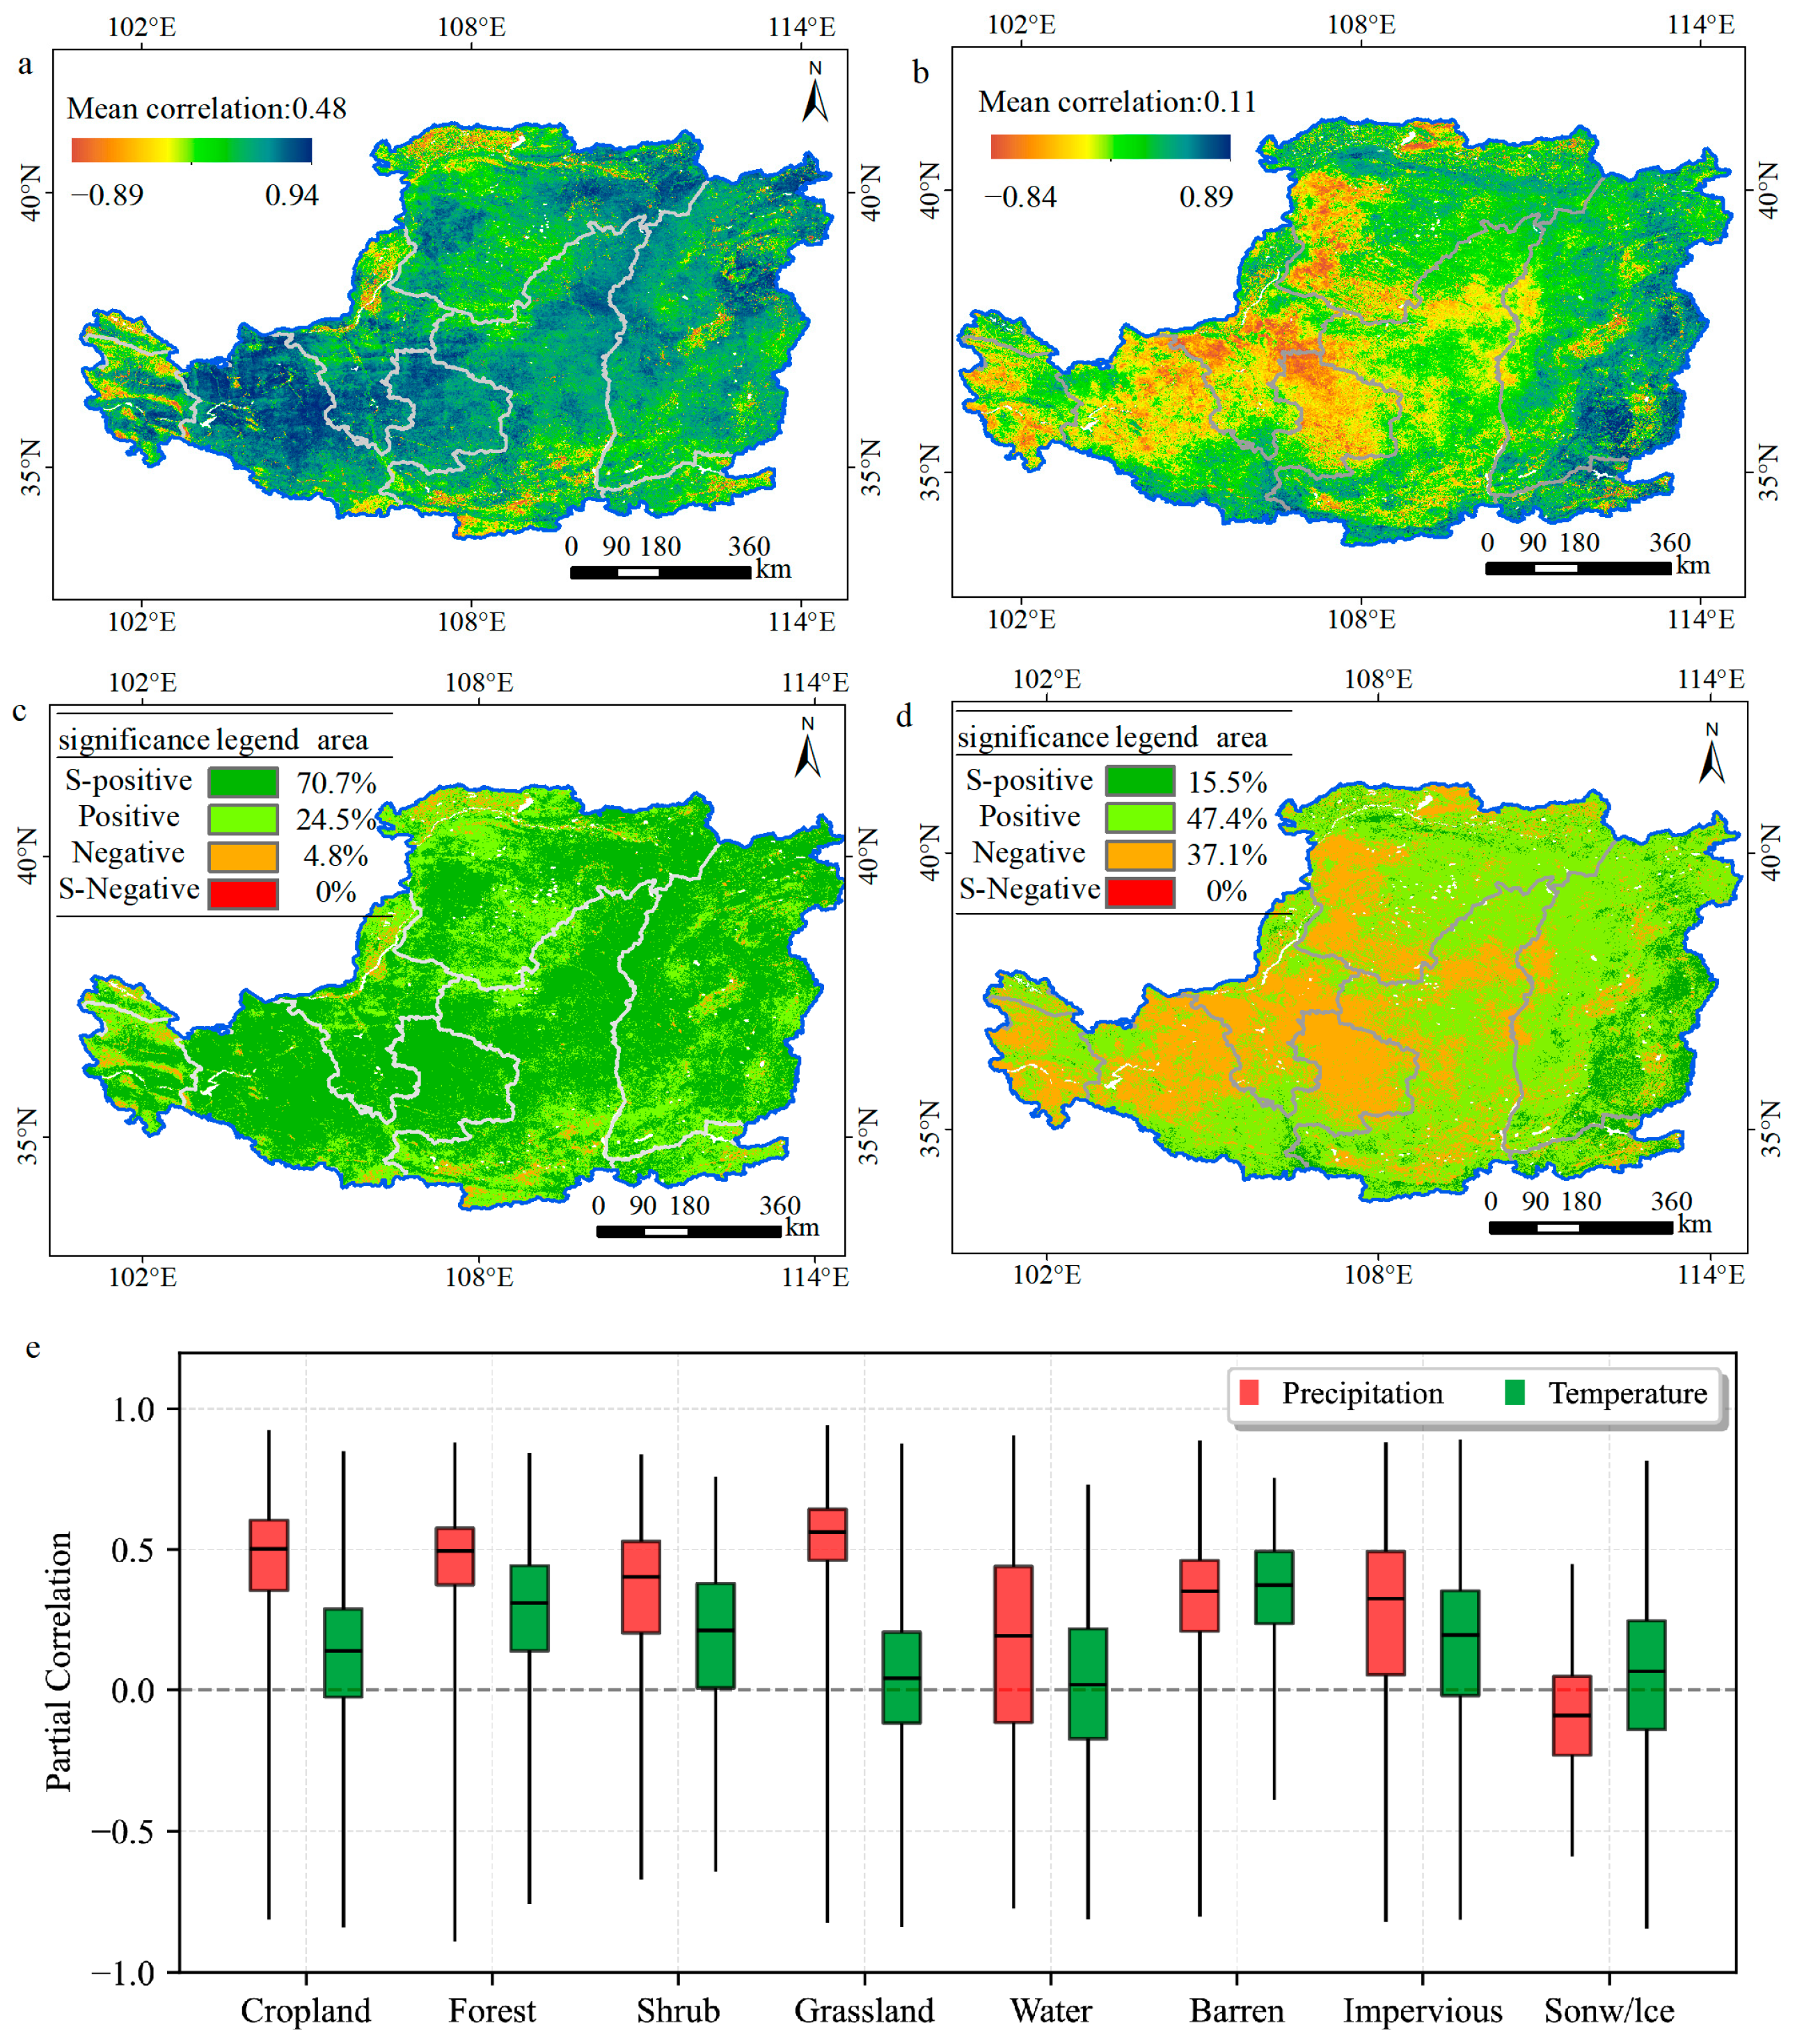
3.3.1. The Impact of CC on FVC

This investigation utilized a partial correlation methodology to assess the spatial relationships between vegetative coverage and climatic variables, specifically precipitation and temperature conditions. Analysis of the 2000–2021 period revealed that the partial correlation indices for FVC–precipitation interactions spanned from −0.89 to 0.94, whereas FVC–temperature associations exhibited a range of −0.84 to 0.89 (Figure 7a,b). Approximately 24.5% of the study area exhibited positive precipitation–FVC associations, among which 70.7% displayed statistically significant linkages, reflecting pronounced vegetation sensitivity to hydrological inputs. Conversely, inverse correlations were limited to 4.8% of the territory, predominantly concentrated in artificially irrigated agricultural systems (e.g., Bayannur and Yinchuan Plains) (Figure 7c). Temperature–FVC interactions showed distinct spatial patterns across CLP. In the humid eastern sectors, specifically eastern Shanxi, 15.5% of the land surface manifested significant positive thermal correlations. Semi-arid transitional zones (the Shaanxi–Shanxi–Inner Mongolia nexus) dominated positive temperature–FVC responses, constituting 47.4% of the CLP. Contrastingly, negative associations prevailed in arid western regions (37.1% coverage), particularly across northern Gansu, central Ningxia, and western Inner Mongolia (Figure 7d).
Excluding water bodies and snow/ice, precipitation exhibited a positive correlation with FVC across all land cover types, with grassland showing the highest correlation (0.56), followed by cropland (0.5) and forest (0.49). Temperature had the strongest correlation with bare land (0.37), forest (0.31), and shrubland (0.21) (Figure 7e). In summary, precipitation was the dominant factor shaping FVC distribution in the CLP, significantly enhancing vegetation cover. However, where precipitation was sufficient, temperature played a crucial role in promoting vegetation.

3.3.2. The Impact of Human Activity on FVC

Given the challenge of directly measuring the impact of HA on vegetation growth at the raster scale, this study used residual trend analysis to quantify HA-induced changes in FVC from 2000 to 2021. Vegetation change trends influenced by HA were categorized into five types, with their spatial distribution on the CLP shown in Figure 8.
Areas where HA promoted vegetation growth covered 86.4% of the total area, including 36% with rapid growth, mainly in the central National Key Ecological Function Zone (NKEFZ), eastern Yulin, and western Yan’an. Regions with relatively stable vegetation accounted for 10.2%, primarily in Haibei and Haidong, Qinghai Province. Meanwhile, HA-induced vegetation decline occurred in 3.1% of the area, mainly in urban centers with intense human activity, such as Yinchuan, Baotou, Xi’an, Luoyang, Zhengzhou, and Taiyuan.

3.3.3. Analysis of Drivers of Change in FVC

Figure 9 illustrates the distribution of factors driving the spatial variation in FVC. The findings revealed that 92% of the vegetation enhancement resulted from synergistic interactions between CC and HA. Specifically, regions exhibiting FVC improvement primarily driven by CC were concentrated in western and northern Inner Mongolia, constituting 1.6% of the study area. Anthropogenic factors contributed to FVC increases across 1.9% of the region, particularly in northern Inner Mongolia and Gansu. Conversely, combined CC and HA effects resulted in vegetation degradation across 2.3% of the area, predominantly surrounding urban centers including Xi’an, Luoyang, and Zhengzhou. Areas experiencing FVC reduction attributable solely to CC were minimal, representing merely 0.3% of the total area. By contrast, human-induced vegetation decline affected 2% of the region, mainly distributed across central Shanxi, northwestern Ningxia, sections of the Yellow River Basin, and urbanized zones in southern Shaanxi. These findings collectively indicated that FVC modifications across the CLP were predominantly governed by the integrated effects of CC and HA.

3.3.4. Relative Contribution Assessment of Driving Factors

Based on the residual analysis method, this study quantified the relative contributions of CC and HA to FVC changes, with CC and HA accounting for 33% and 67%, respectively, indicating HA as the dominant factor.
In the CLP, areas where FVC increased covered 95.47% of the total area. Among them, regions where CC contributed over 80% made up 2.7%, mainly in the Taiyuan, Guanzhong, and Changzhi Basins, the Qingyang–Yan’an junction, and eastern Helan Mountains (Figure 10a). Areas where HA dominated (>80%) accounted for 22.4%, including the Yinchuan and Bayannur Plains, cities along the middle and lower Yellow River, and the Mu Us Desert (Figure 10b).
Conversely, FVC degradation areas represented 4.53% of the total. Among these, regions where CC contributed over 80% accounted for 7.3%, mainly in parts of the Bayannur Plain, Haixi, and Haidong in Xining (Figure 10c). Areas where HA dominated degradation (>80%) accounted for 68.1%, mainly in cities with intense human activity, such as Yinchuan, Baotou, Xi’an, Luoyang, Zhengzhou, and Taiyuan (Figure 10d). These findings highlighted the distinct influences of CC and HA on FVC dynamics in the CLP.

4. Discussion

4.1. Differences in the Explanation of Driving Factors by XGBoost and Geodetector

This study utilized two approaches to analyze vegetation cover drivers: XGBoost-SHAP (interpretable machine learning) and Geodetector (spatial statistical analysis). Notably, the two methods yielded different rankings for temperature. XGBoost-SHAP ranked the factors as precipitation > land use > slope > elevation > population density > temperature, while Geodetector ranked them as precipitation > land use > slope > temperature > elevation > population density.
The differences in ranking between the two analytical methods were not caused by methodological or data management errors but reflected fundamental differences in identifying the driving factors, revealing complementary dimensions of ecological system complexity captured by different analytical paradigms. XGBoost-SHAP assesses factor importance based on model predictive capability, quantifying each variable’s contribution to model predictions through Shapley values; it excels at handling nonlinear relationships and focuses on how variables affect prediction accuracy. Geodetector is based on spatial stratification heterogeneity theory, specifically quantifying the explanatory power of various factors on spatial distribution patterns and directly detecting spatial correlations. Temperature operates through nonlinear thresholds in the XGBoost model, resulting in dilution of its average SHAP values. However, Geodetector likely detects high consistency between temperature spatial heterogeneity and vegetation changes, thus yielding higher q-values. The differences in results between these two methods provide multidimensional perspectives for analyzing the driving factors of vegetation coverage changes, indicating that temperature’s impact on spatial differentiation is more significant than its direct contribution in prediction models.

4.2. Analysis of Driving Factors of Vegetation Coverage Change

This study analyzed how natural and human factors influence vegetation change on the CLP from 2000 to 2021 using XGBoost-SHAP and Geodetector, considering six key factors: precipitation, temperature, elevation, slope, land use, and population density. The results indicated that precipitation contributed most to FVC, aligning with the findings of Guo et al. [44] and Zhang et al. [45]. Song et al. (2024) found that land use was the dominant factor from 2000 to 2010. However, after 2010, the influence of land use declined, while precipitation’s impact increased annually, becoming the primary factor from 2010 to 2020 [29]. This trend was the same as that in this study. Variations in findings may stem from differences in precipitation data selection and processing [29].
Vegetation’s response to climatic factors is a key process for explaining ecosystem dynamics and structure [32]. From 2000 to 2020, the average precipitation on the CLP increased by 35 mm, and the temperature rose by 1.3 °C, indicating a positive trend of warming and humidification in the region [29,46]. This climatic shift toward a warmer and wetter condition has extended the growing season and significantly promoted greening [33]. On the one hand, the increase in temperature in autumn and winter has advanced the spring phenological period on average by 0.54 days annually over the past 20 years, which is favorable for vegetation’s accumulated growth heat [47]. On the other hand, precipitation had a significant impact on vegetation phenology, with increased precipitation in spring and autumn effectively prolonging the growing season and further promoting vegetation recovery [48].
The analysis results showed that the impact of precipitation on vegetation cover far exceeds that of temperature, with average partial correlation coefficients of 0.48 and 0.11 (Figure 7) and contributions to FVC changes of 58.45% and 5.27% (Figure 5), respectively. This is mainly due to the CLP being predominantly arid and semi-arid. While climate warming increases plant respiration, it also intensifies the evaporation of moisture from vegetation, reducing productivity [49]. By contrast, increased precipitation improves soil moisture, alleviating the adverse effects of temperature and solar radiation changes on vegetation [50] and thereby promoting vegetation recovery. Subsequent SPEI (Standardized Precipitation Evapotranspiration Index)–NDVI correlation assessments revealed predominant positive covariation across most CLP regions (Figure 11). The negatively correlated areas accounted for only 8.5%, mainly located in the irrigated areas of the Ningxia Plain, Hetao Plain, Fenhe River Basin, Datong Plain, and the boundary regions of the Mu Us Desert, Yulin, and Ordos, where water supply is human-controlled and not directly affected by climate. Therefore, water resources are the key limiting factor for vegetation growth on the CLP, a point that has been confirmed in previous studies [31].
Land use emerged as the dominant driver of vegetation dynamics, explaining 50.91% of observed variations. The 2000–2021 period witnessed most pronounced land use transitions in cropland, predominantly transitioning to forested and grassland ecosystems. The area of cultivated land decreased from 200,628 km2 to 184,217 km2, a reduction of 16,410 km2. Meanwhile, the areas of forests and grassland increased by 14,665 km2 and 4626 km2, respectively. Bare land mainly converted into cropland and grassland, with an area reduction of 12,167 km2 (Figure 12). These changes highlight the profound impact of the Grain for Green Program on land use dynamics, which has overall promoted vegetation restoration on the CLP. This observation aligns with the study by Chen et al. (2019), whose empirical analysis identified anthropogenic activities as the dominant contributor to global greening trends [2].
Residual trend analysis has been widely utilized to assess quantitatively the proportional impacts of CC and HA on FVC dynamics. During the 2000–2021 period, vegetation cover changes on the CLP were influenced by CC and HA, which contributed to 33% and 67% of the vegetation changes, respectively. These findings demonstrate substantial alignment with prior investigations by Ren, Fan, and collaborators [51,52]. However, Shi et al. (2021) employed SPEI along with precipitation data as climatic indicators, revealing that CC and HA accounted for 45.78% and 54.22% of vegetation dynamics, respectively [31]. Zheng et al. (2019) utilized net primary productivity (NPP) as their primary climate variable, determining that CC and HA contributed 57.65% and 42.35% to vegetation changes, respectively [53]. These variations in findings likely arise from the complex and diverse ways in which vegetation responds to different climatic drivers. The selection of distinct climatic parameters across studies inevitably introduces variability in the estimation of CC’s influence. Considering the intricate and evolving interplay between vegetation and climatic elements, subsequent investigations should prioritize the development of systematic frameworks for climate variable selection. Furthermore, the construction of advanced vegetation–climate interaction models is essential to improve the precision and validity of residual trend analysis methodologies.

4.3. Limitations and Future Research Directions

This study has certain limitations, and further in-depth exploration and improvements are needed in future research. First, various factors influencing vegetation change should be comprehensively considered. Studies have shown that increased CO2 application and nitrogen deposition may promote the greening phenomenon of vegetation [54]. In addition, factors such as soil moisture, soil type, and solar radiation have been shown to notably affect vegetation growth and distribution [45]. Future studies should take a more comprehensive approach in considering these driving factors. Second, in the process of estimating FVC, although using MODIS-NDVI data has high scientific validity and objectivity, these data often suffer from low spatial resolution, which leads to a lack of sufficient detail. With advancements in computer technology, machine learning methods for FVC estimation have become an increasingly popular alternative. Third, a long-term time series analysis and prediction of the dominant influencing factors in specific regions, such as extreme precipitation and land use management strategies, will be necessary to explore their changes in detail. This will allow for prompt adaptations in ecological protection and resource management strategies to efficiently address potential challenges from future environmental changes.
In addition, although the Grain for Green program has made significant progress in improving land degradation [55], alleviating soil erosion [2], reducing regional temperatures [56], and increasing carbon storage [57], there are still some potential issues. In the initial phases of ecological restoration in China, large-scale afforestation served as the main approach for improving vegetation cover, but its high water consumption can lead to a decline in groundwater levels, which may result in seedling mortality [58]. Currently, vegetation restoration on the CLP is approaching the region’s water resource carrying capacity [59], and large-scale afforestation is no longer suitable. Therefore, new governance models need to be explored. As such, within the framework of the Sustainable Development Goals (SDGs), future strategies for vegetation restoration should be more refined, diversified, and sustainable. First, zonal management should be implemented, and restoration plans should be tailored to local conditions. In arid and semi-arid regions, priority should be given to restoring grassland and drought-resistant shrubs to reduce water consumption. In humid and semi-humid regions, forest cover can be moderately increased, but suitable tree species must be selected in consideration of water resource carrying capacity. Second, water-saving ecological restoration technologies should be promoted, such as the use of biotechnology to breed drought-resistant and drought-tolerant local plants and the construction of multi-layered vegetation structures to reduce water consumption and enhance ecosystem stability. Additionally, water resource management should be strengthened, optimizing the allocation of water between ecological and agricultural uses, promoting efficient irrigation technologies, and establishing groundwater monitoring networks to prevent over-extraction. Finally, technological innovations should be strengthened by utilizing machine learning and big data to construct accurate climate–vegetation dynamic models that can evaluate the impact of global warming and extreme climate events (such as droughts and floods) on FVC in order to promote sustainable restoration of the CLP ecosystem.
The ecological restoration of the Loess Plateau is a significant practice in China’s ecological civilization construction, having evolved through stages from slope management, integrated slope-gully management, and comprehensive small watershed governance to the large-scale Grain for Green Program initiated in 1999. The implementation of these policies has produced notable social and political impacts. On the one hand, the Grain for Green Program has advanced in coordination with targeted poverty alleviation policies, achieving a win–win outcome of ecological improvement and poverty eradication [60]. On the other hand, it has promoted agricultural restructuring and labor force transfer, constructing diversified income channels for farmers through the development of specialized industries and ecological compensation mechanisms [61].
Looking to the future, ecological restoration in the Loess Plateau should transition from “increasing quantity” to “improving quality.” There is an urgent need to establish long-term ecological compensation mechanisms to address potential risks when existing subsidy policies expire. Additionally, efforts should be strengthened to transform ecological product values and explore scientific pathways to realize the concept that “lucid waters and lush mountains are invaluable assets,” ultimately achieving the sustainable development goal of harmonious coexistence between humans and nature.

5. Conclusions

In this study, XGBoost-SHAP, Geodetector, and residual analysis methods were utilized to systematically investigate the spatiotemporal variation characteristics and driving mechanisms of vegetation coverage on the CLP from 2000 to 2021, quantifying the impacts of CC and HA on vegetation coverage. The main research conclusions are as follows:
(1)
The annual average growth rate of vegetation coverage was 0.62% (R2 = 0.8597), with 95.1% of the area showing a greening trend and 58% of the area experiencing significant vegetation increase.
(2)
Precipitation and land use emerged as primary determinants of FVC spatial distribution, with their interactive effects substantially exceeding the impacts of individual factors. The combined influence of environmental and anthropogenic elements on vegetation patterns was particularly noteworthy.
(3)
CC and HA jointly affected 94.3% of the vegetation changes on the CLP, with respective contribution rates of 33% and 67%. Land use conversion between farmland, grassland, and forest is the primary pathway through which human activity influences vegetation distribution.
(4)
The different rankings of temperature importance between XGBoost-SHAP and Geodetector methodologies revealed complementary dimensions of ecosystem analysis, suggesting temperature’s stronger influence on spatial patterns than on predictive modeling.
Future research could consider more factors that influence vegetation changes, such as CO2 concentration, nitrogen deposition, and soil moisture. While the Grain for Green Program has achieved significant success, water resource consumption from large-scale afforestation has become a growing concern. Future ecological restoration in the CLP should transition from “increasing quantity” to “improving quality,” implementing region-specific management strategies, strengthening water resource management, and establishing long-term ecological compensation mechanisms to achieve sustainable development goals.

Author Contributions

X.J.: Conceptualization; Investigation; Formal analysis; Data curation; Methodology; Resources; Software; Visualization; Writing—original draft. H.L.: Conceptualization; Investigation; Supervision; Validation; Writing—review & editing. X.Z. (Xiaoyuan Zhang): Formal analysis; Investigation; Software; Writing—review & editing. L.L.: Supervision; Investigation; D.L.: Supervision; Funding acquisition; X.Z. (Xinqi Zheng): Conceptualization; Supervision; Funding acquisition; Writing—review & editing; All authors have read and agreed to the published version of the manuscript.

Funding

This research was funded by the Third Xinjiang Scientific Expedition of the Key Research and Development Program by Ministry of Science and Technology of the People’s Republic of China (No. 2022xjkk1104); the National Natural Science Foundation of China (No. 42401520); “Deep-time Digital Earth” Science and Technology Leading Talents Team Funds for the Central Universities for the Frontiers Science Center for Deep-time Digital Earth, China University of Geosciences (Beijing); and Fundamental Research Funds for the Central Universities (No. 2652023001).

Data Availability Statement

Data supporting the key findings are provided within the results in the main text of this article. Additional raw data are available from the corresponding author upon reasonable request.

Conflicts of Interest

The authors declare no conflict of interest.

References

  1. Li, X.; Wang, K.; Huntingford, C.; Zhu, Z.; Peñuelas, J.; Myneni, R.B.; Piao, S. Vegetation Greenness in 2023. Nat. Rev. Earth Environ. 2024, 5, 241–243. [Google Scholar] [CrossRef]
  2. Chen, C.; Park, T.; Wang, X.; Piao, S.; Xu, B.; Chaturvedi, R.K.; Fuchs, R.; Brovkin, V.; Ciais, P.; Fensholt, R.; et al. China and India Lead in Greening of the World through Land-Use Management. Nat. Sustain. 2019, 2, 122–129. [Google Scholar] [CrossRef] [PubMed]
  3. Li, Y.; Piao, S.; Li, L.Z.X.; Chen, A.; Wang, X.; Ciais, P.; Huang, L.; Lian, X.; Peng, S.; Zeng, Z.; et al. Divergent Hydrological Response to Large-Scale Afforestation and Vegetation Greening in China. Sci. Adv. 2018, 4, eaar4182. [Google Scholar] [CrossRef] [PubMed]
  4. Jian, S.; Zhao, C.; Fang, S.; Yu, K. Effects of Different Vegetation Restoration on Soil Water Storage and Water Balance in the Chinese Loess Plateau. Agric. For. Meteorol. 2015, 206, 85–96. [Google Scholar] [CrossRef]
  5. Wang, S.; Fu, B.; Liang, W. Developing Policy for the Yellow River Sediment Sustainable Control. Natl. Sci. Rev. 2016, 3, 162–164. [Google Scholar] [CrossRef]
  6. Ellison, D.; Morris, C.E.; Locatelli, B.; Sheil, D.; Cohen, J.; Murdiyarso, D.; Gutierrez, V.; Noordwijk, M.V.; Creed, I.F.; Pokorny, J.; et al. Trees, Forests and Water: Cool Insights for a Hot World. Glob. Environ. Change 2017, 43, 51–61. [Google Scholar] [CrossRef]
  7. Fang, X.; Zhu, Q.; Ren, L.; Chen, H.; Wang, K.; Peng, C. Large-Scale Detection of Vegetation Dynamics and Their Potential Drivers Using MODIS Images and BFAST: A Case Study in Quebec, Canada. Remote Sens. Environ. 2018, 206, 391–402. [Google Scholar] [CrossRef]
  8. Qu, S.; Wang, L.; Lin, A.; Zhu, H.; Yuan, M. What Drives the Vegetation Restoration in Yangtze River Basin, China: Climate Change or Anthropogenic Factors? Ecol. Indic. 2018, 90, 438–450. [Google Scholar] [CrossRef]
  9. Xu, G.; Zhang, J.; Li, P.; Li, Z.; Lu, K.; Wang, X.; Wang, F.; Cheng, Y.; Wang, B. Vegetation Restoration Projects and Their Influence on Runoff and Sediment in China. Ecol. Indic. 2018, 95, 233–241. [Google Scholar] [CrossRef]
  10. Jiang, L.; Jiapaer, G.; Bao, A.; Guo, H.; Ndayisaba, F. Vegetation Dynamics and Responses to Climate Change and Human Activities in Central Asia. Sci. Total Environ. 2017, 599–600, 967–980. [Google Scholar] [CrossRef]
  11. Xu, Y.; Dong, S.; Gao, X.; Yang, M.; Li, S.; Shen, H.; Xiao, J.; Han, Y.; Zhang, J.; Li, Y.; et al. Aboveground Community Composition and Soil Moisture Play Determining Roles in Restoring Ecosystem Multifunctionality of Alpine Steppe on Qinghai-Tibetan Plateau. Agric. Ecosyst. Environ. 2021, 305, 107163. [Google Scholar] [CrossRef]
  12. Zhao, S.; Pereira, P.; Wu, X.; Zhou, J.; Cao, J.; Zhang, W. Global Karst Vegetation Regime and Its Response to Climate Change and Human Activities. Ecol. Indic. 2020, 113, 106208. [Google Scholar] [CrossRef]
  13. Qu, S.; Wang, L.; Lin, A.; Yu, D.; Yuan, M.; Li, C. Distinguishing the Impacts of Climate Change and Anthropogenic Factors on Vegetation Dynamics in the Yangtze River Basin, China. Ecol. Indic. 2020, 108, 105724. [Google Scholar] [CrossRef]
  14. Liu, Y.; Li, L.; Chen, X.; Zhang, R.; Yang, J. Temporal-Spatial Variations and Influencing Factors of Vegetation Cover in Xinjiang from 1982 to 2013 Based on GIMMS-NDVI3g. Glob. Planet. Change 2018, 169, 145–155. [Google Scholar] [CrossRef]
  15. Wu, D.; Zhao, X.; Liang, S.; Zhou, T.; Huang, K.; Tang, B.; Zhao, W. Time-Lag Effects of Global Vegetation Responses to Climate Change. Glob. Change Biol. 2015, 21, 3520–3531. [Google Scholar] [CrossRef]
  16. Myers-Smith, I.H.; Kerby, J.T.; Phoenix, G.K.; Bjerke, J.W.; Epstein, H.E.; Assmann, J.J.; John, C.; Andreu-Hayles, L.; Angers-Blondin, S.; Beck, P.S.A.; et al. Complexity Revealed in the Greening of the Arctic. Nat. Clim. Change 2020, 10, 106–117. [Google Scholar] [CrossRef]
  17. Zhu, W.; Tian, H.; Xu, X.; Pan, Y.; Chen, G.; Lin, W. Extension of the Growing Season Due to Delayed Autumn over Mid and High Latitudes in North America during 1982–2006. Glob. Ecol. Biogeogr. 2012, 21, 260–271. [Google Scholar] [CrossRef]
  18. Jiao, K.; Gao, J.; Wu, S. Climatic Determinants Impacting the Distribution of Greenness in China: Regional Differentiation and Spatial Variability. Int. J. Biometeorol. 2019, 63, 523–533. [Google Scholar] [CrossRef]
  19. Roca, A.L.; Kahila Bar-Gal, G.; Eizirik, E.; Helgen, K.M.; Maria, R.; Springer, M.S.; O’Brien, S.J.; Murphy, W.J. Mesozoic Origin for West Indian Insectivores. Nature 2004, 429, 649–651. [Google Scholar] [CrossRef]
  20. Peng, S.; Chen, A.; Xu, L.; Cao, C.; Fang, J.; Myneni, R.B.; Pinzon, J.E.; Tucker, C.J.; Piao, S. Recent Change of Vegetation Growth Trend in China. Environ. Res. Lett. 2011, 6, 044027. [Google Scholar] [CrossRef]
  21. Vicente-Serrano, S.M.; Gouveia, C.; Camarero, J.J.; Beguería, S.; Trigo, R.; López-Moreno, J.I.; Azorín-Molina, C.; Pasho, E.; Lorenzo-Lacruz, J.; Revuelto, J.; et al. Response of Vegetation to Drought Time-Scales across Global Land Biomes. Proc. Natl. Acad. Sci. USA 2013, 110, 52–57. [Google Scholar] [CrossRef] [PubMed]
  22. Li, W.; Li, X.; Tan, M.; Wang, Y. Influences of Population Pressure Change on Vegetation Greenness in China’s Mountainous Areas. Ecol. Evol. 2017, 7, 9041–9053. [Google Scholar] [CrossRef]
  23. Los, S.O. Analysis of Trends in Fused AVHRR and MODIS NDVI Data for 1982–2006: Indication for a CO2 Fertilization Effect in Global Vegetation. Glob. Biogeochem. Cycles 2013, 27, 318–330. [Google Scholar] [CrossRef]
  24. Zhu, Z.; Piao, S.; Myneni, R.B.; Huang, M.; Zeng, Z.; Canadell, J.G.; Ciais, P.; Sitch, S.; Friedlingstein, P.; Arneth, A.; et al. Greening of the Earth and Its Drivers. Nat. Clim. Change 2016, 6, 791–795. [Google Scholar] [CrossRef]
  25. Cao, S.; Chen, L.; Shankman, D.; Wang, C.; Wang, X.; Zhang, H. Excessive Reliance on Afforestation in China’s Arid and Semi-Arid Regions: Lessons in Ecological Restoration. Earth-Sci. Rev. 2011, 104, 240–245. [Google Scholar] [CrossRef]
  26. Pei, H.; Liu, M.; Jia, Y.; Zhang, H.; Li, Y.; Xiao, Y. The Trend of Vegetation Greening and Its Drivers in the Agro-Pastoral Ecotone of Northern China, 2000–2020. Ecol. Indic. 2021, 129, 108004. [Google Scholar] [CrossRef]
  27. Kalisa, W.; Igbawua, T.; Henchiri, M.; Ali, S.; Zhang, S.; Bai, Y.; Zhang, J. Assessment of Climate Impact on Vegetation Dynamics over East Africa from 1982 to 2015. Sci. Rep. 2019, 9, 16865. [Google Scholar] [CrossRef]
  28. Liu, X.; Pei, F.; Wen, Y.; Li, X.; Wang, S.; Wu, C.; Cai, Y.; Wu, J.; Chen, J.; Feng, K.; et al. Global Urban Expansion Offsets Climate-Driven Increases in Terrestrial Net Primary Productivity. Nat. Commun. 2019, 10, 5558. [Google Scholar] [CrossRef]
  29. Song, X.; Xie, P.; Sun, W.; Mu, X.; Gao, P. The Greening of Vegetation on the Loess Plateau Has Resulted in a Northward Shift of the Vegetation Greenness Line. Glob. Planet. Change 2024, 237, 104440. [Google Scholar] [CrossRef]
  30. Gou, Y.; Tao, Y.; Kou, P.; Alonso, A.; Luo, X.; Tian, H. Elucidate the Complex Drivers of Significant Greening on the Loess Plateau from 2000 to 2020. Environ. Dev. 2024, 50, 100991. [Google Scholar] [CrossRef]
  31. Shi, S.; Yu, J.; Wang, F.; Wang, P.; Zhang, Y.; Jin, K. Quantitative Contributions of Climate Change and Human Activities to Vegetation Changes over Multiple Time Scales on the Loess Plateau. Sci. Total Environ. 2021, 755, 142419. [Google Scholar] [CrossRef] [PubMed]
  32. Sun, W.; Shao, Q.; Liu, J.; Zhai, J. Assessing the Effects of Land Use and Topography on Soil Erosion on the Loess Plateau in China. CATENA 2014, 121, 151–163. [Google Scholar] [CrossRef]
  33. Sun, W.; Song, X.; Mu, X.; Gao, P.; Wang, F.; Zhao, G. Spatiotemporal Vegetation Cover Variations Associated with Climate Change and Ecological Restoration in the Loess Plateau. Agric. For. Meteorol. 2015, 209–210, 87–99. [Google Scholar] [CrossRef]
  34. Yang, J.; Huang, X. The 30 m Annual Land Cover Dataset and Its Dynamics in China from 1990 to 2019. Earth Syst. Sci. Data 2021, 13, 3907–3925. [Google Scholar] [CrossRef]
  35. Meroni, M.; Fasbender, D.; Rembold, F.; Atzberger, C.; Klisch, A. Near Real-Time Vegetation Anomaly Detection with MODIS NDVI: Timeliness vs. Accuracy and Effect of Anomaly Computation Options. Remote Sens. Environ. 2019, 221, 508–521. [Google Scholar] [CrossRef]
  36. Sen, P.K. Estimates of the Regression Coefficient Based on Kendall’s Tau. J. Am. Stat. Assoc. 1968, 63, 1379–1389. [Google Scholar] [CrossRef]
  37. Lavagnini, I.; Badocco, D.; Pastore, P.; Magno, F. Theil–Sen Nonparametric Regression Technique on Univariate Calibration, Inverse Regression and Detection Limits. Talanta 2011, 87, 180–188. [Google Scholar] [CrossRef]
  38. Mann, H.B. Nonparametric Tests Against Trend. Econometrica 1945, 13, 245–259. [Google Scholar] [CrossRef]
  39. Kendall, M.G. Rank Correlation Methods; Griffin: Oxford, UK, 1948. [Google Scholar]
  40. Lundberg, S.M.; Lee, S.-I. A Unified Approach to Interpreting Model Predictions. In Proceedings of the Advances in Neural Information Processing Systems, Long Beach, CA, USA, 4–9 December 2017; Curran Associates, Inc.: Red Hook, NY, USA, 2017; Volume 30. [Google Scholar]
  41. Chen, T.; Guestrin, C. XGBoost: A Scalable Tree Boosting System. In Proceedings of the 22nd ACM SIGKDD International Conference on Knowledge Discovery and Data Mining, San Francisco, CA, USA, 13–17 August 2016; ACM: New York, NY, USA, 2016; pp. 785–794. [Google Scholar]
  42. Wang, J.-F.; Zhang, T.-L.; Fu, B.-J. A Measure of Spatial Stratified Heterogeneity. Ecol. Indic. 2016, 67, 250–256. [Google Scholar] [CrossRef]
  43. Evans, J.; Geerken, R. Discrimination between Climate and Human-Induced Dryland Degradation. J. Arid. Environ. 2004, 57, 535–554. [Google Scholar] [CrossRef]
  44. Guo, Y.; Cheng, L.; Ding, A.; Yuan, Y.; Li, Z.; Hou, Y.; Ren, L.; Zhang, S. Geodetector Model-Based Quantitative Analysis of Vegetation Change Characteristics and Driving Forces: A Case Study in the Yongding River Basin in China. Int. J. Appl. Earth Obs. Geoinf. 2024, 132, 104027. [Google Scholar] [CrossRef]
  45. Zhang, Y.; Jiang, X.; Lei, Y.; Gao, S. The Contributions of Natural and Anthropogenic Factors to NDVI Variations on the Loess Plateau in China during 2000–2020. Ecol. Indic. 2022, 143, 109342. [Google Scholar] [CrossRef]
  46. Gao, J.; Zhang, Y.; Zheng, Z.; Cong, N.; Zhao, G.; Zhu, Y.; Chen, Y.; Sun, Y.; Zhang, J.; Zhang, Y. Ecological Engineering Projects Shifted the Dominance of Human Activity and Climate Variability on Vegetation Dynamics. Remote Sens. 2022, 14, 2386. [Google Scholar] [CrossRef]
  47. Xie, B.; Qin, Z.; Wang, Y.; Chang, Q. Monitoring vegetation phenology and their response to climate change on Chinese Loess Plateau based on remote sensing. Trans. Chin. Soc. Agric. Eng. 2015, 31, 153–160. [Google Scholar] [CrossRef]
  48. Shen, X.; Liu, B.; Henderson, M.; Wang, L.; Wu, Z.; Wu, H.; Jiang, M.; Lu, X. Asymmetric Effects of Daytime and Nighttime Warming on Spring Phenology in the Temperate Grasslands of China. Agric. For. Meteorol. 2018, 259, 240–249. [Google Scholar] [CrossRef]
  49. Naeem, S.; Zhang, Y.; Tian, J.; Qamer, F.M.; Latif, A.; Paul, P.K. Quantifying the Impacts of Anthropogenic Activities and Climate Variations on Vegetation Productivity Changes in China from 1985 to 2015. Remote Sens. 2020, 12, 1113. [Google Scholar] [CrossRef]
  50. Jiang, Y.; Guo, J.; Peng, Q.; Guan, Y.; Zhang, Y.; Zhang, R. The Effects of Climate Factors and Human Activities on Net Primary Productivity in Xinjiang. Int. J. Biometeorol. 2020, 64, 765–777. [Google Scholar] [CrossRef]
  51. Ren, Z.; Tian, Z.; Wei, H.; Liu, Y.; Yu, Y. Spatiotemporal Evolution and Driving Mechanisms of Vegetation in the Yellow River Basin, China during 2000–2020. Ecol. Indic. 2022, 138, 108832. [Google Scholar] [CrossRef]
  52. Fan, X.; Gao, P.; Tian, B.; Wu, C.; Mu, X. Spatio-Temporal Patterns of NDVI and Its Influencing Factors Based on the ESTARFM in the Loess Plateau of China. Remote Sens. 2023, 15, 2553. [Google Scholar] [CrossRef]
  53. Zheng, K.; Wei, J.-Z.; Pei, J.-Y.; Cheng, H.; Zhang, X.-L.; Huang, F.-Q.; Li, F.-M.; Ye, J.-S. Impacts of Climate Change and Human Activities on Grassland Vegetation Variation in the Chinese Loess Plateau. Sci. Total Environ. 2019, 660, 236–244. [Google Scholar] [CrossRef]
  54. Piao, S.; Wang, X.; Park, T.; Chen, C.; Lian, X.; He, Y.; Bjerke, J.W.; Chen, A.; Ciais, P.; Tømmervik, H.; et al. Characteristics, Drivers and Feedbacks of Global Greening. Nat. Rev. Earth Environ. 2020, 1, 14–27. [Google Scholar] [CrossRef]
  55. Tong, X.; Brandt, M.; Yue, Y.; Horion, S.; Wang, K.; Keersmaecker, W.D.; Tian, F.; Schurgers, G.; Xiao, X.; Luo, Y.; et al. Increased Vegetation Growth and Carbon Stock in China Karst via Ecological Engineering. Nat. Sustain. 2018, 1, 44–50. [Google Scholar] [CrossRef]
  56. Peng, S.-S.; Piao, S.; Zeng, Z.; Ciais, P.; Zhou, L.; Li, L.Z.X.; Myneni, R.B.; Yin, Y.; Zeng, H. Afforestation in China Cools Local Land Surface Temperature. Proc. Natl. Acad. Sci. USA 2014, 111, 2915–2919. [Google Scholar] [CrossRef]
  57. Lu, F.; Hu, H.; Sun, W.; Zhu, J.; Liu, G.; Zhou, W.; Zhang, Q.; Shi, P.; Liu, X.; Wu, X.; et al. Effects of National Ecological Restoration Projects on Carbon Sequestration in China from 2001 to 2010. Proc. Natl. Acad. Sci. USA 2018, 115, 4039–4044. [Google Scholar] [CrossRef] [PubMed]
  58. Deng, Y.; Wang, S.; Bai, X.; Luo, G.; Wu, L.; Chen, F.; Wang, J.; Li, C.; Yang, Y.; Hu, Z.; et al. Vegetation Greening Intensified Soil Drying in Some Semi-Arid and Arid Areas of the World. Agric. For. Meteorol. 2020, 292–293, 108103. [Google Scholar] [CrossRef]
  59. Feng, X.; Fu, B.; Piao, S.; Wang, S.; Ciais, P.; Zeng, Z.; Lü, Y.; Zeng, Y.; Li, Y.; Jiang, X.; et al. Revegetation in China’s Loess Plateau Is Approaching Sustainable Water Resource Limits. Nat. Clim. Change 2016, 6, 1019–1022. [Google Scholar] [CrossRef]
  60. Dang, X.; Gao, S.; Tao, R.; Liu, G.; Xia, Z.; Fan, L.; Bi, W. Do Environmental Conservation Programs Contribute to Sustainable Livelihoods? Evidence from China’s Grain-for-Green Program in Northern Shaanxi Province. Sci. Total Environ. 2020, 719, 137436. [Google Scholar] [CrossRef]
  61. Chen, S.; Duan, P.; Yu, X. Ecological Aspiration and the Income of Farmers Aroused by Grain for Green Project. Front. Ecol. Evol. 2022, 10, 961490. [Google Scholar] [CrossRef]
Figure 1. (a) Location map of CLP, (b) digital elevation model, (c) land use type map, and (d) precipitation divisions.
Land 14 00929 g001
Figure 2. Interannual changes of FVC from 2000 to 2021.
Land 14 00929 g002
Figure 3. Spatial patterns of greening. (a) The 2021 FVC images and the corresponding FVC values for 2000, 2011, and 2021, respectively, are the approximate cut-offs of 50%. (b) FVC increment in 2021. (c) Spatial patterns of FVC slope. (d) Significance distribution of greening and browning. (e) The temporal average of FVC values across the 2000–2021 study period. (f) The boxplot of the spatial distribution of FVC in each region. (g) The aggregated FVC increase within each designated geographical zone.
Land 14 00929 g003
Figure 4. SHAP values and factor importance rankings.
Land 14 00929 g004
Figure 5. Changes in explanatory powers (q values) in 2000, 2011 and 2021.
Land 14 00929 g005
Figure 6. Detection of FVC driving factor interactions on the CLP. E: Enhance; En: Enhance, nonlinear. E denotes q (X1 ⋂ X2) > Max(q(X1), q(X2)). En denotes q (X1 ⋂ X2) > q(X1) + q(X2). (a) Rank of interative explanatory power(top five): Pre ⋂ Landuses > Pre ⋂ Pop > Pre ⋂ Ele > Pre ⋂ Slope = Pre ⋂ Tem. (b) Rank of interative explanatory power (top five): Pre ⋂ Landuses > Pre ⋂ Pop > Pre ⋂ Ele > Pre ⋂ Tem > Pre ⋂ Slope. (c) Rank of interative explanatory power (top five): Pre ⋂ Landuses > Pre ⋂ Pop > Pre ⋂ Ele > Pre ⋂ Slope > Pre ⋂ Tem.
Land 14 00929 g006
Figure 7. Geospatial patterns of partial correlations between precipitation (a,c), temperature (b,d), and FVC. Partial correlation distribution across land cover types (e). Partial correlation graph of precipitation, temperature and different land cover types.
Land 14 00929 g007
Figure 8. The spatial distribution of residual trends in CLP.
Land 14 00929 g008
Figure 9. The spatial pattern of driving factors affecting FVC changes during 2000–2021.
Land 14 00929 g009
Figure 10. The spatial contributions of CC and HA to FVC changes. (a,b) Represent the contributions to FVC increase. (c,d) Represent the contributions to FVC decrease.
Land 14 00929 g010
Figure 11. Spatial pattern of correlation between SPEI and NDVI.
Land 14 00929 g011
Figure 12. LULC transition matrix during 2000–2021.
Land 14 00929 g012
Table 1. Statistically significant categorizations of FVC variability trend.
Grading CriteriaDegree
slope > 0.005, p < 0.05Significant increase
slope > 0.005, p > 0.05Slight increase
−0.005 < slope < 0.005No change
slope < −0.005, p > 0.05Slight decrease
slope < −0.005, p < 0.05Signficant decrease
Table 2. Identification criterion and contribution calculation of the drivers of FVC change.
Slope (FVCOBS)Driving FactorsDivision CriteriaContribution Rate (%)
Slope (FVCCC)Slope (FVCHA)Climate Change (CC)Human Activity (HA)
>0CC&HA>0>0 S l o p e   ( F V C _ C C ) S l o p e   ( F V C _ O B S ) S l o p e   ( F V C _ H A ) S l o p e   ( F V C _ O B S )
CC>0<01000
HA<0>00100
<0CC&HA<0<0 S l o p e   ( F V C _ C C ) S l o p e   ( F V C _ O B S ) S l o p e   ( F V C _ H A ) S l o p e   ( F V C _ O B S )
CC<0>01000
HA>0<00100
Disclaimer/Publisher’s Note: The statements, opinions and data contained in all publications are solely those of the individual author(s) and contributor(s) and not of MDPI and/or the editor(s). MDPI and/or the editor(s) disclaim responsibility for any injury to people or property resulting from any ideas, methods, instructions or products referred to in the content.

