Article

Spatio-Temporal Analysis of Vegetation Dynamics in Relation to Shifting Inundation and Fire Regimes: Disentangling Environmental Variability from Land Management Decisions in a Southern African Transboundary Watershed

1
Department of Geography and Geology, University of North Carolina Wilmington, 601 S College Rd., Wilmington, NC 28403, USA
2
Department of Geography and Geosciences, University of Louisville, 213 Lutz Hall, Louisville, KY 40205, USA
3
Department of Geography and Geology, Western Kentucky University, 1906 College Heights Blvd., Bowling Green, KY 42101, USA
4
Department of Geography, University of Florida, 3141 Turlington Hall, P.O. Box 11731, Gainesville, FL 32611, USA
5
Wildlife Ecology and Management, Okavango Research Institute, University of Botswana, P/Bag 285 Shorobe Road Sexaxa Maun, Botswana
*
Author to whom correspondence should be addressed.
Land 2015, 4(3), 627-655; https://doi.org/10.3390/land4030627
Submission received: 5 April 2015 / Revised: 18 June 2015 / Accepted: 14 July 2015 / Published: 27 July 2015

Abstract

:
Increasing temperatures and wildfire incidence and decreasing precipitation and river runoff in southern Africa are predicted to have a variety of impacts on the ecology, structure, and function of semi-arid savannas, which provide innumerable livelihood resources for millions of people. This paper builds on previous research that documents change in inundation and fire regimes in the Chobe River Basin (CRB) in Namibia and Botswana and proposes to demonstrate a methodology that can be applied to disentangle the effect of environmental variability from land management decisions on changing and ecologically sensitive savanna ecosystems in transboundary contexts. We characterized the temporal dynamics (1985–2010) of vegetation productivity for the CRB using proxies of vegetation productivity and examine the relative importance of shifts in flooding and fire patterns to vegetation dynamics and effects of the association of phases of the El Niño—Southern Oscillation (ENSO) on vegetation greenness. Our results indicate that vegetation in these semi-arid environments is highly responsive to climatic fluctuations and the long-term trend is one of increased but heterogeneous vegetation cover. The increased cover and heterogeneity during the growing season is especially noted in communally-managed areas of Botswana where long-term fire suppression has been instituted, in contrast to communal areas in Namibia where heterogeneity in vegetation cover is mostly increasing primarily outside of the growing season and may correspond to mosaic early dry season burns. Observed patterns of increased vegetation productivity and heterogeneity may relate to more frequent and intense burning and higher spatial variability in surface water availability from both precipitation and regional inundation patterns, with implications for global environmental change and adaptation in subsistence-based communities.

1. Introduction

Decades of steadily improved change-detection capabilities using long-term, repetitive satellite-derived data has greatly facilitated our ability to monitor worldwide environmental parameters, such as vegetation dynamics [1]. Accurate and consistent measurement of vegetation patterns is especially important in highly variable landscapes such as semi-arid savannas [2,3,4]. Quantifying changes in vegetation cover is critical not only to assess current rangeland and agricultural conditions, but particularly to improve the predictive capabilities of climate models and enable them to better capture vegetation variation induced by the influence of large-scale climate teleconnections, such as the El Niño–Southern Oscillation (ENSO), on precipitation patterns [5,6]. This paper examines trends in vegetation indices for the Chobe River Basin (CRB), a trans-boundary watershed shared between Namibia and Botswana in southern Africa, and links these patterns of change to regional climate patterns, seasonal inundation pulses, and inter-annual fire regimes using a spatial coincidence analysis. Significant vegetation changes have occurred in this key transfrontier conservation region in the last thirty years caused by a complex interplay between significant increases in wildlife populations, decreases and variability in rainfall and river inundation extents, and increasing human population and rangeland utilization by cattle [7,8,9].
Increasing populations of livestock, wildlife and people in the CRB (especially in the Zambezi Region, previously known as the Caprivi Strip of Namibia) all influence the percent tree to grass cover ratio, and thus the level of greenness, in this predominantly woodland savanna interspersed with settlements, agriculture and grazing lands. Growing human population pressure has led to an increase in agricultural activities, primarily slash and burn, fire being the most viable land management tool for subsistence farmers for millennia [10]. Grazing has also been a factor of change in these savanna ecosystems, and with increasing human populations and demands on savanna ecosystem productivity, the impact of grazing is increasing, which may have a positive feedback on biomass availability, fuel loads, and fire intensity and frequency [11]. Specifically, more grazing leads to reduced fuel loads, minimizing the intensity and damage of fires but also subsequently creating opportunities for woody vegetation growth. In the absence of fires the growth of woody vegetation is no longer limited, causing semi-arid savanna grasslands to become closed [12,13]. Therefore, grazing and its negative effect on fire frequency, when coupled with droughts, can have strong impacts on vegetation alterations leading to woody species [14,15,16]. In turn, increased shrub densities have negative effects on livestock carrying capacity, biodiversity, and soil moisture availability [17,18]. The increasing elephant (Loxodonta africana) populations in southern Africa are also modifying savanna vegetation, and this can result in conversions of woodlands to shrublands, in some areas at a rapid pace [9,19,20]. The interaction among these proximate drivers of change highlights the complexity of these systems.
Underlying these more proximate drivers in African dry land ecosystems are the effects of climate on vegetation dynamics, primarily through rainfall variability in relation to ENSO [21,22,23,24]. Generally, in southern Africa, warm phase ENSO events (El Niño) increase the chances of receiving below-average rainfall and can cause droughts that negatively influence vegetation productivity and lead to overall reductions in biomass in the main crop-growing season [25]. However, not all areas in southern Africa are similarly affected with large spatial variation on the timing, frequency and duration of rainfall during an El Niño year influencing subsequent vegetation condition. In addition, the effects of flooding and how flooding might interact with other factors in driving landscape-level vegetation dynamics is important but less well known [26]. Pricope [27] created a flood frequency index for the CRB that is used in the current analysis to evaluate vegetative response to different flooding frequencies in the expansive floodplain of the CRB. Westbrooke et al. [28] have shown that flooding was the most important factor for determining changes in vegetation composition in an arid basin in Australia, while fire and grazing were of much less importance, as water availability directly affects rooting depth for grasses versus shrubs. Similarly, in the semi-distal areas of the Okavango Delta in Botswana, Ringrose et al. [29] concluded that water-table lowering, driven by localized desiccation and resulting in increased soil salinization, led to invasions by relatively deeper-rooted woody vegetation. Westbrooke and Florentine [26] also showed that perennial grass and perennial shrubs are the most likely to be influenced by rare flooding events which means that water availability is a significant control in grassland-to-scrub transitions [4]. As surface layers become drier, the density of shrub species increases and species are selected based on their ability to access water in deeper layers of the soil horizon.
In order to understand such spatially and temporally variable vegetation productivity conditions, especially over longer time scales, we typically employ remotely-sensed vegetation indices such as the normalized difference vegetation index (NDVI). NDVI is a well-known remotely-sensed proxy for the amount of standing biomass in a given area. NDVI is based on a ratio of red and near-infrared wavelengths ((NIR − Red)/(NIR + Red)) due to the different reflectance and absorption properties of chlorophyll, a pigment found in the leaves of plants [30]. NDVI is well correlated with the amount and seasonality of above-ground net primary production and vegetation biophysical parameters such as leaf area index, green leaf biomass, and leaf photosynthetic activity [23,31].
In this study, we analyzed changes in patterns of growing-season and multi-temporal vegetation indices over a twenty-five year period (1985–2010) as a function of changes in patterns of fire and flooding along with a climatic differentiation between warm and cold ENSO phases [32] for the last decade in a spatial coincidence analysis framework designed originally for this paper. Prior work had documented the impacts of climate variability on flooding and fires regimes in the CRB [27,33], and we extended these analyses to examine the associations for all three phenomena with vegetation condition, as measured by NDVI. We used NDVI, calculated from 1985 to 2010 using data from two satellite platforms, specifically emphasizing the 2000 to 2010 period for which fire extent data was available. Based on indices of inundation and fire recurrence regimes for this region, we determined the level of association between the spatial patterns of NDVI variability and patterns of vegetation change through time.
Informed by work by Pickup and Foran [34] and more recent work [35,36,37,38], we used mean-variance analysis, a form of graphical dynamical systems analysis previously used successfully in dry land ecosystems with remotely-sensed data. Mean-variance analyses are based on established empirical relationships that show that the location of statistical vegetation parameters such as mean and variance in a Cartesian space can be correlated to field measurements of vegetation heterogeneity, homogeneity and overall vegetation productivity. Such mean-variance plots are generally used to describe the seasonal and inter-annual response of vegetation to climate and disturbances as a function of the mean greenness (a proxy for the degree of vegetation cover) and the vegetation variance, which measures the degree of heterogeneity in vegetation cover [1,35,36].
Specifically we addressed the following objectives: (1) describing vegetation dynamics in CRB over 25 years in the context of warm and cold ENSO phases using mean-variance analysis; (2) determining how the variability in vegetation productivity varies between differentially-managed and differentially-populated communal lands in Namibia and Botswana; and (3) supplementing mean-variance analyses with an analysis of the spatial patterns of vegetation productivity in relation to two important drivers of change (flooding and fire) to provide an initial assessment of the relationship between these factors of change and spatial patterns of vegetation productivity and change. Understanding the differential effects of hydro-climatic and management regimes on seasonal and long-term vegetation dynamics is important not only for assessing shifts in vegetation structure and composition but also due to the large dependency of human populations and local economies on the intricate relationship between habitat quality and wildlife-based tourism [39].

2. Materials and Methods

2.1. Study Area

The Chobe River Basin (CRB) is a multinational watershed extremely rich in wildlife, centrally located in the world’s largest transfrontier conservation areas (~440,000 km2), the Kavango Zambezi Transfrontier Conservation Area (KAZA-TFCA), established in March 2013 [40]. The basin (~2500 km2) includes parts of both Namibia and Botswana and, correspondingly, a mosaic of different land-use managements. It consists of communal lands predominantly utilized for livestock grazing in Botswana (Chobe Enclave Community Trust, CECT) or subsistence agriculture and grazing in Namibia (Salambala Conservancy). The CRB also includes two differently-managed forest reserves (Chobe and Kasane Forest Reserves), three national parks (Chobe National Park in Botswana, and Mudumu and Mamili National Parks in Namibia), and a rapidly-urbanizing area, the town of Kasane, Botswana, which is a regional tourism attraction (Figure 1). More details about each specific land management unit are given in the paragraph below, with emphasis on the dynamics of vegetation in two communal areas that are fully contained in the CRB and where management regimes and human and livestock densities vary significantly.
Figure 1. Study area in Southern Africa: Chobe River Basin (made up of the Chobe-Linyanti River basin, Mamili Wetland and Zambezi Wetlands, represented by light blue, transparent polygons) and the main land use categories in the basin, highlighting the Salambala Conservancy (Namibia) and the Chobe Enclave Community Trust (CECT, Botwana) in orange. The Chobe-Linyanti and Kwando rivers mark the boundary between Namibia (to the north) and Botswana (to the south).
Land 04 00627 g001
At the heart of the CRB and a major tourist attraction and economic engine for this region of KAZA lies Chobe National Park (10,566 km2), established in 1967, the second largest park in Southern Africa. Although on the Namibian side of the Chobe River, which marks the boundary between Namibia (to the north) and Botswana (to the south), two other national parks overlap with parts of the CRB and are wildlife refuges and more minor tourism hubs. These national parks were established in 1990 and are much smaller by comparison, namely Mudumu NP (national park) (737 km2) and Nkasa Rupara NP (320 km2), both situation in Namibia. The communal lands (organized and managed as community-based organizations in Botswana and conservancies in Namibia) in both countries are primarily used for subsistence agriculture, cattle grazing, and photographic and hunting safaris. While both communal lands lie within the floodplain of the Chobe River and are used very similarly, there are marked differences in terms of fire policies. Botswana promotes complete fire suppression in all land use units while in Namibia, after the 1996 fire suppression act limiting uncontrolled fires, the government introduced an early dry-season, patch mosaic burn program in 2006 [33]. Salambala Conservancy, the largest community-managed area in the Eastern Zambezi Region of Namibia, is one of Namibia’s most biologically diverse areas despite significant decreases in wildlife numbers during the prolonged war of independence in Namibia [41]. Chobe Enclave Community Trust (CECT), composed of only five villages with lower overall population and cattle densities, is northern Botswana’s largest tourism-driven community-based organization.
Geo-tectonically, our study region is part of the Kalahari Desert and is characterized by a relatively flat terrain with little relief varying between 830 and 1050 m above mean sea level [42]. Bio-ecoregionally, it is a heterogeneous mixed woody-herbaceous savanna ecosystem with thin alluvial and volcanic soils [43] that ranges from Mopane (Colophospermum mopane) and scrub woodlands in the higher elevation zones of CRB, to bushland, shrub and thicket mosaics and edaphic and secondary grasslands mostly present on the alluvial soils used communally for agriculture, and scattered semi-aquatic and aquatic vegetation communities in the wetlands of Mamili and Zambezi East ([44], field observations 2007 and 2009). Climatically, the CRB is located in the region of subtropical dry climates characterized by alternating dry and wet seasons. Intra-annual precipitation variability is primarily driven by the movement of the inter-tropical convergence zone (ITCZ), the global low-pressure system that defines the alternating wet/dry seasons [2,45]. The wet season occurs during the summer (October to April) and the annual average rainfall is approximately 650 mm/year [19]. At the inter-annual and decadal scale, Indian and Atlantic Ocean sea-surface temperatures and global climate oscillations such as the El Niño Southern Oscillation (ENSO) influence rainfall patterns [6,47,48]. The mean maximum and mean minimum monthly temperatures during October (hottest month) reach 39 °C and 14 °C respectively, while the coldest month is July, with a mean max temperature of 30 °C and a mean min. monthly temperature of 4 °C [49,50].

2.2. Datasets

To measure long-term vegetation patterns and dynamics (1985–2010), we used the Advanced Very High Resolution Radiometer (AVHRR) high-resolution picture transmission (HRTP) archived NDVI data and the Moderate Resolution Imaging Spectroradiometer (MODIS) NDVI MOD13Q1 product, both detailed below. We used both datasets as AVHRR was, at the time of writing this manuscript, the only satellite that could provide temporally-dense and reliable [51] vegetation index data before 2000 when the MODIS satellite was launched. Despite some drawbacks of using NDVI in savanna systems due to saturation or confusion of highly reflective sand and dense vegetation [52,53], it remains the only viable vegetation index option for conducting long-term analyses of vegetation dynamics from the 1980s. To ensure the compatibility of the two NDVI products used in the analysis, we tested the correlation between the AVHRR and MODIS data over the 4 years of overlap in our time series (between Jan. 2000 and Aug. 2004); the coefficient of correlation between the two time series is mean r = 0.92, while a two-tailed T-test indicated no significant differences between them. Finally, we used rainfall values obtained from the Tropical Rainfall Measuring Mission (TRMM) product 3B43 for the period between January 1998, when the mission started, and August 2010 to calculate monthly averages of rainfall for CRB [54]. The TRMM data were downloaded from the NASA Mirador Earth Science database (http://disc.sci.gsfc.nasa.gov/precipitation) and was used because the product has been shown to present low relative bias and good agreement with station data in tropical regions, including southern Africa [55]. To define warm and cold phase ENSO periods, we referred to the Center for Ocean Atmospheric Prediction Studies [32] classification based on Japan Meteorological Agency (JMA) observed sea-surface temperature anomalies. We chose this particular categorical classification because the JMA derivation uses observed data that selects well the known ENSO events and because we were primarily interested in associations between ENSO phase and vegetation dynamics. Additionally, we used a spatially-explicit recent FEWS Net [25] analysis focused specifically on rainfall conditions associated with known ENSO phases in southern Africa which identify a total of nine warm phase ENSO events and four cold phase ENSO events from 1985 to 2010 (marked in Figure 2).
Figure 2. Standardized monthly maximum value composites (MVC) NDVI values for Chobe River Basin from 1985 to 2010 where green bars indicate positive departures, while red bars indicate negative ones; 1994 and 1995 missing due to sensor outage. The pink shading indicates warm ENSO phase years, while the blue shading indicates cold phase ENSO events (based on ENSO data extracted from [32]).
Land 04 00627 g002

2.2.1. AVHRR Data

A continuous series (interrupted by missing data for 1994 due to the NOAA13 sensor failure) of 623 1-km spatial resolution AVHRR maximum value composite (MVC) 10-day normalized difference vegetation index (NDVI) HRTP images from 1985 to 2004 were acquired from the archive of the Coarse Resolution Imagery Database (CRID) of the Institute for Soil, Climate and Water, Agricultural Research Council of South Africa. The data provided by CRID had previously been atmospherically and spectrally calibrated, as well as corrected for sensor degradation and satellite changes as detailed in Wessels et al. [51] and we acquired our data directly from them. To create the monthly MVC NDVI stacks for our analysis, the 10-day images were consecutively stacked together and a maximum value composite was calculated [56].

2.2.2. MODIS Data

The MODIS VI (Vegetation Indices) 250-m spatial resolution, 16-day data (MOD13Q1) were acquired from USGS’s Land Processes Distributed Active Archive Center (https://lpdaac.usgs.gov/data_access/data_pool) from February 2000 to October 2010; information on the MOD13 product creation algorithm can be found in [57]. In addition, the MODIS Net Primary Productivity (NPP) C5 MOD17A3 product from 2000–2009 was used as a validation source for comparing to the basin-scale MODIS 13Q1 NDVI analysis data as different spectra are used in processing the MOD17A3;more information on the MOD17A3 product and specifically the reprocessed data used to create the yearly NPP composites for our study area can be found in Zhao and Running [58] and was downloaded for validation for this study from the USGS Earth Resources Observation and Science (EROS) website.

2.2.3. Fire and Flood Indices

Two distinct indices created in previous studies by the authors categorize fire and flood incidences, namely a fire recurrence index (FRI) and a flooding extent index (FEI). Details on the configuration and derivation of these indices are presented in Pricope [27] and Pricope and Binford [33]. The FEI, derived from MODIS MOD13Q1 Enhanced Vegetation Index (16-day, 250 m spatial resolution) data for 2000 to 2010, quantified the number of months in a given year an area is inundated and was reclassified into three classes: Areas flooded for one to three months/year, four to six months/year, and for more than seven months during a year (see Supplementary material, S1). The FRI, created using the MCD45A1 data (MODIS Burned Area Product [59] originally at 500 m resolution but resampled to 250 m to match the NDVI data spatial resolution) for 2000 to 2010, quantified the number of times a given area burned in the interval analyzed [33]. The FRI data has also been reclassified into three classes: Areas that burned between one and three times in the ten-year interval, four to six times, and areas that burned during more than seven out of the 10 years (see Supplementary material, S2). Because the derived annual fire extent data were available only for the 2000 to 2010 period, we focused the spatial coincidence component of the analysis only on the last decade to be able to incorporate both the fire and the spatial inundation extent layers into the vegetation dynamics analysis.

2.3. Data Analysis Methods

The data analysis section is composed of three distinct parts: First, we investigated the temporal dynamics of vegetation productivity using different statistical parameters for the entire time period from 1985 to 2010, using AVHRR NDVI data until 2000 and MODIS NDVI data after 2000. The second and third parts of the analysis added a spatially-explicit component to the temporal dynamics analysis by (a) performing vegetation productivity change detection analyses and (b) incorporating inundation extents and fire return intervals in the form of a spatial coincidence analysis aimed at establishing relationships between observed vegetation changes and characteristic annual fire and inundation regimes.

2.3.1. Temporal Dynamics of NDVI in the CRB

Basin-Level Analysis

Both AVHRR and MODIS data were reprojected to the Universal Transverse Mercator (UTM), WGS84 coordinate system using nearest neighbor resampling. Firstly, we created monthly MVC from both the AVHRR and MODIS NDVI data and secondly, we used the monthly composites to calculate cell-by-cell NDVI sum composites for the growing season (December through April) for each year in the analysis from 1985 to 2010 [60]. We then calculated a coefficient of variation (CV) for each monthly MVC value as a means to capture the basin’s vegetation responses to rainfall variations (droughts and wetter years) and disturbances that may not be obvious when measured solely with mean NDVI [61]. In other words, the CV values (Equation (1)) were used as a measure of NDVI variability relative to the mean-monthly NDVI values [62] and were calculated as:
CV = moNDVI·μmoNDVI) × 100
where σmoNDVI represents standard deviation for the basin for that respective month and μmoNDVI is the mean for the entire basin during a given month..

Cell-by-Cell Level Analysis

Due to the strong correlation of precipitation and NDVI (discussed specifically for this region by Gaughan et al. [63]) and because we used a multi-sensor dataset (both AVHRR and MODIS), we standardized growing season NDVI values on a cell-by-cell basis by subtracting the mean growing season NDVI (μg.s.NDVI) from the respective growing season’s actual NDVI values and dividing by the growing season NDVI standard deviation (σg.s.NDVI) across the entire study period (1985 to 2010) using the following formula:
g.s. Std. normal deviate = (g.s. NDVIi – μg.s.NDVI)/σg.s.NDVI
where μg.s.NDVI and σg.s.NDVI are spatially averaged for the entire CRB for a given growing season and g.s. NDVIi represents the cell-by-cell growing season NDVI value for a given year.
The use of g.s. NDVI standard normal deviates minimizes sensor differences in order to identify NDVI anomalies across the study area with respect to the mean. Standardized NDVI values track changes in the degree of more or less relative greenness of ground vegetation, so that negative values represent below normal vegetation conditions potentially indicative of drought and higher values represent above normal vegetation conditions usually associated with of higher rainfall [63]. Even though the time period considered (25 years) is not long enough to reflect long-term trends (which happen on roughly 30-year time spans, Nicholson et al. [64]) the shorter time periods provide insight into the directionality of change in vegetation dynamics.

Mean-Variance Analysis

Thirdly, we used mean-variance analysis to characterize the spatio-temporal behavior of NDVI through time for the entire data series. In the mean-variance plots, each sector describes the state of a landscape’s trajectory at a given time based on relationships between mean-variance and vegetation condition established from field observations in similar rangelands [35]. In this case, we represent image-specific mean and variance both monthly MVC NDVI and the April MVC NDVI for each year from 1985 to 2010. We chose the April MVC NDVI to capture the cumulative effect of the wet season on the landscape and is thus associated with the peak of vegetation occurring at beginning of the dry season in this region [38,63]. April NDVI was also used because it corresponded with field observations we used to guide the interpretation of our results. We created mean-variance plots that include all the monthly MVCs through time for both datasets, plots that focus only on the April MVC NDVI for each time period, and plots that compare the monthly MVC NDVI for two communal areas that are managed differently in terms of fire regimes, one in Botswana (characterized by extensive efforts at maintaining a regime of fire suppression) and one in Namibia (where controlled early dry season burns were instituted in 2006 and continue as the main land management practice) [33].

2.3.2. Spatial Dynamics of NDVI in the CRB

To analyze the vegetation dynamics in CRB from a spatially-explicit point of view using the MODIS data, we reclassified the cell-by-cell normal standard deviates of g.s. NDVI based on a range from above/below 2 and −2 standard deviations into five classes for each year to create maps of the distribution of lower and higher vegetation productivity based on the empirical understanding that areas that display positive departures from the mean NDVI are areas with higher average vegetation cover, while those displaying higher variances are typically associated with more heterogeneous vegetation cover (patchy vegetation with mixed-height canopies), as identified by the mean-variance plots [35,36]. Secondly, we used spatial coincidence—multiple subsequent overlays in the Raster Calculator tool of ArcGIS 10.1—to calculate Pearson’s product-moment correlation coefficient (r) to identify the strength of association between each year’s growing season standardized NDVI, the yearly FEI (the number of months an area was under inundation on average every year from 2000 to 2010: class 1—areas that were inundated between one to three months out of the year on average; class 2—inundated four to six months/year; and class 3—areas inundated more than seven months/year, see S1 in supplementary material) and the yearly and previous year’s FRI (the number of times an area burned for each individual year from 2000 to 2010: class 1—areas that burned during one to three times out of 10 years; class 2—burned four to six times/10 years; and class 3—areas burned on average more than seven times in the 10-year time interval considered, see S2 in supplementary material). The main goal was to identify the level of association between the spatial patterns of vegetation productivity during each growing season and the mapped patterns of inundation and burned area.

2.3.3. Two-Date Image Differencing: NDVI-Inundation-Fire Coincidence Analysis

To determine any possible patterns of change in vegetation productivity relative to the beginning of our time series, we performed a set of cell-by-cell standard two-date image differencing operations on the growing season NDVI between each consecutive year (2000 to 2001, 2001 to 2002, …, 2008–2009, and, finally, 2001–2009). Change calculated for a beginning (2001) and an end (2009) date provided an two time-step indication of change occurring in growing season NDVI patterns between the beginning and end point of the analysis. We chose the 2001 and 2009 dates not because they were the first and last complete record of data at the time of analysis for MODIS, but, equally importantly, because both years were climatologically comparable and preceded by two wet periods (according to the multivariate ENSO index (MEI) for southern Africa [32]. After performing the 2001–2009 two-date change detection, we created standard normal deviates of the differenced image and reclassified it into five classes measuring of standard deviation departures from the mean ranging from above and below 2 and −2 standard deviations (two classes), between ±2 to ±1 std. dev. (two classes), and to a class of no significant change recorded between ±1 std. dev (significance established using a Student’s t-test at the 95% confidence interval). Finally, we correlated this standardized difference image with the multi-annual FEI and the multi-annual FRI, both respectively classified into three classes and assessed the spatial coincidence between vegetation change and inundation and fire dynamics over the same time period.

3. Results and Discussion

3.1. Temporal Analysis of Vegetation Productivity and Variability in CRB from 1985 to 2010 Using AVHRR and MODIS NDVI Data

We plotted standardized monthly MVC NDVI values from 1986 to 2010 extracted from AVHRR and MODIS data to determine the interplay between NDVI departures from the mean that translate into overall higher or lower vegetation productivity at a basin scale (Figure 2). This period, particularly since the 1980s for much of southern Africa, has seen declines in overall precipitation amounts, an increase in the spatial and temporal variability of rainfall, and the frequency and intensity of El Niño episodes [64,66]. Average monthly NDVI varied closely as a function of rainfall distribution (see Figure 3a for the period 2000–2010) and the alternation between dry and wet ENSO events [32,65]. In general, Figure 2 highlights the association between warm (cold) ENSO phases and decreased (increased) strength of positive NDVI anomalies that supports previous findings in the literature [6,64]. During the 1988 and 1992 period for instance, over 15 drought events were reported in various areas of southern Africa, as well as an increase in the frequency and intensity of El Niño or warm ENSO phase episodes for the latter decade relative the pre-1988 [5]. More specifically, we show that standardized departures from monthly NDVI averages larger than two were recorded in 1987/88, following two years of strong dry ENSO events during the 1986/87 and 1987/88 growing seasons, as well as in 1991/92, 1995/96, 1997/98, 2002/03 or 2004/05 seasons following warm ENSO phases [32,65]. Warm phase (El Niño) ENSO is commonly associated with below-average rainfall or drought conditions in southern Africa, generally leading to decreases in vegetation productivity [67,68]. However, that is not always the case, as recent work by the Famine Early Warning Systems Network [25] has shown that, depending on location, certain regions can be completely missed by below-average rainfall, thus highlighting the high spatial variability in impacts on rainfall and growing conditions associated with warm ENSO phases. As will be discussed further below and one might expect, climatic variability and alternation of cold and warm phase ENSO do not, account for all deviations in NDVI, hence the focus of the remainder of this paper.
To further contextualize the past decade and validate our MODIS NDVI time series (2000–2010), we analyzed the correlations between mean monthly rainfall (mm/year) aggregated to mean annual amounts with an independent source of vegetation productivity, average annual NPP from the MODIS 17A3 product (mean r = 0.65) and between the mean annual NPP and the growing season NDVI average (mean r = 0.76) (Figure 3a,b). The lowest mean annual NPP value was recorded in 2005, corresponding with the low rainfall values recorded during the 2005 rainy season and three years of consecutive positive standardized departures in the multivariate ENSO index [65]. Previous work had shown that the last decade had been experiencing a decrease in net primary productivity (NPP) associated with large-scale droughts primarily in the southern Hemisphere and specifically in the southern African region of our study area [58], however given the length of our data series and year-to-year variability present in the aggregated data, we cannot make similar inferences. Hence, the sections below discuss the spatially-explicit patterns in NDVI for our study area and their spatial and temporal coincidence with aggregated patterns of inundation and fire for a differentially-managed watershed.
Figure 3. (a) Mean annual net primary productivity (NPP) values from 2000 to 2009 based on the C5 MOD17A3 collection (reprocessed after Zhao and Running, 2010) relative to mean annual rainfall data from the Tropical Rainfall Measuring Mission (TRMM 3B43) for 2000 to 2009 for the CRB; mean r = 0.65 and (b) Mean annual NPP and the mean growing season NDVI for 2000 to 2009; mean r = 0.76.
Land 04 00627 g003

Mean-Variance Analyses of Vegetation Productivity in CRB
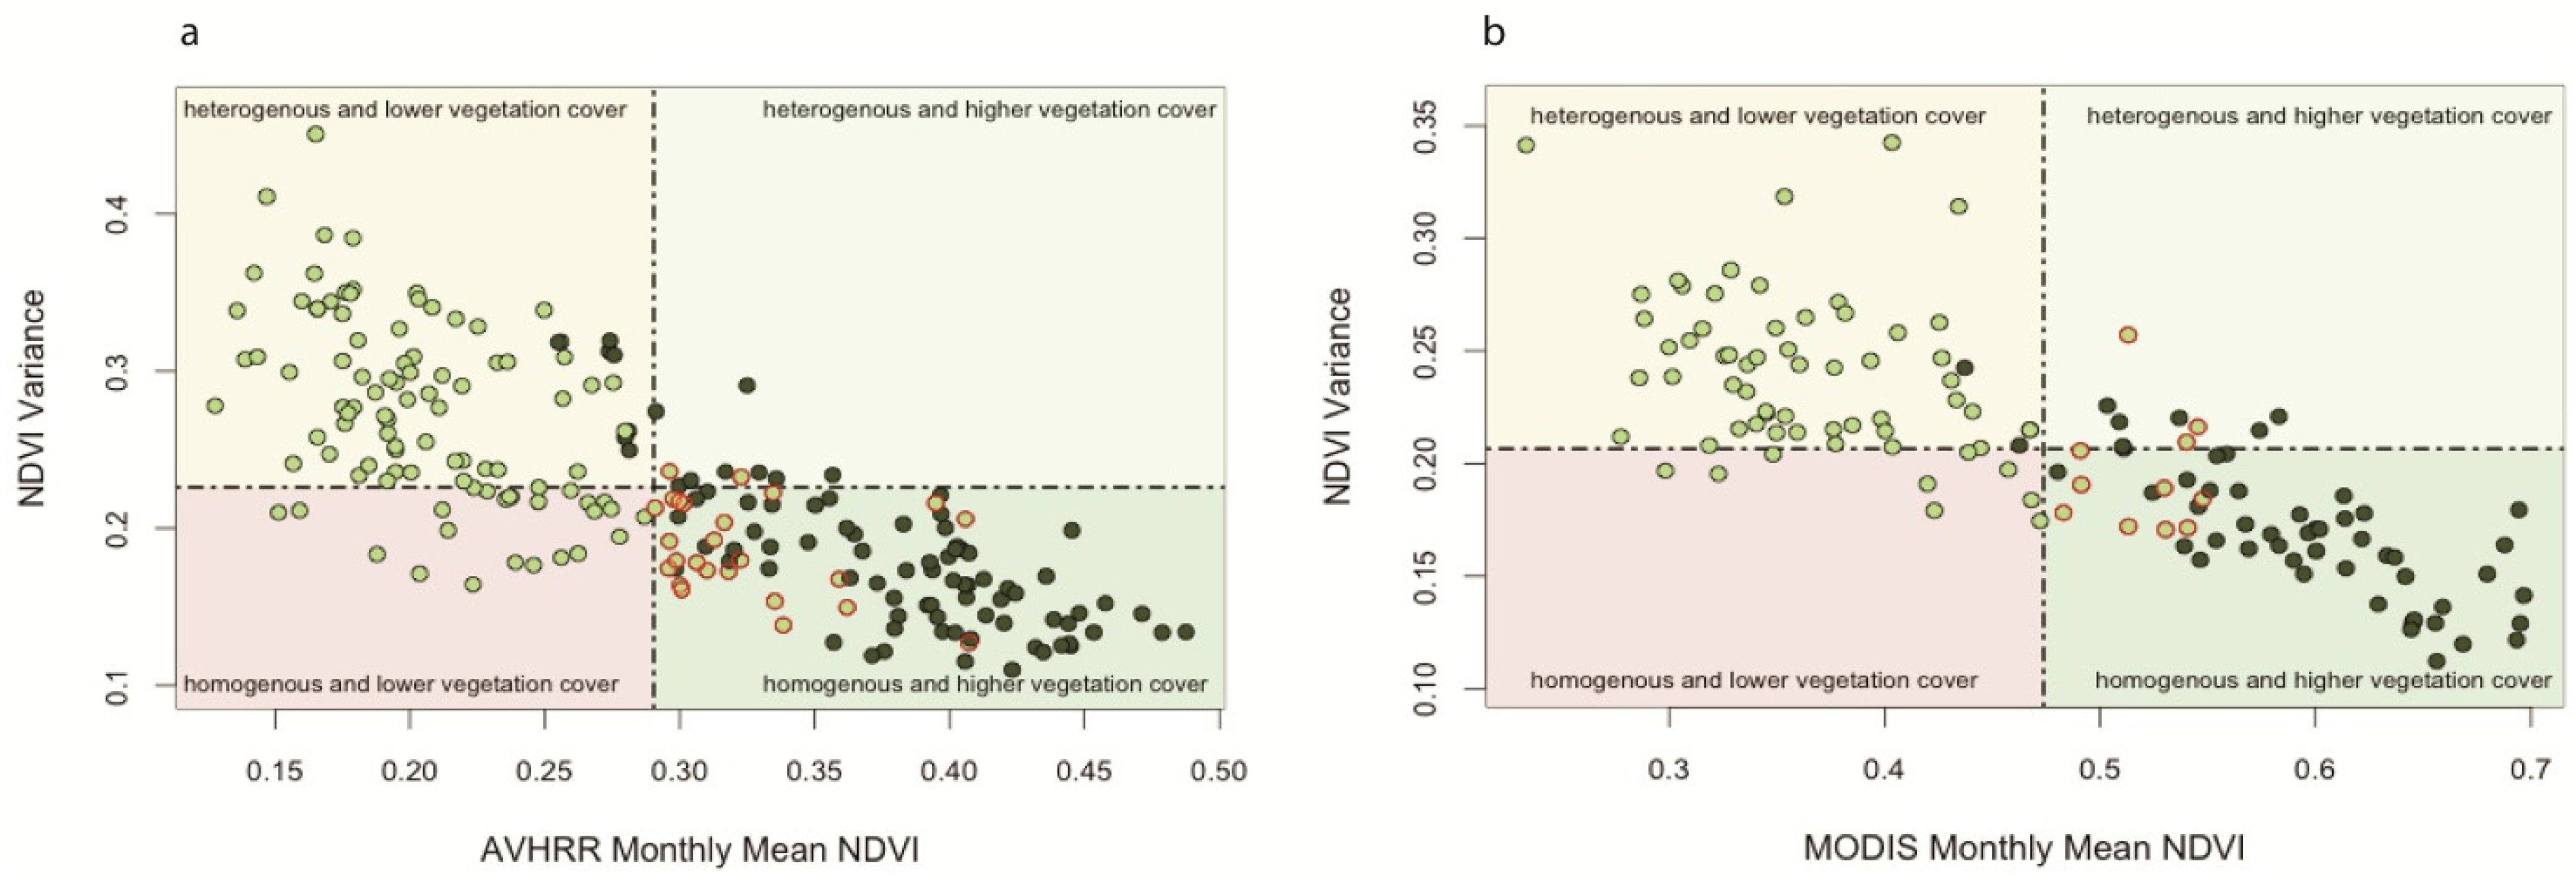
To analyze the general vegetation dynamics in CRB over a 25-year time span, as well as it related to broad climatic conditions for the region in the form on dry/wet years and warm and cold ENSO phases, we created a series of mean-variance plots: (1) ones that include all the monthly NDVI MVCs through time (1985–2010) for both datasets (Figure 4a,b); (2) plots that compare the monthly MVC NDVI for two communal areas that are managed differently in terms of fire regimes and that have different population and livestock densities (Figure 5a–d); and (3) plots that focus only on the end of the growing season April NDVI for each time period (Figure 6a,b). Each plot is divided into four quadrants/sectors based on the observed long-term mean and variance of the dataset, such as that, in theory, data points that fall in sector 1 (lower left side) encompass vegetation with a relatively low mean NDVI as well as a low variance, which may indicate homogenous and low vegetation cover that is considered the most degraded state of a landscape [35,36,37,69,70]. Sector 2 (upper left side), with a low mean and high variance (heterogeneous and low vegetation cover), suggests that a higher proportion of the landscape gravitates toward bare ground and increased susceptibility to wind and water erosion or incipient landscape degradation. Even though we do not specifically attempt to measure degradation in this paper, we define degradation as the reduction or long-term loss of natural vegetation cover in rain-fed cropland, range and woodlands resulting from both natural and anthropogenic causes [71]. Sector 3 (upper right side), characterized by a high mean and high variance of NDVI (hypothetically heterogeneous and higher vegetation cover) indicates a higher proportion of vegetation cover in the landscape but also that some portions of the landscape are susceptible to erosion, most likely as a function of local topography. Finally, data points falling into Sector 4 (lower right side), characterized by high mean and low variance, indicate the most ideal and stable vegetation conditions for these types of ecosystems at a given time, reflected by homogenous and higher vegetation cover, as shown ecologically in work by Hill and Hanan [69], Scholes and Walker [43], and Peters et al. [70].
Figure 4. (a) Mean-variance plot for monthly AVHRR MVC NDVI from September 1985 to August 2004 and (b) mean-variance plot for monthly MVC NDVI data from MODIS between 2000 and 2010. The dotted lines in both graphs indicate the long-term mean MVC NDVI value and mean variance respectively and are used to create the four vegetation dynamics sectors proposed by Washington-Allen et al. [35]. Dark green symbols indicate the main crop-growing season months (December–April), while light green symbols indicate the months that fall outside the main growing season. Symbols highlighted in red indicate months outside the main growing season with higher than expected mean NDVI.
Land 04 00627 g004
Figure 4a,b shows decreasing vegetation variance with increasing monthly MVC NDVI for both the AVHRR and MODIS time series. Overall, we observe increasing variability in NDVI in the second period of our analysis, especially during the dry season months where a larger proportion of values fall above the long-term variance of 0.2 for the time series, in line with findings by Gibbes et al. [38]. During the months that fall outside of the main growing season (May–November), the overall state of the vegetation in the basin is one of low NDVI and comparatively high variance, the majority of data values falling in the heterogeneous and low vegetation cover sectors, as would be expected (Figure 4). During the growing season, the general tendency of NDVI is to tend towards Sector 4 of more homogeneous and higher vegetation cover that characterizes more closed canopies and higher ground cover. However, when rainfall amounts are at or above the long-term average for the region (Figure 4a,b; data points highlighted in red), the months of May and June NDVI MVC values fall above the overall mean for the entire time series. This is also coincident with ENSO cold or neutral phases as indicated by Figure 2, especially prior to 2000. For both time periods, we highlight the months that fall outside the growing season as we define it, namely May and June, whereby the mean NDVI for those months is higher than the overall mean for the entire time series. This happens during years of cold or neutral ENSO phase when rainfall amounts are at or above the long-term average for the region (Figure 4a,b, data points highlighted in red), especially before 2000. After 2000, we notice a more consistent pattern of higher-than-average NDVI values for May and June irrespective of ENSO phase which is consistent with findings in the literature that show an increase in the length of the growing season, especially the beginning of the growing season, for this part of southern Africa over the last decades [60].
Figure 5. Mean-variance plots of monthly MVC NDVI data for subsets of the communal lands in Botswana and Namibia both for the 1985 to 2004 (AVHRR-based (a,b)) and the 2000 to 2010 (MODIS-based (c,d)). The dotted lines in both graphs indicate the long-term mean MVC NDVI value and mean variance respectively and are used to create the four vegetation dynamics sectors proposed by Washington-Allen et al. [35]. Dark green symbols indicate the main crop-growing season months (December–April), while light green symbols indicate the months that fall outside the main growing season.
Land 04 00627 g005
To explore these dynamics in more detail and establish whether land use management might differentially impact vegetation dynamics, Figure 5 shows the same analysis as Figure 4 but for two communal areas on either side of the Chobe River lying in differing countries, the Salambala conservancy in Namibia and CECT in Botswana (see also Figure 1). As discussed above, the two countries promote different fire management approaches and are characterized by widely differing livestock and population densities [46]. The trajectories of the mean-variance plots show similar patterns of decreasing variance with increasing monthly NDVI values as a function of growing season (Figure 5a,b) for each country. However, even though for the last 10 years of the analysis the pattern between the two countries is different, the vegetation productivity in the communal lands in both countries show an overall lower NDVI variance accompanied by an overall increasing mean in monthly MVC NDVI (Figure 5c,d).
For Botswana, during the last decade, the relationship between variance and monthly NDVI values is beginning to reverse with a tendency towards more heterogeneous vegetation cover and lower monthly MVC NDVI value and variance values during the growing season (Figure 5c,d). In the Namibian conservancies, the tendency is towards higher vegetation heterogeneity especially outside of the growing season. As the two sites are characterized by nearly identical climatic and biophysical conditions, this difference in the degree of vegetation variance heterogeneity during different seasons might be the result of differential land use management policies, specifically fire policies introduced starting in 2006 in Namibia that allow for early-dry season mosaic burns that have led to significant shifts in early dry season fire frequencies [33] and overall higher grazing pressures. Research from other semi-arid regions has shown increases in post-fire vegetation productivity and in vegetation homogeneity after fires [72]. Other work demonstrates that less burning in fire-prone systems lead to more closed canopies, thus higher vegetation productivity and cover but with increased heterogeneity [13]. Even though we do not specifically test this hypothesis, the long-term suppression of fires in Botswana and less frequent but more intense fires documented in Pricope and Binford [33] might partially account for the different trajectory of increasing vegetation productivity noted in Figure 5d. Similar trends have been observed when the temporal and spatial variability of precipitation is increasing and overall precipitation amounts are decreasing [66] or precipitation and climatic regimes are shifting or becoming more unpredictable [63,64,65].
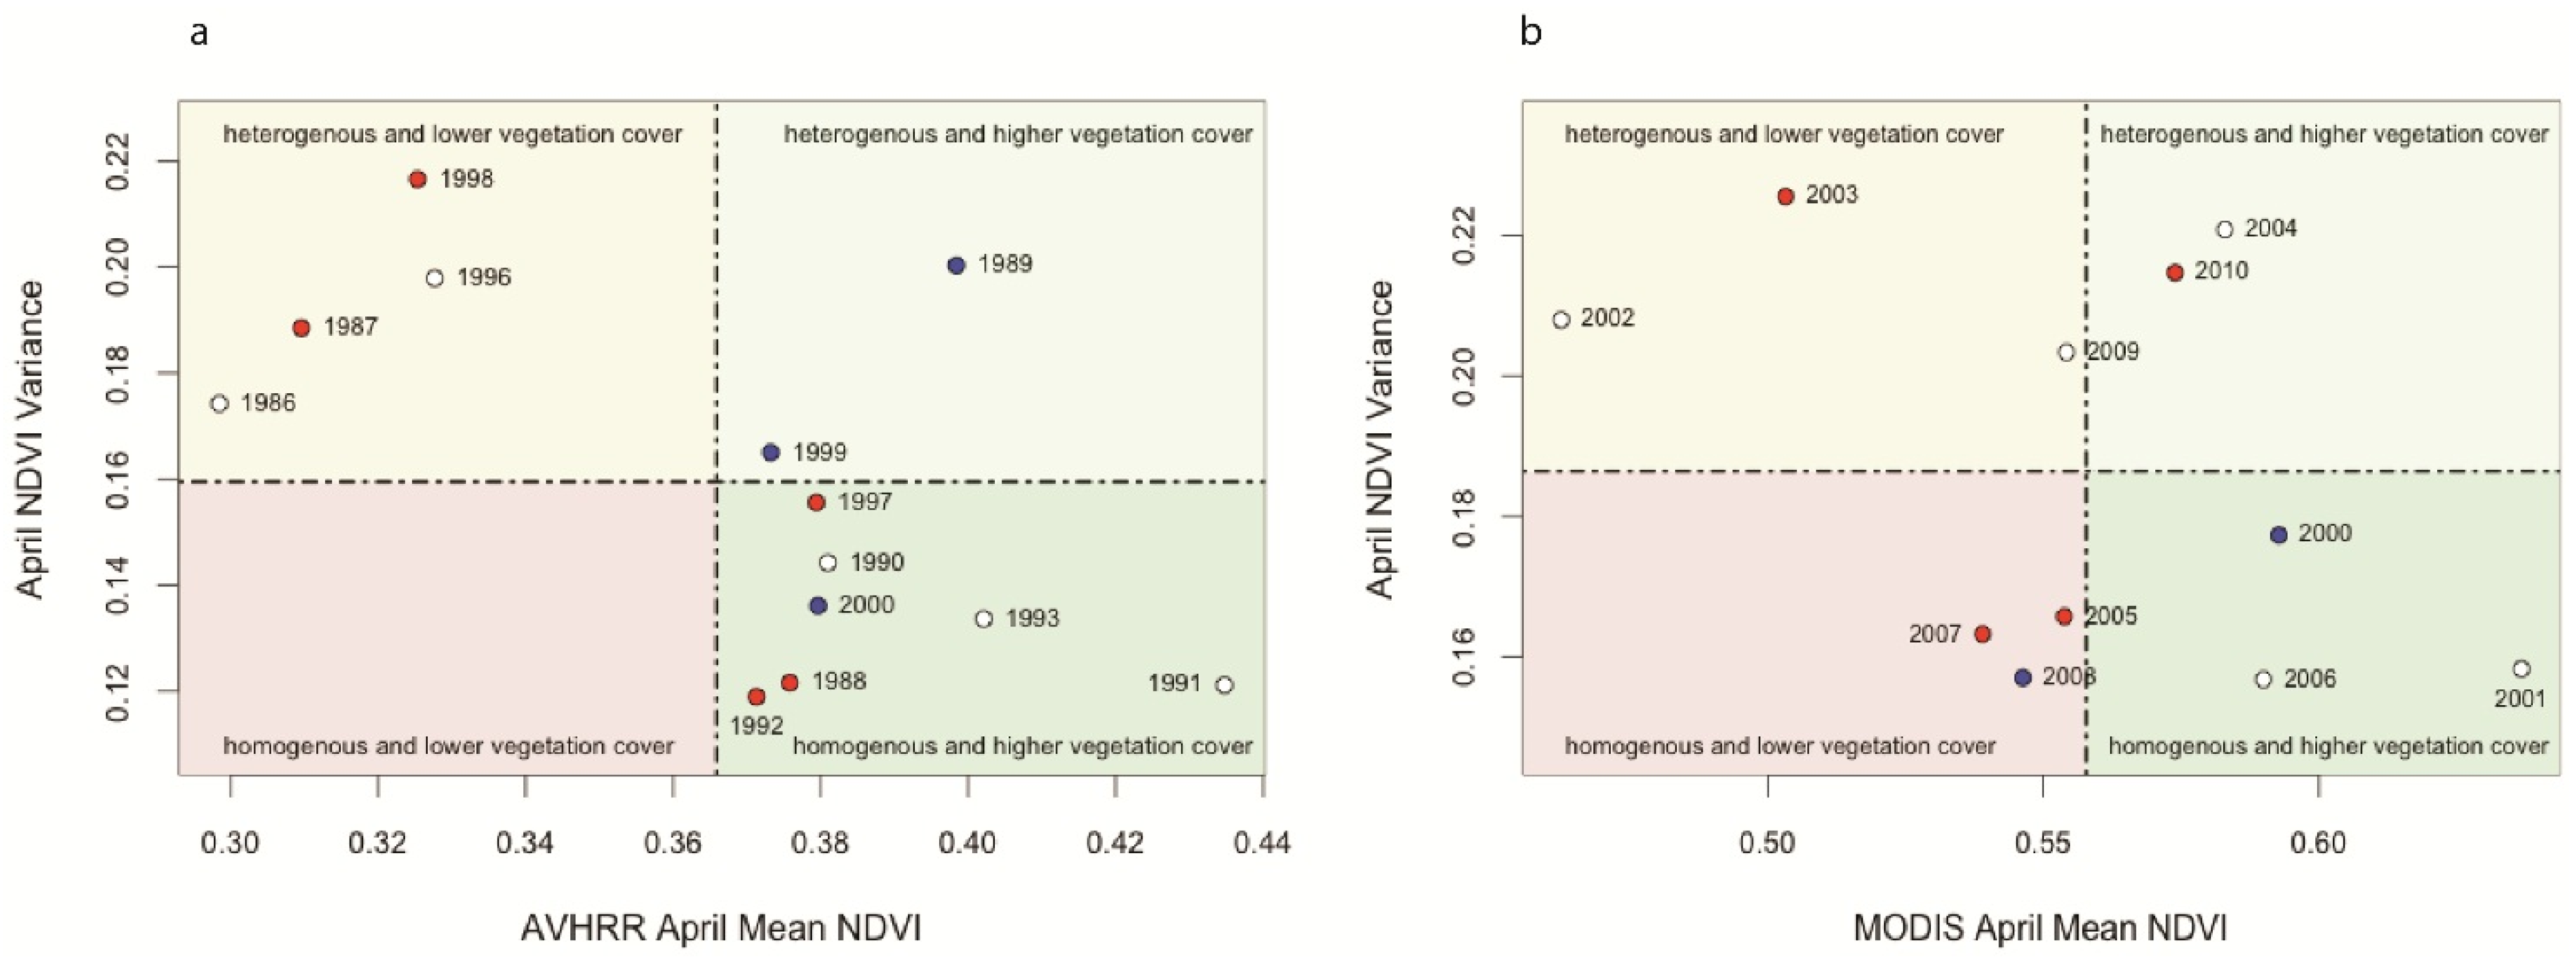
To explore the specific trajectory of NDVI across the entire time period in the four dynamic sectors of mean and variance, we plotted the location of April MVC NDVI in this multi-sectoral space from 1985 to 2010 as a function of warm, neutral, or cold ENSO phase for that particular growing season (Figure 6). April marks the end of the rainy season, and plotting April NDVI provides an indication of end of the growing season productivity leading into the dry season for this region, representing a good overall indication of forage and range conditions for livestock and wildlife [68]. Overall, compared to the 1985-2000 period when no data fell in Sector 1, generally characterized by low mean and variance NDVI and thus a possible degraded state (as shown by Cui et al. [37] and Gibbes et al. [38] to have been more characteristic of the 1980s and 1990s post-climate shift), during the second period of the analysis two of the four warm ENSO phase years fell in Sector 1; as discussed above, warm ENSO years are associated with reduced vegetation productivity [67,68] (Figure 6a,b). Contrary to our initial expectation, there is no simple pattern of association between ENSO phase (warm, cold, or neutral) and the location of end of growing season (April) NDVI in the multi-sectoral mean-variance space (Figure 6a,b). We expected that warm ENSO years, likely characterized by droughts, would skew the NDVI signal towards Sectors 1 and 2, indicative of lower vegetation cover, high heterogeneity, and potential for degradation. The fact that some warm ENSO years fall into Sectors 3 or 4 may be partially explained by the high spatial variability in the distribution of below-average rainfall during such years and the fact that, during some El Nino seasons identified and classified regionally or globally as such, the CRB is not affected by droughts [25]. In fact, recent work by FEWS Net [25] shows that between 1981 and 2013, our study region has only been impacted by below-average December-March rainfall totals three times.
Figure 6. (a) Mean-variance plot of AVHRR April MVC NDVI data from 1985 to 2000 and (b) Mean-variance plot of MODIS April MVC NDVI data from 2000 through 2010 for Chobe River Basin. Red symbols represent warm ENSO phase years, blue symbols indicate cold ENSO phase years, and white symbols—neutral ENSO phase years. The dotted lines in both graphs indicate the long-term mean MVC NDVI value and mean variance, respectively, and are used to create the four vegetation dynamics sectors proposed by Washington-Allen et al. [35].
Land 04 00627 g006
Finally, since the last part of this paper identifies spatial patterns in observed vegetation dynamics in the CRB, we were interested in the location and trajectory in the multi-sectoral mean-variance space of years post 2000. Figure 6b shows the most recent decade MODIS NDVI time-series data for April, the end of the growing season in this region. The year 2007 falls in Sector 1 of the plot which suggests vegetation homogeneity, indicated by low variance values, and low cover density. In addition to being characterized by relatively low annual rainfall (Figure 3a), 2005 and 2007 are characterized by warm ENSO conditions, following closely after three years of previous dry conditions in the region [65] which might explain the degraded landscape-level vegetation state indicated by Figure 6b. The years 2002 and 2003, identified in the literature as representative of dry growth seasons for this region [5,65], fall into Sector 2 of the mean-variance plot, which represents a less degraded state of vegetation with lots of bare ground that introduces high spatial heterogeneity. The year 2004, average in respect to rainfall amounts and falling between two warm ENSO phase years, naturally falls into Sector 3 as vegetation begins to recuperate after the droughts of 2002/03. The years 2000 and 2001 fall into Sector 4 of the mean-variance plot, which is characterized by high mean and low variance and, in theory, indicates the most ideal and stable vegetation conditions at a given time. This is logical given that the 1999/2000 growth season rainfall was the highest prior to a shift towards higher rainfall after 2008 [51].

3.2. Spatio-Temporal Analysis of Vegetation Productivity in Relation to Annual Flooding and Fire Extents in CRB from 2000 to 2010

Vegetation cover and pattern are some of the most important parameters for assessing ecosystem and landscape functioning and trajectories over time [73]. To examine the spatial configuration in g.s. NDVI, we mapped spatial patterns of standardized g.s. NDVI values for CRB for each year of the 2000–2010 decade with spatial patterns for years (2007, 2004, 2002, and 2001) (Figure 7) that are taken to be representative of each sector in the mean-variance analysis (Figure 6). Areas that display greater departures from the mean NDVI measured here spatially using the standard normal deviates, if accompanied by high vegetation variance are, in theory, areas with potentially more heterogeneous vegetation cover [36], as identified by the mean-variance plots. In general, the patterns in Figure 7 reveal higher vegetation productivity in the seasonally-inundated parts of the Mamili and Zambezi wetlands, as well as in much of the Chobe Forest Reserve and Chobe National Park in Botswana. In CECT in Botswana, as well as conservancies in Namibia (shown in the subsequent figures as all the land use units that fall outside the green boundaries of protected areas or forest reserves) in the areas adjacent to the river where most wildlife is concentrated during the dry season, significant reduction in vegetation cover and higher heterogeneity (fragmentation) are occurring, potentially due to factors explained above and further detailed below.
Figure 7. Spatial patterns of standardized g.s. NDVI values for CRB for the four years representative of each of the four mean-variance plot sectors identified in Figure 6b, as such: Sector 1: 2007, Sector 2: 2002, Sector 3: 2004, and Sector 4: 2001.
Land 04 00627 g007
Evidence from fieldwork conducted during 2007 and 2009 (May–June) along the Chobe floodplain in the park, including tree species loss and a shift in tree species composition from predominantly Acacia nigrescens to an overwhelming dominance by Croton megalobotrys, a fast-growing tree species mainly due to greatly increased elephant herbivory [74], supports the notion of severe vegetation degradation occurring in this region relative to vegetation conditions established by field surveys using the same methodology in the 1960s [50,74]. Our field surveys and training samples collected during the same field seasons also indicate consistently low vegetation productivity areas in CRB are in the communal lands of both countries and particularly the communal lands on the Namibian side of the river where population densities are high compared to other regions and cattle densities are similarly higher. The potential effects of grazing and fire suppression in these communal areas, especially in and around mobile cattle posts, are expressed in areas of either barren land or, alternatively, thick scrub (which helps explain the high vegetation heterogeneity observed in Figure 5 and the general patterns observed in Figure 7). During fieldwork, key informant interviews with locals from communities in both countries have revealed growing concerns about the disruption of agriculture by increasing elephant numbers no longer constrained to the park boundaries which leads to vegetation destruction and increased patchiness, expansion of bush encroachment due to an increased emphasis on cattle grazing and fire suppression, and drought-induced risks for subsistence agriculture.
We correlated these spatial patterns of the standardized g.s.NDVI score representative of vegetation productivity to annual flooding and fire extents for each individual year using a spatial coincidence analysis (Figure 8). Results show that areas in the eastern part of Namibia with high vegetation productivity are areas that are seasonally flooded by the Zambezi River, generally for short periods of time during the growing season while water is present in the landscape at shallow depths. High positive correlation between flooding extent and standardized g.s. NDVI is also apparent along the Chobe floodplain, while many of the areas characterized by a negative correlation are areas of lower vegetation productivity and areas that burn during any given year or during the previous fire season (as highlighted also in Table 1).
The spatial coincidence between burned area and standardized g.s. NDVI highlights large areas across the landscape with negative association, indicating the expected relationship of lower vegetation productivity in burned areas. The areas where this is most prevalent is along known road networks in Namibia where settlement and agriculture is a more dominant land use. An exception to this land use type is Mudumu National Park in Namibia, which is known to burn extensively during each year [33]. The total area of the CRB in which there is a spatial coincidence between either flooding extent and standardized g.s. NDVI or burned area and standardized g.s. NDVI ranges between 17% and 32%, depending primarily on the area flooded or burned each year (Table 1). Thus, for instance, years such as 2006–2008 when extensive burning occurred in the CRB [33] show consistently higher levels of spatial correlation between fire extent and lower than average vegetation productivity, especially when we factor in the negative effects of previous year burning (which explains the high level of below average vegetation productivity in 2009). However, the location rather than level of spatial association among vegetation productivity, flooding extent and both the previous and current year’s fire extent, are of primary interest in this analysis.
Figure 8. Spatial patterns of standardized g.s. NDVI values for CRB for four years representative of each of the four mean-variance plot sectors identified in Figure 6b and their spatial association with the flooding and fire extents for each of these years.
Land 04 00627 g008
Table 1. Results of the spatial coincidence analysis between higher and lower vegetation productivity (represented in the table as +normalized difference vegetation index ((+NDVI) and −NDVI respectively)) expressed as a standardized NDVI score and individual year flooding extent and current and previous year area burned (expressed as percent of the total area in Chobe River Basin (CRB)).
200120022003200420052006200720082009
flood (+NDVI)11.114.597.7310.650.606.199.866.855.69
flood (−NDVI)1.233.093.205.867.843.771.642.589.95
fire (−NDVI)11.267.955.379.287.4319.5616.6218.1413.32
fire (+NDVI)1.711.771.331.681.272.312.914.941.22
25.3117.3917.6227.4717.1431.8331.0332.5130.18
fire (−) prev. year20.9611.547.534.379.275.9519.0716.5817.47
fire (+) prev. year3.511.432.181.331.693.642.802.962.45
24.4712.979.715.7010.969.5921.8719.5322.92
Total49.7830.3724.3433.1728.1041.4252.9052.0450.10

3.3. Two-Date Growing Season NDVI Change Detection in Relation to Multi-Annual Flooding Extent Index (FEI) and the Multi-Annual Fire Return Interval (FRI) for CRB

Most of the change in vegetation productivity identified between 2001 and 2009 (Figure 9) occurred in the communal areas (shown as all the land use units that fall outside the green boundaries of protected areas) that are the most dynamic and subject to increasing agricultural and grazing pressures. The communal areas are characterized by overall lower vegetation productivity during individual growing seasons, based on g.s. NDVI. Overall, 6.63 percent of CRB has recorded an increase in NDVI between the two dates, with a much smaller percentage recording a net decrease (Table 2). Compared to Figure 6b, which shows 2009 to be characterized by an overall lower mean NDVI and higher CV (thus higher vegetation heterogeneity) in 2009 vs. 2001, the vegetation cover in CRB moved towards increasing spatial heterogeneity and higher NDVI, from more homogeneous conditions in 2001. This could be partially explained by increases in the area burned post-2006 and supported by research [12,72,75]. Vegetation cover as measured remotely via NDVI can be related to vegetation productivity, phytomass, and susceptibility to soil erosion but it does not provide information about changes in species composition over time. No change may occur in the NDVI response for an area, but changes in species composition within a pixel may occur and remain undetected, especially when using moderate or coarse remotely-sensed data [76]. As such, we do not attempt to explain the compositional changes in vegetation highlighted in the image differencing procedure but were interested in understanding whether the NDVI changes detected are spatially linked with multi-annual flooding and fire regimes as captured by the FEI and FRI.
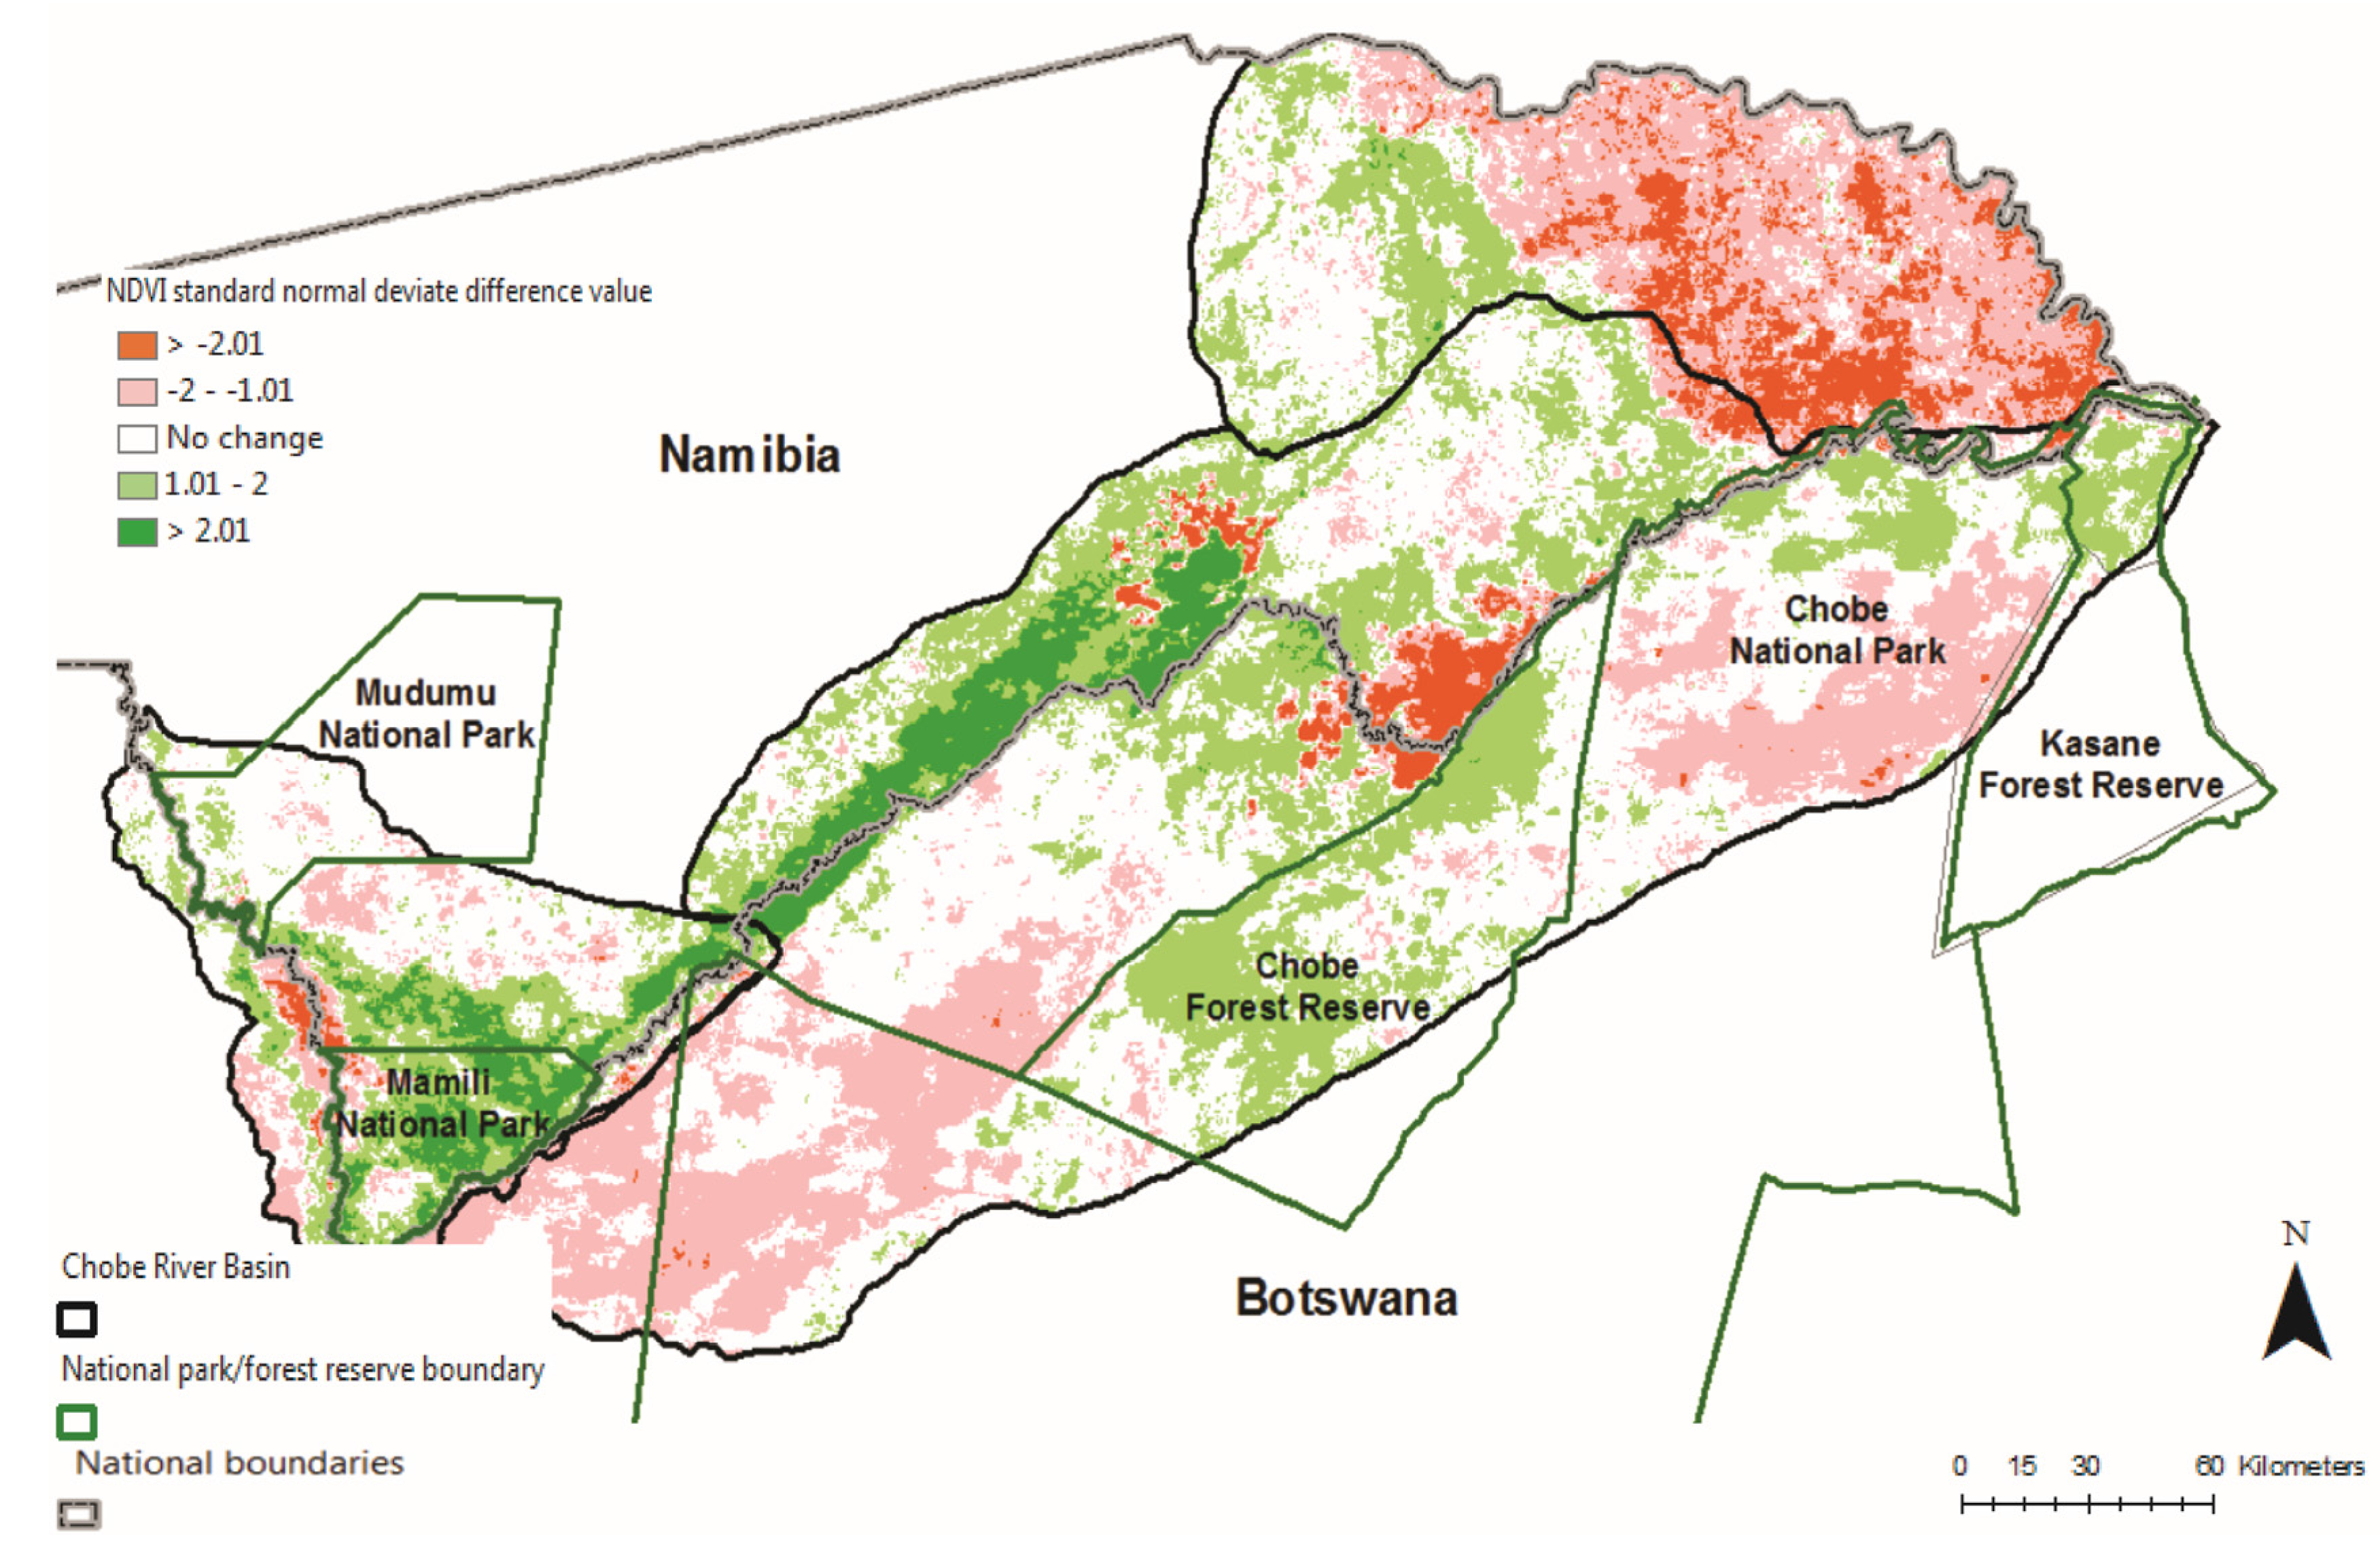
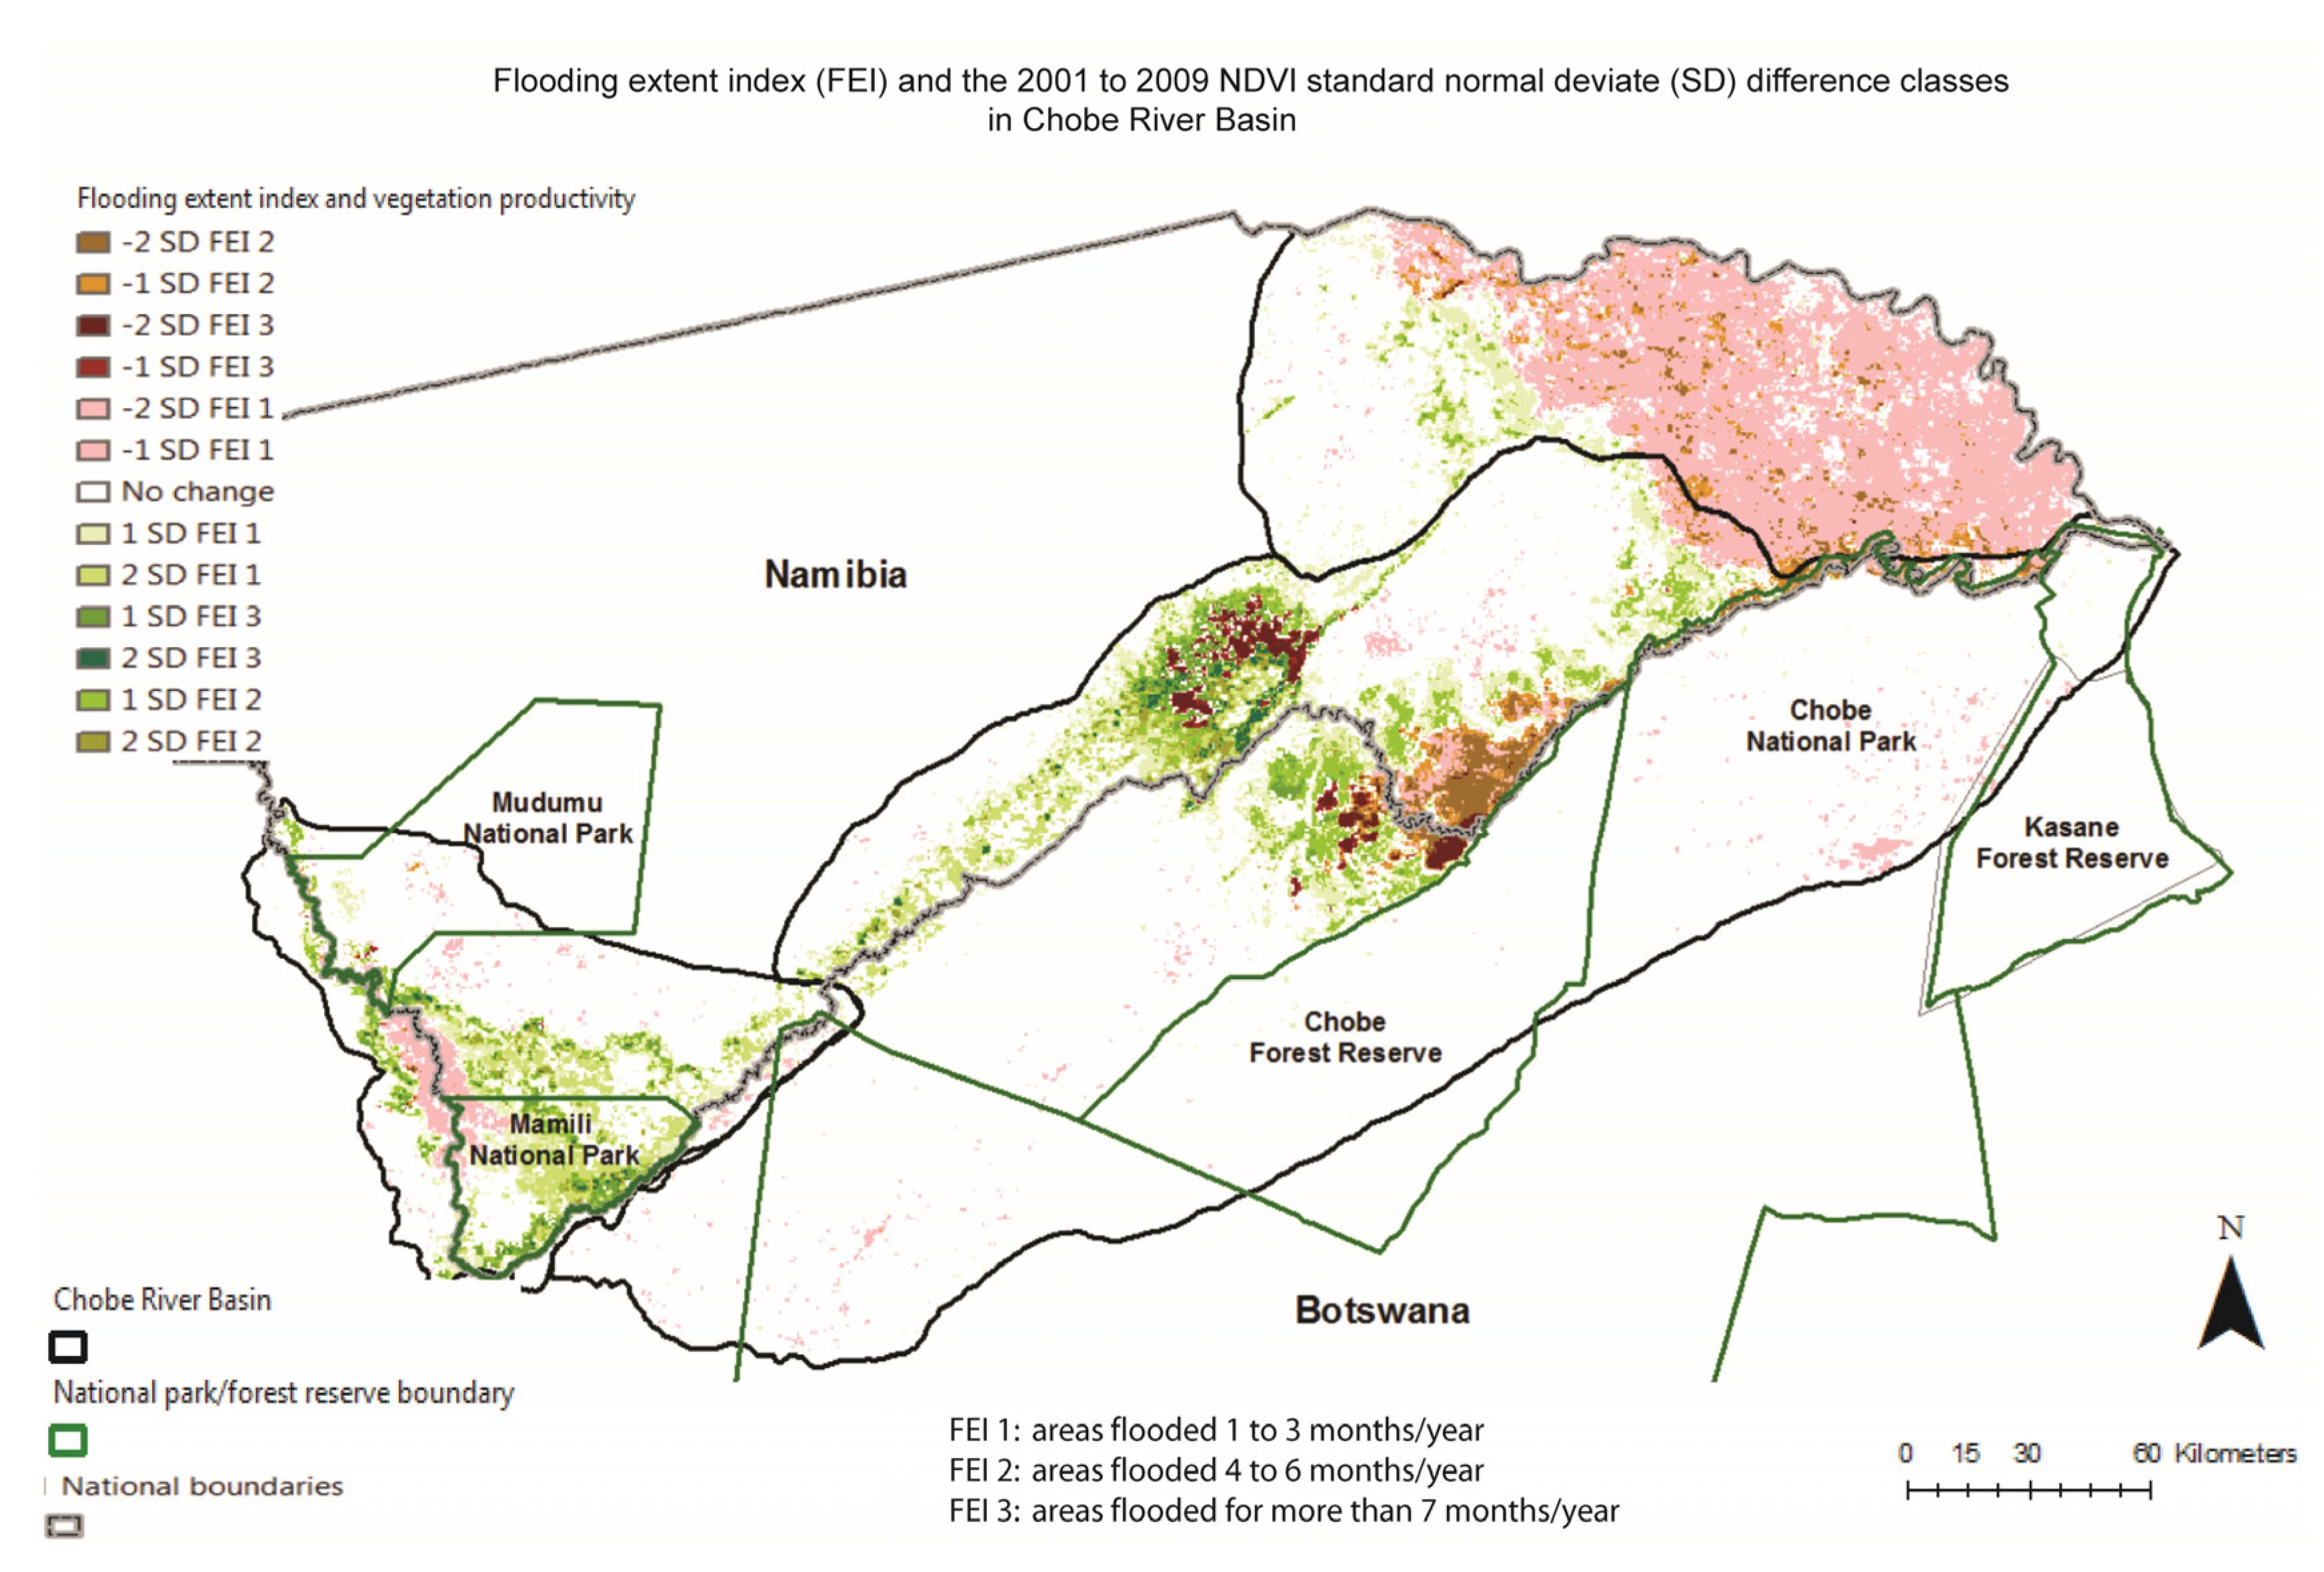
Figure 10 and Figure 11 show the spatial coincidences between the 2000 to 2009 FEI (defined as the number of months an area was under inundation per year during the 2000 to 2009 interval) and FRI (defined as the number of times an area burned during the 2000 to 2009 interval) to the standardized 2001 to 2009 g.s. NDVI image difference, respectively. Areas in green indicate increases in vegetation productivity, while areas in shades of red indicate lower vegetation productivities in 2009 as compared to 2001. Figure 10 suggests that the multi-annual FEI is related to vegetation productivity in both a positive and negative way. Areas in the eastern Zambezi Region of Namibia that are usually flooded for less than three months out of the year tend to be associated with lower vegetation productivities and these are also the areas that, later within the growing season when the flooding recedes [27] tend to burn more frequently (between one to six years out of the 10 included in the computation of the FRI) (Figure 10 and Figure 11). A longer fire return period can often be beneficial to woody recruitment and lead to increased woody plants densities, while at the same time suppressing the general height of trees [75], leading to an overall state of higher vegetation productivity and NDVI.
Table 2. Two-date standardized growing season NDVI change detection in percent of total Chobe Basin area from 2000 to 2010 based on moderate resolution imaging spectroradiometer (MODIS) growing season NDVI data (in red, statistically significant decreases; in green, statistically significant NDVI increases; statistical significance tested using the Student’s t-test at the 95% confidence level).
2000–20012001–20022002–20032003–20042004–20052005–20062006–20072007–20082008–20092009–20102001–2009
> 25% Decrease3.73 13.38 2.32 0.31 17.18 0.17 2.409.65 0.86 1.68 1.72
> 25% Increase1.730.642.5120.200.0916.432.172.203.510.636.63
Total NDVI Change > 25%5.4614.024.8320.5117.2716.604.5711.854.372.318.35
Figure 9. Two-date standardized NDVI change detection (2000 to 2009) for Chobe Basin area based on MODIS g.s. NDVI data. Areas in green indicate increases in vegetation productivity in 2009 versus 2001, while areas in shades of red indicate lower vegetation productivities in 2009 as compared to 2001.
Land 04 00627 g009
Figure 10. Spatial patterns of the coincidence between the 2001 to 2009 FEI (defined as the number of months an area was under inundation per year during the 2000 to 2009 interval) and the standardized 2001 to 2009 growing season NDVI image difference. Areas in green indicate increases in vegetation productivity in 2009 versus 2001, while areas in shades of red indicate lower vegetation productivities in 2009 as compared to 2001.
Land 04 00627 g010
The association between flooding and fire extents and higher vegetation productivities between 2001 and 2009 tends to be relatively similar for the communal areas in both Botswana and Namibia around a perennial body of water, known locally as Lake Liambezi, located within the general boundaries of Salambala Conservancy. The pattern could be related to more flooding in that region beginning with 2004 and frequent burning primarily during the years prior to 2004 when, for the first time since the 1980s, the flood waters from the Chobe and Kwando rivers joined and Lake Liambezi partially filled once more [27]. One direction of future study will examine the context of these observed changes in vegetation patterns relative to changes in hemispheric weather patterns [77]. Other factors that may account for changes in vegetation productivity can be actual alterations in land uses and agricultural management practices [78,79,80,81]. Such changes in land use are usually related to agricultural expansion and crop rotation, which may or may not coincide with the natural vegetation greening and browning stages throughout the year. Understanding the relationships between continuous vegetation indices and shifts in multi-annual flooding and fire regimes over variable time frames will require more detailed investigations and will be part of the future work based on this exploratory analysis in a transboundary savanna watershed in southern Africa.
Figure 11. Spatial patterns of the coincidence between the 2001 to 2009 FRI (defined as the number of times an area burned during the 2001 to 2009 interval) and the standardized 2001 to 2009 growing season NDVI image difference. Areas in green indicate increases in vegetation productivity, while areas in shades of red indicate lower vegetation productivities in 2009 as compared to 2001.
Land 04 00627 g011

4. Conclusions

In this paper, we investigated the general vegetation trajectory in the Chobe watershed as measured by multi-temporal NDVI analyses and explored how the spatial patterns of vegetation productivity over a twenty-five year period (1985–2010) are linked to regional inundation pulses and inter-annual fire regimes, both quantified into decadal inundation and fire return interval indices. We used NDVI, calculated from AVHRR and MODIS datasets from 1985 to 2010, specifically emphasizing the 2000 to 2010 period for which fire and inundation extent data were also available. Based on mean-variance analyses of growing season NDVI, we reconstructed the vegetation dynamics in CRB since 1985 along with the underlying climate forcing of warm and cold phase ENSO, primarily highlighting the strong correspondence between climatic conditions in this region and variations in statistical parameters that describe vegetation productivity, but we note that those conditions alone are unable to explain the full spectrum of vegetation productivity and heterogeneity nuances that exist. By couching our analyses on years of warm and cold phase ENSO [65], regional rainfall dynamics and inundation and fire patterns, we demonstrate the usefulness of mean-variance analyses in describing the overall dynamics of vegetation through time and how they can potentially inform cursory analyses of spatial patterns of vegetation productivity. In order to obtain more spatially-explicit measures of vegetation productivity shifts, we then performed a series of spatial coincidence analyses that allowed us to partially explain the role of flooding and fire in driving observed multi-date patterns and changes in vegetation productivity. We observed increased cover and heterogeneity during the growing season especially in communally-managed areas of Botswana where long-term fire suppression has been instituted, in contrast to communal areas in Namibia where heterogeneity in vegetation cover is mostly increasing primarily outside of the growing season and may correspond to mosaic early–dry season burns.
As long as population pressure in this region continues to intensify land use, anthropogenic fire ignitions are unlikely to limit fire frequencies, permitting fire frequency to respond to future climates [10]. This in turn might translate into further increases in vegetation cover and especially increases in vegetation heterogeneity that could have serious implications for vegetation structure and functionality in the future [13,72] and may pose challenges to livelihoods’ adaptation efforts in a region that is climatically variable and vulnerable. While the study design of this paper does not allow us to identify the exact causal factors for the observed multi-date changes in vegetation productivity in the CRB, examining these patterns is an important first step towards better understanding landscape-level vegetation dynamics in relation to flood, fire and underlying climate variability for semi-arid savannas.

Supplementary Files

Supplementary File 1

Acknowledgments

This work has been funded by a National Science Foundation Dissertation Improvement Grant (No. 0824720) and also through continued support from a University of Florida National Science Foundation Interdisciplinary Graduate Education and Research Traineeship (IGERT) grant (No. 0504422), called Adaptive Management: Water, Wetlands, and Watersheds directed by Mark Brown, whom we thank particularly. Pricope would like to thank her field assistant, Dorothea Simpson, as well as Alfons Mosimane and other colleagues at the University of Namibia for their continued support during fieldwork in 2009 and ever since. We would also like to thank Madeline Goodwin for her help with data pre-processing as a research assistant at Southern Oregon University.

Author Contributions

The first author, N.G. Pricope, designed the paper, conducted the analysis, field observations and data collection, and wrote the paper. A.E. Gaughan, and M. Binford provided edits, J. All assisted with field data collection and paper edits, while L. Rutina helped us obtain research permits and other ancillary data in Botswana.

Conflicts of Interest

The authors declare no conflict of interest.

References

  1. Zimmermann, N.E.; Washington-Allen, R.A.; Ramsey, R.D.; Schaepman, M.E.; Mathys, L.; Koetz, B.; Kneubuehler, M.; Edwards, T.C. Modern remote sensing for environmental monitoring of landscape states and trajectories. In A Changing World: Challenges for Landscape Research; Kienast, F., Wildi, O., Ghosh, S., Eds.; Springer: Dordrecht, The Netherlands, 2007; pp. 65–91. [Google Scholar]
  2. Scholes, R.J.; Archer, S.R. Tree-grass interactions in savanna. Annu. Rev. Ecol. Syst. 1997, 28, 517–544. [Google Scholar] [CrossRef]
  3. Sankaran, M.; Ratnam, J.; Hanan, N. Woody cover in African savannas: The role of resources, fire, and herbivory. Glob. Ecol. Biogeogr. 2008, 17, 236–245. [Google Scholar] [CrossRef]
  4. Eldridge, D.J.; Bowker, M.A.; Maestre, F.T.; Roger, E.; Reynolds, J.F.; Whitford, W.G. Impacts of shrub encroachment on ecosystem structure and functioning: Towards a global synthesis. Ecol. Lett. 2011, 14, 709–722. [Google Scholar] [CrossRef] [PubMed]
  5. Kandji, S.T.; Verchot, L.; Mackensen, J. Climate Change and Variability in Southern Africa: Impacts and Adaptation Strategies in the Agricultural Sector; United Nations Environment Program (UNEP) and the World Agroforestry Center (ICRAF): Nairobi, Kenya, 2006. [Google Scholar]
  6. Mason, S.J. El Niño, climate change, and Southern African climate. Environmetrics 2001, 12, 327–345. [Google Scholar] [CrossRef]
  7. Mosugelo, D.; Moe, S.R.; Ringrose, S.; Nelleman, C. Vegetation changes during a 36-year period in northern Chobe National Park, Botswana. Afr. J. Ecol. 2002, 40, 232–240. [Google Scholar] [CrossRef]
  8. Skarpe, C.; Aarrestad, P.A.; Andreassen, H.P.; Dhillion, S.S.; Dimakatso, T.; du Toit, J.T.; Duncan Halley, J.; Hytteborn, H.; Makhabu, S.; Mari, M.; et al. The return of the giants: Ecological effects of an increasing elephant population. Ambio 2004, 33, 276–282. [Google Scholar] [CrossRef] [PubMed]
  9. Rutina, L.P.; Moe, S.R.; Swenson, J.E. Elephant Loxodonta Africana driven woodland conversion to shrubland improves dry-season browse availability for impalas Aepyceros melampus. Wildlife Biol. 2005, 11, 207–213. [Google Scholar] [CrossRef]
  10. Hoffmann, W.A.; Schroeder, R.B.; Jackson, R.B. Positive feedbacks of fire, climate, and vegetation and the conversion of tropical savanna. Geophys. Res. Lett. 2002, 29, 2052. [Google Scholar] [CrossRef]
  11. Van Langevelde, F.; van de Vijver, C.; Kumar, L.; van de Koppel, J.; de Ridder, N.; van Andel, J.; Skidmore, A.K.; Hearne, J.; Stroosnijder, L.; Bond, W.J.; et al. Effects of fire and herbivory on the stability of savanna ecosystems. Ecology 2002, 84, 337–350. [Google Scholar] [CrossRef]
  12. Swaine, M.D.; Hawthorne, W.D.; Orgle, T.K. The effects of fire exclusion on savanna vegetation at Kpong, Ghana. Biotropica 1992, 24, 166–172. [Google Scholar] [CrossRef]
  13. Bond, W.J.; Woodward, F.I.; Midgley, G.F. The global distribution of ecosystems in a world without fire. New Phytol. 2005, 165, 525–538. [Google Scholar] [CrossRef] [PubMed]
  14. Roques, K.G.; O’Connor, T.G.; Watkinson, A.R. Dynamics of shrub encroachment in an African savanna: Relative influences of fire, herbivory, rainfall, and density dependence. J. Appl. Ecol. 2001, 38, 268–280. [Google Scholar] [CrossRef]
  15. Moleele, N.M.; Ringrose, S.; Matheson, W.; Vanderpost, C. More woody plants? The status of bush encroachment in Botswana’s grazing areas. J. Environ. Manag. 2002, 64, 3–11. [Google Scholar] [CrossRef]
  16. Fensham, R.J.; Fairfax, R.J.; Archer, S.R. Rainfall, land use and woody vegetation cover change in a semi-arid Australian savanna. J. Ecol. 2005, 93, 596–606. [Google Scholar] [CrossRef]
  17. Tews, J.; Esther, A.; Milton, S.; Jeltsch, F. Linking a population model with a ecosystem model: Assessing the impact of land use and climate change on savanna shrub cover dynamics. Ecol. Model. 2006, 195, 219–228. [Google Scholar] [CrossRef]
  18. Kutt, A.S.; Woinarski, J.C.Z. The effects of grazing and fire on vegetation and the vertebrate assemblage in a tropical savanna woodland in north-eastern Australia. J. Trop. Ecol. 2007, 23, 95–106. [Google Scholar] [CrossRef]
  19. Nellemann, C.; Moe, S.R.; Rutina, L.P. Links between terrain characteristics and forage patterns of elephants (Loxodonta Africana) in Northern Botswana. J. Trop. Ecol. 2002, 18, 835–844. [Google Scholar] [CrossRef]
  20. Rutina, L.P.; Moe, S.R. Elephant (Loxodonta africana) disturbance to riparian woodland: Effects on tree-species richness, diversity and functional redundancy. Ecosystems 2014, 17, 1384–1396. [Google Scholar] [CrossRef]
  21. Nicholson, S.E.; Davenport, M.L.; Malo, A.R. A comparison of the vegetation response to rainfall in the Sahel and East Africa, using normalized difference vegetation index from NOAA AVHRR. Clim. Chang. 1990, 17, 209–241. [Google Scholar] [CrossRef]
  22. Anyamba, A.; Eastman, J.R. Interannual variability of NDVI over Africa and its relation to El Niño/Southern Oscillation. Int. J. Remote Sens. 1996, 17, 2533–2548. [Google Scholar] [CrossRef]
  23. Barbosa, H.A.; Huete, A.R.; Baethgen, W.E. A 20-year study of NDVI variability over the Northeast Region of Brazil. J. Arid Environ. 2006, 67, 288–307. [Google Scholar] [CrossRef]
  24. Propastin, P.; Fotso, L.; Kappas, M. Assessment of vegetation vulnerability to ENSO warm events over Africa. Int. J. Appl. Earth Obs. Geoinf. 2010, 125, 583–589. [Google Scholar] [CrossRef]
  25. Famine Early Warning Systems Network (FEWS Net). Southern Africa Special Report: 2014/15 El Nino Event. Available online: http://www.fews.net/sites/default/files/documents/reports/Special%20Report_El%20Nino%20Southern%20Africa_07_2014docx_0.pdf (accessed on 15 November 15 2014).
  26. Westbrooke, M.E.; Florentine, S.K. Rainfall-driven episodic flood events: Are they a major factor in moulding New South Wales arid land vegetation patterns? Aust. Geogr. 2005, 36, 171–181. [Google Scholar] [CrossRef]
  27. Pricope, N.G. Variable-source flood pulsing in a semi-arid transboundary watershed: The Chobe River, Botswana and Namibia. Environ. Monit. Assess. 2012, 185, 1883–1906. [Google Scholar] [CrossRef] [PubMed]
  28. Westbrooke, M.E.; Florentine, S.K.; Milberg, P. Arid land vegetation dynamics after a rare flooding event: Influence of fire and grazing. J. Arid Environ. 2005, 61, 249–260. [Google Scholar] [CrossRef]
  29. Ringrose, S.; Vanderpost, C.; Matheson, W.; Wolski, P.; Huntsman-Mapila, P.; Murray-Hudson, M.; Jelemma, A. Indicators of desiccation-driven change in the distal Okavango Delta, Botswana. J. Arid Environ. 2007, 68, 88–112. [Google Scholar] [CrossRef]
  30. Tucker, C.J. Red and photographic infrared linear combinations for monitoring vegetation. Remote Sens. Environ. 1979, 8, 127–150. [Google Scholar] [CrossRef]
  31. Tucker, C.J.; Vanpraet, C.L.; Sharman, M.J.; van Ittersum, G. Satellite remote sensing of total herbaceous biomass production in the Senegalese Sahel: 1980–1984. Remote Sens. Environ. 1985, 17, 233–249. [Google Scholar] [CrossRef]
  32. Center for Ocean-Atmospheric Prediction Studies (COAPS) at Florida State University. Available online: http://coaps.fsu.edu/jma (accessed on 10 November 2014).
  33. Pricope, N.G.; Binford, M.W. A spatio-temporal analysis of fire recurrence and extent for semi-arid savanna ecosystems using moderate resolution satellite imagery. J. Environ. Manag. 2012, 100, 72–85. [Google Scholar] [CrossRef] [PubMed]
  34. Pickup, G.; Foran, B.D. The use of spectral and spatial variability to monitor cover change on inert landscapes. Remote Sens. Environ. 1987, 23, 361–363. [Google Scholar] [CrossRef]
  35. Washington-Allen, R.A.; West, N.E.; Ramsey, R.D. Remote sensing-based dynamical systems analysis of sagebrush steppe vegetation in rangelands. In Proceedings of the VIIth International Rangelands Congress, Durban, South Africa, 26 July–1 August 2003; pp. 416–418.
  36. Washington-Allen, R.A.; Ramsey, R.D.; West, N.E.; Norton, B.E. Quantification of the ecological resilience of drylands using digital remote sensing. Ecol. Soc. 2008, 13, 33. [Google Scholar]
  37. Cui, X.; Gibbes, C.; Southworth, J.; Walyen, P. Using remote sensing to quantify vegetation change and ecological resilience in a semi-arid system. Land 2013, 2, 108–130. [Google Scholar] [CrossRef]
  38. Gibbes, C.; Southworth, J.; Waylen, P.; Child, B. Climate variability as a dominant driver of post-disturbance savanna dynamics. Appl. Geogr. 2014, 53, 389–401. [Google Scholar] [CrossRef]
  39. Barnes, J.I.; MacGreggor, J.; Weaver, L.C. Economic efficiency and incentives for change within Namibia’s community wildlife use initiatives. World Dev. 2002, 30, 667–681. [Google Scholar] [CrossRef]
  40. Cumming, D.H.M. Large Scale Conservation Planning and Priorities for the Kavango-Zambezi Transfrontier Conservation Area; Conservation International: Arlington, WV, USA, 2008; p. 124. [Google Scholar]
  41. Naidoo, R.; Chase, M.; Beytell, P.; Du Preez, P.; Landen, K.; Stuart-Hill, G.; Taylor, R. A newly-discovered large mammal migration in Namibia and Botswana is the longest in Africa. Oryx 2014, 48, 1–9. [Google Scholar] [CrossRef]
  42. Omphile, U.J.; Powell, J. Large ungulate habitat preference in Chobe National Park, Botswana. J. Range Manag. 2002, 55, 341–349. [Google Scholar] [CrossRef]
  43. Scholes, R.J.; Walker, B.H. An African Savanna: Synthesis of the Nylsvley Study; Cambridge University Press: Cambridge, UK, 1993; pp. 264–267. [Google Scholar]
  44. White, F. Vegetation of Africa. A descriptive memoir to accompany the UNESCO AETFAT/UNSO vegetation map of Africa. In Natural Resources Research Report XX; U.N. Educational, Scientific and Cultural Organization: Paris, France, 1983; p. 356. [Google Scholar]
  45. Suzuki, T. Seasonal variation of the ITCZ and its characteristics over central Africa. Theor. Appl. Climatol. 2011, 103, 39–60. [Google Scholar] [CrossRef]
  46. Robinson, T.P.; Wint, G.R.W.; Conchedda, G.; van Boeckel, T.P.; Ercoli, V.; Palamara, E.; Cinardi, G.; D’Aietti, L.; Hay, S.I.; Gilbert, M. Mapping the global distribution of livestock. PLoS ONE 2014, 9, e96084. [Google Scholar] [CrossRef] [PubMed]
  47. Nicholson, S.E.; Kim, E. The relationship of the El Nino Southern Oscillation to African rainfall. Int. J. Climatol. 1997, 17, 117–135. [Google Scholar] [CrossRef]
  48. Reason, C.J.; Rouault, M. ENSO-like decadal variability and South African rainfall. Geophys. Res. Lett. 2002, 29, 4. [Google Scholar] [CrossRef]
  49. Barnes, M. Effects of large herbivores and fire on the regeneration of Acacia erioloba woodlands in Chobe National Park, Botswana. Afr. J. Ecol. 2001, 39, 340–350. [Google Scholar] [CrossRef]
  50. Child, G. An Ecological Survey of Northern Botswana; Food and Agriculture Organization: Rome, Italy, 1965. [Google Scholar]
  51. Wessels, K.J.; Prince, S.D.; Frost, P.E.; van Zyl, D. Assessing the effects of human-induced land degradation in the former homelands of northern South Africa with a 1 km AVHRR NDVI time-series. Remote Sens. Environ. 2004, 91, 47–67. [Google Scholar] [CrossRef]
  52. Qi, J.; Cabot, F.; Moran, M.S.; Dedieu, G. Biophysical parameter estimations using multidirectional spectral measurements. Remote Sens. Environ. 1995, 54, 71–83. [Google Scholar] [CrossRef]
  53. Huete, A.R.; Didan, K.; Miura, T.; Rodriguez, E.P.; Gao, X.; Ferreira, G. Overview of the radiometric and biophysical performance of the MODIS vegetation indices. Remote Sens. Environ. 2002, 83, 195–213. [Google Scholar] [CrossRef]
  54. Kummerow, C.; Simpson, J.; Thiele, O.; Barnes, W.; Chang, A.T.C.; Stocker, E.; Adler, R.F.; Hou, A.; Kakar, R.; Wentz, F.; et al. The status of the Tropical Rainfall Measuring Mission (TRMM) after two years in orbit. J. Appl. Meteorol. 2000, 39, 1965–1982. [Google Scholar] [CrossRef]
  55. Adeyewa, Z.D.; Nakamura, K. Validation of TRMM radar rainfall data over major climatic regions in Africa. J. Appl. Meteorol. 2003, 42, 331–347. [Google Scholar] [CrossRef]
  56. Goetz, S. Multisensor analysis of NDVI, surface temperature and biophysical variables at a mixed grassland site. Int. J. Remote Sens. 1997, 18, 71–94. [Google Scholar] [CrossRef]
  57. Huete, A.R.; Justice, C.; van Leeuwen, W. MODIS Vegetation Index (MOD13) Algorithm Theoretical Basis Document. Available online: http://modis.gsfc.nasa.gov/data/atbd/atbd_mod13.pdf (accessed on 10 November 2014).
  58. Zhao, M.; Running, S.W. Drought-induced reduction in global terrestrial net primary production from 2000 through 2009. Science 2010, 329, 940–943. [Google Scholar] [CrossRef] [PubMed]
  59. Giglio, L.; Descloitres, J.; Justice, C.O.; Kaufman, Y. An enhanced contextual fire detection algorithm for MODIS. Remote Sens. Environ. 2003, 87, 273–282. [Google Scholar] [CrossRef]
  60. Vrieling, A.; de Leeuw, J.; Said, M.Y. Length of growing period over Africa: Variability and trends from 30 years of NDVI time series. Remote Sens. 2013, 5, 982–1000. [Google Scholar] [CrossRef]
  61. Kogan, F.N. Global drought detection and impact assessment from space. In Drought: A Global Assessment; Wilhite, D.A., Ed.; Rutledge: London, UK, 2000; Volume 1. [Google Scholar]
  62. Weiss, E.; Marsh, S.E.; Pfirman, E.S. Application of NOAA-AVHRR NDVI time-series data to assess changes in Saudi Arabia’s rangelands. Int. J. Remote Sens. 2001, 22, 1005–1027. [Google Scholar] [CrossRef]
  63. Gaughan, A.E.; Stevens, F.R.; Gibbes, C.; Southworth, J.; Binford, M.W. Linking vegetation response to seasonal precipitation in the Okavango-Kwando-Zambezi catchment of southern Africa. Int. J. Remote Sens. 2012, 33, 6788–6804. [Google Scholar] [CrossRef]
  64. Nicholson, S.E.; Leposo, D.; Grist, J. The relationship between El Niño and drought over Botswana. J. Clim. 2001, 14, 323–335. [Google Scholar] [CrossRef]
  65. Wolter, K.; Timlin, M.S. El Niño/Southern Oscillation behaviour since 1871 as diagnosed in an extended multivariate ENSO index (MEI.ext). Int. J. Climatol. 2011, 31, 140–154. [Google Scholar] [CrossRef]
  66. Gaughan, A.E.; Waylen, P.R. Spatial and temporal precipitation variability in the Okavango-Kwando-Zambezi catchment, southern Africa. J. Arid Environ. 2011, 82, 19–30. [Google Scholar] [CrossRef]
  67. Anyamba, A.; Tucker, C.J.; Mahoney, R. From El Niño to La Niña: Vegetation response patterns over East and Southern Africa during the 1997–2000 Period. J. Clim. 2002, 15, 3096–3103. [Google Scholar] [CrossRef]
  68. Stige, LC.; Stave, J.; Chan, K.; Ciannelli, L.; Pettorelli, N.; Glantz, M.; Herren, H.; Stenseth, N.C. The effect of climate variation on agro-pastoral production in Africa. Proc. Natl. Acad. Sci. USA 2006, 103, 3049–3053. [Google Scholar] [CrossRef] [PubMed]
  69. Hill, M.J.; Hanan, N.P. Savannas: Biogeographical and ecological perspectives. In Ecosystem Function in Savannas: Measuring and Modeling at Landscape to Global Scales; CRC Press: Boca Raton, FL, USA, 2010; pp. 1–10. [Google Scholar]
  70. Peters, D.P.C.; Havstad, K.M. Nonlinear dynamics in arid and semi-arid systems: Interactions among drivers and processes across scales. J. Arid Environ. 2006, 65, 196–206. [Google Scholar] [CrossRef]
  71. United Nations Convention to Combat Desertification (UNCCD). Secretariat Policy Brief: Zero Net Land Degradation. Sustainable Development Goal for Rio+20. Available online: http://www.unccd.int/Lists/SiteDocumentLibrary/Rio+20/UNCCD_PolicyBrief_ZeroNetLandDegradation.pdf (accessed on 22 December 2014).
  72. Van Leeuwen, W.J.D.; Casady, G.M.; Neary, D.G.; Bautista, S.; Alloza, J.A.; Carmel, Y.; Wittenberg, L.; Malkinson, D.; Orr, B. Monitoring post-wildfire vegetation response with remotely sensed time-series data in Spain, USA and Israel. Int. J. Wildland Fire 2010, 19, 75–93. [Google Scholar] [CrossRef]
  73. Kefi, S.M.; Rietkerk, M.; Alados, C.; Puyeo, Y.; Papanastasis, V.; ElAich, A.; de Ruiter, P. Spatial vegetation patterns and imminent desertification in Mediterranean arid ecosystems. Nature 2007, 449, 213–218. [Google Scholar] [CrossRef] [PubMed]
  74. Wolf, A. 2009. Preliminary Assessment of the Effect of High Elephant Density on Ecosystem Components (Grass, Trees and Large Mammals) on the Chobe Riverfront in Northern Botswana. Master’s Thesis, University of Florida, Gainesville, FL, USA, 2009; p. 62. [Google Scholar]
  75. Enslin, B.; Potgier, A.; Biggs, H.; Biggs, R. Long term effects of fire frequency and season on the woody vegetation dynamics of the Sclerocarya birrea/Acacia nigrescens savanna of the Kruger National Park. Koedoe—African Protected Area Conservation and Science, North America. Volume 43. Available online: http://www.koedoe.co.za/index.php/koedoe/article/view/206/192 (accessed on 6 August 2010).
  76. Schindler, D.W. Detecting ecosystem responses to anthropogenic stress. Can. J. Fish. Aquat. Sci. 1987, 44, S6–S25. [Google Scholar] [CrossRef]
  77. Wang, Y.S. Dynamic linkage between the Sahel greening and intense Atlantic hurricanes. In Science and Technology Infusion Climate Bulletin NOAA’s Weather Service, Proceedings of the 36th NOAA Annual Climate Diagnostics and Prediction Workshop, Fort Worth, TX, USA, 3–6 October 2011.
  78. Roba, H.G.; Oba, G. Understanding the role of local management in vegetation recovery around pastoral settlements in northern Kenya. Environ. Manag. 2013, 51, 838–849. [Google Scholar] [CrossRef] [PubMed]
  79. Tsegaye, D.; Moe, S.R.; Vedeld, P.; Aynekulu, E. Land-use/cover dynamics in northern Afar rangelands, Ethiopia. Agric. Ecosyst. Environ. 2010, 139, 174–180. [Google Scholar] [CrossRef]
  80. Kidane, Y.; Stahmann, R.; Beirkunlein, C. Vegetation dynamics, and land use and land cover change in the Bale mountains of Ethiopia. Environ. Monitor. Assess. 2012, 187, 7473–7489. [Google Scholar] [CrossRef] [PubMed]
  81. Geist, H.J.; Lambin, E.F. Dynamic causal patterns of desertification. BioScience 2004, 54, 817–829. [Google Scholar] [CrossRef]