Article

Assessment of Above-Ground Biomass of Borneo Forests through a New Data-Fusion Approach Combining Two Pan-Tropical Biomass Maps

1
European Commission, Joint Research Centre, Institute for Environment and Sustainability, Via E. Fermi, 2749, I-21027 Ispra (VA), Italy
2
Graduate School of Agriculture, Kyoto University, Oiwake-cho, Kitashirakawa, Sakyo-ku, Kyoto 606-8502, Japan
3
Department of International Studies, Graduate School of Frontier Science, University of Tokyo, 5-1-5 Kashiwanoha, Kashiwa-shi, Chiba 277-8563, Japan
*
Author to whom correspondence should be addressed.
Land 2015, 4(3), 656-669; https://doi.org/10.3390/land4030656
Submission received: 17 April 2015 / Revised: 22 July 2015 / Accepted: 31 July 2015 / Published: 4 August 2015
(This article belongs to the Special Issue Carbon Emission Reductions and Removals in Tropical Forests)

Abstract

:
This study investigates how two existing pan-tropical above-ground biomass (AGB) maps (Saatchi 2011, Baccini 2012) can be combined to derive forest ecosystem specific carbon estimates. Several data-fusion models which combine these AGB maps according to their local correlations with independent datasets such as the spectral bands of SPOT VEGETATION imagery are analyzed. Indeed these spectral bands convey information about vegetation type and structure which can be related to biomass values. Our study area is the island of Borneo. The data-fusion models are evaluated against a reference AGB map available for two forest concessions in Sabah. The highest accuracy was achieved by a model which combines the AGB maps according to the mean of the local correlation coefficients calculated over different kernel sizes. Combining the resulting AGB map with a new Borneo land cover map (whose overall accuracy has been estimated at 86.5%) leads to average AGB estimates of 279.8 t/ha and 233.1 t/ha for forests and degraded forests respectively. Lowland dipterocarp and mangrove forests have the highest and lowest AGB values (305.8 t/ha and 136.5 t/ha respectively). The AGB of all natural forests amounts to 10.8 Gt mainly stemming from lowland dipterocarp (66.4%), upper dipterocarp (10.9%) and peat swamp forests (10.2%). Degraded forests account for another 2.1 Gt of AGB. One main advantage of our approach is that, once the best fitting data-fusion model is selected, no further AGB reference dataset is required for implementing the data-fusion process. Furthermore, the local harmonization of AGB datasets leads to more spatially precise maps. This approach can easily be extended to other areas in Southeast Asia which are dominated by lowland dipterocarp forest, and can be repeated when newer or more accurate AGB maps become available.

Graphical Abstract

1. Introduction

Many developing countries lack the capacities to undertake their own forest carbon monitoring. In order to participate in REDD+ (Reducing Emissions from Deforestation and forest Degradation) these countries can therefore either use default biomass values as stated in the IPCC guidelines, which are characterized by high uncertainties in combination with low transparency, or refer to other existing data sources such as local or pan-tropical above-ground biomass (AGB) maps. The most prominent pan-tropical sources are the benchmark maps of Saatchi [1] and Baccini [2] with 1 km or 500 m spatial resolution respectively.
A previous analysis of these pan-tropical maps showed different AGB patterns at local scale but also observed less pronounced differences when deriving average biomass values over larger areas [3]. An additional important result of this previous study is that no single dataset was considered more reliable than the other. Unfortunately the lack of a statistically valid sample of AGB reference values prevented a pan-tropical accuracy assessment of these maps [3].
Another earlier study combined the pan-tropical maps of Saatchi and Baccini using a basic data-fusion technique [4]. This approach allowed AGB estimates to be improved by reducing uncertainties and increased the transparency of the approach as compared to the hitherto existing Tier 1 default values of the IPCC 2006 guidelines [5]. An equal accuracy of the Saatchi and Baccini datasets was assumed at every pixel location and a pixel-based average map of both AGB datasets was produced without taking into account actual land cover changes (e.g., deforestation) which took place between the dates of the two datasets (2000/01 and 2007/08) [4].
Biomass maps which are created from different methodological approaches can be substantially different and in particular can show very distinct spatial AGB patterns [6]. Therefore, weighted fusion approaches which account for local accuracies are needed to derive AGB maps with higher overall accuracy. The number of methods which integrate different data sources in the context of REDD+ and carbon monitoring is currently limited [7] in particular for data-fusion methodologies for combining AGB maps [8]. A data-fusion method has been tested in a study area in East Africa, in which different AGB maps were combined using a weighted averaging approach [8]. Based on an AGB reference map [9] covering a subset of the study area and a stratification approach, land cover based accuracies and biases were derived, thus leading to specific fusion weights for each major land cover type.
For continental or pan-tropical analyses a large number of AGB reference datasets need to be used. However, as such datasets are derived from a variety of methodologies (e.g., use of different allometric equations; consideration of tree height and wood density), there is an issue of comparability [10,11]. Furthermore, when using AGB reference values from field plot measurements, the representativeness of such reference measurements with small sizes (e.g., sub-hectare) in relation to larger mapping units (e.g., 1 km2 pixel size of pan-tropical AGB maps) can be problematic [6].
To overcome such restrictions we decided to investigate a different weighted averaging approach: instead of using AGB reference data, we utilized local correlations with independent vegetation-related datasets. In addition, we accounted for the differences in AGB values due to land cover changes that occurred during the period covered by the two AGB maps.

2. Methodology

2.1. Study Area

Our study area is the island of Borneo (consisting of Malaysian Sarawak and Sabah, Indonesian Kalimantan and Brunei Darussalam). Borneo shows a large variety of different forest cover types which are under considerable pressure due to deforestation and forest degradation.

2.2. Identification of Land Cover Changes and Data-Fusion Processing

In a first step SPOT VEGETATION (SPOT VGT) satellite imagery is used to identify areas of land cover changes (e.g., deforestation events) which occurred during the period covered by the two AGB maps. For that purpose two cloud-free SPOT VGT composites are produced for the years 2000/01 and 2007/08 [12] to fit the dates of the Saatchi [1] and Baccini [2] AGB maps. Land cover changes are identified using the ratio of the SWIR bands at both dates with a threshold of ±2 STDVs. The SWIR band is the longest wavelength spectral band of the SPOT VGT sensor and is the best band to separate forests with different biomass as the SWIR spectral reflectance relates to canopy water content while being least influenced by atmospheric disturbances [13]. Therefore, changes in the spectral reflectance values of the SWIR band between both dates are most likely due to land cover changes (e.g., deforestation, reforestation) and any value outside the ±2 STDVs threshold is considered as land cover change. Such behavior was confirmed by empirical analysis using Google Earth Engine. These areas identified as probable land cover changes (representing 5.2% of the total area of Borneo) are excluded from further processing in order to prevent deriving AGB estimates from areas with changing land cover types. For such areas the more recent AGB map (Baccini) is used. Missing data of either of the input maps are handled similarly by using uniquely the other source map data.
In a second step a data-fusion model is developed and applied. The Baccini dataset is resampled (Nearest Neighbor) to 1 km resolution to match the spatial resolution of the other datasets and all other data are projected to the WGS84 geographic coordinate system. For areas with no pre-identified land cover change, the single spectral bands (red, NIR, SWIR) of cloud-free SPOT VGT composites are used as independent datasets and maps of correlations with the biomass values are produced using moving kernel windows of different sizes (3 × 3, 5 × 5, 7 × 7, 9 × 9, 11 × 11, 13 × 13, 15 × 15 pixels). Indeed the cloud-free SPOT VGT composites can be used to derive a land cover map similar to the GLC2000 product [14]. A number of vegetation types are characterized by unique mean AGB values [5]. Furthermore, even though direct AGB measurements are not feasible, spectral bands display some sensitivity towards vegetation structures, texture and shadows, which are partly related to AGB values [13]. Therefore, we produce maps of correlation coefficients between the spectral VGT bands and the AGB maps using moving kernel windows. Such correlation maps are used to assess the local precisions of the AGB maps and are further processed to derive the AGB maps weightings. The correlation coefficients calculated over the kernel centers for each kernel size, each SPOT VGT reference band and AGB dataset combination are used to create maps of local correlation coefficients. The resulting correlation maps are summed for Saatchi, Baccini and both maps together, and are used to derive relative proportions of correlation coefficients at pixel level. Based on these relative contributions, a weighted data-fusion composite of both input AGB maps is calculated. This is done for each kernel size (from 3 × 3 to 15 × 15 pixels) resulting in seven data-fusion maps (3 × 3_DF, 5 × 5_DF, 7 × 7_DF, 9 × 9_DF, 11 × 11_DF, 13 × 13_DF, 15 × 15_DF). These seven data-fusion maps are finally combined into two maps using the maximum (MAX_DF) and the mean (MEAN_DF) correlation coefficients for each pixel location.

2.3. Model Selection

Although a statistically valid biomass reference dataset does not exist for the whole of Borneo, we can perform a restricted accuracy assessment using an AGB local map of two adjacent forest concessions (Tangkulap and Deramakot) in Sabah [15]. This 30 m resolution Landsat-based AGB map of the year 2007 has a total size of 82,600 ha and is resampled to 1 km resolution using mean AGB values. This reference map considers only the AGB values of lowland dipterocarp forests which dominate our study area. While Deramakot has experienced “Reduced Impact Logging” (RIL) since 1995, in the Tangkulap concession logging activities stopped in 2002 after a period of “Conventional Selective Logging” (CSL). For this local AGB map the underlying AGB model showed a high correlation between estimated and true AGB values with an r2 of 0.66 [15]. For our accuracy assessment we consider only the 1 km pixels with at least half their area covered by Landsat-map pixels in order to avoid non representative values. Comparable approaches were less restrictive by using lower threshold values than 50% (Supplementary Information of [2]). The resulting 776 1-km pixels with Landsat-based AGB reference values are then compared to (i) the AGB maps of Saatchi and Baccini; (ii) the simple average composite of the Saatchi and Baccini maps and (iii) the nine data-fusion maps (3 × 3_DF, 5 × 5_DF, 7 × 7_DF, 9 × 9_DF, 11 × 11_DF, 13 × 13_DF, 15 × 15_DF, MAX_DF and MEAN_DF). The results of this regression analysis allow the data-fusion approach to be selected which best fits the Landsat-based reference ABG values.

2.4. Spatial Analysis

A land cover map of Borneo for the year 2008 is combined with the AGB MEAN data-fusion map (MEAN_DF) to derive biomass values per land cover type. For that purpose a land cover map of Borneo is produced based on a cloud-free composite of L2G daily Moderate Resolution Imaging Spectroradiometer (MODIS) surface reflectance data from the Terra and Aqua satellites. The methodology for deriving the cloud-free composite as well as the land cover classification is described in [16]. In this study the composite is derived from a larger number of images (273 MODIS reflectance single-day scenes). Furthermore, in order to improve the radiometric quality of the composite, pixels with off-nadir viewing angles > 30° are excluded. The final land cover map with 12 land cover classes is derived from an automatic classification (ISODATA) which is then visually revised (using high resolution imagery from Google Earth as reference). Finally, the land cover map is validated from a visual comparison of 600 stratified random sampling points (50 points per land cover type) selected over 77 ALOS AVNIR-2 scenes that were acquired during year 2008.
A zonal statistical analysis is done for the forests of Borneo, excluding degraded forests. Degraded forests are defined as forests with less than 40% tree crown cover and include forest mosaics and forest regrowth. Thus, non-degraded forests refer to pristine forests or forests with crown cover openings of less than 60%. We analyze separately the different forest cover types (lowland dipterocarp forest; upper dipterocarp forest; mountain forest; heath forest and forest on ultrabasic soil; peat swamp forest; freshwater swamp and riverine forest; mangrove forest) as well as degraded forests. In addition, this analysis is performed on country-level (Brunei Darussalam, Malaysia, and Indonesia). Besides calculating the mean AGB values per spatial zone, their corresponding 50% confidence intervals are also derived, which can potentially be used to apply conservative discount factors [17].

3. Results and Discussion

3.1. Comparison of Different Data-Fusion Models
In contrast to other weighted averaging approaches which require AGB reference values for a subset of the study area [8] our weighted averaging approach uses only cloud-free composites of SPOT VGT data to allow the main forest types to be differentiated, which also indirectly relate to biomass. One advantage of our approach is that it is not restricted to areas where high accuracy reference datasets are available and can therefore easily be extended to larger areas in Southeast Asia.
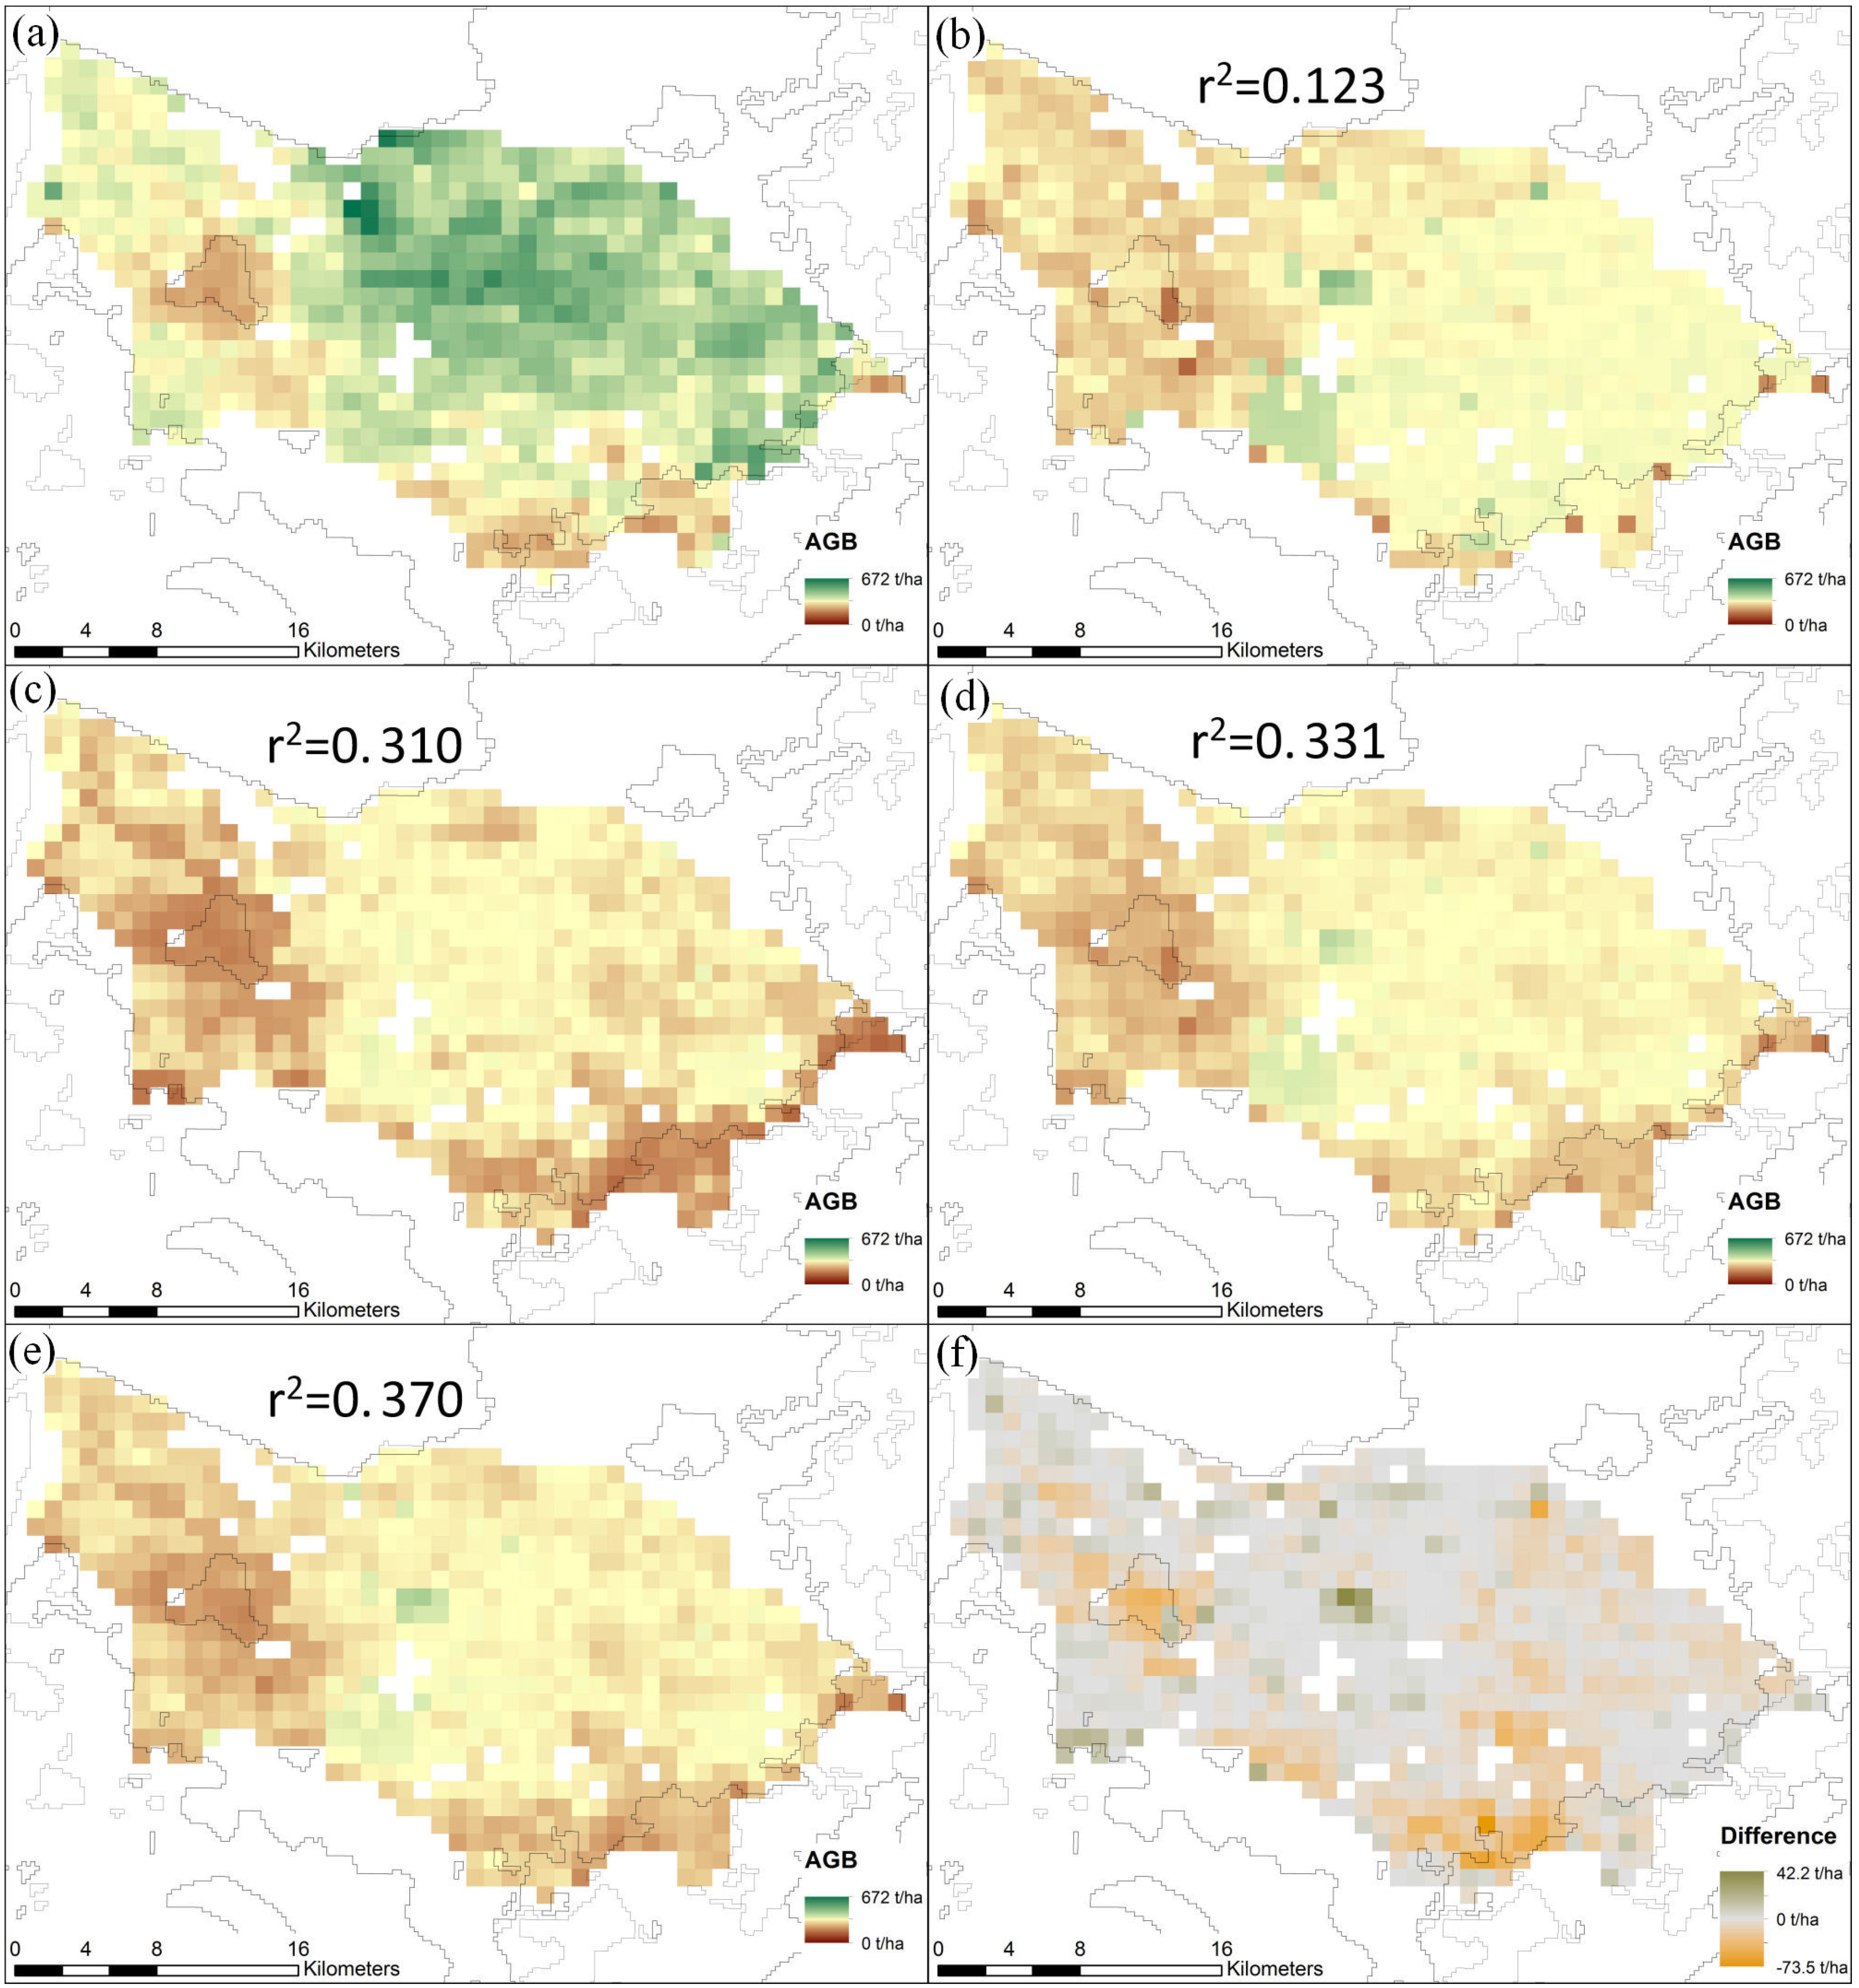
In our study we analyze a set of different data-fusion models. The best fitting model is selected from comparisons with a Landsat-based reference AGB map available over a restricted area in the North of Borneo. The correlations of the regression analyses between the Landsat and Saatchi AGB maps and between the Landsat and Baccini maps show r2 values of 0.123 and 0.310 respectively (Figure 1b,c). The correlation coefficient for the Saatchi data is low because Saatchi depicts the AGB status around the year 2000 while the Landsat reference map stems from the year 2007. Possible logging impacts in the two concessions have to be taken into account although they are considered very limited (CSL in Tangkulap until 2002 and RIL in Deramakot with lower impact on AGB). The simple AGB average approach which assumes similar accuracy of Saatchi and Baccini at every pixel location [4] results after correction for LC changes in a slightly higher r2 of 0.331 (Figure 1d)—indicating the robustness of that methodology. By applying data-fusion approaches with varying kernel sizes which weight the AGB input maps according to local correlations with a SPOT VGT reference dataset, we obtain similar or higher r2 values between 0.307 (kernel size of 3 × 3) and 0.367 (kernel size of 11 × 11). Furthermore, the combination of different kernel sizes allows the adaptation to homogeneous areas with different extent (e.g., small- or large-scale forest plantations) which might not be well detected by a single kernel size. In comparison to the MAX_DF data-fusion approach (overall r2 of 0.355) which is based on the highest local r2 value over all kernel sizes, the MEAN_DF data-fusion algorithm evenly incorporates the correlation coefficients of all kernel sizes (highest overall r2 of 0.370; Figure 1e).
Figure 1. Above-ground biomass (AGB) maps for two forest concessions in Sabah (location indicated as black rectangle in Figure 2): (a) Landsat-derived AGB map of year 2007 (resampled to 1 km resolution); (b) Saatchi map; (c) Baccini map; (d) Saatchi and Baccini mean map; (e) MEAN_DF AGB map ((d,e) are corrected for land cover changes between 2000/01 and 2007/08); (f) AGB difference between the MEAN_DF and the simple average approach with higher MEAN_DF in green and lower MEAN_DF in orange. In (b–e) correlation coefficients between (a) and the corresponding maps are shown.
Land 04 00656 g001
Figure 2. Land cover classification of the year 2008. Country borders in grey. The black rectangle indicates the subset area of the two forest concessions of Figure 1.
Land 04 00656 g002
Although 776 AGB reference pixels at 1 km2 size are used for the selection of the fusion model, these pixels only cover the lowland dipterocarp forests of two adjacent forest concessions in Sabah [15] and are thus not fully representative of all forest ecosystems of Borneo. However, due to the fact that Deramakot experienced RIL while Tangkulap had CSL and both concessions contain zones of “High Conservation Value Forest” (HCVF) without any logging activities, the Landsat-derived AGB reference pixels cover a large spectrum of AGB values (from 198.8 to 672.3 t/ha) as measured for 2007 and thus represent well the distribution of the biomass within the lowland dipterocarp forests which is the dominant forest type in Borneo [15].
Regarding the model selection we do not expect totally different outcomes if comparable AGB reference data for other forest types were available because the spectral information from VGT data conveys some information about the vegetation structure which can be partly related to AGB [13]. Furthermore weighting all correlation coefficients from the different kernel sizes (MEAN_DF) as compared to selecting only the best correlation coefficients (MAX_DF) is independent of the forest type. In case comparable AGB reference datasets would be available for other forest types a more detailed analysis would allow this assumption to be verified. However the use of direct field plot measurements might result in artifacts due to the low representativeness of small-sized field plots (usually sub-hectare size) within 1 km2 pixels.
A comparison of the average AGB results for the Tangkulap and Deramakot concessions reveals much higher average biomass values for the Landsat-derived AGB map as for all other AGB maps (393.6 t/ha for Landsat against 321.6 t/ha, 288.0 t/ha, 304.9 t/ha, and 299.6 t/ha for Saatchi, Baccini, simple average composite and MEAN_DF data-fusion approach respectively). This might be partly related to the fact that tree height is not considered in the Tangkulap and Deramakot sample plots, which can result in an overestimation of AGB by 13% on average [11]. However, even considering this potential overestimate of the reference dataset, the data-fusion maps appear to be conservative AGB estimates. This might be related to biases in the AGB input maps. Additionally, averaging AGB reference data to 100 ha size pixels leads to smoothed values (Figure 1).

3.2. Analysis of AGB Results for Borneo and Comparison with Literature Values

A comparison of the MEAN_DF AGB estimates with literature biomass values per forest cover type available for insular Southeast Asia is performed. For this purpose we use a land cover map of Borneo of the year 2008. The overall accuracy of this land cover map is 86.5% (Figure 2). As compared to the forest cover status described in [16] for the period 2002–2005, the map of the year 2008 allows a slight reduction of the annual deforestation rate to be estimated from 1.7% (2002–2005) to 1.4% (2005–2008). In total 12 land cover classes are depicted including seven forest cover types (lowland dipterocarp forest, upper dipterocarp forest, mountain forest, heath forest and forest on ultrabasic soil, peat swamp forest, freshwater swamp and riverine forest, and mangrove forest) and the class of degraded forest. Visual comparisons between the MODIS-based forest cover map and the AGB patterns of the Saatchi and Baccini maps reveal partly similar patterns even though they are derived from independent approaches (Figure 3). However these maps do not depict spatial vegetation patterns equally. While for example the Saatchi map reflects well the distribution of the upper dipterocarp and mountain forests (red circles in Figure 3b), the Baccini map shows the separation of forest to non-forest ecosystems more clearly (blue circles in Figure 3c). The MEAN_DF AGB pattern better matches most forest cover types (Figure 3a,d). Even though similar visual patterns are visible in the simple average composite, a comparison over the whole of Borneo reveals differences between the MEAN_DF data-fusion and the simple average approach of up to +140.9 t/ha or −116.3 t/ha (Figure 1f for differences within the reference area in Sabah).
The mean resulting AGB estimates over the total forest area of Borneo are 285.0 t/ha, 273.9 t/ha, 279.8 t/ha, and 279.5 t/ha for Saatchi, Baccini, the MEAN_DF and the simple average of the Saatchi and Baccini maps respectively. The AGB mean estimates for degraded forests of Borneo are 247.8 t/ha, 222.0 t/ha, 233.1 t/ha, and 234.9 t/ha for Saatchi, Baccini, the MEAN_DF data-fusion and the simple average respectively (Figure 4a). No specific AGB input map shows systematic higher or lower AGB values, but the resulting values depend on the vegetation type analyzed. The comparison of the simple average and the MEAN_DF values shows that both maps converge when analyzing large areas. However the advantage of the MEAN_DF approach is the local harmonization of the data, resulting in lower uncertainties for smaller areas (see the large differences between both approaches for mountain forests in Brunei Darussalam in Figure 4b). We also produce 50% confidence intervals of the mean AGB values to potentially allow countries to apply a Tier 1 conservative approach [4,17]. The AGB values of Figure 4a are visualized in Figure 5.
Figure 3. (a) MEAN_DF map for the whole of Borneo. The black rectangle indicates the subset area shown in detail in figure (b–d); (b) Saatchi AGB map with red circles highlighting specific patterns fitting to certain land cover types (indicated in thin black lines); (c) Baccini AGB map with blue circles highlighting other AGB patterns; (d) MEAN_DF map with a combination of patterns from (b,c).
Land 04 00656 g003
Figure 4. (a) AGB values for all Borneo forests (left), seven different forest types (middle group) and degraded forest (right); (b) AGB values for Brunei Darussalam and the Indonesian and the Malaysian parts of Borneo. Error bars indicate the 50% confidence interval (CI) at pixel level.
Land 04 00656 g004
Reporting our MEAN_DF results per country shows the highest AGB value for Brunei Darussalam forests at 292.6 t/ha, an intermediate value for the Malaysian part of Borneo at 289.0 t/ha and the lowest value for Kalimantan at 276.3 t/ha. This is not surprising, as the forests in Brunei Darussalam are considered to be more intact when compared to Malaysia or Indonesia [18].
A comparison with literature values is challenging as often a large range of AGB values is provided in the literature. The IPCC mean value for lowland forests in insular Asia at 350 t/ha (range 280–520 t/ha) is in line with AGB values between 310.6 t/ha (for year 2000) and 393.6 t/ha (for year 2007) for the two forest concessions in Sabah [15]. Our study delivers a slightly lower estimate at 305.8 t/ha for the lowland dipterocarp forest over the whole of Borneo. For tropical mountain systems the IPCC reports a wide range of biomass values from 50 to 360 t/ha. Our study provides specific estimates for upper dipterocarp forests (273.8 t/ha) and mountain forests (249.1 t/ha). Our MEAN_DF estimate for heath forests and forests on ultrabasic soils (250.9 t/ha) is slightly higher as compared to AGB values between 196 t/ha and 235 t/ha for heath forests [19]. A literature overview of AGB estimates for mangrove ecosystems reported a range of values between 93.7 t/ha and 202.4 t/ha for Indonesia and Malaysia respectively [20] which encompass our AGB MEAN_DF estimate of 136.5 t/ha. For peat swamp forests literature values cover a wide range: while [21] reports values between 252.5 t/ha and 313.9 t/ha for low and high biomass stands, reference [19] provides lower ranges between 83 t/ha and 214 t/ha or between 101 t/ha and 249 t/ha depending on the methodology. Our results for peat swamp forests are consistent with the literature with an average AGB MEAN_DF estimate of 235.1 t/ha. For riparian forests the literature reports values of 199 t/ha or 294 t/ha [19] when our results lead to a lower estimate at 170.2 t/ha which might be related to the fact that our study combines this forest type together with freshwater swamp forest.
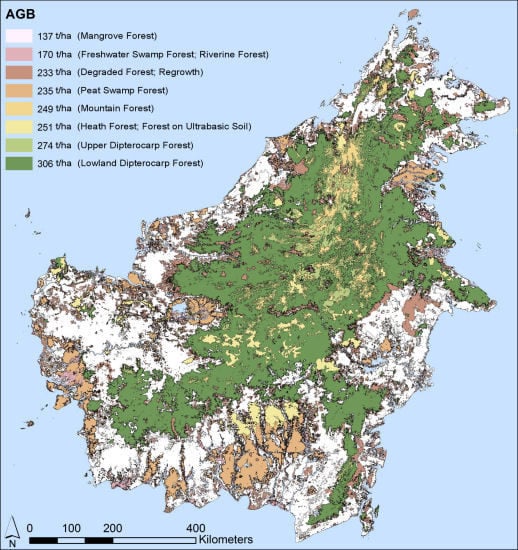
Figure 5. Map of AGB (in t/ha of dry matter) for all forest ecosystems of Borneo.
Land 04 00656 g005
According to our results the forest ecosystems of Borneo hold a total amount of 10.8 Gt AGB, of which 66.4% stem from lowland dipterocarp forests, 10.9% from upper dipterocarp forests, 10.2% from peat swamp forests, 6.4% from heath forests and forests on ultrabasic soil, 3.4% from mountain forests, 1.7% from fresh water swamp and riverine forests, and 1.2% from mangrove forests. In addition, the class of degraded forests and regrowth holds an amount of 2.1 Gt AGB.
These results depict only the AGB without considering any other carbon pools. Most prominent is the pool of below-ground biomass and—especially for the vast extent of peat lands of Southeast Asia—the on average 4.5 m thick organic peat layer, which contains enormous amounts of biomass [22].

4. Conclusions

In summary the major advantage of our data-fusion approach in comparison to other weighted averaging approaches is that it requires only a limited AGB reference dataset during model selection. Among the models tested in our study, the MEAN_DF data-fusion approach leads to more precise local biomass estimates in comparison to the simple average composite due to the local harmonization of the input AGB datasets. However, for large areas both models deliver similar mean AGB values, thus highlighting the robustness of the simple average composite to derive alternative Tier 1 default values [4]. Yet our approach does not provide quantitative information about the accuracy of the resulting data-fusion map, but allows the best fitting spatial pattern to be selected between the AGB input maps and the spectral reference VGT datasets. However, as the VGT spectral bands are considered to be indirectly related to AGB [13] a higher spatial correspondence is expected to lead to a higher accuracy of AGB values. Accuracy can only be assessed through a statistically valid sample of high quality AGB reference data over different forest ecosystems. Finally, our data-fusion approach cannot compensate site-specific variations (e.g., differences in wood density or diameter/height ratios) [23] that occur in both input maps but if more AGB maps become available in the future this should allow such effects to be mitigated. The methodology can be repeated easily when a new AGB map becomes available by either adding it to the existing ones or by replacing one of the maps, which would be considered less accurate.

Acknowledgments

We would like to thank JAXA for providing us with the necessary ALOS AVNIR-2 reference scenes as obtained under the agreement of the JAXA Research Announcement titled “The 4th Joint PI Symposium of ALOS Data Nodes for ALOS Science Program 2010 Tokyo” (JAXA-PI: JAXA-206), which allowed the validation and accuracy assessment of the Borneo land cover map.

Author Contributions

Andreas Langner developed the methodology of the data-fusion models, derived the MODIS-based land cover map of Borneo (during a research project of Kanehiro Kitayama; validated by high resolution imagery obtained under Mikiyasu Nakayama), analyzed the data and wrote the manuscript. While Dario Simonetti developed the software for the data-fusion models, Christelle Vancutsem and Jean-Francois Pekel derived the cloud-free SPOT VGT composites. Frédéric Achard and Giacomo Grassi reviewed the manuscript and gave suggestions about its conceptualization.

Conflicts of Interest

The authors declare no conflict of interest.

References

  1. Saatchi, S.S.; Harris, N.L.; Brown, S.; Lefsky, M.; Mitchard, E.T.A.; Salas, W.; Zutta, B.R.; Buermann, W.; Lewis, S.L.; Hagen, S.; et al. Benchmark map of forest carbon stocks in tropical regions across three continents. Proc. Natl. Acad. Sci. USA 2011, 108, 9899–9904. [Google Scholar] [CrossRef] [PubMed]
  2. Baccini, A.; Goetz, S.J.; Walker, W.S.; Laporte, N.T.; Sun, M.; Sulla-Menashe, D.; Hackler, J.; Beck, P.S.A.; Dubayah, R.; Friedl, M.A.; et al. Estimated carbon dioxide emissions from tropical deforestation improved by carbon-density maps. Nat. Clim. Chang. 2012, 2, 182–185. [Google Scholar] [CrossRef]
  3. Mitchard, E.T.A.; Saatchi, S.S.; Baccini, A.; Asner, G.P.; Goetz, S.J.; Harris, N.L.; Brown, S. Uncertainty in the spatial distribution of tropical forest biomass: A comparison of pantropical maps. Carbon Balance Manag. 2013, 8, 10. [Google Scholar] [CrossRef] [PubMed]
  4. Langner, A.; Achard, F.; Grassi, G. Can recent pan-tropical biomass maps be used to derive alternative Tier 1 values for reporting REDD+ activities under UNFCCC? Environ. Res. Lett. 2014, 9. [Google Scholar] [CrossRef]
  5. IPCC. 2006 IPCC Guidelines for National Greenhouse Gas Inventories, Agriculture, Forestry and Other Land Use IPCC National Greenhouse Gas Inventories Programme; Technical Support Unit Volume 4; ISBN 4-88788-032-4. Institute for Global Environmental Strategies (IGES): Hayama, Japan, 2006. [Google Scholar]
  6. Avitabile, V.; Herold, M.; Henry, M.; Schmullius, C. Mapping biomass with remote sensing: A comparison of methods for the case study of Uganda. Carbon Balance Manag. 2011, 6, 7. [Google Scholar] [CrossRef] [PubMed]
  7. De Sy, V.; Herold, M.; Achard, F.; Asner, G.P.; Held, A.; Kellndorfer, J.; Verbesselt, J. Synergies of multiple remote sensing data sources for REDD+ monitoring. Curr. Opin. Environ. Sustain. 2012, 4, 696–706. [Google Scholar] [CrossRef]
  8. Ge, Y.; Avitabile, V.; Heuvelink, G.B.M.; Wang, J.; Herold, M. Fusion of pan-tropical biomass maps using weighted averaging and regional calibration data. Int. J. Appl. Earth Obs. Geoinf. 2014, 31, 13–24. [Google Scholar] [CrossRef]
  9. Avitabile, V.; Baccini, A.; Friedl, M.A.; Schmullius, C. Capabilities and limitations of Landsat and land cover data for aboveground woody biomass estimation of Uganda. Remote Sens. Environ. 2012, 117, 366–380. [Google Scholar] [CrossRef]
  10. Chave, J.; Andalo, C.; Brown, S.; Cairns, M.A.; Chambers, J.Q.; Eamus, D.; Foelster, H.; Fromard, F.; Higuchi, N.; Kira, T.; et al. Tree allometry and improved estimation of carbon stocks and balance in tropical forests. Oecologia 2005, 145, 87–99. [Google Scholar] [CrossRef] [PubMed]
  11. Feldpausch, T.H.; Lloyd, J.; Lewis, S.L.; Brienen, R.J.W.; Gloor, M.; Monteagudo Mendoza, A.; Lopez-Gonzalez, G.; Banin, L.; Abu Salim, K.; Affum-Baffoe, K.; et al. Tree height integrated into pantropical forest biomass estimates. Biogeosciences 2012, 9, 3381–3403. [Google Scholar] [CrossRef] [Green Version]
  12. Vancutsem, C.; Pekel, J.F.; Bogaert, P.; Defourny, P. Mean Compositing, an alternative strategy for producing temporal syntheses. Concepts and performance assessment for SPOT VEGETATION time series. Int. J. Remote Sens. 2007, 28, 5123–5141. [Google Scholar] [CrossRef]
  13. Baccini, A.; Laporte, N.; Goetz, S.J.; Sun, M.; Huang, D. A first map of tropical Africa’s above-ground biomass derived from satellite imagery. Environ. Res. Lett. 2008. [Google Scholar] [CrossRef]
  14. Stibig, H.J.; Belward, A.S.; Roy, P.S.; Rosalina-Wasrin, U.; Agrawal, S.; Joshi, P.K.; Hildanus, H.; Beuchle, R.; Fritz, S.; Mubareka, S.; Giri, C. A land-cover map for South and Southeast Asia derived from SPOT VEGETATION data. J. Biogeogr. 2007, 34, 625–637. [Google Scholar] [CrossRef]
  15. Langner, A.; Samejima, H.; Ong, R.C.; Titin, J.; Kitayama, K. Integration of carbon conservation into sustainable forest management using high resolution satellite imagery: A case study in Sabah, Malaysian Borneo. Int. J. Appl. Earth Obs. Geoinf. 2012, 18, 305–312. [Google Scholar] [CrossRef]
  16. Langner, A.; Miettinen, J.; Siegert, F. Land cover change 2002–2005 in Borneo and the role of fire derived from MODIS imagery. Glob. Chang. Biol. 2007, 13, 2329–2340. [Google Scholar] [CrossRef]
  17. Grassi, G.; Monni, S.; Federici, S.; Achard, F.; Mollicone, D. Applying the conservativeness principle to REDD to deal with the uncertainties of the estimate. Environ. Res. Lett. 2008, 3, 035005. [Google Scholar] [CrossRef]
  18. Becek, K.; Odihi, J.O. Identification and assessment of factors affecting forest depletion in Brunei Darussalam. Int. Arch. Photogramm. Remote Sens. Spat. Inf. Sci. 2008, XXXVII Pt B2. [Google Scholar]
  19. Englhart, S.; Keuck, V.; Siegert, F. Aboveground biomass retrieval in tropical forests—The potential of combined X- and L-band SAR data use. Remote Sens. Environ. 2011, 115, 1260–1271. [Google Scholar] [CrossRef]
  20. Kathiresan, K.; Bingham, B.L. Biology of mangroves and mangrove ecosystems. Adv. Mar. Biol. 2001, 40, 81–251. [Google Scholar]
  21. Rieley, J.O.; Page, S.E. (Eds.) Wise Use of Tropical Peatlands: Focus of Southeast Asia; ALTERRA-Wageningen University and Research Centre and the EU INCO—Strapeat and Restorpeat Partnership: Wageningen, The Netherlands, 2005.
  22. Jaenicke, J.; Rieley, J.O.; Mott, C.; Kimman, P.; Siegert, F. Determination of the amount of carbon stored in Indonesian peatlands. Geoderma 2008, 147, 151–158. [Google Scholar] [CrossRef]
  23. Mitchard, E.T.A.; Feldpausch, T.R.; Brienen, R.J.W.; Lopez-Gonzalez, G.; Monteagudo, A.; Baker, T.R.; Lewis, S.L.; Lloyd, J.; Quesada, C.A.; Gloor, M.; et al. Markedly divergent estimates of Amazon forest carbon density from ground plots and satellites. Glob. Ecol. Biogeogr. 2014. [Google Scholar] [CrossRef]