3.1. Spatial Distribution of Flows and Infiltrations
The model output tracks the path load of a diffuse contaminant (nitrogen, by default), which reaches the stream level from the loading coefficient associated with land use. Accordingly, a sum of per-pixel values in a watershed basin gives, as output, the total amount of pollutants that flow into water streams, affecting the overall water quality. Nitrogen is assumed by the model as the nutrient due to agricultural practices which normally largely affect the water quality at the catchment level. Loading values are concentrated on class 2 (agricultural areas, see
Table A1), while retention parameters are distributed in class 3 (natural and semi-natural areas).
The more planned land use changes increase the values of filtering instead of loading and the greater their interaction among the catchment area, the more the absolute nutrient retention value decreases, as a consequence of a better land use composition in the scenario representation.
Interpretation of results comes from an analysis of the “n_export.tif” pixel distribution which represents the biophysical output of the model. The reliability of output, especially for comparative studies between alternative land uses, depends on the interaction between the input data. Even if the DEM sensitivity remains obscure most of the InVEST users, the model generates intermediate folders where each process is placed:
The model elaborates a water yield calculation based on an evapotranspiration model. This procedure allows the calculation of an intermediate per-pixel representation where the fraction of the rainfall water that is not stored in the soil and removed by evapotranspiration processes moves to another pixel;
When water is not retained by pixels, the run-off process starts to track the flow-paths that interact with DEM defining the up-flows and stream areas by gravitation. The run-off does not consider if the water routes move via the surface, subsurface, or base flows; it just interacts with the land use model and related nutrient load/retention values. The balance among the load and retention indicates where the landscape contributes to filtering and retaining the nutrients and where nutrients reach the streams.
A preliminary evaluation of the two intermediate results is to check if the runoff model generates the streams in the area where the land use is composed of water bodies. The more streams produced by the runoff model that overlap the water bodies in the land use, the more the results will be reliable in the way the nutrient is routed to the contamination points.
This basilar condition is crucial to set the command “threshold flow accumulation” which defines the number of upstream cells that must flow into a cell before it is considered part of a stream. Indeed, if the model is used at the local scale (1:5,000/1:10,000), then the command has to be set with values ranging from 50 to 200, otherwise it will be sufficient to use values ranging from 500 to 1000 and the correspondence between streams and the water bodies of the large-scale land-use dataset will be achieved.
As explained, DEM is essential to route the flows of nutrients. Its reliability depends on (i) the geometrical definition; and (ii) the continuity and the distribution of the values (holes or gaps to fill in the DEM are frequent).
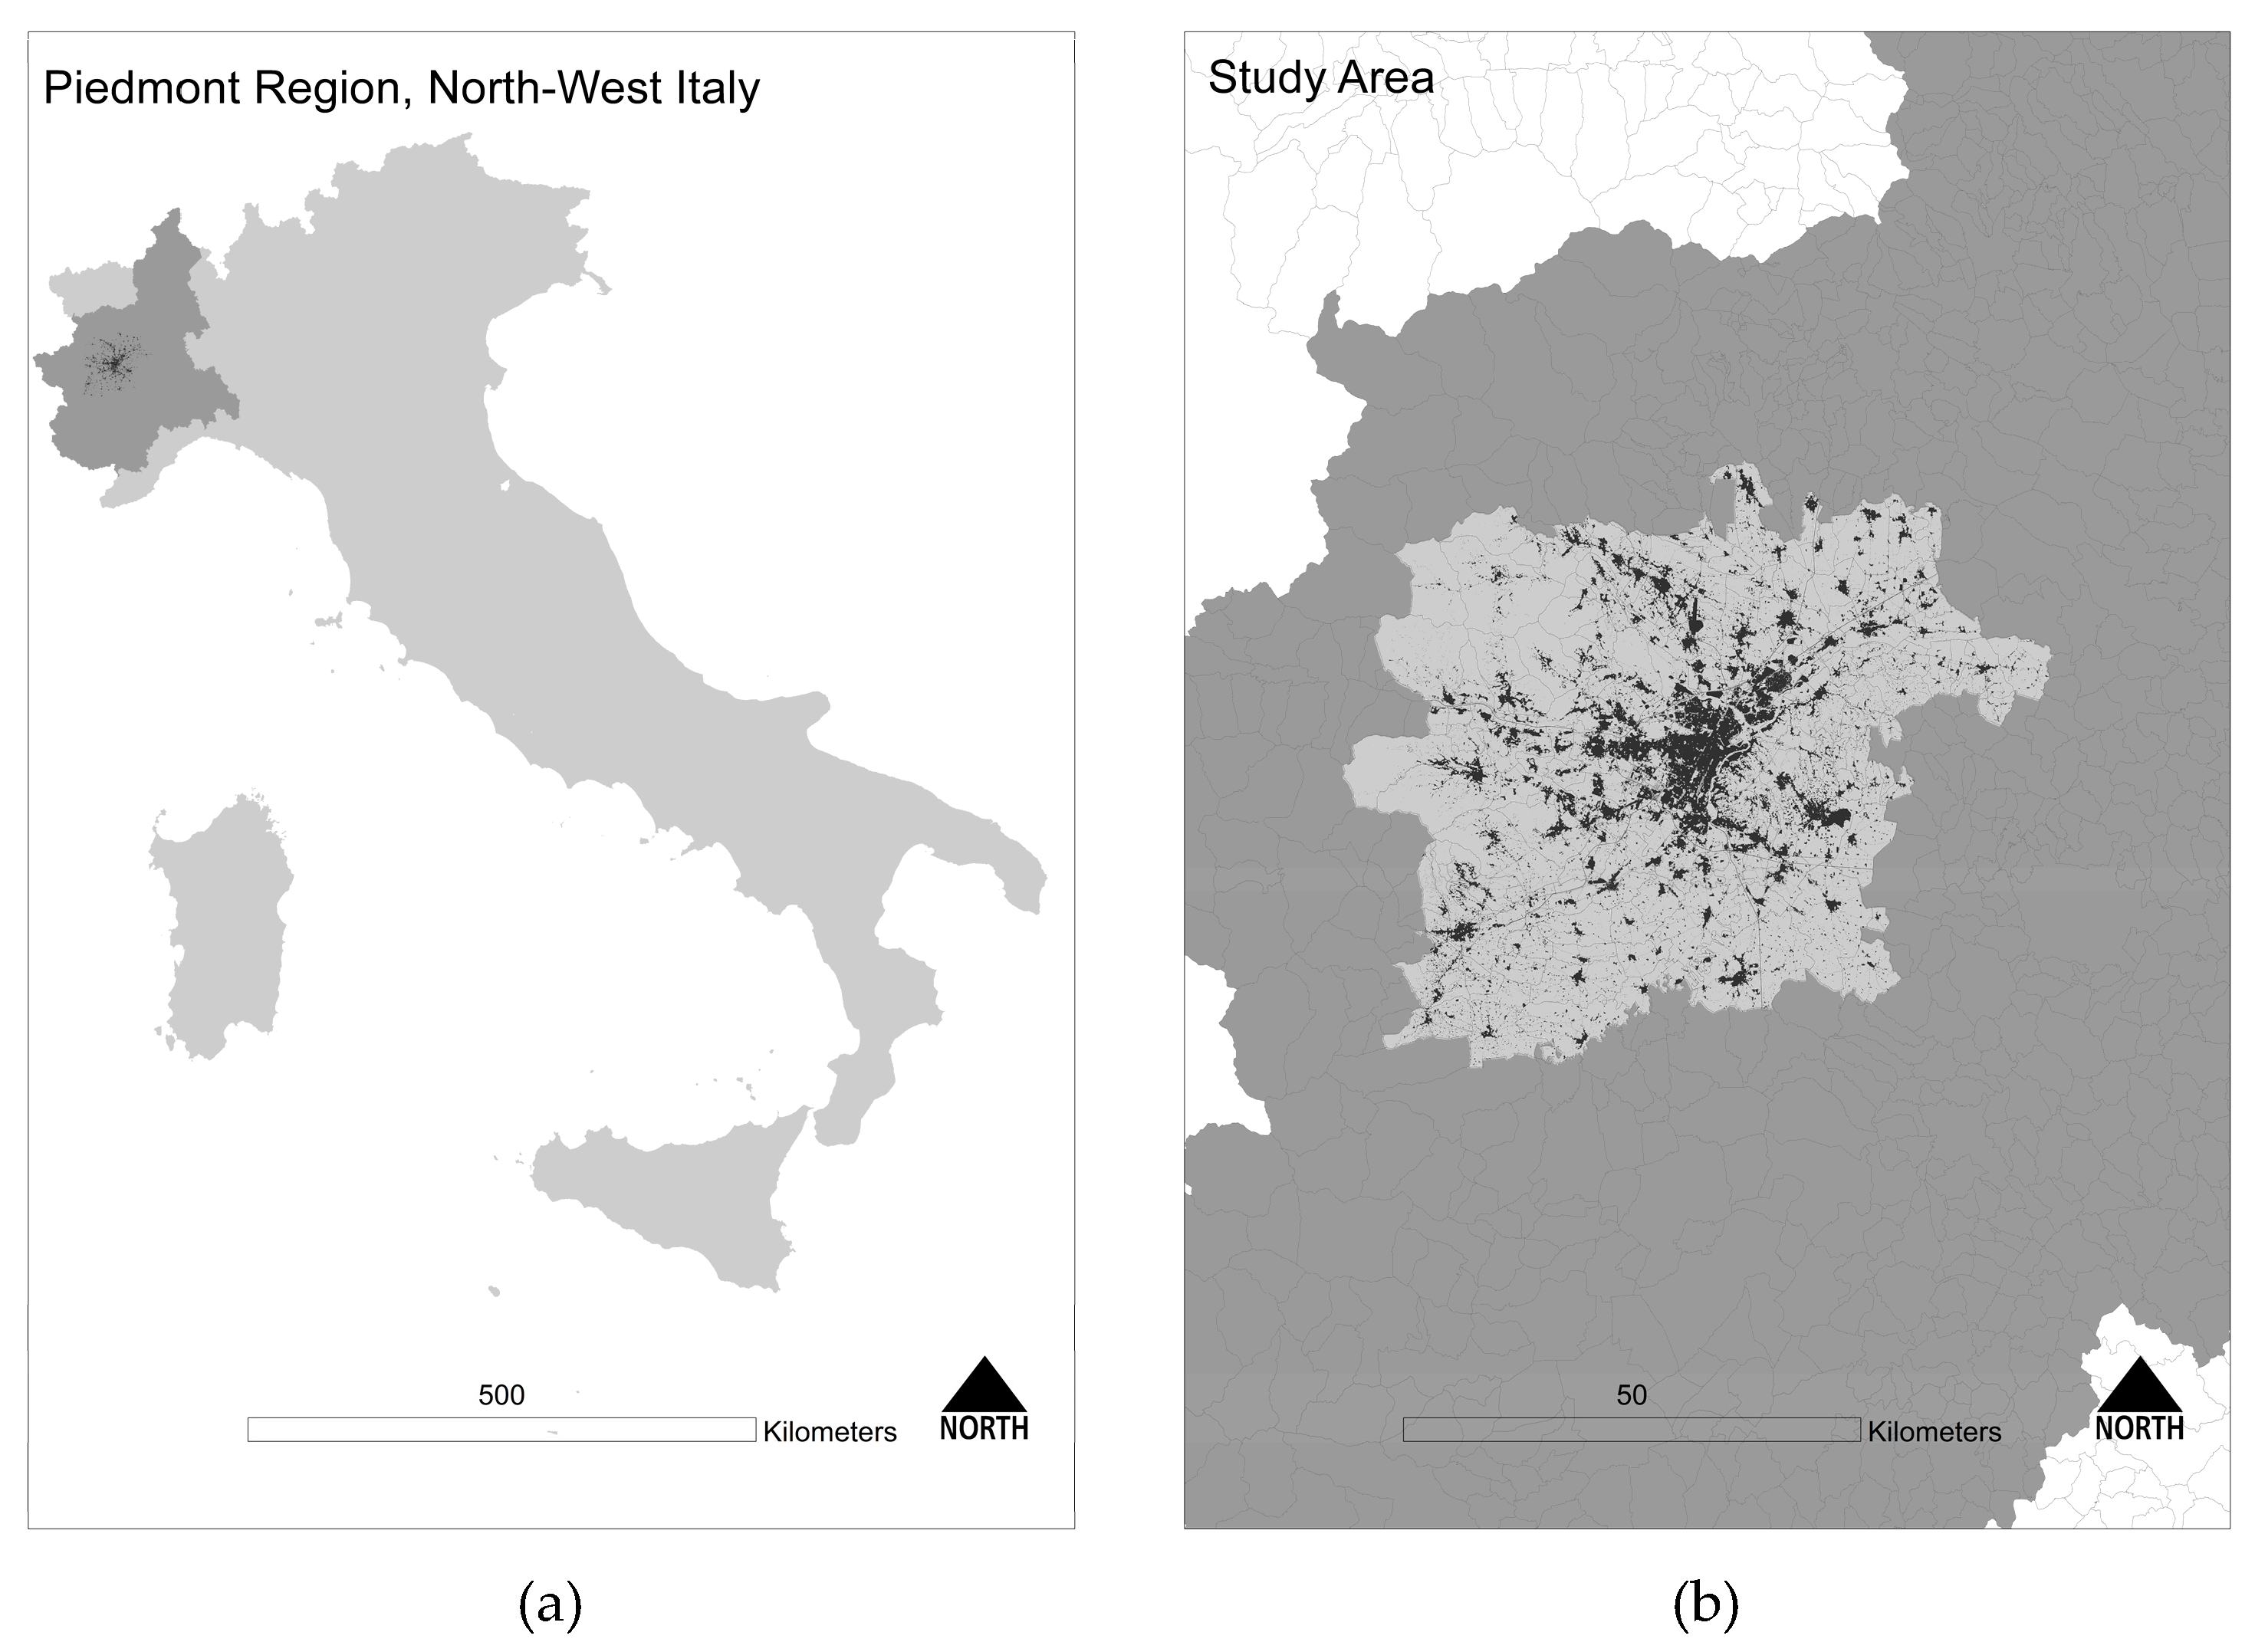
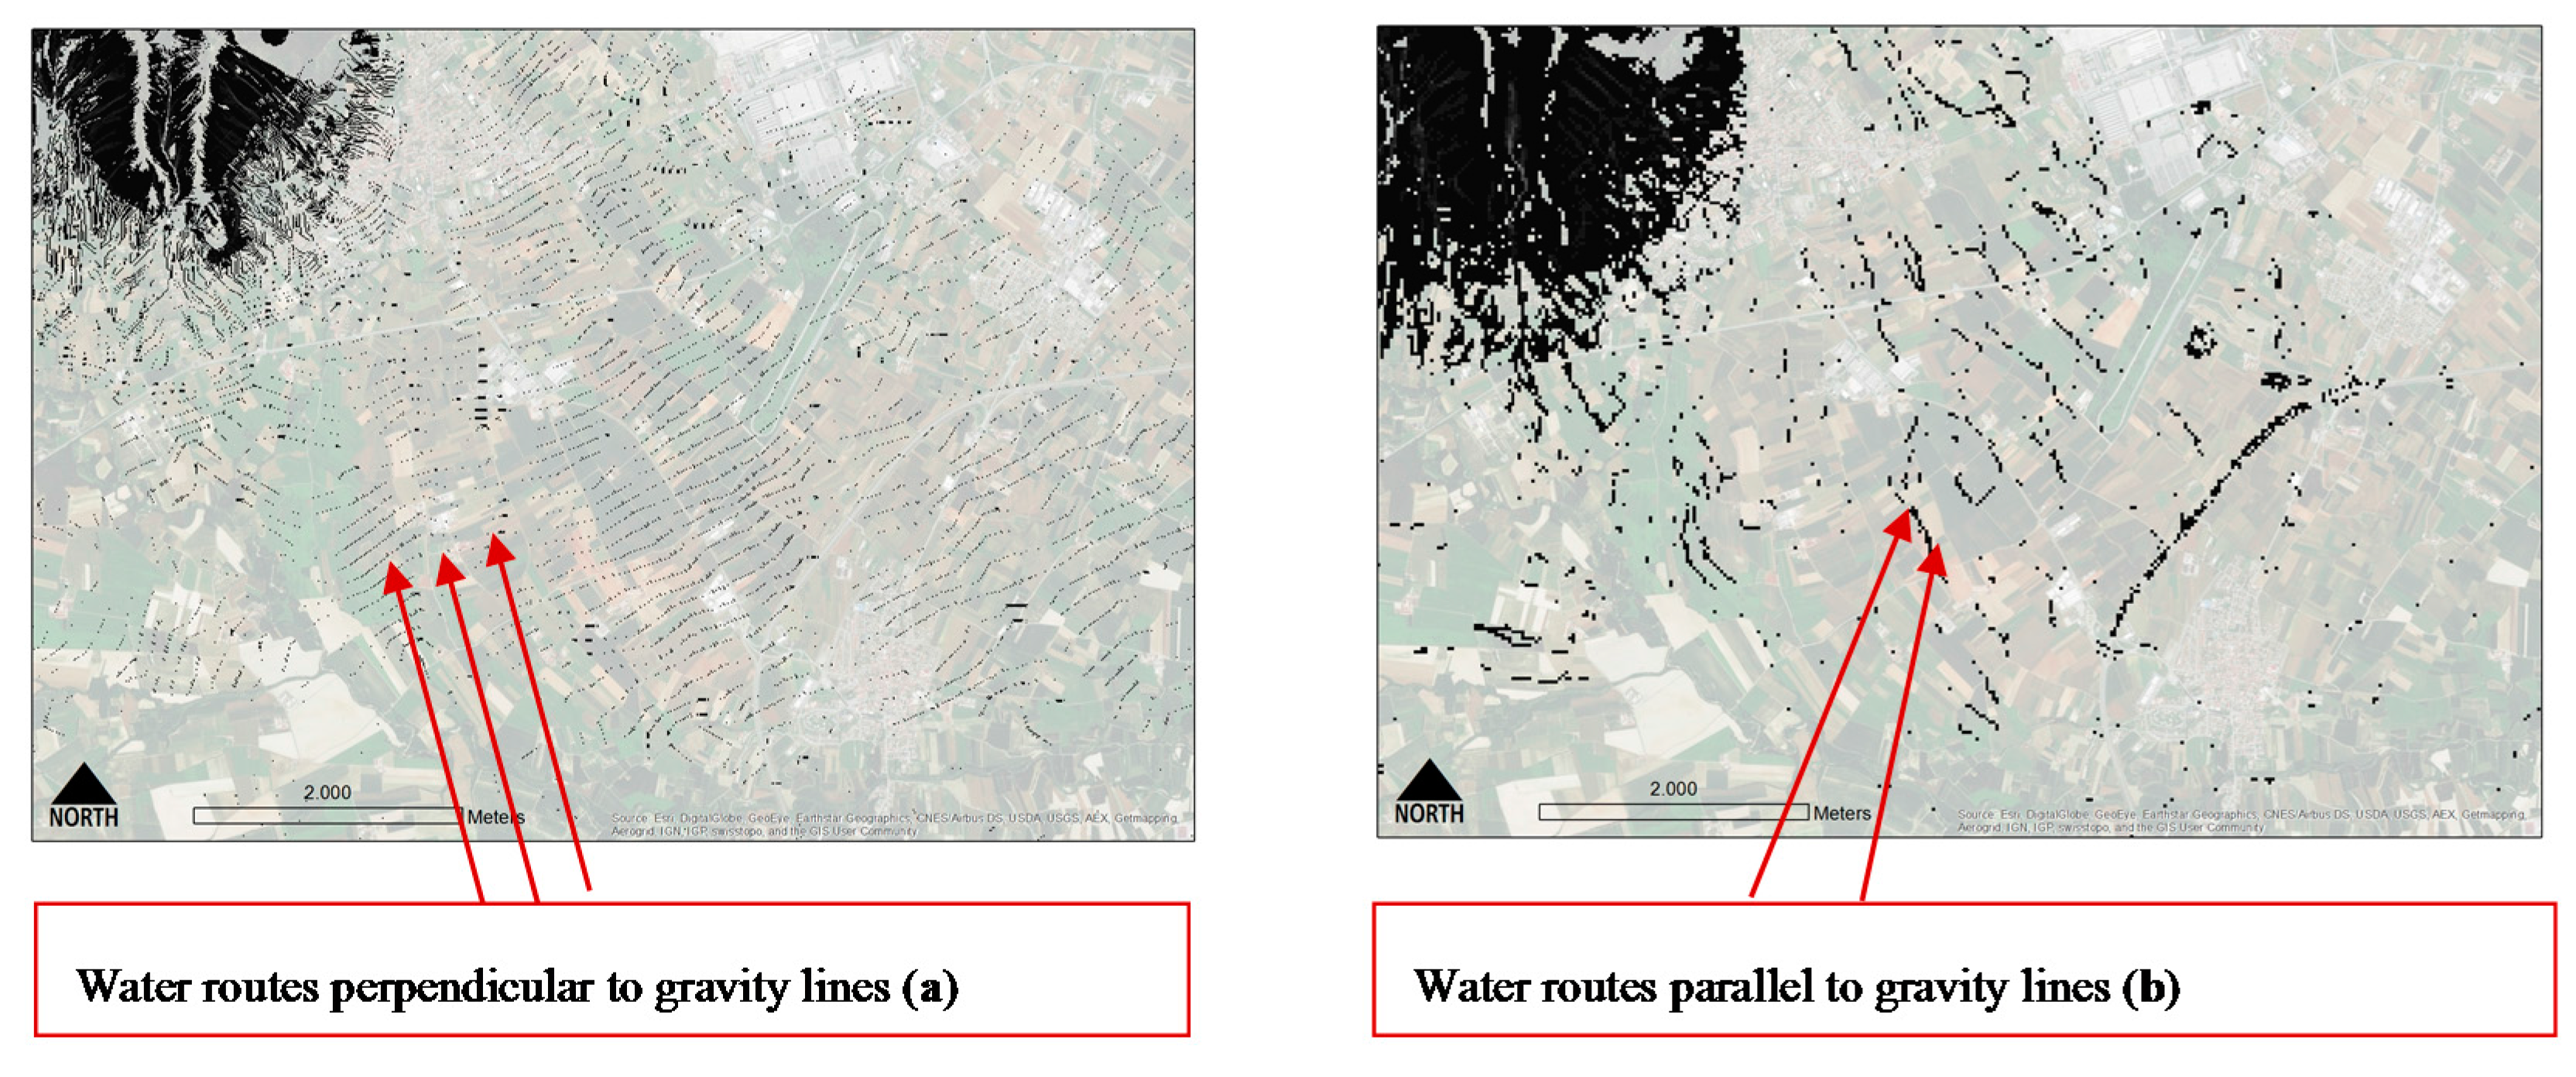
In the case study, a preliminary observation of the intermediate runoff model has been done using a grid DEM of a 10 m cell (scale of representation, 1:10,000, year 2005) covering the entire territory of the catchment area. It was expected that the flows of water routes down the slopes follow trajectories parallel to gravitational lines, while the model routed the flows with some perpendicular trajectories. Therefore, it has been decided to change the original DEM with an upgraded version which uses a different digital source and presents a denser pixel distribution (which was fundamental to mesh the values among the hill slopes). The geometrical precision of the LULC map was not considered because (i) it did not interact with intermediate phase 1; and (ii) it was precise enough (scale of representation, 1:10,000, year 2010) for the analysis.
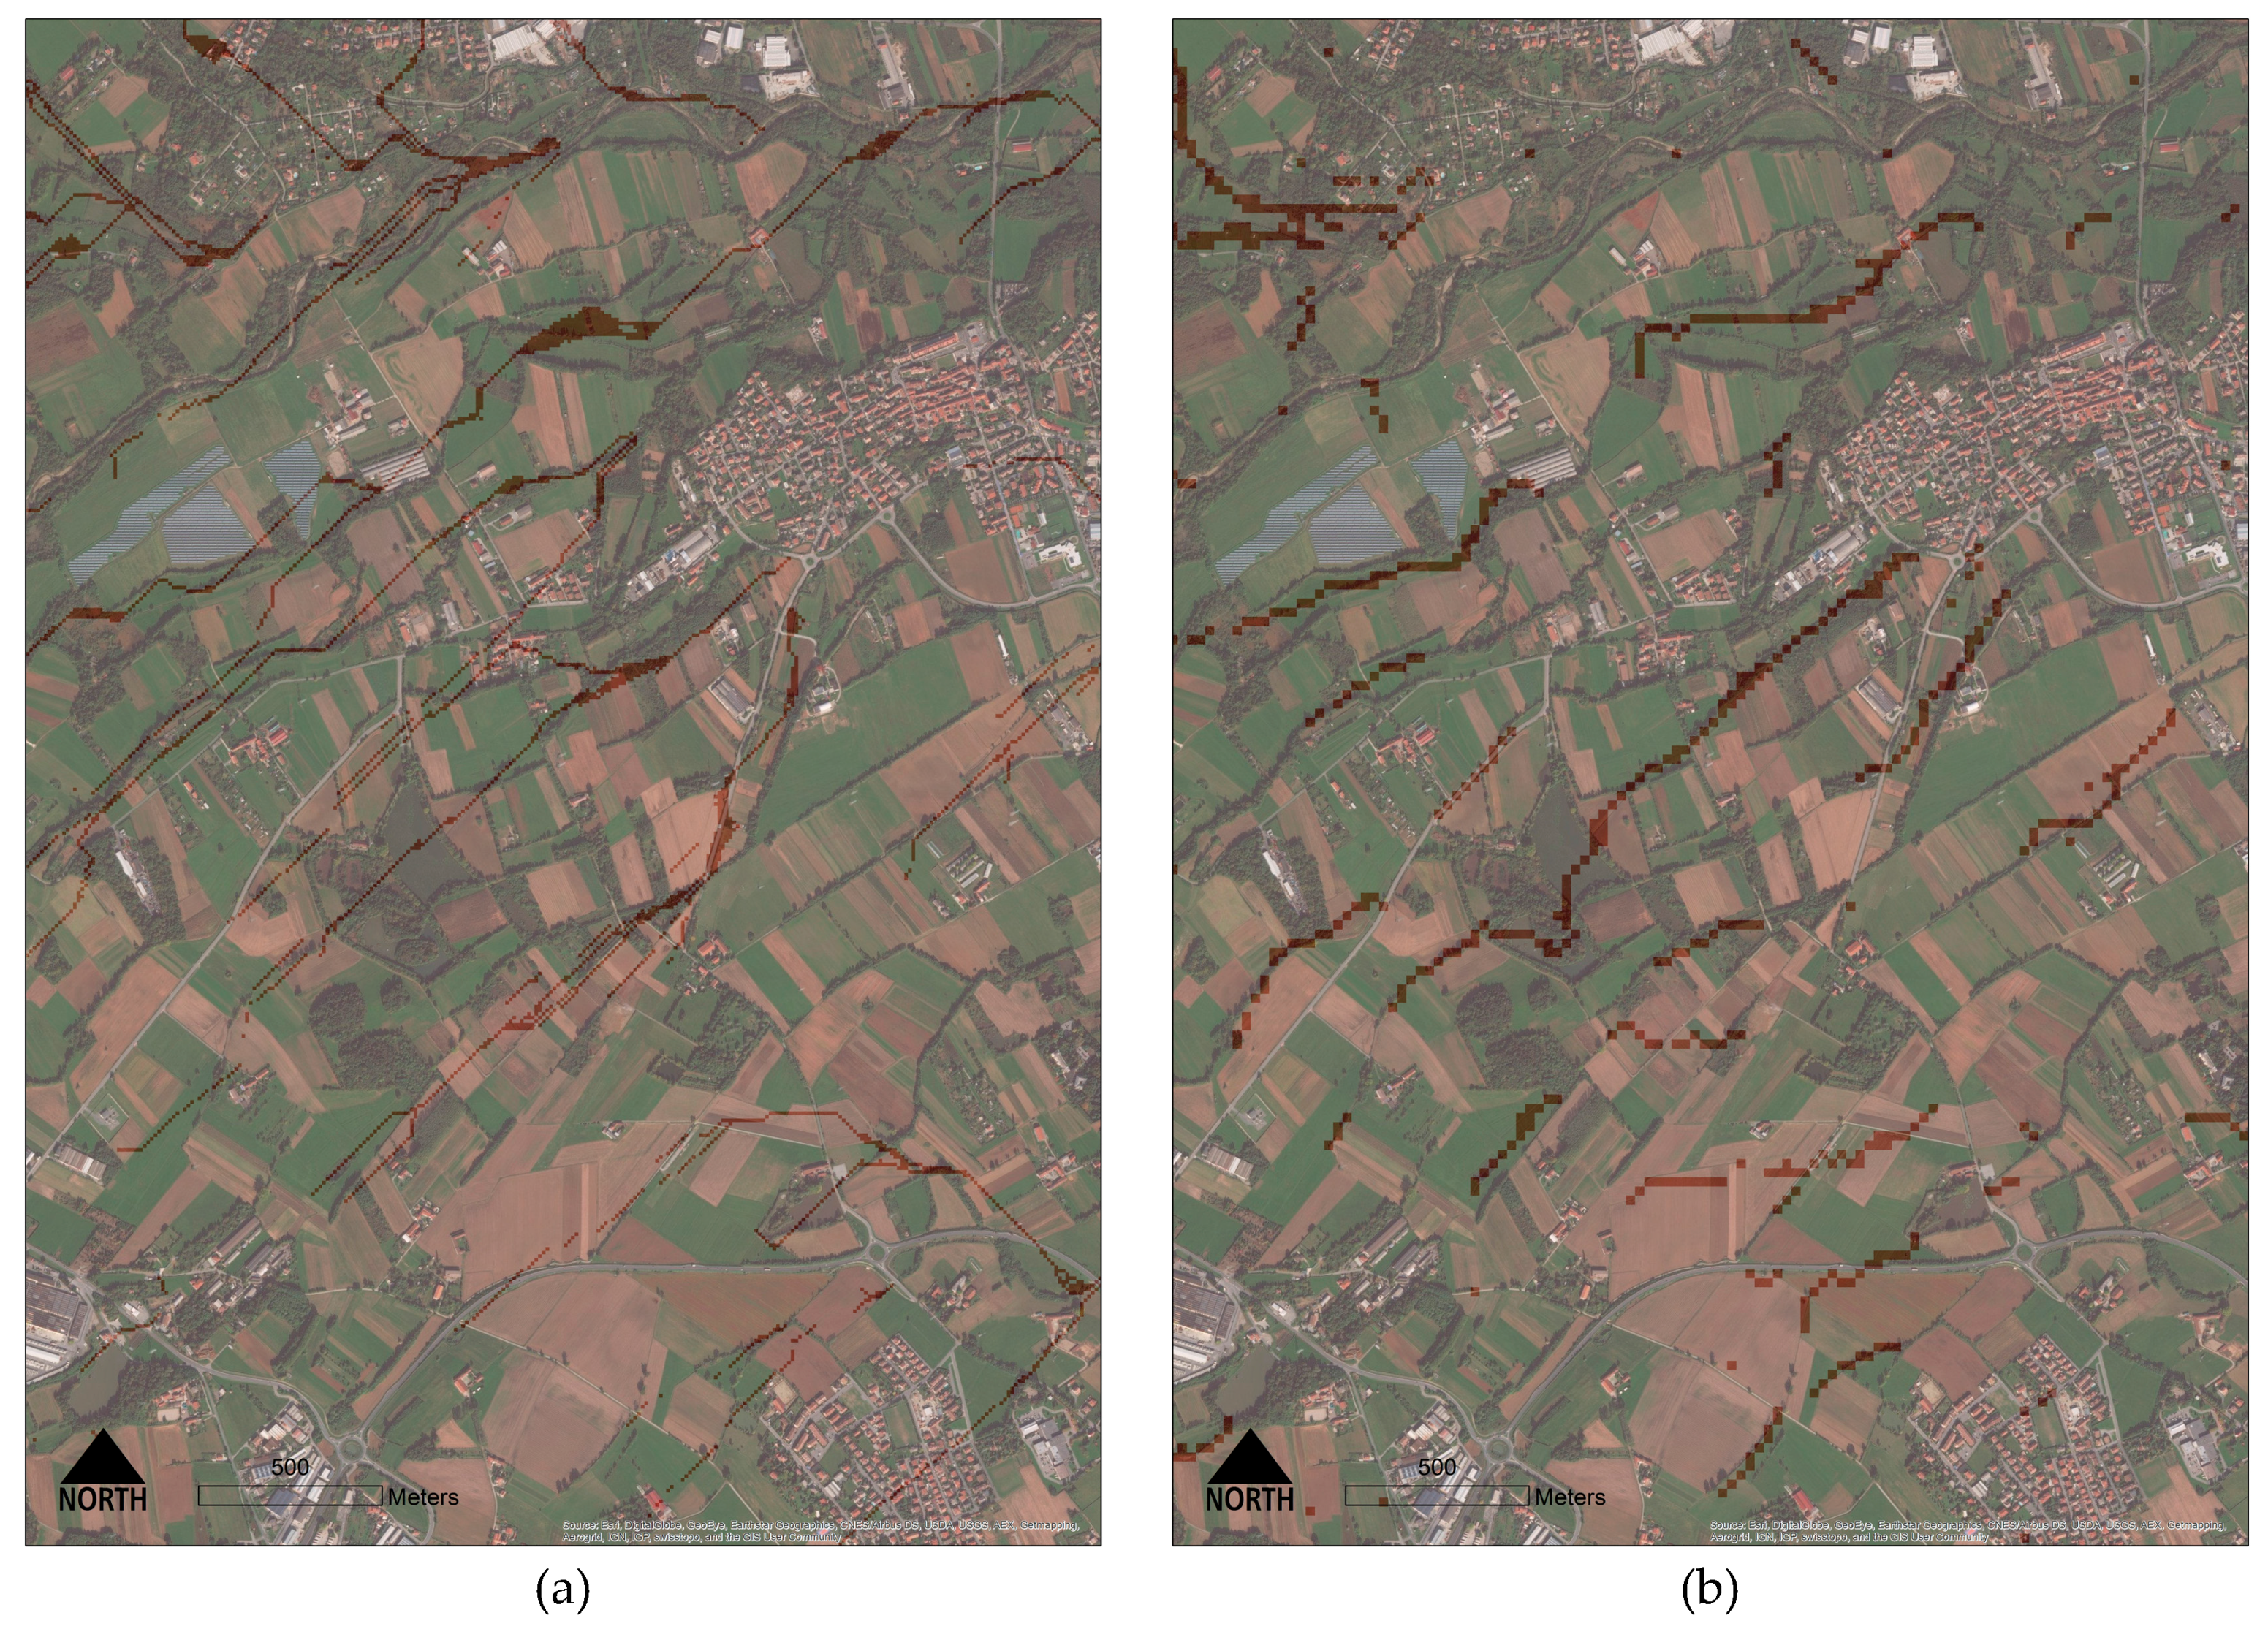
The change in the model of the DEM dataset gives important feedback with respect to the new outputs. The changes illustrated in the
Figure 3 and
Figure 4 show how the interaction with DEM 10 m and DEM 25 m provides a different workflow output (intermediate result after run-off), which implies a better distribution of values.
3.2. Model Interaction with DEM and LULC
The correction of the DEM determined a new runoff model which was validated by the group, and the nutrient retention model has been analyzed using its final output instead of the intermediate.
The DEM used in the new version is a product of the official topographical survey of the Piedmont region. It was created between 2000 and 2010 by a grid model of 25 m; thus, the pixel dimension is coarser than the previous DEM used, while the results seem to be more acceptable. The integration of the LULC map with the DEM determines the size of the output grid cells.
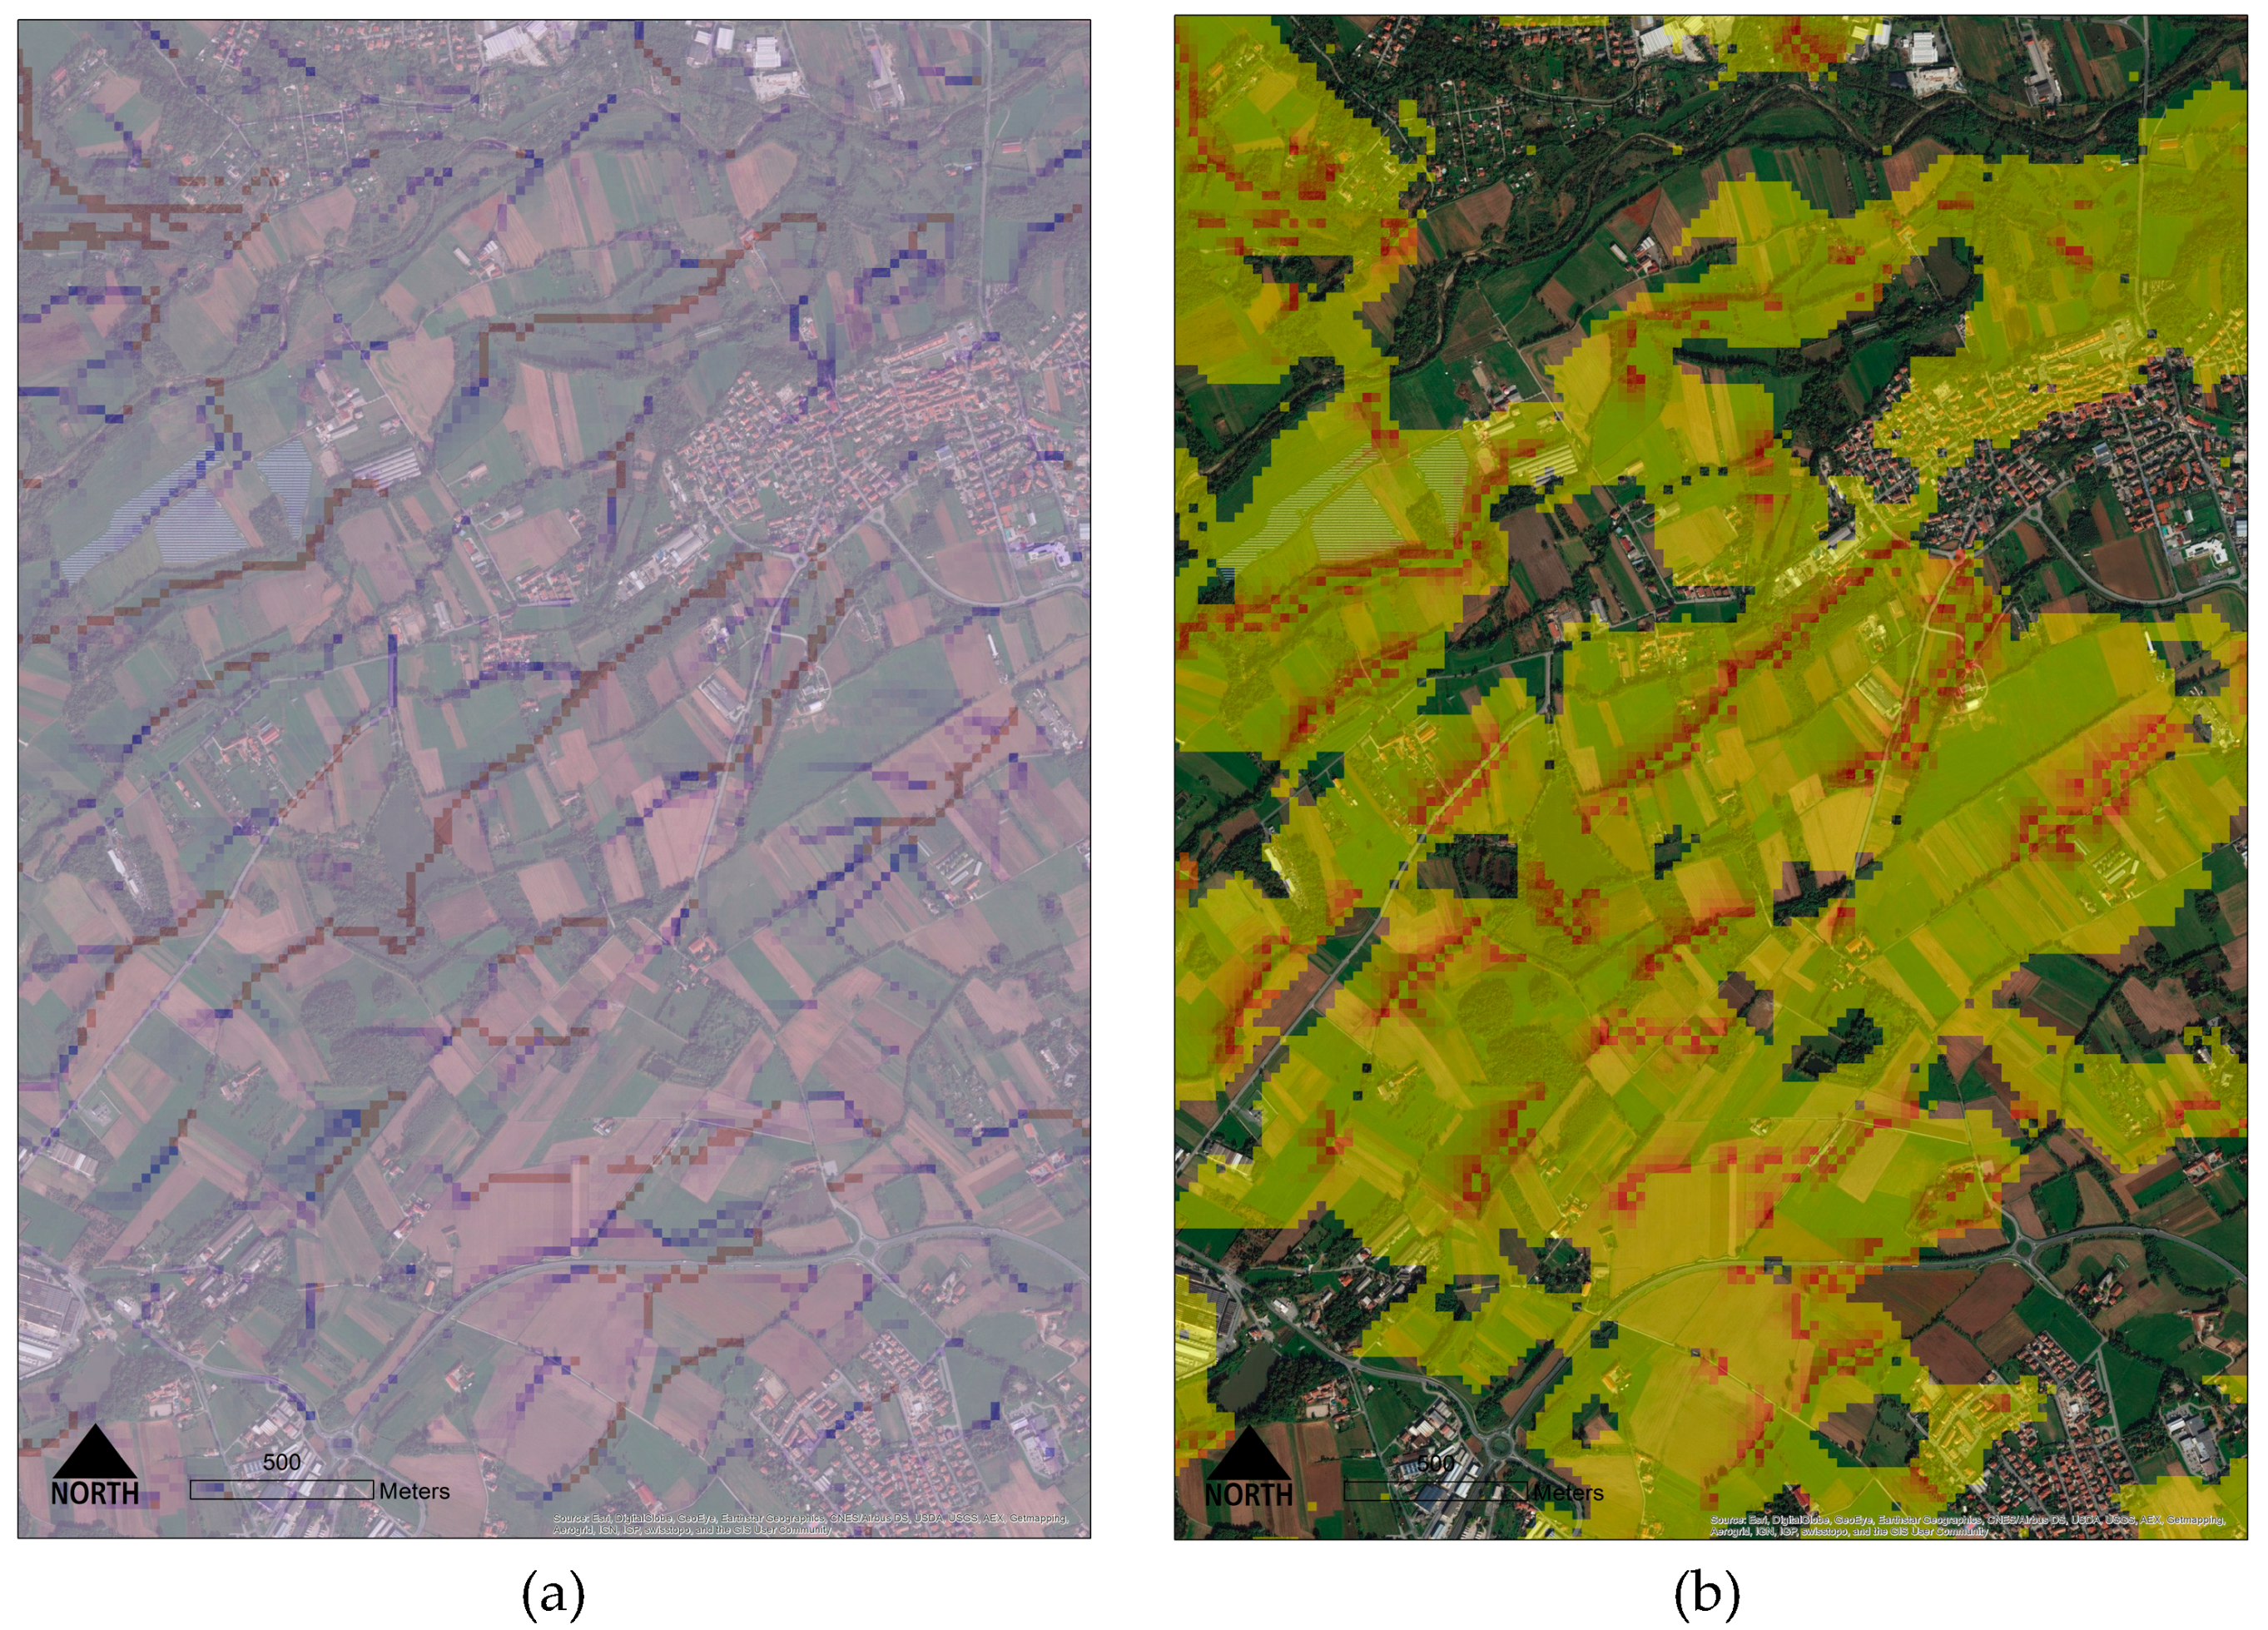
The evaluation of the file n_export.tif shows how the integration of the different intermediate results interact together (
Figure 5): where the run-off process in upstream areas is intense, then the load of nutrient is higher (particularly when no natural vegetation acts as a filter to the nutrients). In that case, the model shows how pollutants that are not removed by vegetation contaminates the water bodies.
The use of the 25 m DEM generates a result which was closer to what was expected: the nutrient concentration happened along the buffer areas of rivers, streams, and natural water bodies following a gravitational route and infiltrates where the interaction between the DEM, soil properties, and LULC determines water sinks. Even without a quantitative assessment, the better output distribution is achieved with a coarser DEM resolution, meaning that sometimes the grid resolution does not correspond to a better model output [
38]
Once the distribution of the model was spatially acceptable, then a quantitative test was applied to understand how the interaction with LULC properties changes the final result. As introduced, the assessment of the load and retained absolute values of nitrogen associated with each land use type depends on the user. Therefore, to test if the model responds to a different configuration of LULC data, it has been decided to shift the LULC-associated values of the nutrient load with values of retention, thus, obtaining an output which is generated by a different configuration of LULC-dependent variables (
Table A2). The result (
Table 3) shows a considerably different distribution of nutrients. The interaction between the DEM-dependent block (runoff) and LULC-dependent block (nutrient loads/retain) generates a new map where the contamination process happened from the upstream to the downstream area, but with a different distribution and quantity of values (as expected).
The test confirmed the response of the model to the user modification of input, generating a radically different output.
Considering the “n_exp_tot” is the biophysical output that is considered during the planning process, the differences between the input configurations are outlined by the rows “diff 1–2” and “diff 2–3” (
Table 4).
Particularly, the correction of the DEM generates at the catchment scale an absolute augmentation of nitrogen exported to the stream equal to more than 222,658 kg, which corresponds to an augmentation of the previously-registered value of 17.9%. This measure reveals that the DEM quality influences the model workflow and sheds light on the needs of careful use of the input data, assessing both their spatial distribution and their absolute value.
While considering the “diff 2–3”, it is shown that when loading and absorbing values are modified, the net absolute decrease of nitrogen exported to the stream is equal to more than 1,347,448 kg, which implies a reduction of infiltration equal to 91.8%. The decline is due to the LULC conversion which reduces the number of load areas in upslope territories and increases the filtering ones in plain zones; then interaction of runoff with LULC distribution generates an abatement of nitrogen infiltration. That configuration shows a total amount of nitrogen infiltrated of 120,150 kg in the catchment area. The reduction confirms the dependency of output from LULC associated data: the agricultural areas are double the natural and semi-natural ones (121,726.90 ha compared to 65,798.17 ha), therefore, the shift in LULC properties means that the nitrogen loads are halved while the retention areas are doubled. This result seems to confirm good feedback between the quantitative values associated with the input data and their interaction to generate the final output.
The collaboration with external expertise (Dario Masante, Joint Research Centre) confirmed that the intermediate flows of the model were analyzed by other relevant ES software (AIRES of LUCI) [
5]. Outputs of the validation process were shared with the external research group, the ones that tested the nutrient retention function with different software to define a comparative assessment.
3.3. Model Sensitivity to DEM
While the feedback from LULC changes was quite intuitive and connected to a linear relationship between the quantity of a particular LULC class and its value of nutrient load or retain, the response of DEM changes still remained less understandable and requested an in-depth analysis.
Four raster DEM datasets were downloaded from different sources (national and regional web geodatabases) and used to see how the nutrient retention output changes in response to DEM substitution (
Table 4). To apply the analysis, none of the other input data were changed, in order to obtain an evaluation of the DEM-related dependencies. InVEST runs four times in a sub-area characterized by a hilly and mountainous landscape to reduce the time of elaboration for each result.
The analysis of results has been conducted with a global sensitivity approach on DEM models [
51,
52] using a probability distribution function assigned to DEM variables. A probability distribution has been founded for DEM indices with an uncertainty degree (linear regression), and outputs were tested against the uncertainty of all input variables. DEM data were thought as a model, and probability distribution functions have been assigned to data variables. The variance between input and output was observed as an indicator of the output’s sensitivity to input changes [
53,
54].
A global sensitivity analysis was then conducted, with particular attention to:
Analyze the variation of the model output related to a change in the raster input (DEM). A regression of DEM indices was applied and a simulation of thirteen different DEM configurations and their outputs were tested;
Analyze the correlation and the variance of each DEM index related to the output; and
Analyze the dependencies of the DEM input configuration to the nutrient retention output.
Each raster input (DEM) has been evaluated using its related statistical values. In the case study, the value “average” and “standard deviation” were inversely distributed with the DEM resolution.
As shown in
Table 4, even if the large majority of indices are inversely proportional to DEM resolution (except minimum and maximum values), their interaction does not generate an output which is inversely related, too. The value of “n_exp_tot” is not linearly distributed according to the geometrical precision of pixels. Instead, the output seems to demonstrate a stochastic distribution. This condition was already explored in other DEM-dependent models (e.g., landslide prediction models, Penna et al. 39) and, what is curious is that (i) the variability of the output is wide, as values ranges from 163,392 kg to 10,398 kg, with a standard deviation of 64,271 kg; and (ii) the lower value (DEM 25) is the one that fits with the real potential distribution of nutrients in the territory, according to an expert-based analysis of the pixel distribution. The geometrical distribution of DEM 25 gives a better feedback compared to others that generate mistakes in the intermediate flow analysis (run-off index distribution).
This means that it is not true that a finer geometrical input resolution in ES models will generate a reliable output. The analysis of the different outputs shows how the change in DEM generates a water-routing intermediate model with different sizes, paths, lengths, and directions of streams in the catchment area with a better approximation to the real streams’ distribution provided by DEM 25.
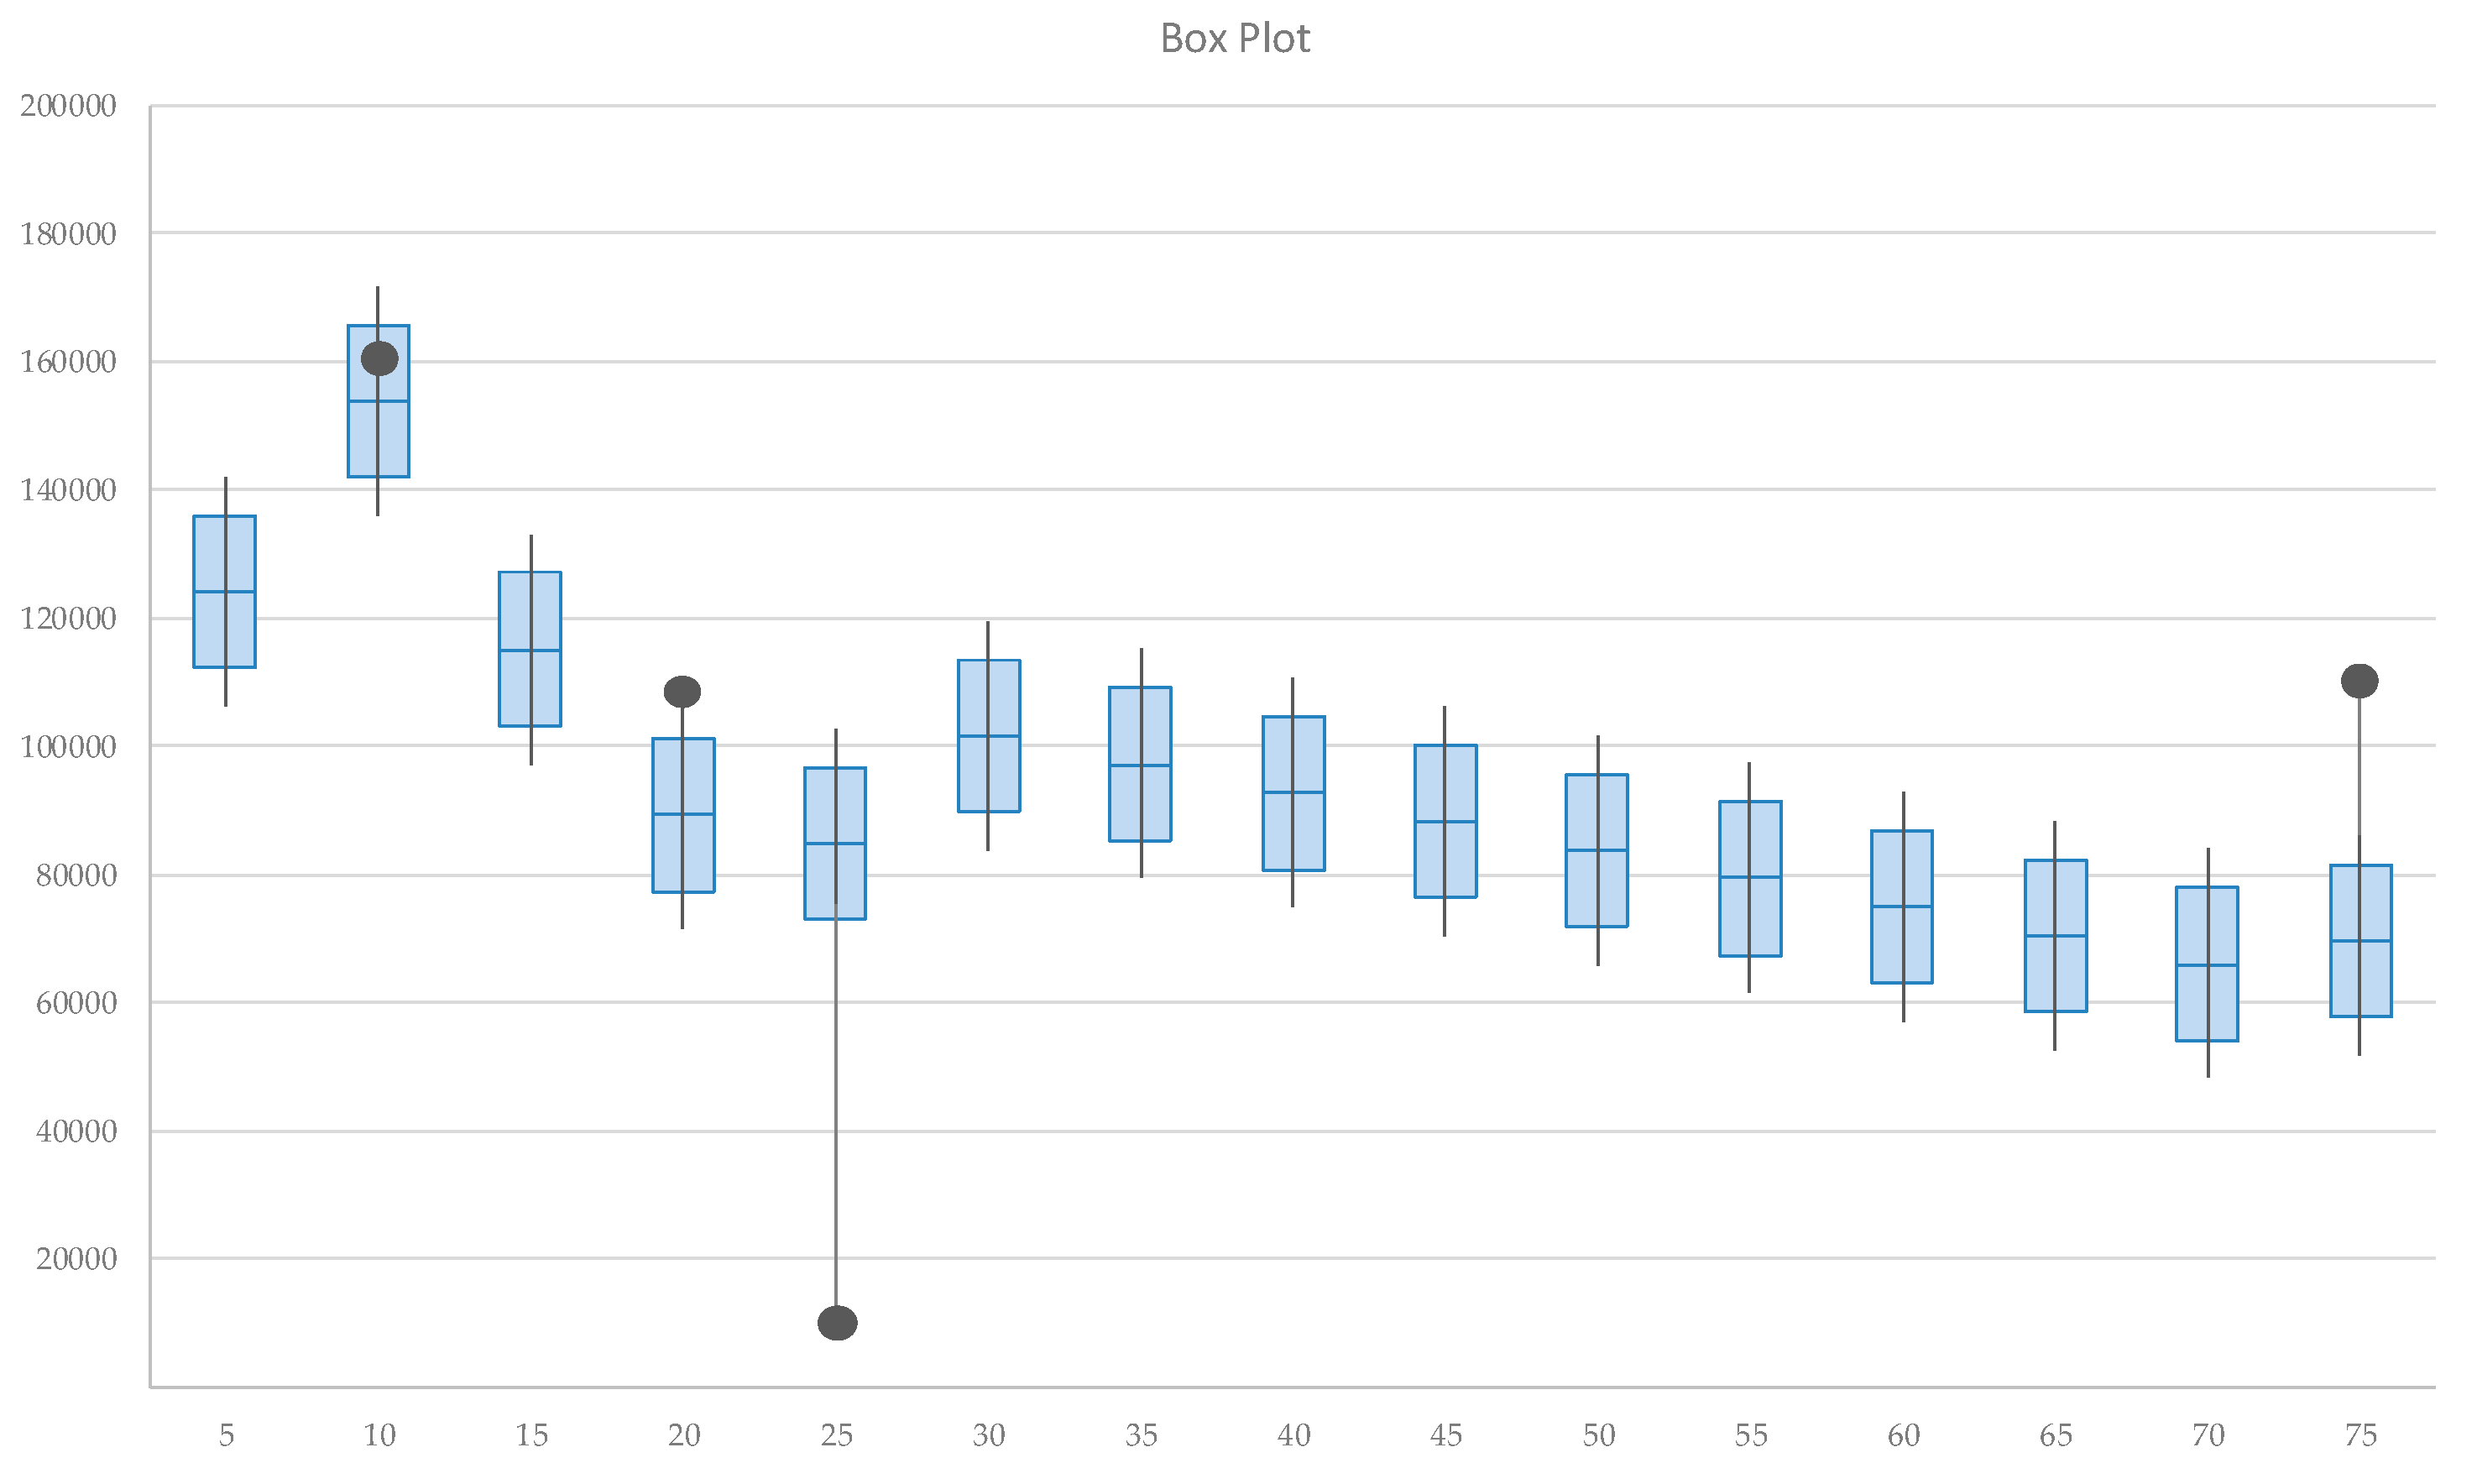
To have a better analytical assessment of the data, the relation between the model output and DEM input configuration was analyzed with a regression analysis that simulated eleven DEMs and relative outputs. The DEM resolution of simulated values ranged from five to 75 cells, including the four cases studied (
Figure 6).
Simulations were provided using the index “sum” as the regressor because it showed better correlation to the model output. They confirm that the distribution of the output is nonlinear, and not related to the DEM resolution. The “confidence range” (95th percentile) included the result of the model in just one case (DEM 10) showing, in two cases, an underestimation (DEM 20 and 75) and, in one case, an overestimation (DEM 25). The standard deviation for the simulated models was still high (23,500 kg). The greater deviation is for DEM 25 and, secondly, for DEM 75 (while DEM 20 has a lower deviation).
An in-depth analysis of the values shows that the standard deviation for registered values (model output) and simulated ones remains high (respectively, 64,271.43 and 23,500.93). The confidence range is high, too. Observing how the variance (standard deviation) affects the model output it is possible to test the uncertainty of the input values.
An average influence value for the simulated case is of 26.54%, ranging from 15.27% (DEM 10) to 35.62% (DEM 70). Thus, the variability of the nutrient retention output is affected by a degree of uncertainty dependent on the DEM resolution, which should be considered high (more than 25%, on average).
In conclusion, the interaction of the nutrient retention model with different DEM resolutions is not predictable. Accordingly, it is necessary to have a visual feedback of the pixel output distribution to check how nutrients move toward the landscape.
The variability of the output, which is influenced by the DEM characteristics, is very high, thus an empirical test of the model is highly suggested. In this case, a field study measurement was not considered; nonetheless, to achieve the best input calibration, an empirical survey should be a better solution, with an analysis of the presence of nitrates into the streams in the catchment area.
Even if, for the large majority of users, the DEM resolution is considered a proxy of its reliability (here intended as a good approximation to the real morphological condition of the territory), its interaction with other elements (such as the land use configuration rather than the geological characterization of the soil) is less known and not adequately understood during the use of the InVEST software.


