A Model for Estimating the Vegetation Cover in the High-Altitude Wetlands of the Andes (HAWA)


Abstract
:1. Introduction
2. Methodology
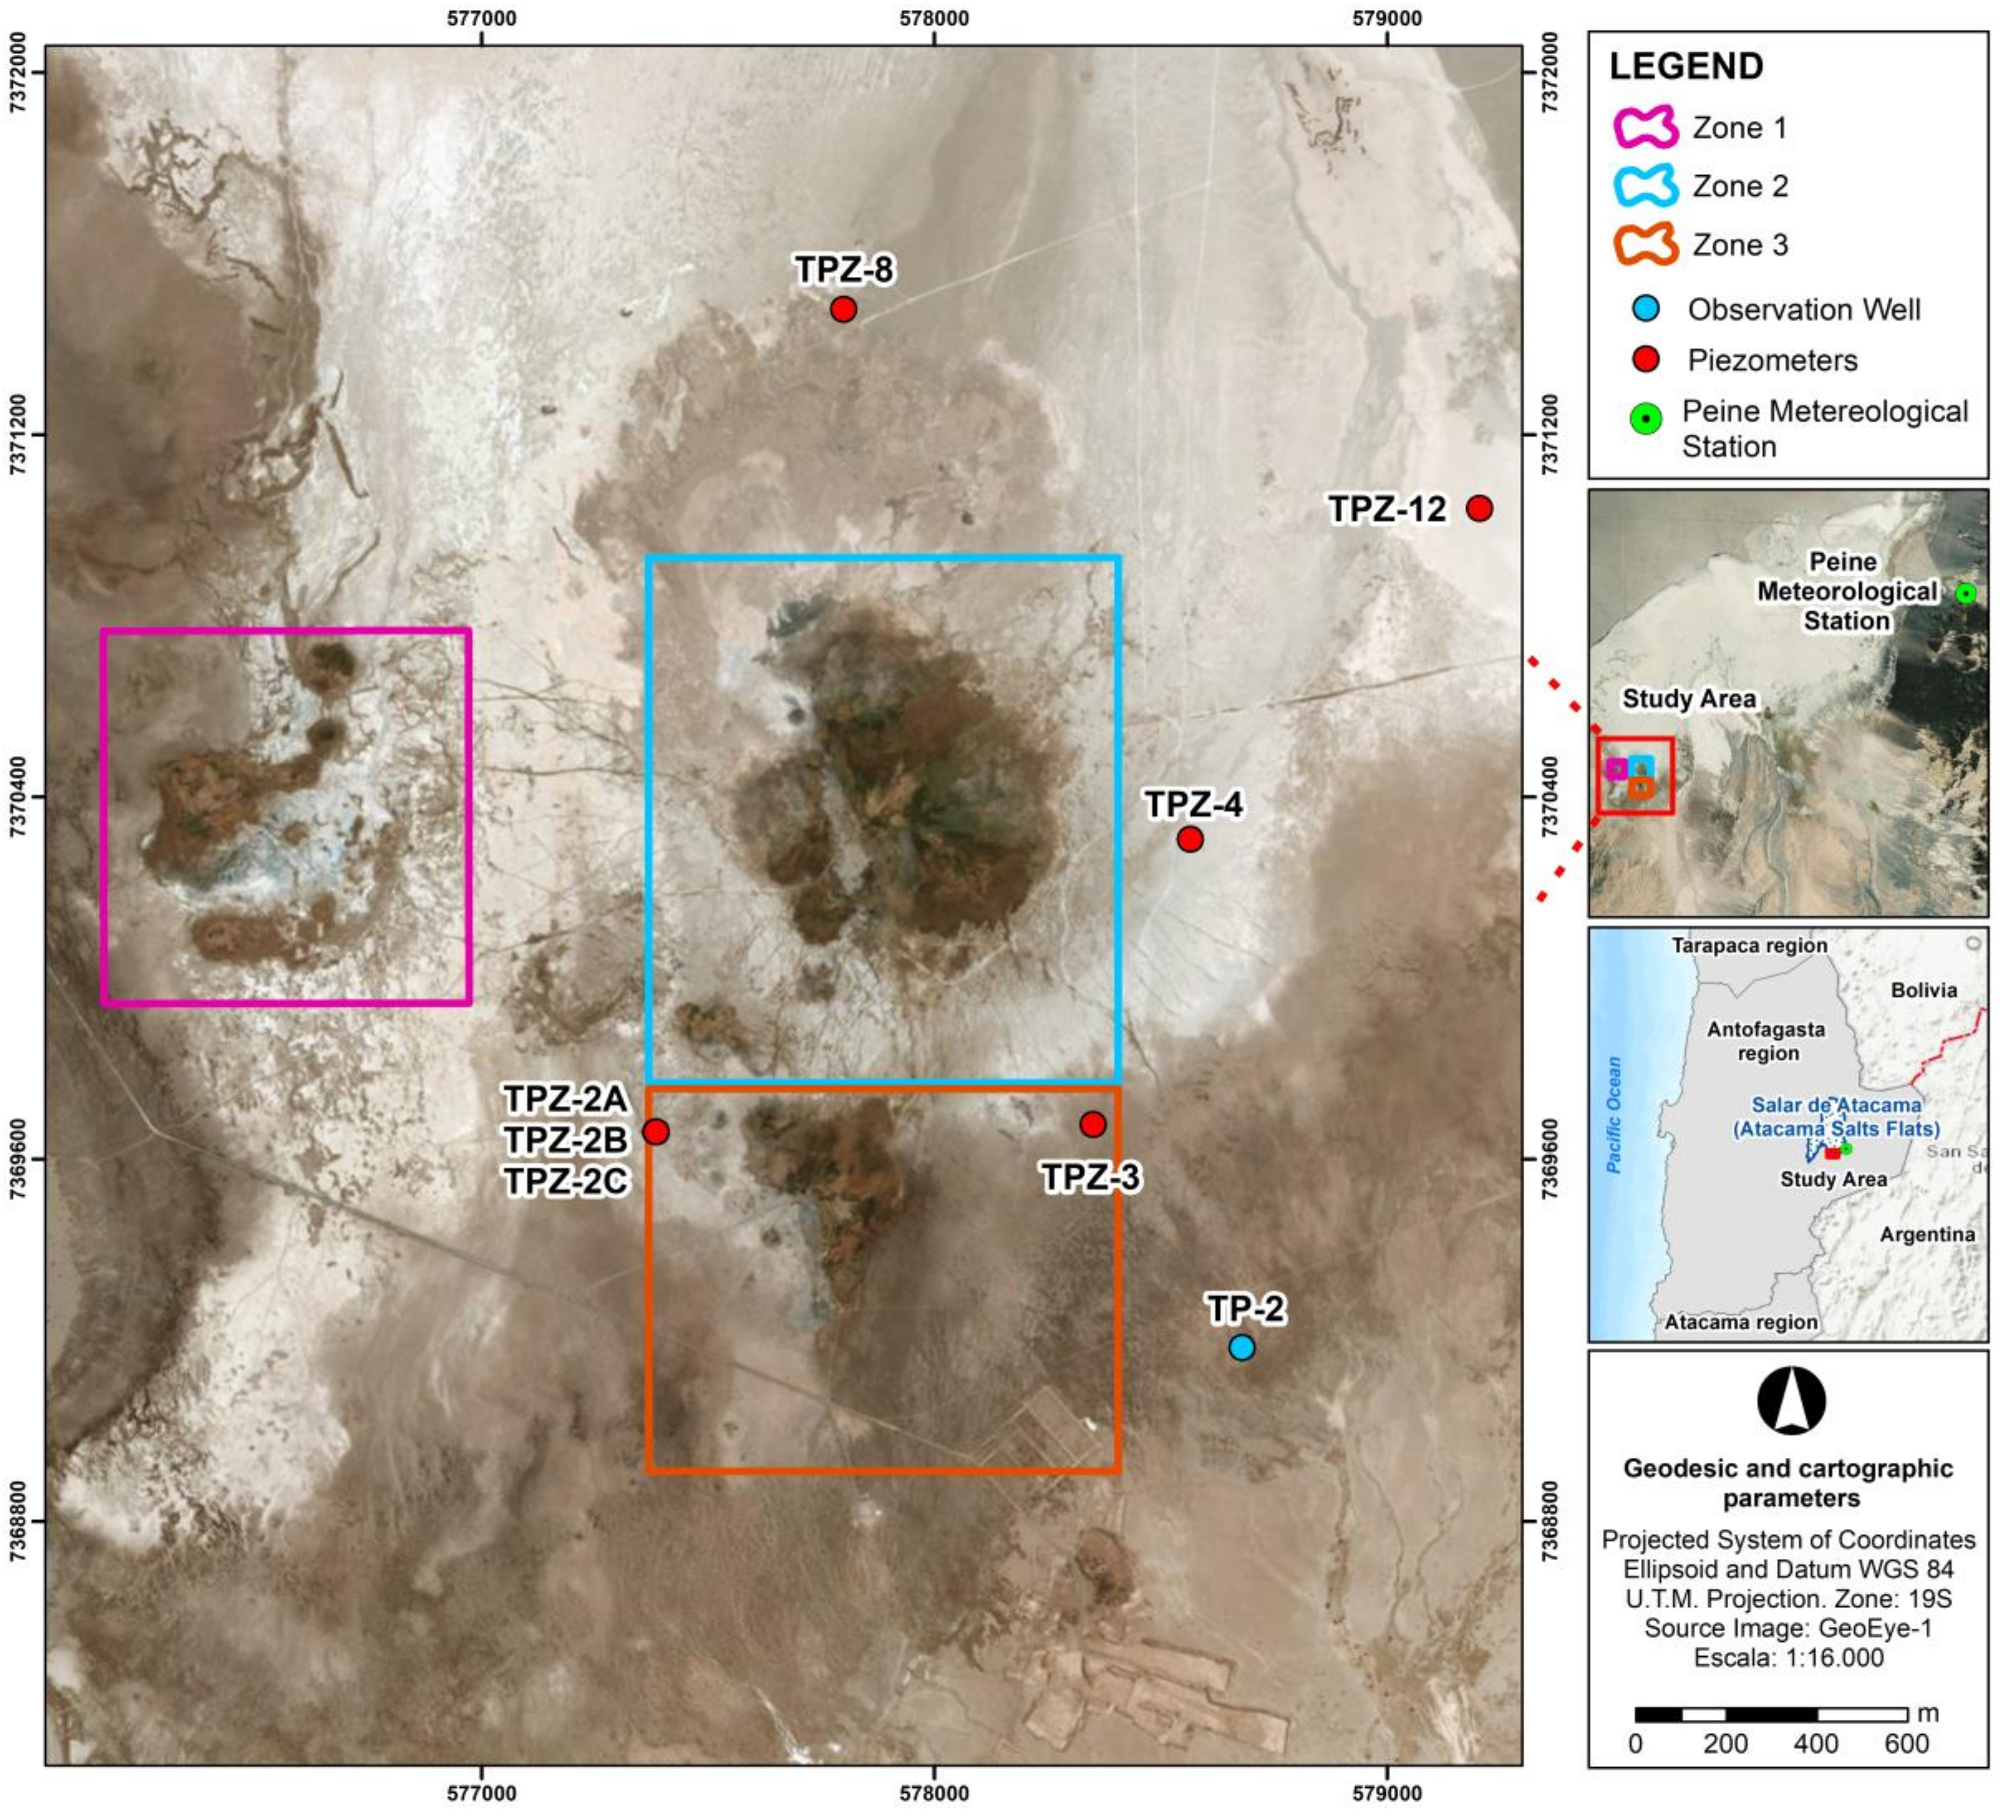
2.1. Study Area
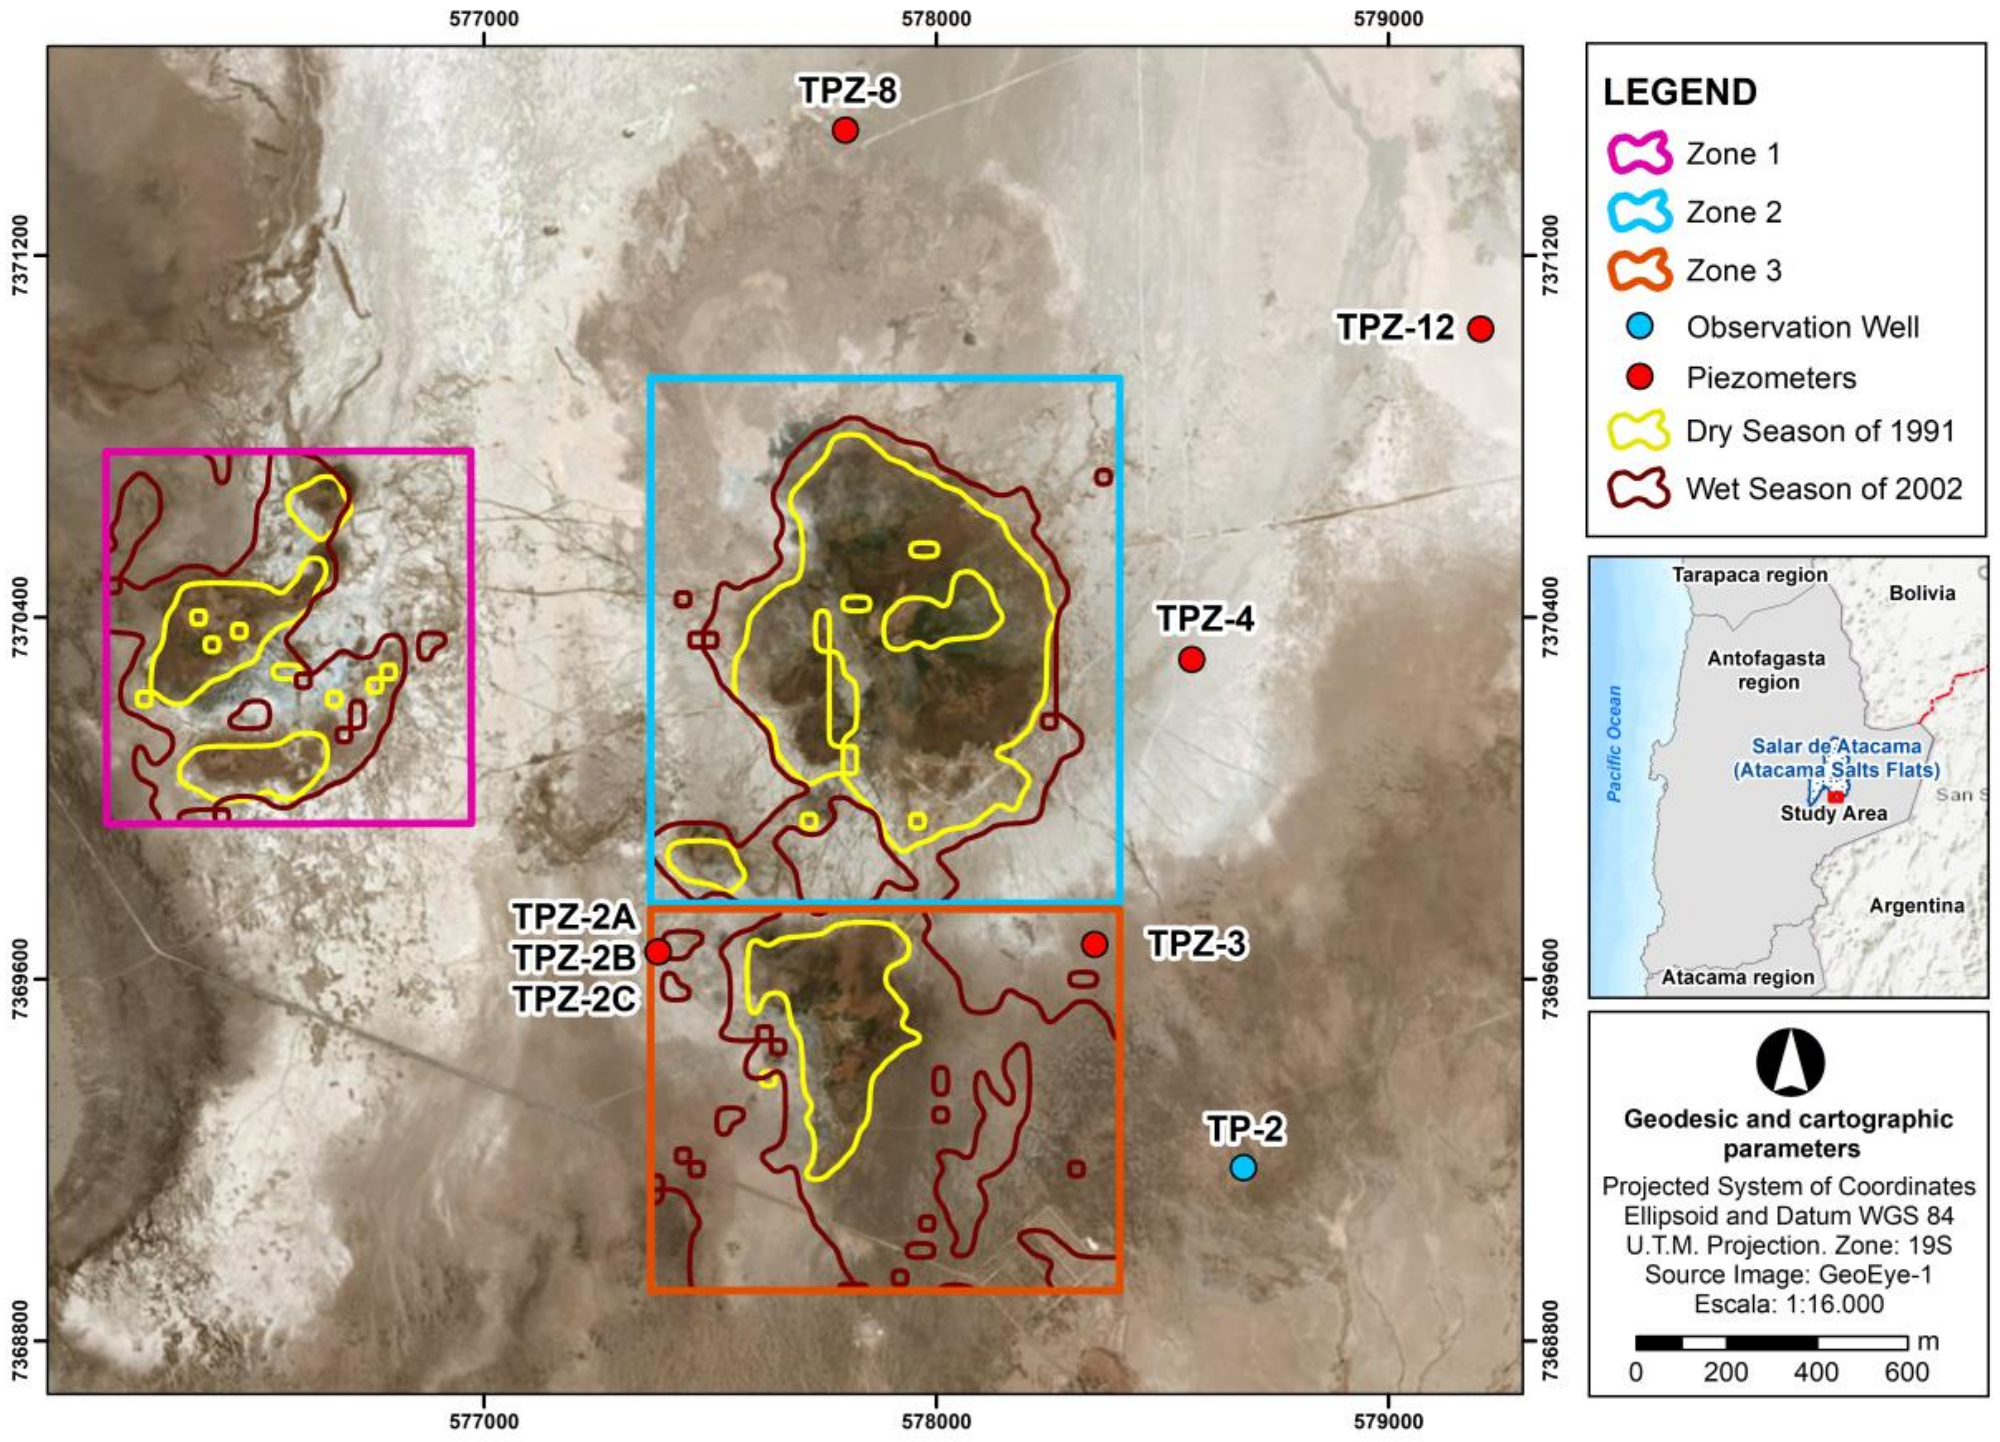
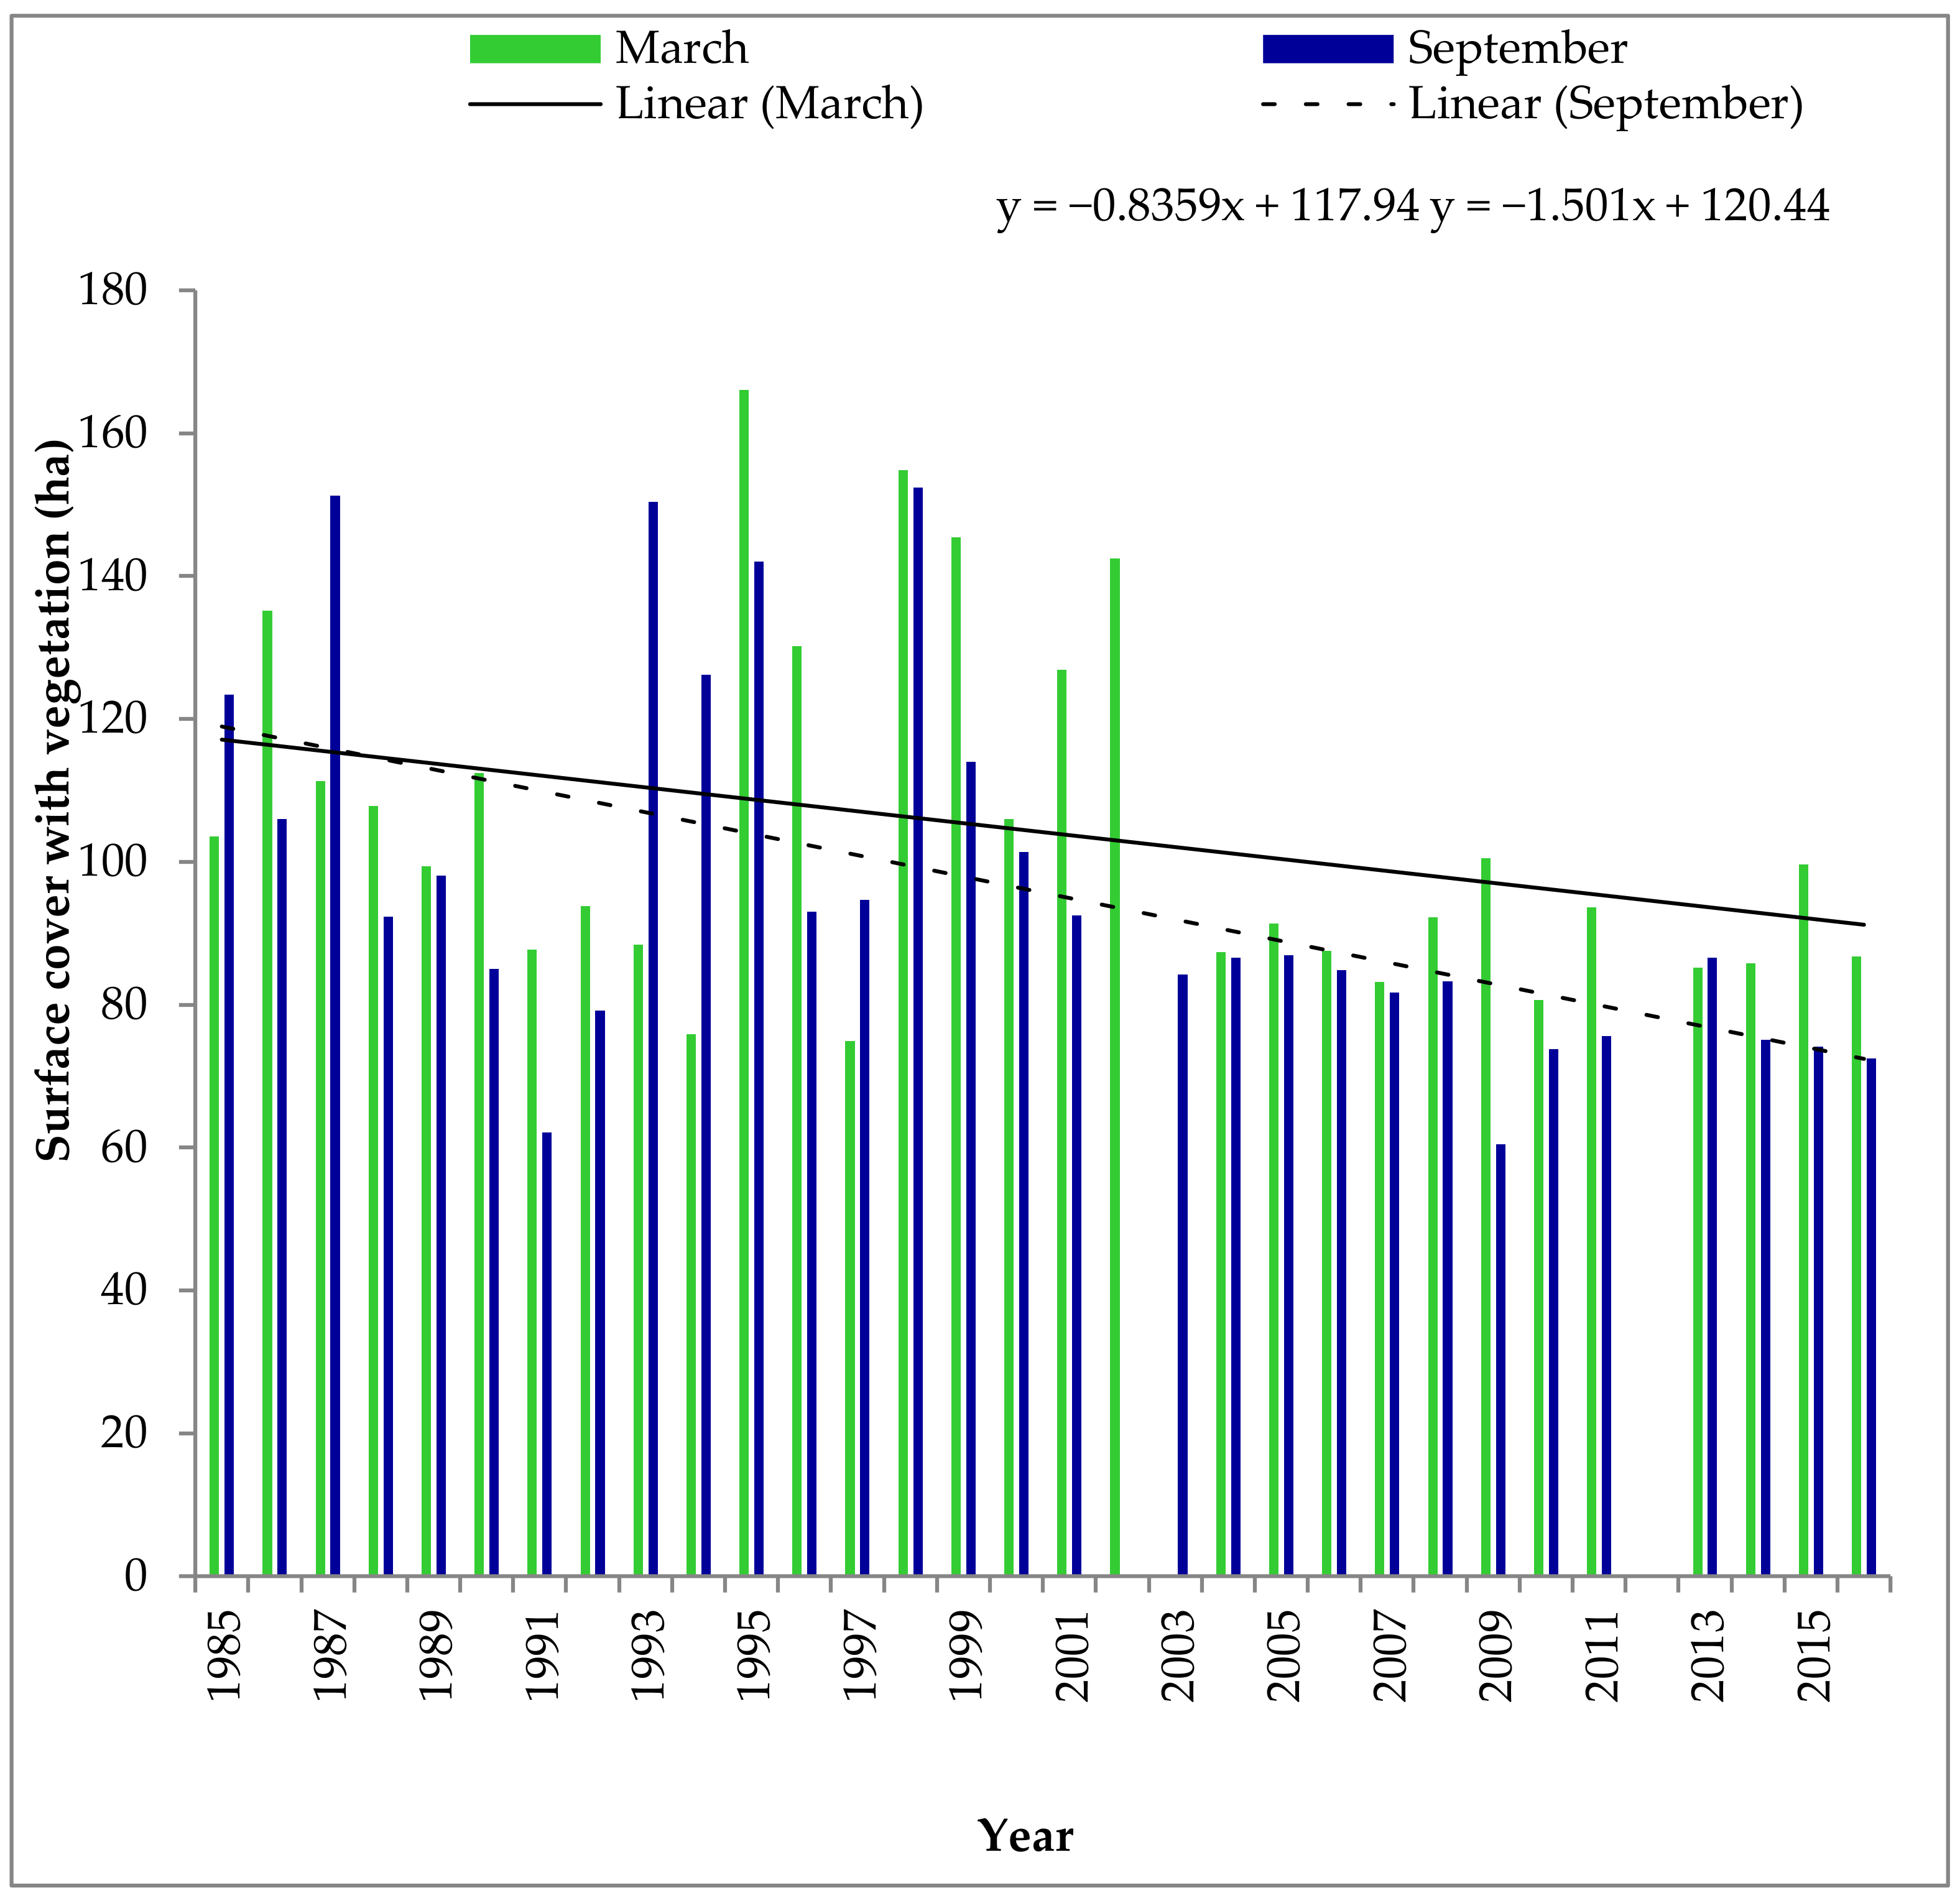
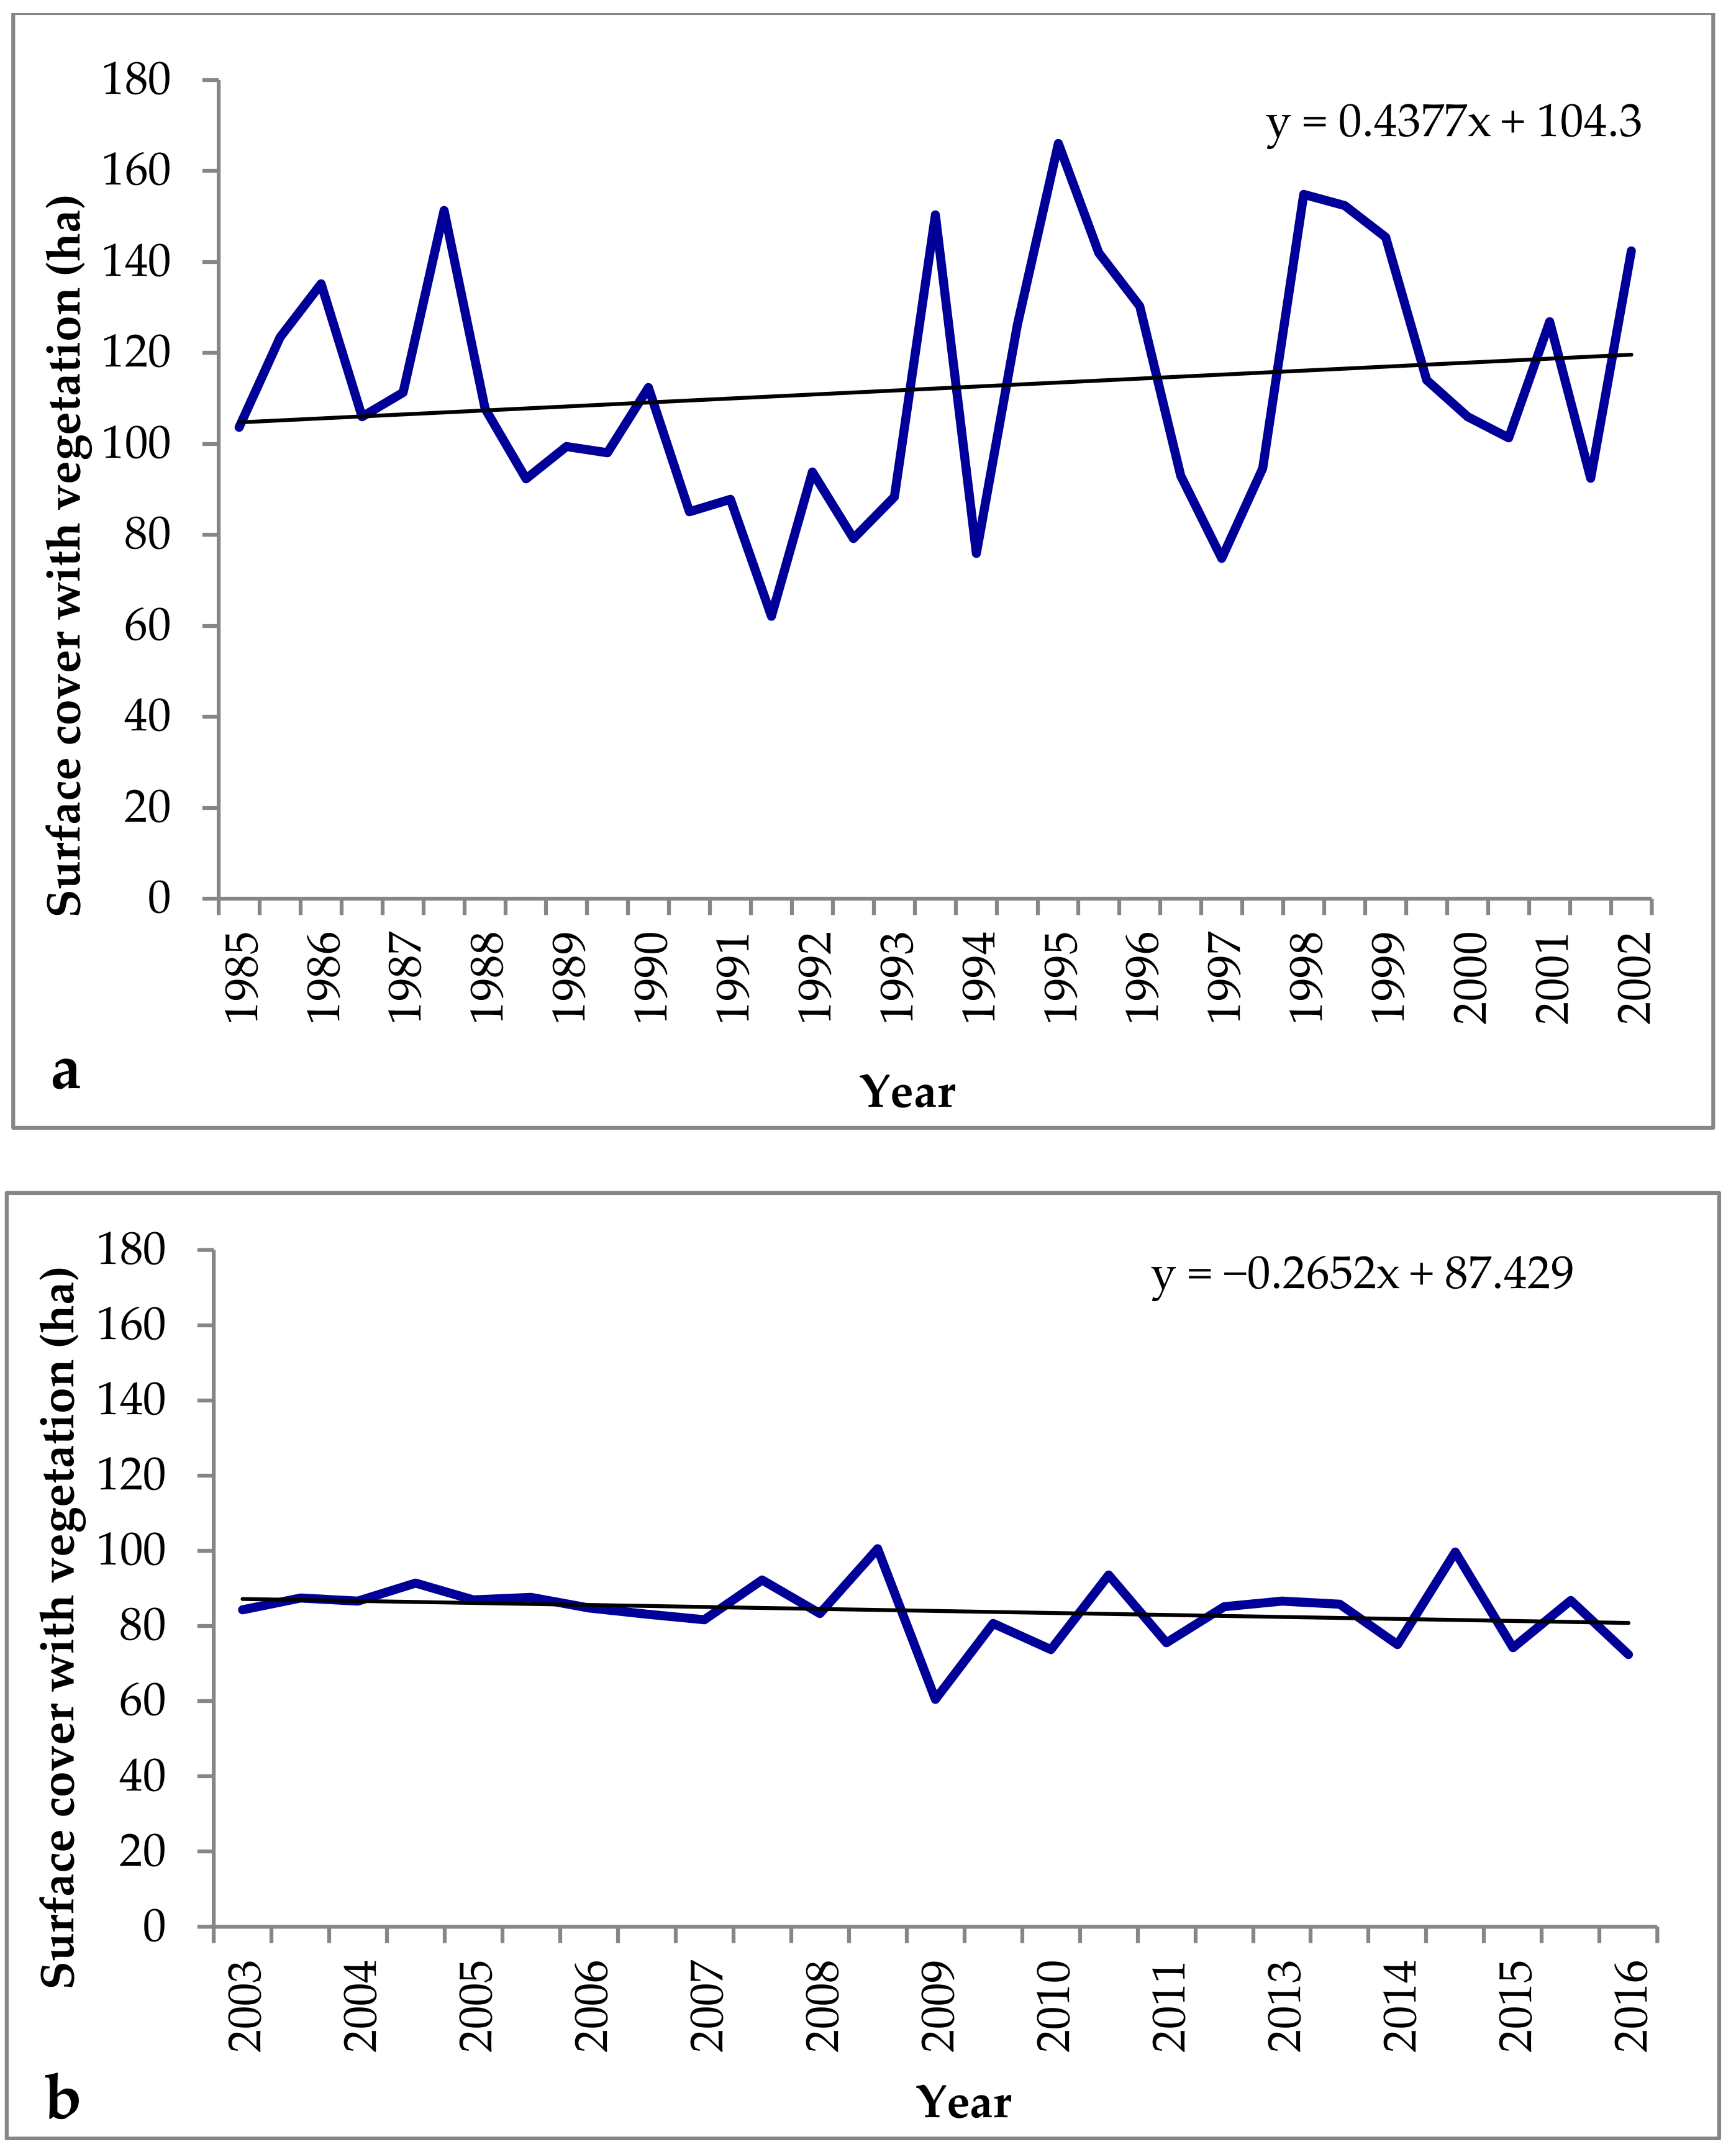
2.2. Vegetation Cover in the Tilopozo Salt Meadows between 1985 and 2016
2.3. Predictive Modelling of Vegetated Surfaces
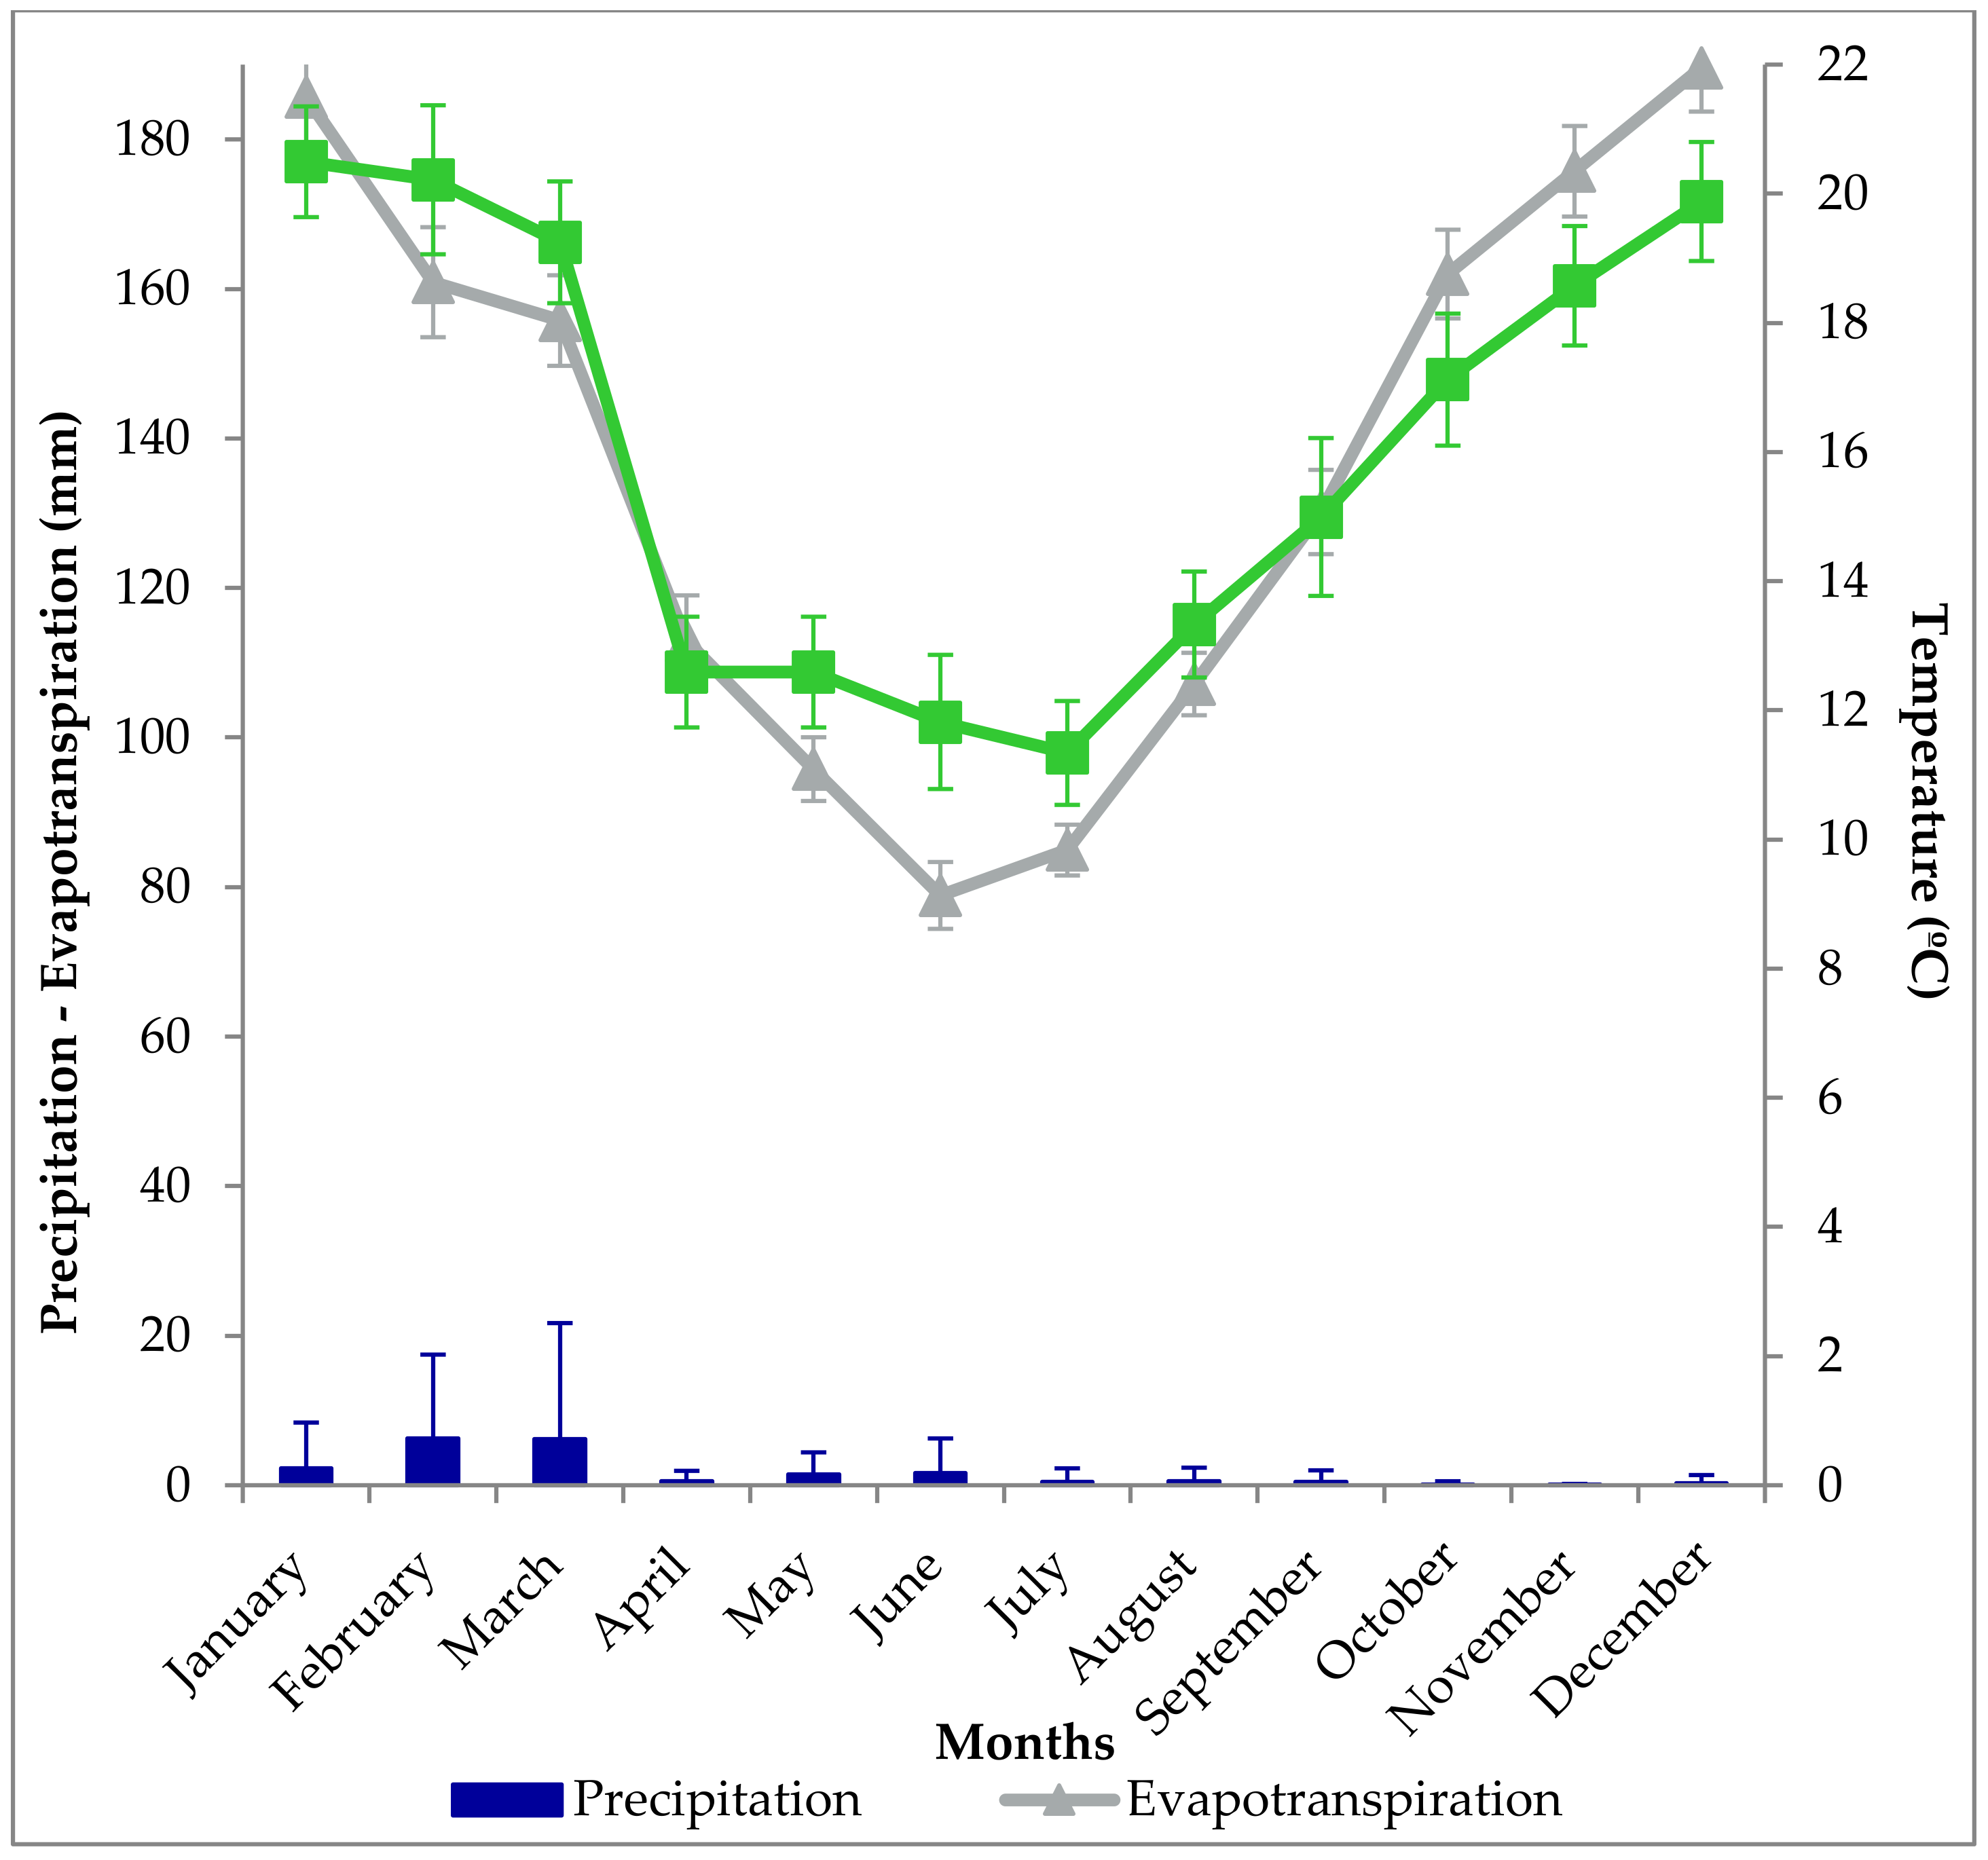
2.3.1. Meteorological Information and Water Table Depths
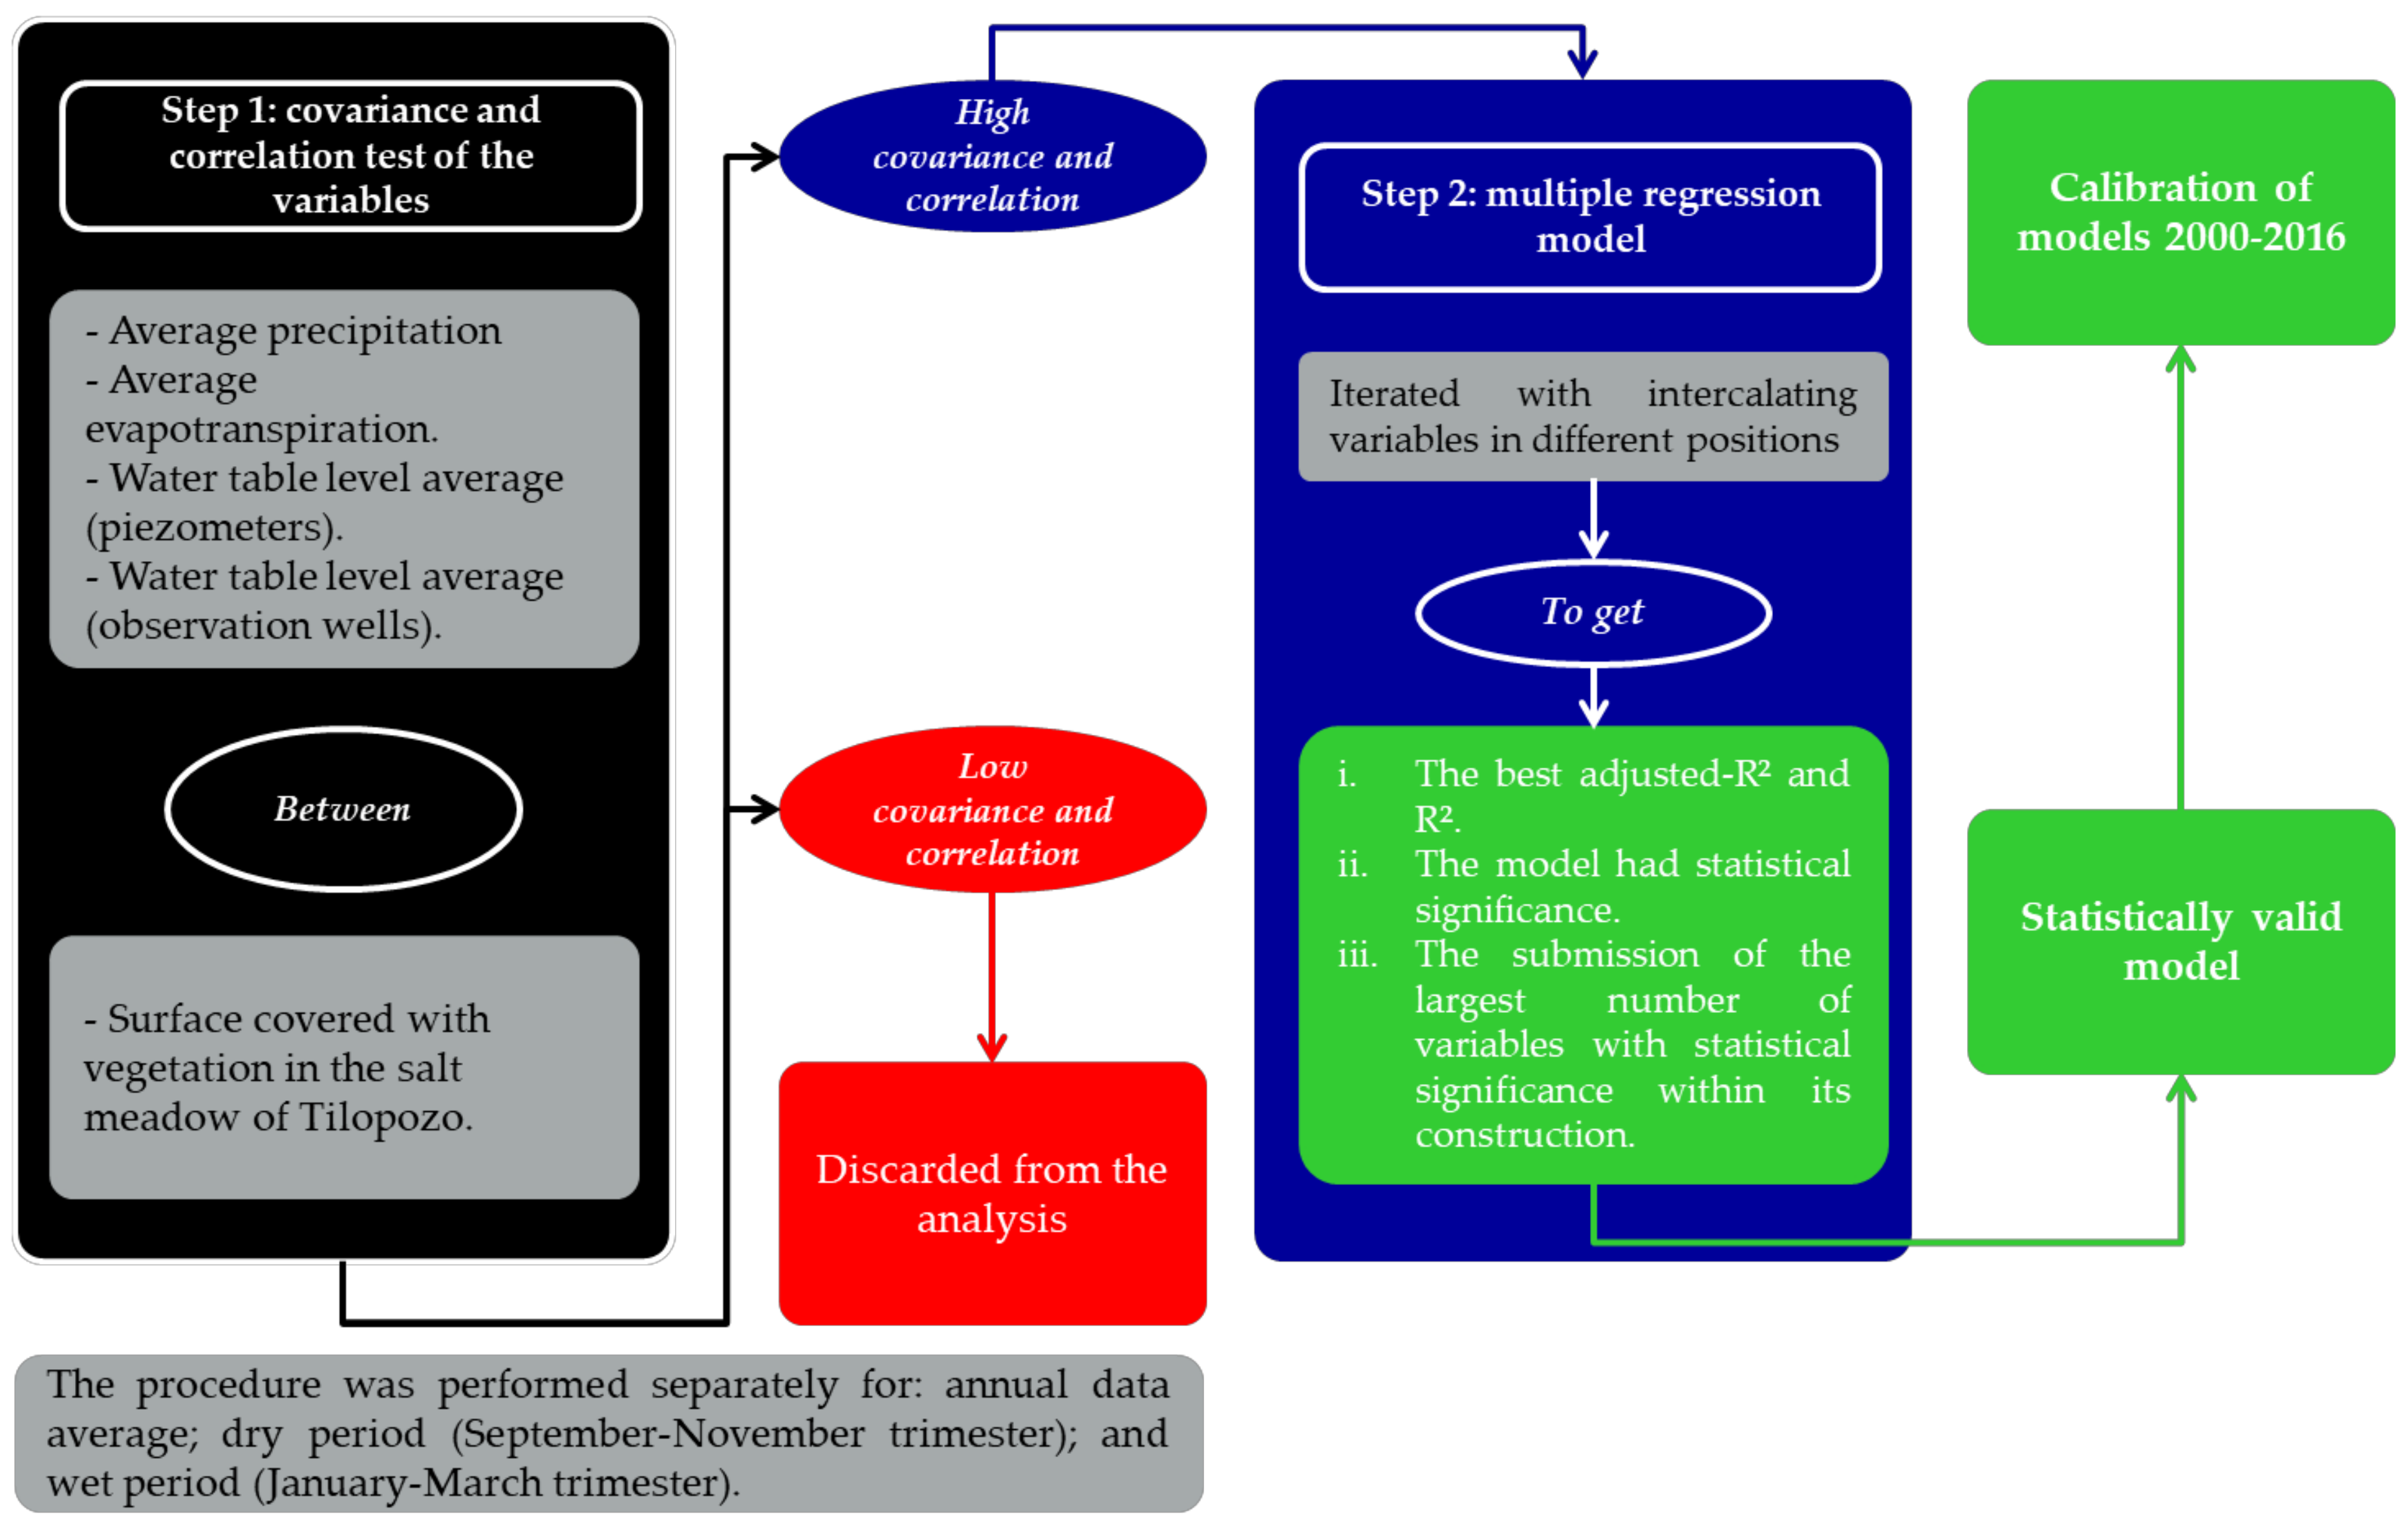
2.3.2. Construction of Models to Predict Surface Vegetation Cover
- (i)
- models that had the best R2 and R2-adjusted values;
- (ii)
- models that had high statistical significance; and
- (iii)
- models that had the greatest number of statistically significant variables.
- (i)
- an annual prediction model;
- (ii)
- a prediction model for the dry period; and
- (iii)
- a prediction model for the wet period.
3. Results
3.1. Vegetation Cover in the Tilopozo Salt Meadows between 1985 and 2016
3.2. Prediction Models of the Vegetation-Covered Surface
3.2.1. Prediction Model of Wet Period Vegetation Cover
3.2.2. Prediction Model of Dry Period Vegetation Cover
3.2.3. Prediction Model of Annual Vegetation Cover
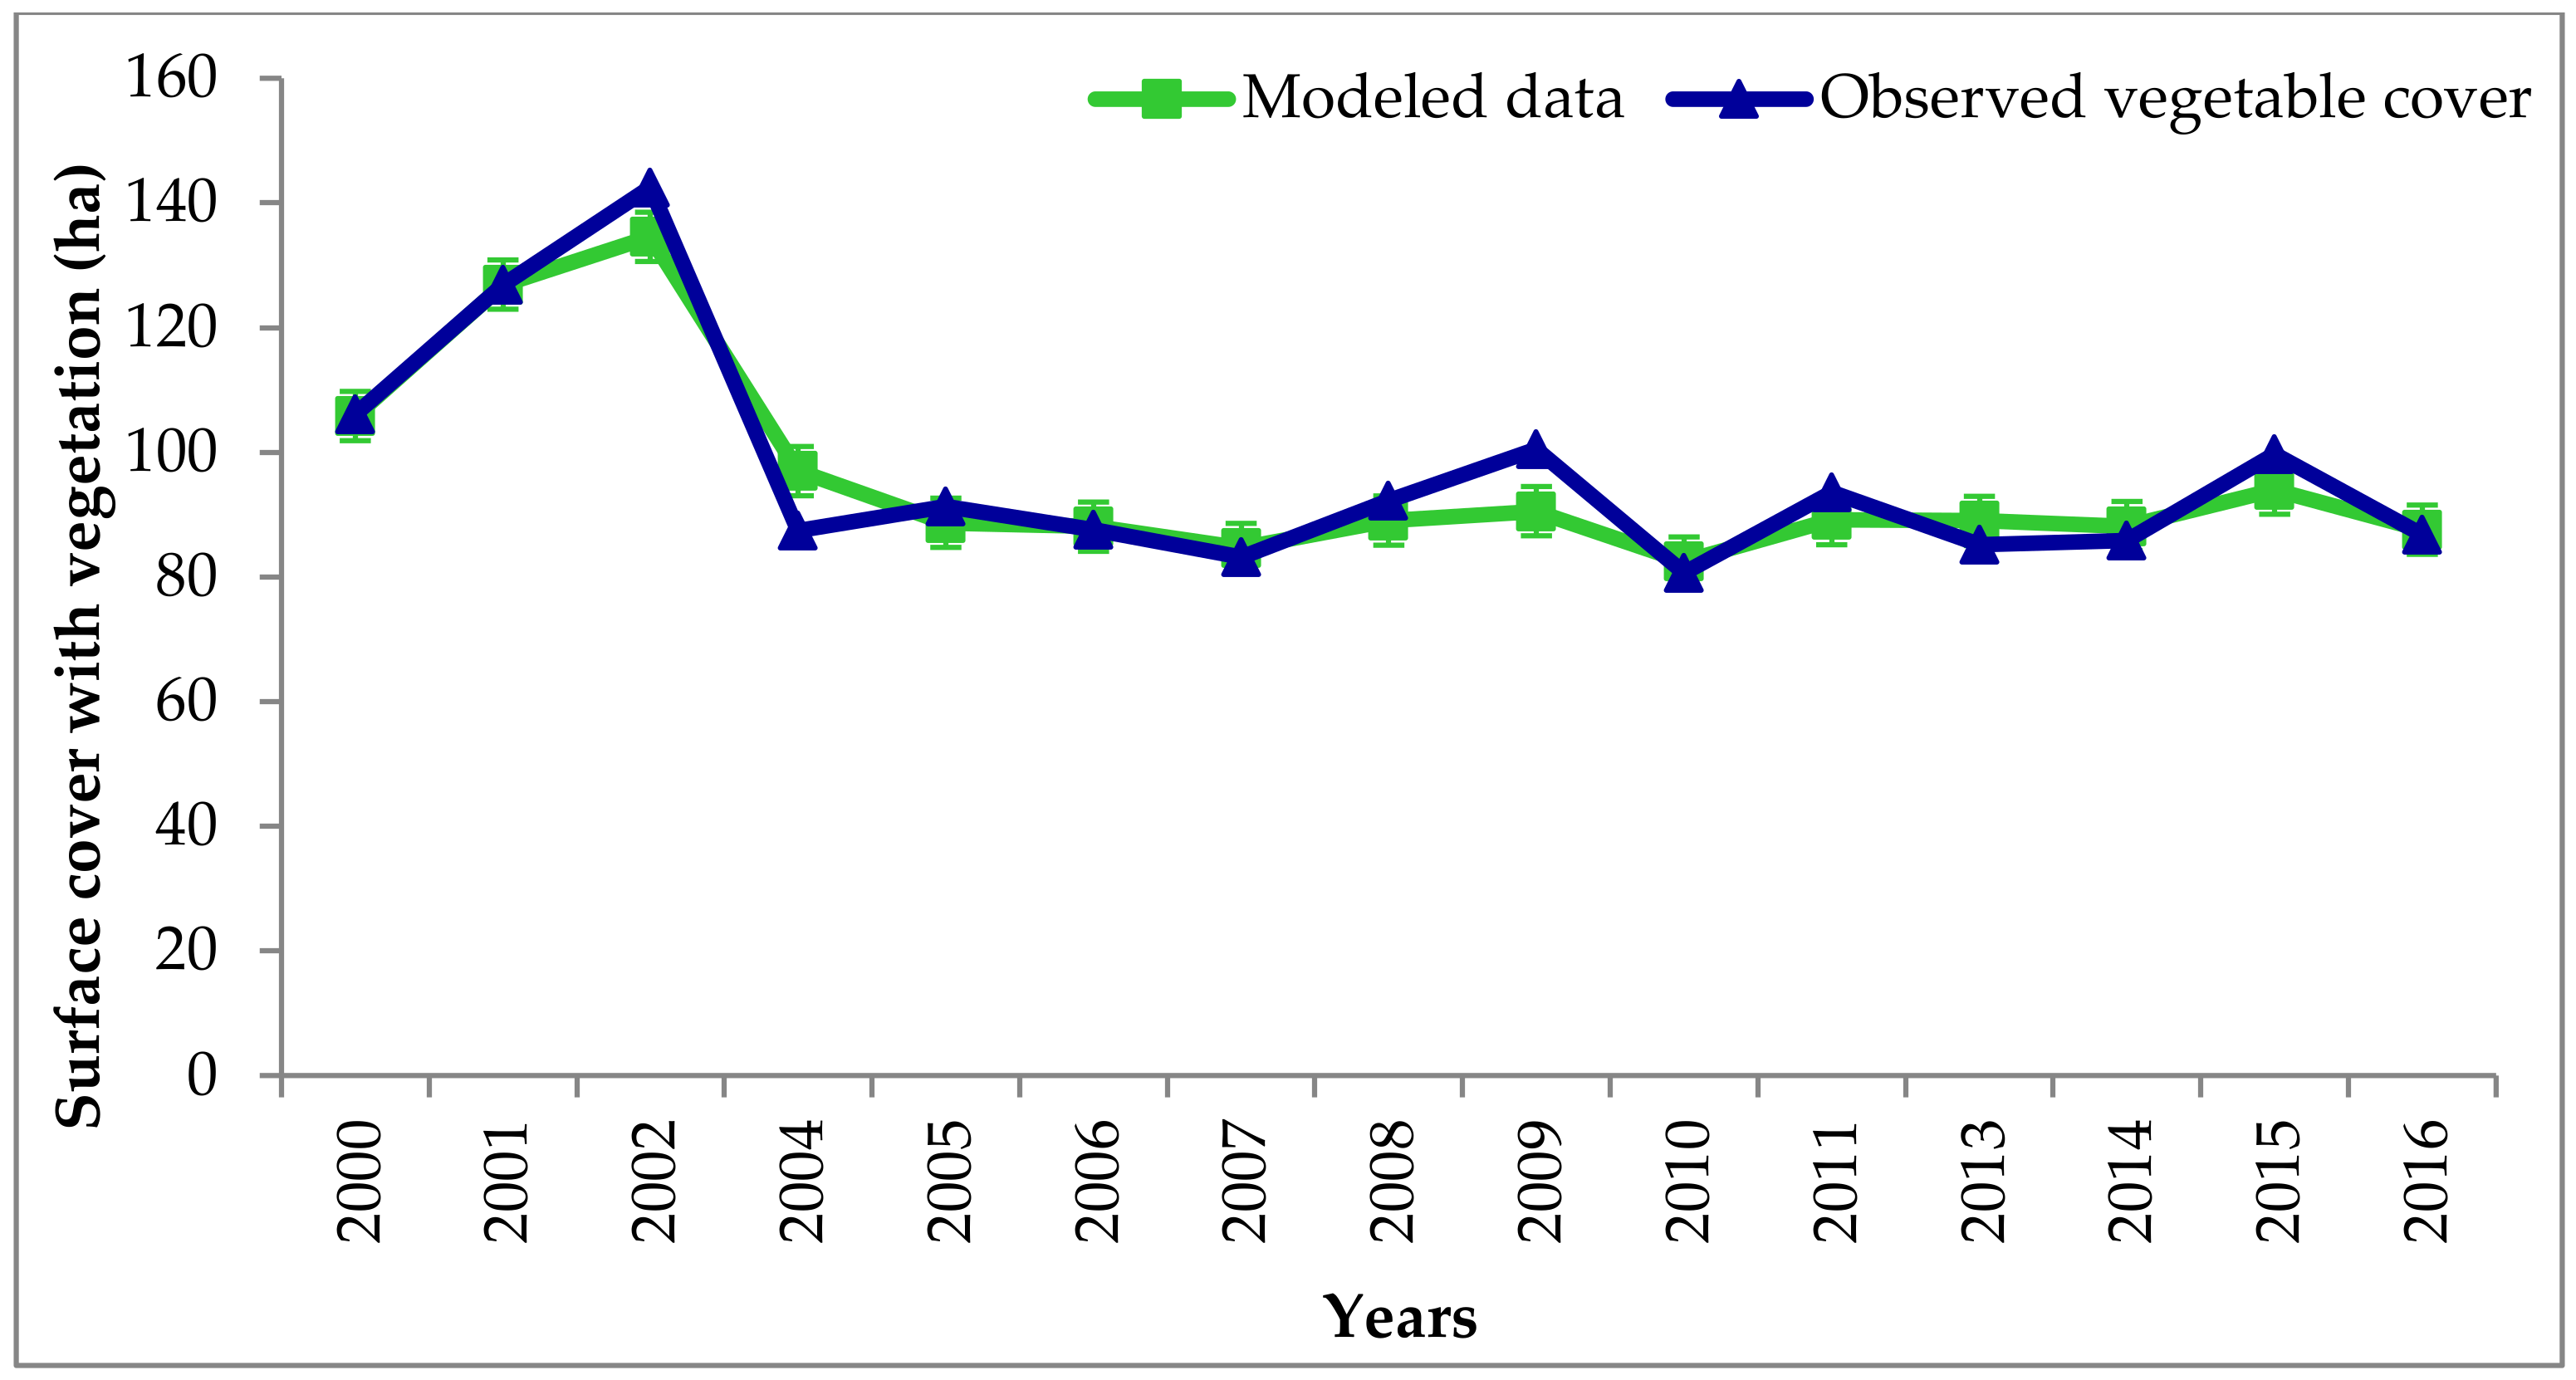
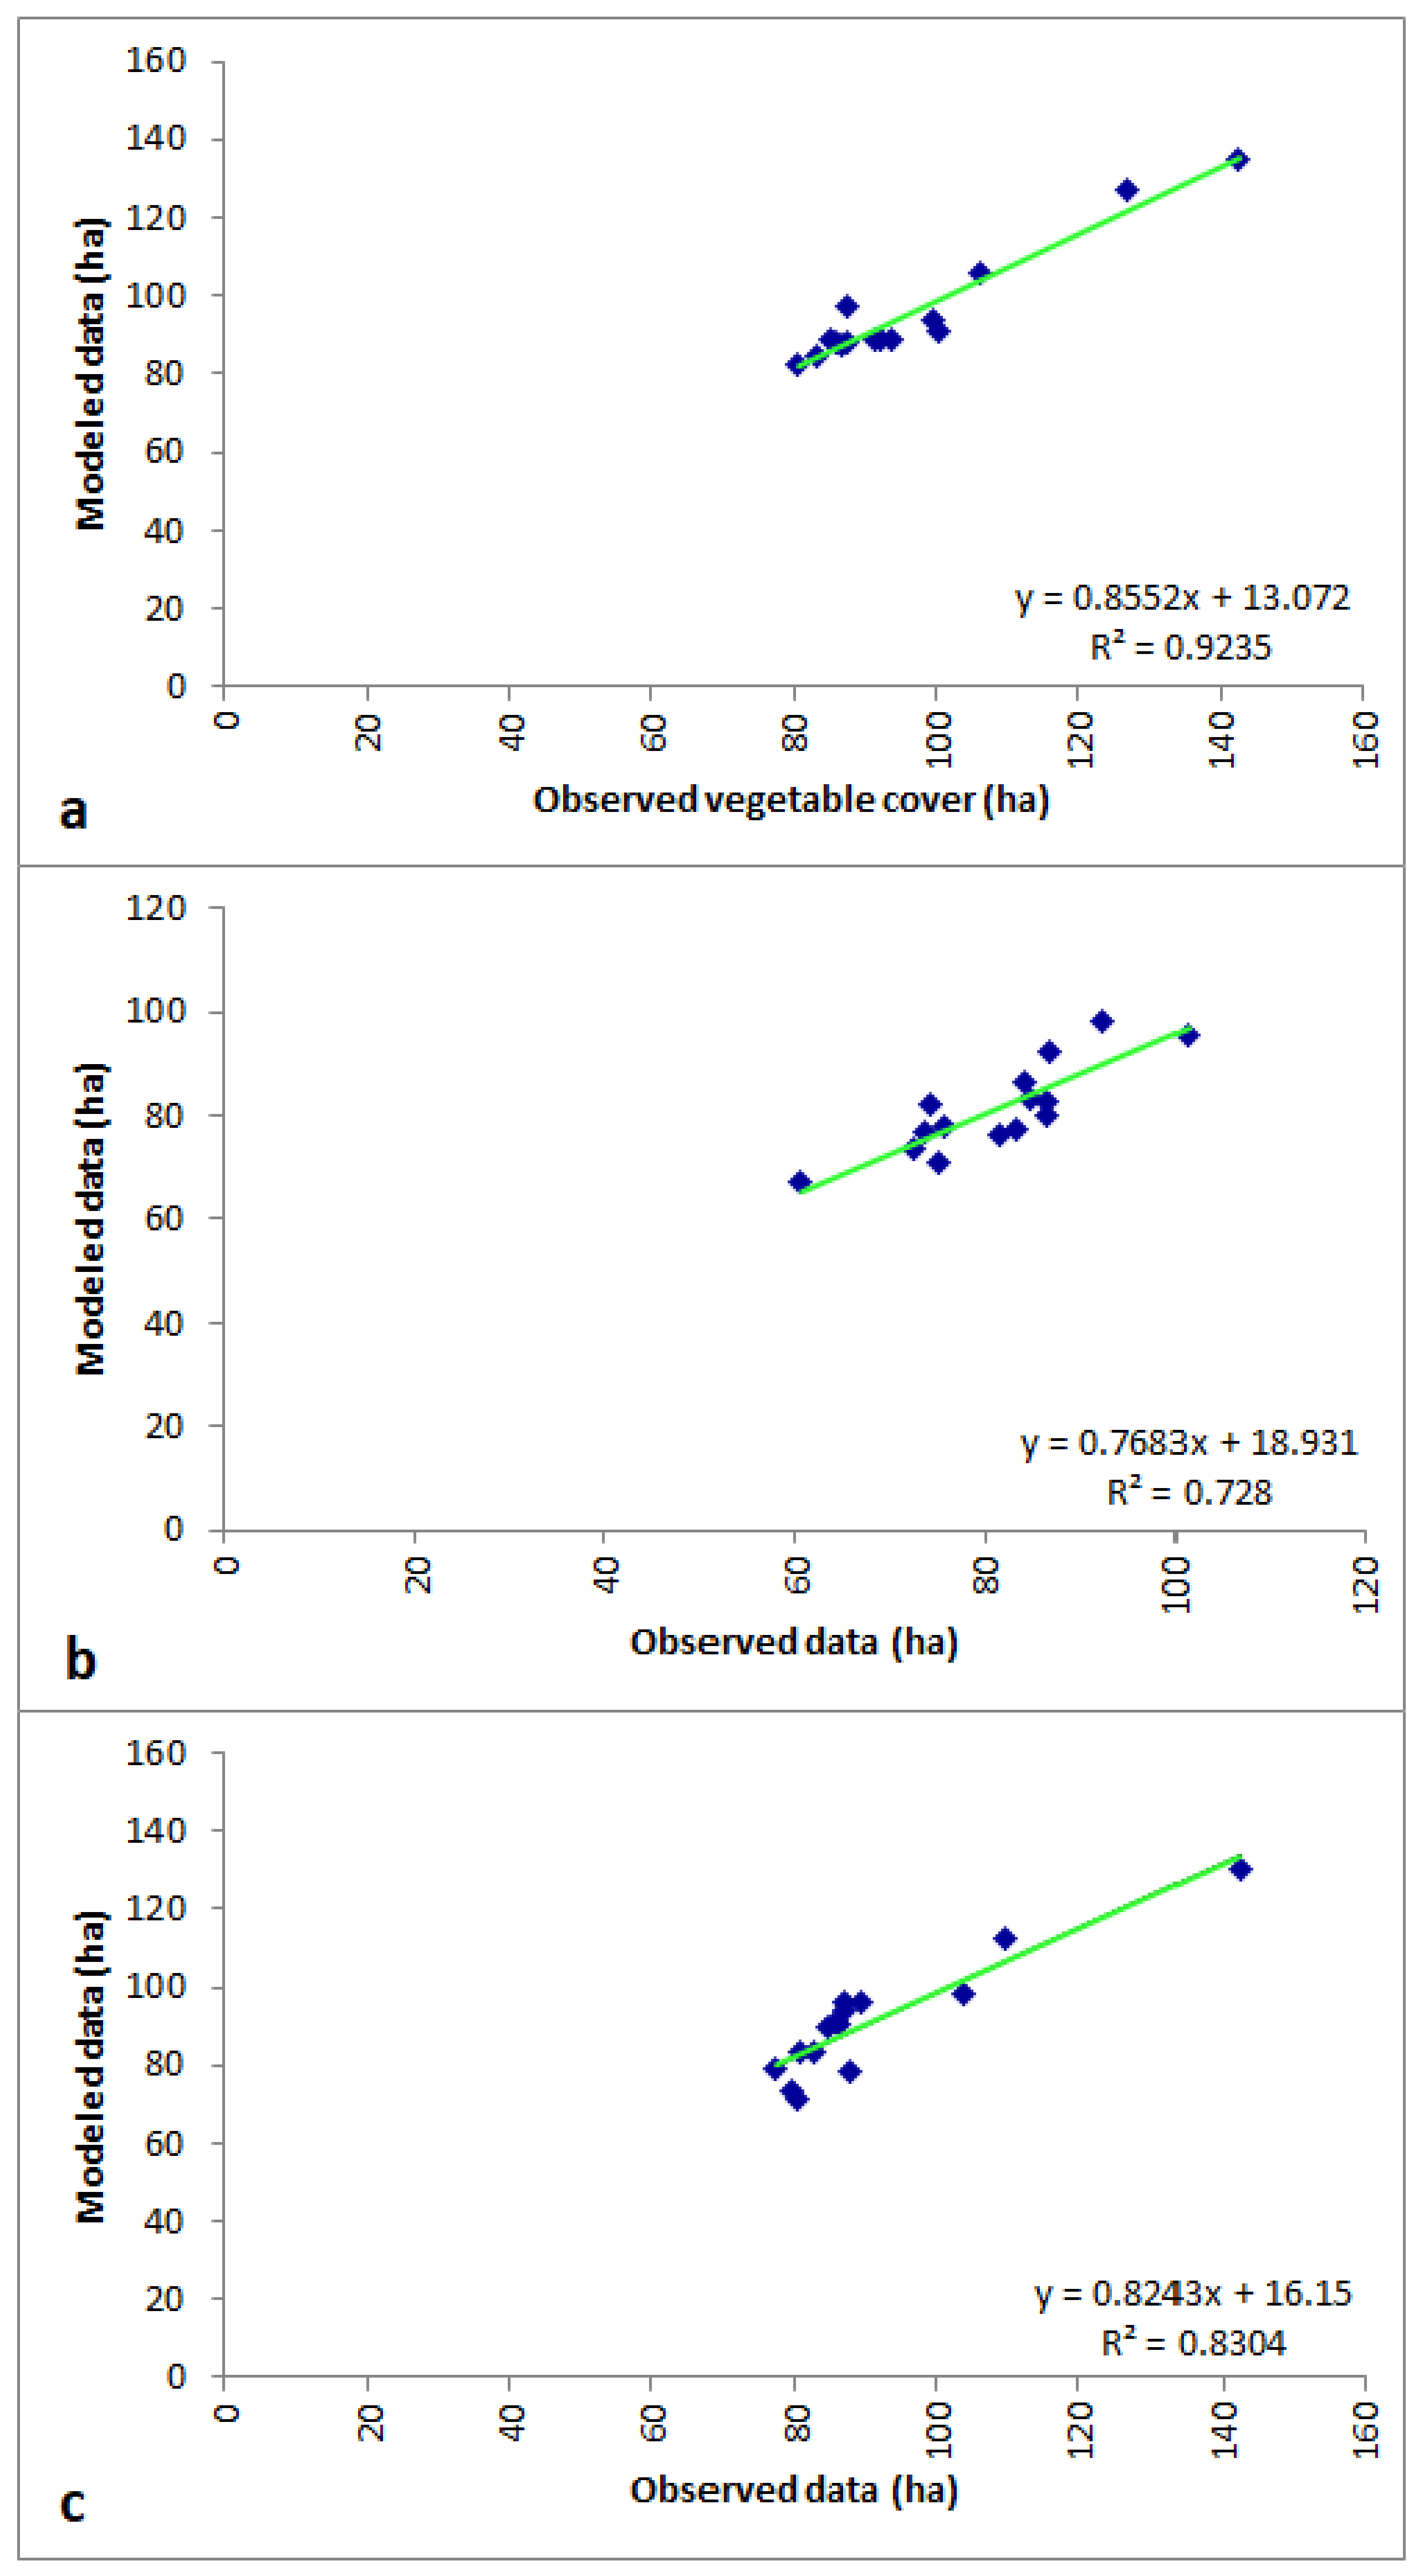
3.2.4. Model Validation
4. Discussion
5. Conclusions
Author Contributions
Conflicts of Interest
References
- Otto, M.; Scherer, D.; Richters, J. Hydrological differentiation and spatial distribution of high altitude wetlands in a semi-arid Andean region derived from satellite data. Hydrol. Earth Syst. Sci. 2011, 15, 1713–1727. [Google Scholar] [CrossRef] [Green Version]
- Fowler, D.N.; King, S.L.; Weindorf, D.C. Evaluating abiotic influences on soil salinity of inland managed wetlands and agricultural croplands in a semi-arid environment. Wetlands 2014, 34, 1229–1239. [Google Scholar] [CrossRef]
- Möller, P.; Muñoz-Pedreros, A. Legal protection assessment of different inland wetlands in Chile. Rev. Chil. Hist. Nat. 2014, 87, 23. [Google Scholar] [CrossRef]
- Dirección General de Aguas (DGA). Actualización Delimitación de los Acuíferos que Alimentan Vegas y Bofedales, Región de Antofagasta; Ministerio de Obras Públicas, Gobierno de Chile: Santiago, Chile, 2001; pp. 1–109. (In Spanish)
- Barducci, A.; Guzzi, D.; Marcoionni, P.; Pippi, I. Aerospace wetland monitoring by hyperspectral imaging sensors: A case study in the coastal zone of San Rossore Natural Park. J. Environ. Manag. 2009, 90, 2278–2286. [Google Scholar] [CrossRef]
- Grobicki, A.; Chalmers, C.; Jennings, E.; Jones, T.; Peck, D. An Introduction to the Convention on Wetlands (previously The Ramsar Convention Manual), 5th ed.; Ramsar Convention Secretary: Gland, Switzerland, 2016; pp. 8–63. [Google Scholar]
- Ellenberg, H. Vegetation Ecology of Central Europe, 4th ed.; Cambridge University Press: Cambridge, UK, 2009; p. 731. [Google Scholar]
- Anderson, M.; Low, R.; Foot, S. Sustainable groundwater in arid, high Andean basins. In Sustainable Groundwater Development; Hiscock, K.M., Rivett, M.O., Davison, R.M., Eds.; The Geological Society of London: London, UK, 2002; pp. 133–144. [Google Scholar]
- Centro de Ecología Aplicada (CEA). Plan de Alerta Temprana del Acuífero Monturaqui-Negrillar-Tilopozo; Minera Escondida: Santiago, Chile, 2015; p. 673. (In Spanish) [Google Scholar]
- Gaitanis, A.; Kalogeropoulos, K.; Detsis, V.; Chalkias, C. Monitoring 60 Years of Land Cover Change in the Marathon Area, Greece. Land 2015, 4, 337–354. [Google Scholar] [CrossRef] [Green Version]
- Hyandye, C.; Geoffrey, C.; Safari, J. GIS and Logit Regression Model Applications in Land Use/Land Cover Change and Distribution in Usangu Catchment. Am. J. Remote Sens. 2015, 3, 6–16. [Google Scholar] [CrossRef]
- Los, S.; Collatz, G.; Bounoua, L.; Sellers, P.; Tucker, C. Global interannual variations in sea surface temperature and land surface vegetation, air temperature, and precipitation. J. Clim. 2001, 14, 1535–1549. [Google Scholar] [CrossRef]
- Chahouki, M.; Chahouki, A. Predicting the distribution of plant species using logistic regression (Case study: Garizat rangelands of Yazd province). Desert 2010, 15, 151–158. [Google Scholar] [CrossRef]
- Beck, L.; Hutchinson, C.; Zaunderer, J. A comparison of greenness measures in two semi-arid grasslands. Clim. Chang. 1990, 17, 287–303. [Google Scholar] [CrossRef]
- Kennedy, P.J. Monitoring the phenology of Tunisian grazing lands. Int. J. Remote Sens. 1989, 10, 835–845. [Google Scholar] [CrossRef]
- Du Plessis, W. Linear regression relationships between NDVI, vegetation and rainfall in Etosha National Park, Namibia. J. Arid Environ. 1999, 42, 235–260. [Google Scholar] [CrossRef]
- Mwita, E.; Menz, G.; Misana, S.; Becker, M.; Kisanga, D.; Boehme, B. Mapping small wetlands of Kenya and Tanzania using remote sensing techniques. Int. J. Appl. Earth Obs. Geoinf. 2013, 21, 173–183. [Google Scholar] [CrossRef]
- Dong, Z.; Wang, Z.; Liu, D.; Song, K.; Li, L.; Jia, M.; Ding, Z. Mapping Wetland Areas Using Landsat-Derived NDVI and LSWI: A Case Study of West Songnen Plain, Northeast China. J. Indian Soc. Remote Sens. 2014, 42, 569–576. [Google Scholar] [CrossRef]
- Qu, B.; Zhu, W.; Jia, S.; Lv, A. Spatio-Temporal Changes in Vegetation Activity and Its Driving Factors during the Growing Season in China from 1982 to 2011. Remote Sens. 2015, 7, 13729–13752. [Google Scholar] [CrossRef] [Green Version]
- Li, D.; Lu, D.; Wu, M.; Shao, X.; Wei, J. Examining land cover and greenness dynamics in Hangzhou Bay in 1985–2016 using Landsat time-series data. Remote Sens. 2018, 10, 32. [Google Scholar] [CrossRef]
- Pan, F.; Xie, J.; Lin, J.; Zhao, T.; Ji, Y.; Hu, Q.; Pan, X.; Wang, C.; Xi, X. Evaluation of climate change impacts on wetland vegetation in the Dunhuang Yangguan National Nature Reserve in Northwest China using Landsat derived NDVI. Remote Sens. 2018, 10, 735. [Google Scholar] [CrossRef]
- Wilson, N.R.; Normal, L.M. Analysis of vegetation recovery surrounding a restored wetland using the normalized difference infrared index (NDII) and normalized difference vegetation index (NDVI). Int. J. Remote Sens. 2018, 39, 3243–3274. [Google Scholar] [CrossRef] [Green Version]
- Guo, M.; Li, J.; Shen, C.; Xu, J.; Wu, L. A review of wetland remote sensing. Sensors 2017, 17, 777. [Google Scholar] [CrossRef]
- Amler, E.; Schmidt, M.; Menz, G. Definitios and mapping of East African Wetlands: A review. Remote Sens. 2015, 7, 5256–5282. [Google Scholar] [CrossRef]
- Li, S.-N.; Wang, G.-X.; Deng, W.; Hu, Y.-M.; Hu, W.-W. Influence of hydrology process on wetland landscape pattern: A case study in the Yellow River Delta. Ecol. Eng. 2009, 35, 1719–1726. [Google Scholar] [CrossRef]
- Verbesselt, J.; Hyndman, R.; Newnham, G.; Culvenor, D. Detecting trend and seasonal changes in satellite image time series. Remote Sens. Environ. 2010, 114, 106–115. [Google Scholar] [CrossRef]
- Keddy, P. Freshwater Marshes. In Ecosystem Ecology; Jorgensen, S., Ed.; Elsevier B.V.: Amsterdam, The Netherlands, 2008. [Google Scholar]
- Zedler, B.; Bonin, C.; Larkin, D.; Varty, A. Salt Marshes. In Ecosystem Ecology; Jorgensen, S., Ed.; Elsevier B.V.: Amsterdam, The Netherlands, 2008. [Google Scholar]
- Ruthsatz, B. Vegetation und OkologietropischerHochge—Birgsmoore in den Anden Nord-Chiles. Phytocoenologia 1995, 25, 185–234. [Google Scholar] [CrossRef]
- Ahumada, M.; Faúndez, G. Guía Descriptiva de los Sistemas Vegetacionales Azonales hídricos Terrestres de la Ecorregión Altiplánica (SVAHT); Servicio Agrícola y Ganadero, Ministerio de Agricultura de Chile: Santiago, Chile, 2009; p. 118. (In Spanish)
- Centro de Ecología Aplicada (CEA). Diagnóstico y Gestión Ambiental Integrada de Humedales Altoandinos; Ministerio de Medio Ambiente: Santiago, Chile, 2015; p. 408. (In Spanish)
- Chander, G.; Markham, B.; Helder, D. Summary of current radiometric calibration coefficients for Landsat MSS, TM, ETM+, and EO-1 ALI sensor. Remote Sens. Envirom. 2009, 113, 893–903. [Google Scholar] [CrossRef]
- Chavez, P. Image-based atmospheric corrections-revisited and improved. Photogramm. Eng. Remote Sens. 1996, 62, 1025–1036. [Google Scholar]
- Chuvieco, E. Teledetección Ambiental; Editorial Ariel S.A.: Barcelona, Spain, 2008; p. 594. (In Spanish) [Google Scholar]
- Domínguez-Beisiegel, M.; Castañeda, C.; Mougenot, B.; Herrero, J. Analysis and mapping of the spectral characteristics of fractional green cover in saline wetlands (NE Spain) using field and remote sensing data. Remote Sens. 2016, 8, 590. [Google Scholar] [CrossRef]
- Castro, C.; Montaña, Á.; Pattillo, C.; Zúñiga, Á. Detección del área con desierto florido en el territorio del Mar de Dunas de Atacama, mediante percepción remota. Rev. Geogr. Norte Gd. 2014, 57, 103–121. [Google Scholar] [CrossRef]
- Montalva, D.; Monti, C.; Montenegro, N.; Román-Figueroa, C.; Paneque, M. Evolución de la Deforestación/Devegetación en el norte grande de Chile. In Proceedings of the XV Conferencia Iberoamericana de Sistemas de Información Geográfica, Valparaíso, Chile, 9–11 September 2015; pp. 37–48. [Google Scholar]
- Gómez, L.; Medina, M. Guía de Métodos Estadísticos en Climatología, 1st ed.; Universidad Nacional Autónoma de México: Ciudad de México, Mexico, 2012; p. 94. (In Spanish) [Google Scholar]
- Hargreaves, G.; Samani, Z. Reference crop evapotranspiration from temperature. Appl. Eng. Agric. 1985, 1, 96–99. [Google Scholar] [CrossRef]
- Samani, Z. Estimating solar radiation and evapotranspiration using minimum climatological data. J. Irrig. Drain. Eng. 2000, 126, 96–99. [Google Scholar] [CrossRef]
- Di Rienzo, J.; Casanoves, F.; González, L.; Tablada, E.; Díaz, M.; Robledo, C.; Balzarini, M. Estadística para las Ciencias Agropecuarias, 3rd ed.; Editorial Brujas: Córdoba, Argentina, 2005; p. 329. (In Spanish) [Google Scholar]
- Centro de Información de Recursos Naturales (CIREN). Sistema de Información Territorial de Humedales Altoandinos. Suelos II Región de Antofagasta; Centro de Información de Recursos Naturales: Santiago, Chile, 2016; p. 10. (In Spanish) [Google Scholar]
- Vyacheslav, Y.; Rudenko, A.; Bohuslavsky, V.; Bublias, M. Chernobyl-Born radionuclides: Groundwater protectability whit respect to preferential flow zones. In Applied Hydrogeophysics; Vereecken, H., Binley, A., Cassiani, G., Revil, A., Titov, K., Eds.; Springer: Dordrecht, The Netherlands, 2006; pp. 341–376. [Google Scholar]
- Risacher, F.; Alonso, H. Geoquímica del Salar de Atacama, parte 2: Evolución de aguas. Rev. Geol. Chile 1996, 2, 123–134. [Google Scholar]
- Dirección General de Aguas (DGA). Diagnóstico y Sistematización de Información de Planes de Alerta Temprana Vigentes con Condicionamiento de Derechos; Ministerio de Obras Públicas, Gobierno de Chile: Santiago, Chile, 2014; p. 534. (In Spanish)
- Wantzen, K.; Junk, W. Riparian wetlands. In Ecosystem Ecology; Jorgensen, S., Ed.; Elsevier B.V.: Amsterdam, The Netherlands, 2008; pp. 342–351. [Google Scholar]
- Yin, L.; Zhou, Y.; Huang, J.; Wenninger, J.; Zhang, E.; Hou, G.; Dong, J. Interaction between groundwater and trees in an arid site: Potential impacts of climate variation and groundwater abstraction on trees. J. Hydrol. 2015, 528, 435–448. [Google Scholar] [CrossRef]
- León, A.; Soto, J.; Seguel, O.; Pérez, J.; Osses, D.; Leiva, N.; Zerega, L. Cobertura vegetal y erosión evitada en vegas altoandinas, cuenca del río Yeso. In Procesos de Erosión y Sedimentación en Cauces y Cuencas; Balocchi, F., Chreties, C., Eds.; Programa Hidrológico Internacional (PHI)-UNESCO: Montevideo, Uruguay, 2016; Volume 3, pp. 97–117. (In Spanish) [Google Scholar]
- Langley, J.A.; Megonigal, J.P. Field-based radiometry to estimate tidal marsh plant growth in response to elevated CO2 and nitrogen addition. Wetlands 2002, 32, 571–578. [Google Scholar] [CrossRef]
- Kearney, M.S.; Stutzer, D.; Turppie, K.; Stevenson, J.C. The effects of tidal inundation on the reflectance characteristics of coastal marsh vegetation. J. Coast. Res. 2009, 25, 1177–1186. [Google Scholar] [CrossRef]
- Tian, F.; Brandt, M.; Liu, Y.; Verger, A.; Tagesson, T.; Diouf, A.A.; Rasmussen, A.; Mbow, C.; Wang, J.; Fensholt, R. Remote sensing of vegetation dynamics in drylands: Evaluating vegetation optical depth (VOP) using AVHRR NDVI and in situ green biomass data over West African Savel. Remote Sens. Environ. 2016, 117, 265–276. [Google Scholar] [CrossRef]
- Munyati, C.; Ratshibvumo, T. Characterizing vegetation cover in relation to land use in the Inkomati catchment, South Africa, using Landsat imagery. Area 2011, 43, 189–201. [Google Scholar] [CrossRef]
- Weiss, J.L.; Gutzler, D.S.; Coonrod, J.E.A.; Dahm, C.N. Long-term vegetation monitoring with NDVI in a diverse semi-arid setting, central New Mexico, USA. J. Arid Environ. 2004, 58, 249–272. [Google Scholar] [CrossRef]
- Fensholt, R.; Sandholt, I.; Rasmussen, M.S. Evaluation of MODIS LAI, fPAR and the relation between fAPAR and NDVI in a semi-arid environment using in situ measurements. Remote Sens. Environ. 2004, 91, 490–507. [Google Scholar] [CrossRef]
- Sorrell, B.; Tanner, C.; Brix, H. Regression analysis of growth responses to water depth in three wetland plant species. AoB Plants 2012, 43, 1–14. [Google Scholar] [CrossRef]
- Abaurrea, M. Comparación de Índices de Vegetación en Zona Semiárida de Navarra; Universidad Pública de Navarra: Navarra, Spain, 2013; p. 34. (In Spanish) [Google Scholar]
- Purevdorj, T.; Tateishi, R.; Ishiyama, T.; Honda, Y. Relationships between percent vegetation cover and vegetation indices. Int. J. Remote Sens. 1998, 19, 3519–3535. [Google Scholar] [CrossRef]
- Navarro, J.; Meléndez-Pastor, I.; Gómez, I.; Almendro, M. Segmentación de imágenes mediante el empleo de índices de vegetación para la estimación de parámetros edáficos. In Proceedings of the XII Congreso Nacional de Tecnologías de la Información, Universidad de Granada, Granada, Spain, 19–23 September 2006; pp. 1093–1105. [Google Scholar]
- Nucci, A.; Angiolini, C.; Landi, M.; Bacchetta, G. Regional and local patterns of riparian flora: Comparison between insular and continental mediterranean rivers. Ecoscience 2012, 19, 213–224. [Google Scholar] [CrossRef]
- Nieves, A.; Domínguez, F. Probabilidad y Estadística Para Ingeniería. Un Enfoque Moderno; McGraw Hill Interamericana: Ciudad de México, Mexico, 2010; p. 547. (In Spanish) [Google Scholar]
- Narváez, H.; Bustamante, I.; Combatt, E. Estimación de la salinidad en suelos del delta del río Sinú en Colombia, mediante modelos de regresión lineal múltiple. IDESIA 2014, 32, 81–90. [Google Scholar] [CrossRef]
- Pliscoff, P.; Zanetta, N.; Hepp, J.; Machuca, J. Efectos sobre la flora y vegetación del evento de precipitación extreme de agosto de 2015 en Alto Patache, Desierto de Atacama, Chile. Rev. Geogr. Norte Gd. 2017, 68, 91–103. [Google Scholar] [CrossRef]
- Cui, X.; Gibbes, C.; Southworth, J.; Waylen, P. Using remote sensing to quantify vegetation change and ecological resilience in a semi-arid system. Land 2013, 2, 108–130. [Google Scholar] [CrossRef]
- Liu, D.; Cao, C.; Chen, W.; Ni, X.; Tian, R.; Xing, X. Monitoring and predicting the degradation of a semi-arid wetland due to climate change and water abstraction in the Ordos Larus relictus National Nature Reserve, China. Geomat. Nat. Hazard Risk 2017, 8, 367–383. [Google Scholar] [CrossRef]
- Beuel, S.; Alvarez, M.; Amler, E.; Behn, K.; Kotze, D.; Kreye, C.; Leemhuis, C.; Wagner, K.; Willy, D.K.; Ziegler, S.; Becker, M. A rapid assessment of anthropogenic disturbances in East African wetlands. Ecol. Indic. 2016, 67, 684–691. [Google Scholar] [CrossRef]
- Reis, V.; Hermoso, V.; Hamilton, S.K.; Ward, D.; Fluet-Chouinard, E.; Lehner, B.; Linke, S. A global assessment of inland wetland conservation status. Bioscience 2017, 67, 523–533. [Google Scholar] [CrossRef]
- Espinoza, P.; Romero, H. Variabilidad y cambios climáticos observados y esperados en el Altiplano del norte de Chile. Rev. Geogr. Norte Gd. 2015, 62, 169–183. [Google Scholar] [CrossRef]


| ID | Date | Discharge Name | Cloud | Sensor | ID | Date | Discharge Name | Cloud | Sensor |
|---|---|---|---|---|---|---|---|---|---|
| 1 | 30 March 1985 | LT52330761985089AAA03 | 10% | L5 TM | 31 | 08 April 2000 | LT52330762000099CUB00 | 12% | L5 TM |
| 2 | 05 August 1985 | LT52330761985217XXX04 | 0% | L5 TM | 32 | 23 September 2000 | LT52330762000259CUB02 | 18% | L5 TM |
| 3 | 02 April 1986 | LT52330761986092AAA08 | 0% | L5 TM | 33 | 10 March 2001 | LT52330762001069COA00 | 35% | L5 TM |
| 4 | 09 September 1986 | LT52330761986252AAA03 | 0% | L5 TM | 34 | 18 September 2001 | LT52330762001261CUB00 | 19% | L5 TM |
| 5 | 04 March 1987 | LT52330761987063AAA07 | 0% | L5 TM | 35 | 29 March 2002 | LT52330762002088COA00 | 0% | L5 TM |
| 6 | 30 October 1987 | LT52330761987303CUB00 | 1% | L5 TM | 36 | 08 September 2003 | LT52330762003251CUB00 | 31% | L5 TM |
| 7 | 06 March 1988 | LT52330761988066CUB00 | 0% | L5 TM | 37 | 18 March 2004 | LT52330762004078CUB00 | 0% | L5 TM |
| 8 | 30 September 1988 | LT52330761988274CUB00 | 0% | L5 TM | 38 | 26 September 2004 | LT52330762004254CUB00 | 9% | L5 TM |
| 9 | 25 March 1989 | LT52330761989084CUB00 | 35% | L5 TM | 39 | 05 March 2005 | LT52330762005064COA00 | 7% | L5 TM |
| 10 | 17 September 1989 | LT52330761989260CUB00 | 18% | L5 TM | 40 | 29 September 2005 | LT52330762005272CUB00 | 29% | L5 TM |
| 11 | 28 March 1990 | LT52330761990087CUB00 | 23% | L5 TM | 41 | 08 March 2006 | LT52330762006067CUB02 | 0% | L5 TM |
| 12 | 20 September 1990 | LT52330761990263CUB00 | 20% | L5 TM | 42 | 16 September 2006 | LT52330762006259COA00 | 20% | L5 TM |
| 13 | 15 March 1991 | LT52330761991074CUB00 | 18% | L5 TM | 43 | 11 March 2007 | LT52330762007070CUB00 | 5% | L5 TM |
| 14 | 23 September 1991 | LT52330761991266CUB00 | 18% | L5 TM | 44 | 19 September 2007 | LT52330762007262CUB00 | 19% | L5 TM |
| 15 | 01 March 1992 | LT52330761992061CUB00 | 0% | L5 TM | 45 | 13 March 2008 | LT52330762008073CUB00 | 10% | L5 TM |
| 16 | 09 September 1992 | LT52330761992253CUB00 | 8% | L5 TM | 46 | 21 September 2008 | LT52330762008265CUB00 | 15% | L5 TM |
| 17 | 20 March 1993 | LT52330761993079CUB00 | 29% | L5 TM | 47 | 16 March 2009 | LT52330762009075COA02 | 1% | L5 TM |
| 18 | 28 September 1993 | LT52330761993271CUB00 | 30% | L5 TM | 48 | 24 September 2009 | LT52330762009267COA02 | 14% | L5 TM |
| 19 | 03 February 1994 | LT52330761994034CUB00 | 28% | L5 TM | 49 | 19 March 2010 | LT52330762010078CUB00 | 6% | L5 TM |
| 20 | 17 October 1994 | LT52330761994290CUB00 | 19% | L5 TM | 50 | 11 September 2010 | LT52330762010254CUB00 | 18% | L5 TM |
| 21 | 26 March 1995 | LT52330761995085CUB00 | 16% | L5 TM | 51 | 22 March 2011 | LT52330762011081CUB00 | 7% | L5 TM |
| 22 | 18 September 1995 | LT52330761995261CUB00 | 26% | L5 TM | 52 | 30 September 2011 | LT52330762011273CUB00 | 11% | L5 TM |
| 23 | 28 March 1996 | LT52330761996088CUB00 | 19% | L5 TM | 53 | 12 April 2013 | LC82330762013102LGN01 | 8% | L8 OLI |
| 24 | 20 September 1996 | LT52330761996264CUB02 | 20% | L5 TM | 54 | 19 September 2013 | LC82330762013262LGN00 | 5% | L8 OLI |
| 25 | 11 February 1997 | LT52330761997042CUB00 | 30% | L5 TM | 55 | 14 March 2014 | LC82330762014073LGN00 | 2% | L8 OLI |
| 26 | 07 September 1997 | LT52330761997250CUB01 | 19% | L5 TM | 56 | 22 September 2014 | LC82330762014265LGN00 | 3% | L8 OLI |
| 27 | 03 April 1998 | LT52330761998093COA00 | 19% | L5 TM | 57 | 17 March 2015 | LC82330762015076LGN00 | 3% | L8 OLI |
| 28 | 10 September 1998 | LT52330761998253COA02 | 18% | L5 TM | 58 | 25 September 2015 | LC82330762015268LGN00 | 3% | L8 OLI |
| 29 | 06 April 1999 | LT52330761999096CUB00 | 0% | L5 TM | 59 | 19 March 2016 | LC82330762016079LGN00 | 2% | L8 OLI |
| 30 | 29 September 1999 | LT52330761999272COA02 | 9% | L5 TM | 60 | 11 September 2016 | LC82330762016255LGN00 | 2% | L8 OLI |
| Year | Phreatic Level of Observation Points (Meters above Sea Level) (Piezometers = TPZ; Wells = TP) | |||||||
|---|---|---|---|---|---|---|---|---|
| TPZ2A | TPZ2B | TPZ2C | TPZ3 | TPZ4 | TPZ8 | TPZ12 | TP2 | |
| 2000 | −1.53 | −1.08 | −0.99 | −1.21 | −0.96 | −0.65 | −0.84 | −3.78 |
| 2001 | −1.44 | −1.04 | −0.91 | −1.15 | −0.88 | −0.61 | −0.8 | −3.79 |
| 2002 | −1.52 | −1.13 | −0.99 | −1.23 | −0.94 | −0.66 | −0.85 | −3.80 |
| 2004 | −1.53 | −1.17 | −1.02 | −1.22 | −0.91 | −0.66 | −0.85 | −3.84 |
| 2005 | −1.51 | −1.16 | −1.00 | −1.21 | −0.93 | −0.64 | −0.82 | −3.84 |
| 2006 | −1.58 | −1.19 | −1.04 | −1.24 | −0.99 | −0.65 | −0.85 | −3.86 |
| 2007 | −1.58 | −1.20 | −1.07 | −1.26 | −0.98 | −0.67 | −0.86 | −3.9 |
| 2008 | −1.55 | −1.16 | −1.00 | −1.23 | −0.95 | −0.64 | −0.84 | −3.93 |
| 2009 | −1.54 | −1.18 | −1.03 | −1.21 | −0.96 | −0.63 | −0.84 | −3.90 |
| 2010 | −1.57 | −1.20 | −1.06 | −1.25 | −1.04 | −0.66 | −0.87 | −3.92 |
| 2011 | −1.58 | −1.21 | −1.08 | −1.25 | −1.05 | −0.67 | −0.88 | −3.92 |
| 2013 | −1.55 | −1.18 | −1.05 | −1.21 | −0.97 | −0.64 | −0.85 | −3.94 |
| 2014 | −1.55 | −1.24 | −1.08 | −1.24 | −1.00 | −0.68 | −0.89 | −3.96 |
| 2015 | −1.52 | −1.19 | −1.05 | −1.21 | −0.92 | −0.68 | −0.87 | −3.96 |
| 2016 | −1.61 | −1.26 | −1.12 | −1.28 | −0.97 | −0.71 | −0.93 | −4.00 |
© 2019 by the authors. Licensee MDPI, Basel, Switzerland. This article is an open access article distributed under the terms and conditions of the Creative Commons Attribution (CC BY) license (http://creativecommons.org/licenses/by/4.0/).
Share and Cite
Soto, J.; Román-Figueroa, C.; Paneque, M. A Model for Estimating the Vegetation Cover in the High-Altitude Wetlands of the Andes (HAWA). Land 2019, 8, 20. https://doi.org/10.3390/land8010020
Soto J, Román-Figueroa C, Paneque M. A Model for Estimating the Vegetation Cover in the High-Altitude Wetlands of the Andes (HAWA). Land. 2019; 8(1):20. https://doi.org/10.3390/land8010020
Chicago/Turabian StyleSoto, Jorge, Celián Román-Figueroa, and Manuel Paneque. 2019. "A Model for Estimating the Vegetation Cover in the High-Altitude Wetlands of the Andes (HAWA)" Land 8, no. 1: 20. https://doi.org/10.3390/land8010020
APA StyleSoto, J., Román-Figueroa, C., & Paneque, M. (2019). A Model for Estimating the Vegetation Cover in the High-Altitude Wetlands of the Andes (HAWA). Land, 8(1), 20. https://doi.org/10.3390/land8010020