1. Introduction
Humans clear away natural vegetation and cultivate crops, in the process creating periodically non-vegetated areas that are prone to soil erosion [
1,
2,
3]. Globally, an estimated 1094 million ha of land are affected by water erosion, of which 751 million ha are severely affected [
4,
5]. Soil erosion is a current threat to the security of food production, as around 80% of global agricultural land is affected by moderate to severe erosion [
6] and as the rate of erosion greatly exceeds the rate of soil formation [
7]. Global demand for food has thus resulted in agriculture becoming an intense activity causing soil and water pollution, soil losses by erosion, and biodiversity loss [
8]. In order to reduce the adverse effects of soil erosion and maintain the fertility of agricultural land, proper management is needed. Land drainage, or combined irrigation and drainage, is an important measure to maintain or improve yield per unit of farmed land [
9]. The drainage structures constructed to achieve proper drainage of agricultural land include open ditches that are responsible for collecting surface and subsurface water, thus acting as erosion and flood control [
8]. Ditches are therefore vital for the sustainable functioning of agricultural land [
10].
Agricultural ditches degrade over time by the action of multiple processes, including rain, overland flow, bank erosion, and mass movement [
10]. In order to identify appropriate strategies to maintain agricultural ditch function, ditch degradation status needs to be assessed. Approaches such as Minnesota Agricultural Ditch Research Assessment (MADRAS) allow visual assessment of the status of drainage ditches [
11], but there is currently no method for assessing the likelihood of occurrence of the processes causing drainage ditch deterioration. Among these processes, soil mass movement and soil erosion affecting ditch banks are considered the most important. Previous work has shown that, at catchment level, the sediment contribution from bank-derived material is greater than previously thought [
12]. In an agricultural context, keeping drainage ditches properly functional means ensuring good hydraulic capacity. The hydraulic capacity of a ditch is strongly affected by soil erosion and bank instability, since the soil displaced from the banks will eventually be deposited in the main channel. Furthermore, soil removal from the banks as a consequence of erosion and mass movement modifies ditch geometry. A drainage ditch with modified geometry can display changes in its hydraulic behavior/performance that could potentially promote unintended instances of erosion/deposition either downstream or upstream. Therefore, knowledge of where erosion is more likely to occur and where ditch banks are more likely to become unstable is important when deciding where maintenance work should be targeted.
An important aspect of maintenance work on agricultural drainage ditches is that it usually involves channel cross-section modification (mainly by widening the cross-section and changing the slope of the channel banks) and removal of vegetation that might have grown in the channel and on the banks. Removal of vegetation from the channels is necessary to avoid obstructions to flow, but might have negative effects by leaving the banks less protected or more unstable. It is widely accepted that vegetation roots have an overall positive effect on soil stability [
13,
14,
15,
16]. For instance, it has been shown that vegetation roots increase the shear strength of soils with high moisture content [
14] and, depending on the root configuration in a channel, increase bank stability to mass movement [
17]. However, this increased stability of agricultural drainage ditches has not been assessed to date. Further, vegetation on the banks not only increases the shear strength of the soil, but is also likely to reduce the forces caused by water flow in the ditch [
18], decreasing its erosive force. This is particularly important because different drainage maintenance procedures affect the dynamics of vegetation present in the drainage ditch [
19]. Thus, depending on how vegetation establishes, different stabilizing effects will occur. In addition, changes in water content in the soil have an impact on the resistance to erosion, as demonstrated previously for agricultural watersheds [
20], but not specifically for agricultural drainage ditch banks. Thus, the practice of vegetation removal could possibly worsen or at least support active erosion and bank instabilities. To assess the impact of vegetation on the stability of ditch banks and their resistance to erosion, this study examined the effects of vegetation roots on ditch soil resistance to detachment, measured with a cohesive strength meter (CSM), and soil shear strength, measured with unsaturated direct shear tests. The effect of moisture condition on soil particle resistance to detachment under two soil moisture conditions was also assessed with the CSM. Finally, to assess the combined effect of bank slope modification and vegetation configuration, the factor of safety (FoS) for ditch banks with and without vegetation, with three different slopes and three root depths, was estimated following slope stability analysis using the finite element method.
3. Results and Discussion
Based on soil texture analysis, the soil was classified as silty clay loam [
35] for all five ditch segments studied. The results of soil particle size analysis are shown in
Table 2.
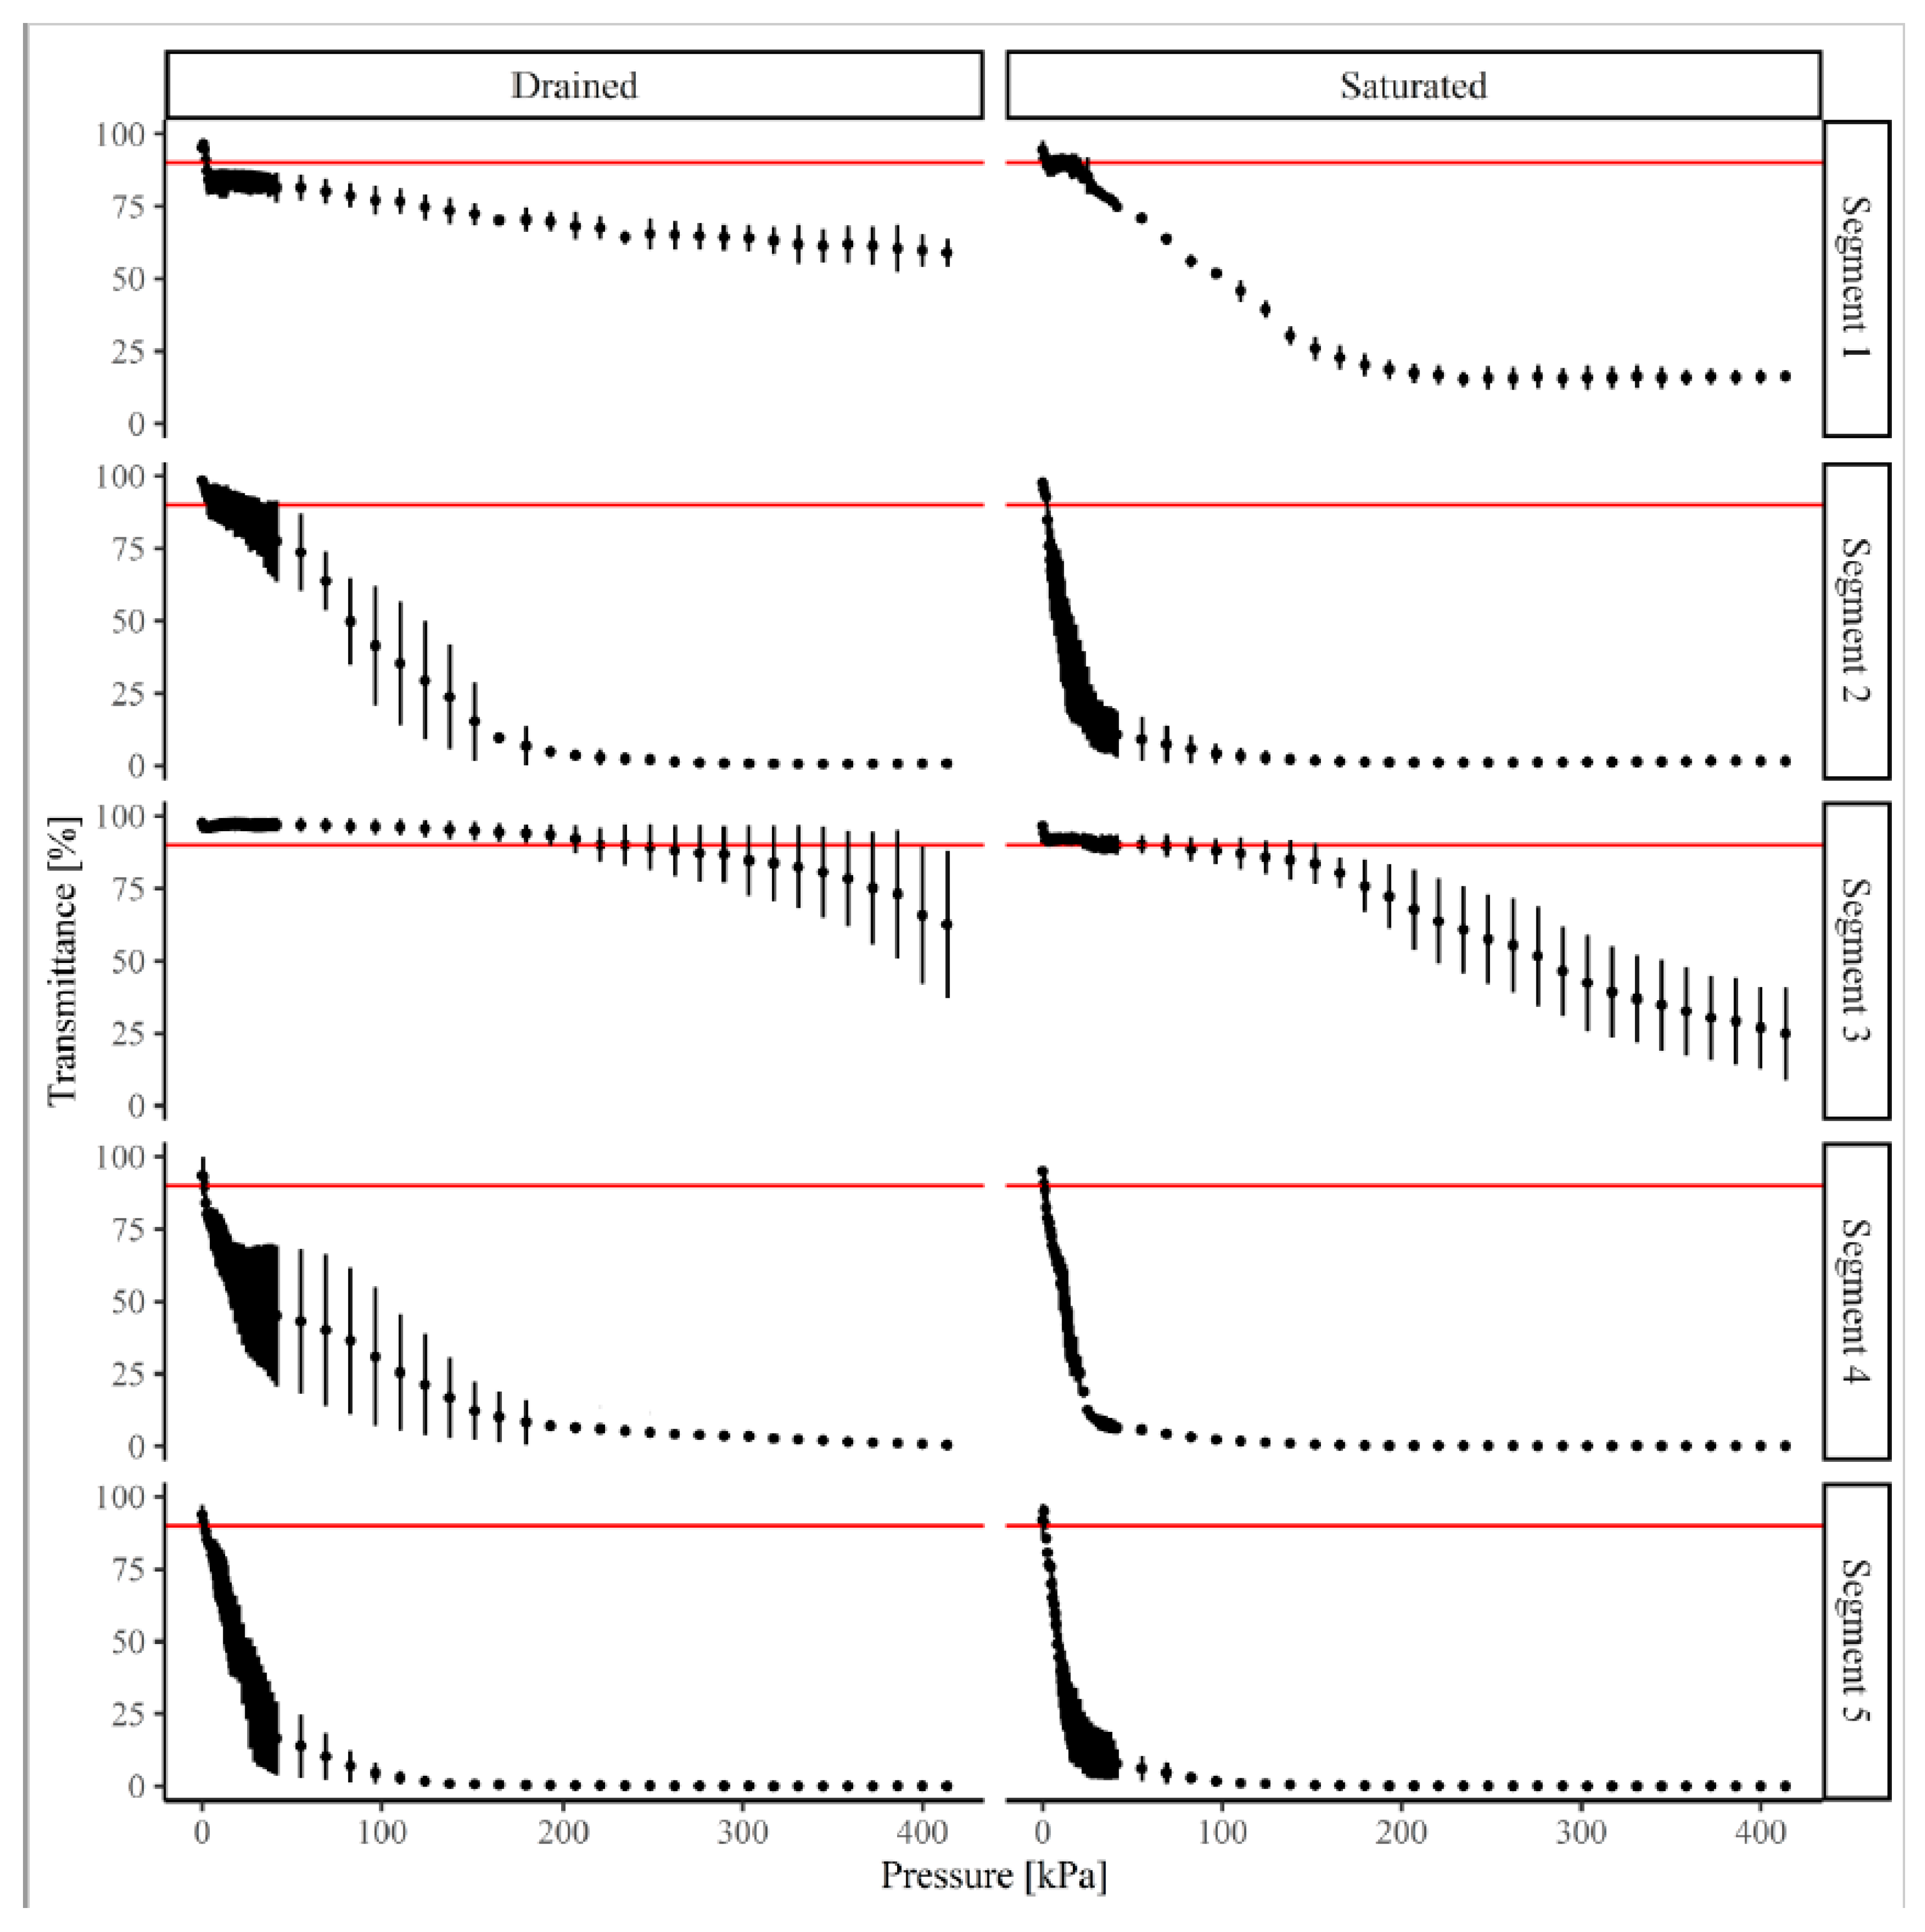
The CSM test results are shown in
Figure 5, where light transmittance values are plotted against P
i. The curves in the diagram show how scour progresses as more soil is detached and put into suspension with increasing P
i.
The shape of the curves in
Figure 5, with the exception of segment 1 (drained condition) and segment 3 (drained and saturated condition), is similar to that reported previously [
25,
26], with no straight line at the beginning of the curve, i.e., at low pressures. This might be an indication that the surface soil was loose and easily removed by the lower range of pressures applied.
From the curves in
Figure 5, the critical pressure for initiation of scour, P
i_cr, was estimated as the pressure at which the light transmittance value is below 90% [
27]. For this purpose, horizontal red lines were added at 90% light transmittance. The average P
i_cr values are shown in
Table 3.
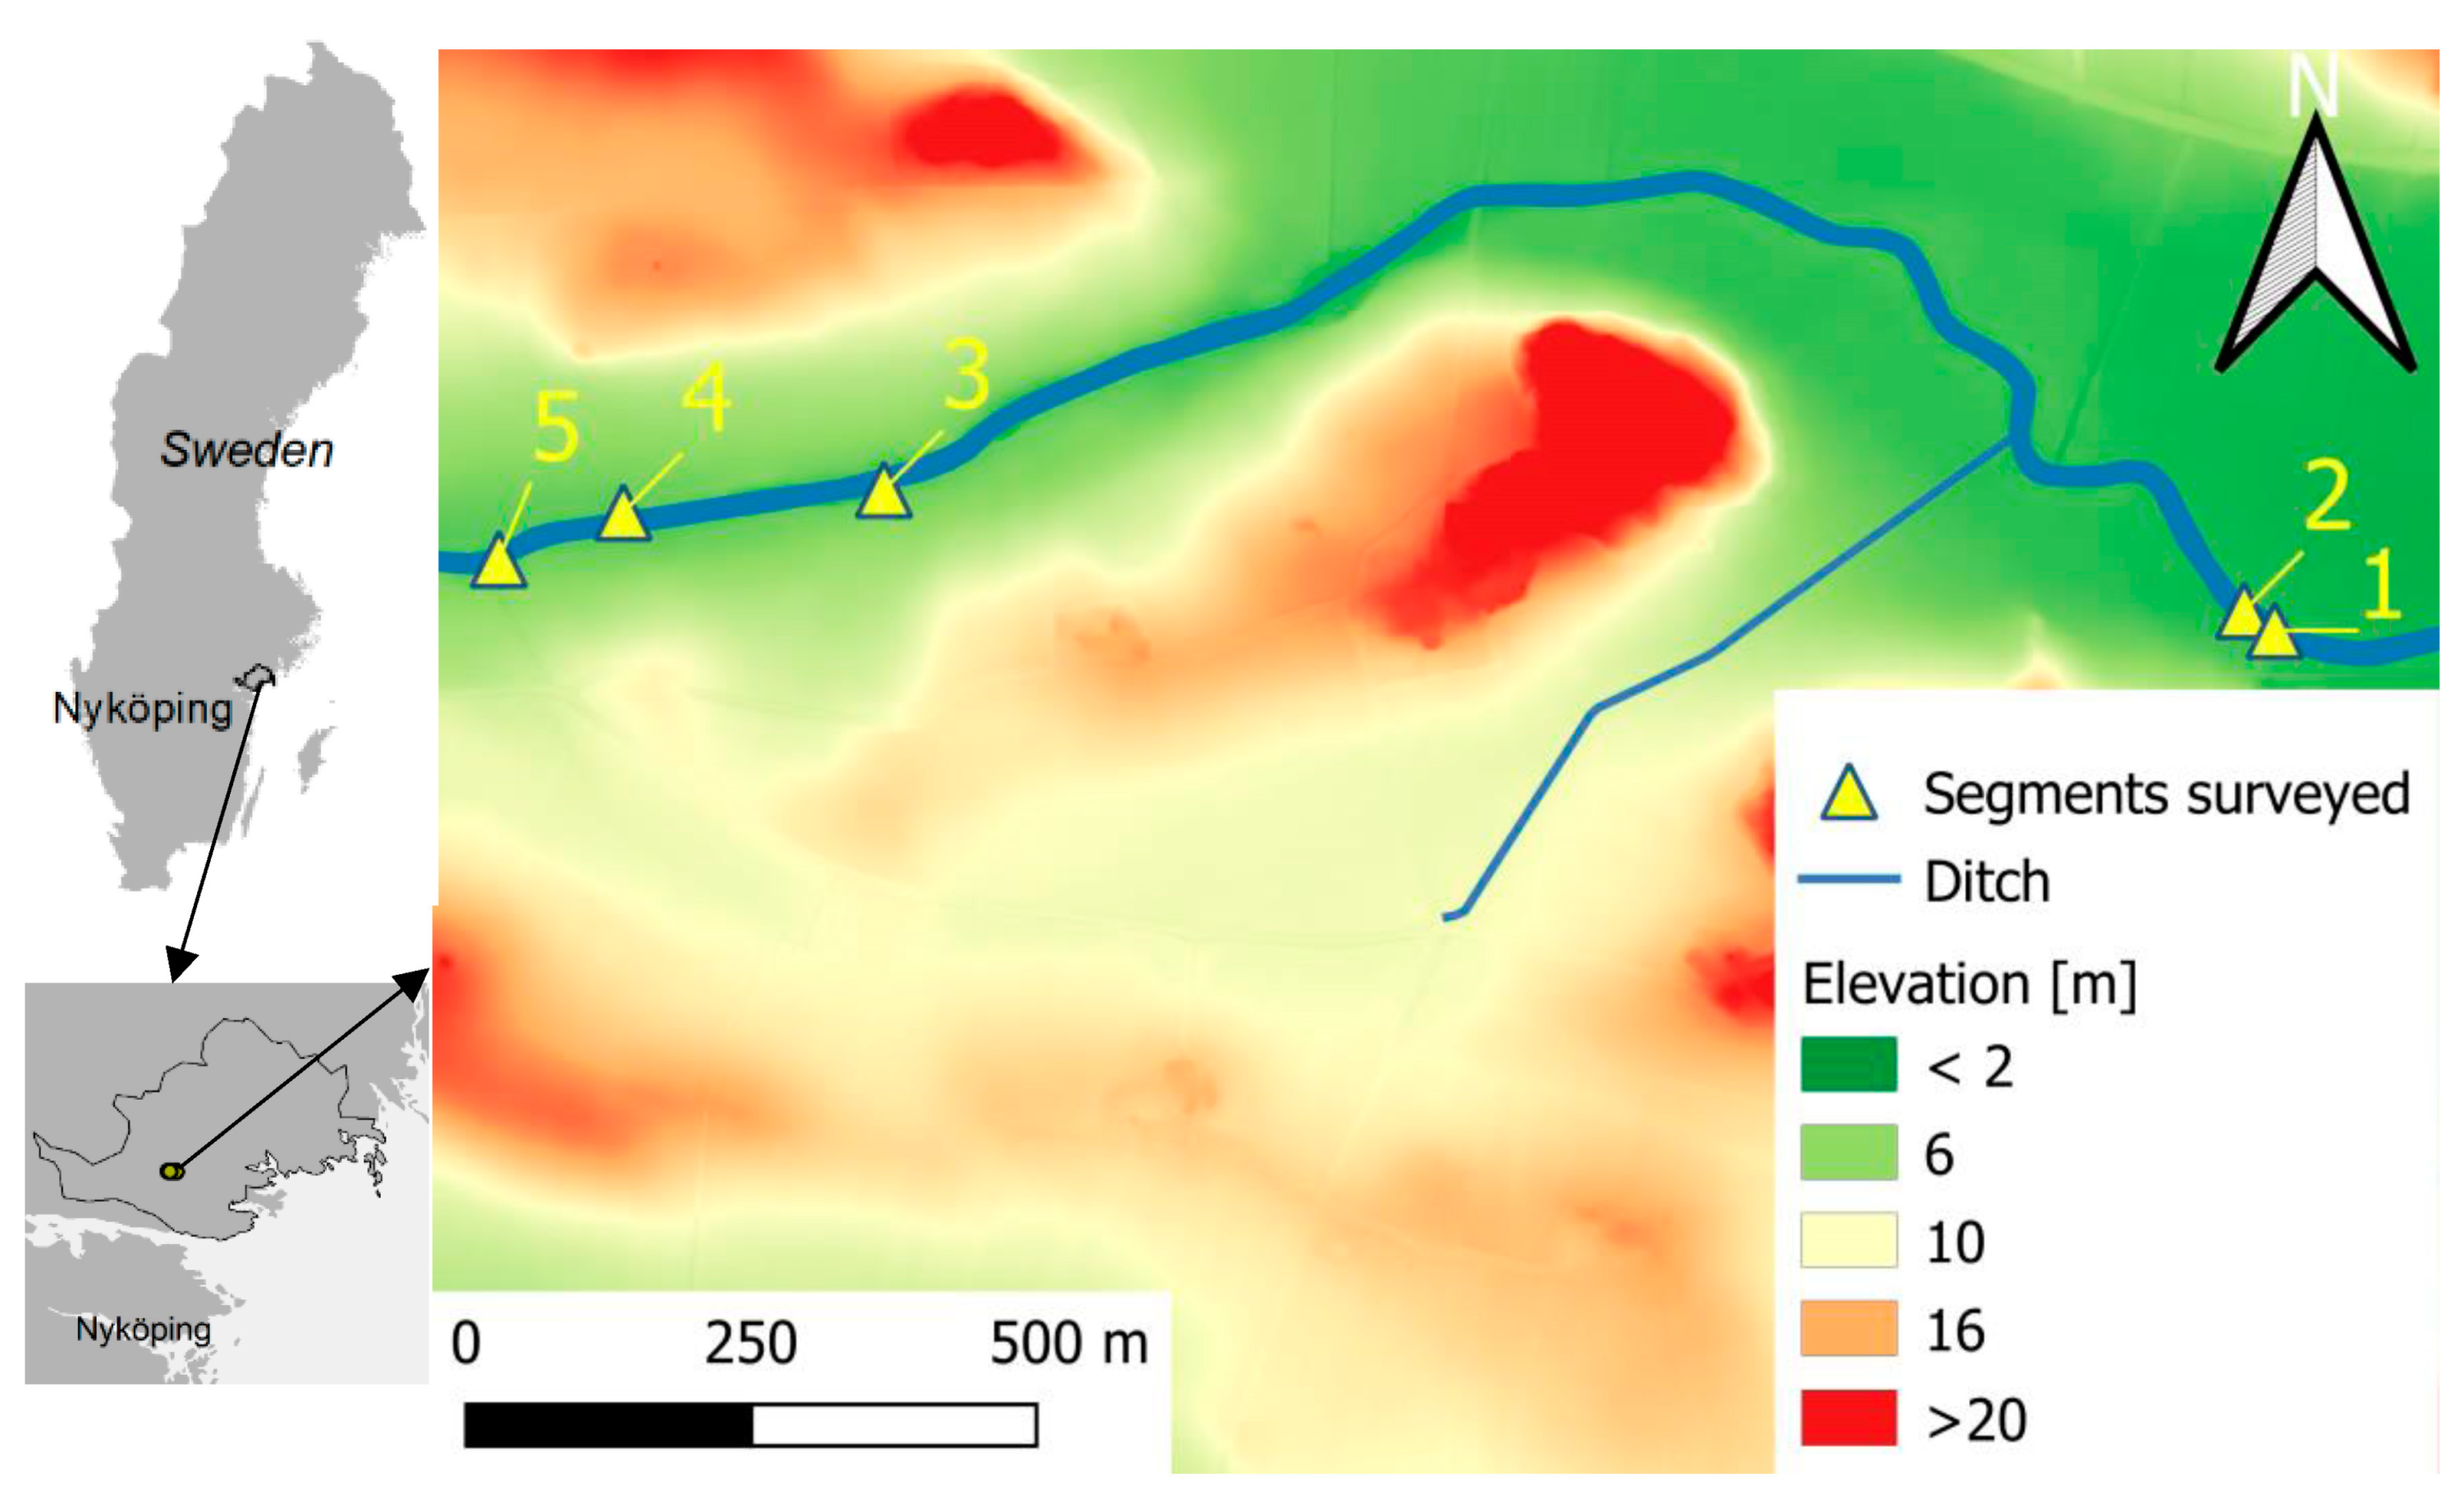
The “drained” and “saturated” conditions in
Table 3 refer to the expected conditions in the field (see
Section 2.2). The lower portion of the ditch bank is under saturated conditions, and the upper part of the ditch bank is under unsaturated conditions. For the average flow of 2.5 m
3/s, the different slopes (1:0.25, 1:0.5, and 1:1), and the selected Manning’s coefficient values (
n = 0.027 and 0.05) (see
Section 2.7), the water depth in the channel varied from 0.35 to 0.53 m. The soil below this depth is likely to be saturated and the soil above it is likely to be under unsaturated conditions. These two conditions were imposed on the samples before testing with the CSM (
Section 2.2). Based on the estimates of P
i_cr, there was no difference between saturated and drained conditions (
p > 0.1 in all cases). However, the estimated P
i_cr in segment 3, under saturated and drained conditions, was different from that in the other segments (
p < 0.05). The estimated P
i_cr was similar for segments 1, 2, 4, and 5 under both saturated and drained conditions.
From
Table 3, it can be seen that P
i_cr in ditch segments 2, 3, and 5 was higher for drained conditions than for saturated conditions. For ditch segments 1 and 4, both conditions showed the same P
i_cr. The average transmittance values are included to show that the pressures measured corresponded to points with average transmittance values below 90%.
P
surface_cr calculated using Equation (1) is also shown in
Table 3. For ditch segments 2, 3, and 5, the values of P
surface_cr were higher for drained than for saturated conditions. For segments 1 and 4, the values of P
surface_cr for drained and saturated conditions were similar.
Using the calculated values of P
surface_cr, the critical shear stress for erosion (τ
crit) was calculated using Equation (2) and is shown in
Table 3. The value of P
surface_cr for segment 2 under drained conditions was in the range of validity of Equation (2). The values of P
surface_cr for segments 1, 2, 4, and 5 under drained and saturated conditions were below the range of validity of Equation (2), while the values of P
surface_cr for segment 3 were above the range. Thus, the estimates of critical shear stress for erosion (τ
crit) should be viewed with caution.
The results of the unsaturated direct shear tests are shown in
Figure 6, where plots of shear stress versus normal stresses are shown for each segment. The results revealed that shear resistance was higher in ditch segments 1 and 3 than in segments 2, 4, and 5.
Shear strength parameters were obtained from the regression lines added to
Figure 6 for each segment, where the intercept of the regression line with the vertical axis (shear stress) is the total cohesion and the slope of the regression line is the angle of friction (see Equation (4)). The resulting parameters are shown in
Table 4. It was found that the cohesion values for segments 1 and 3 were different from the cohesion values for segments 2, 3, and 5 (
p < 0.1), whereas the values of the angle of friction were similar for all segments. Ditch segments 1 and 3 had higher total cohesion than segments 2, 3, and 5.
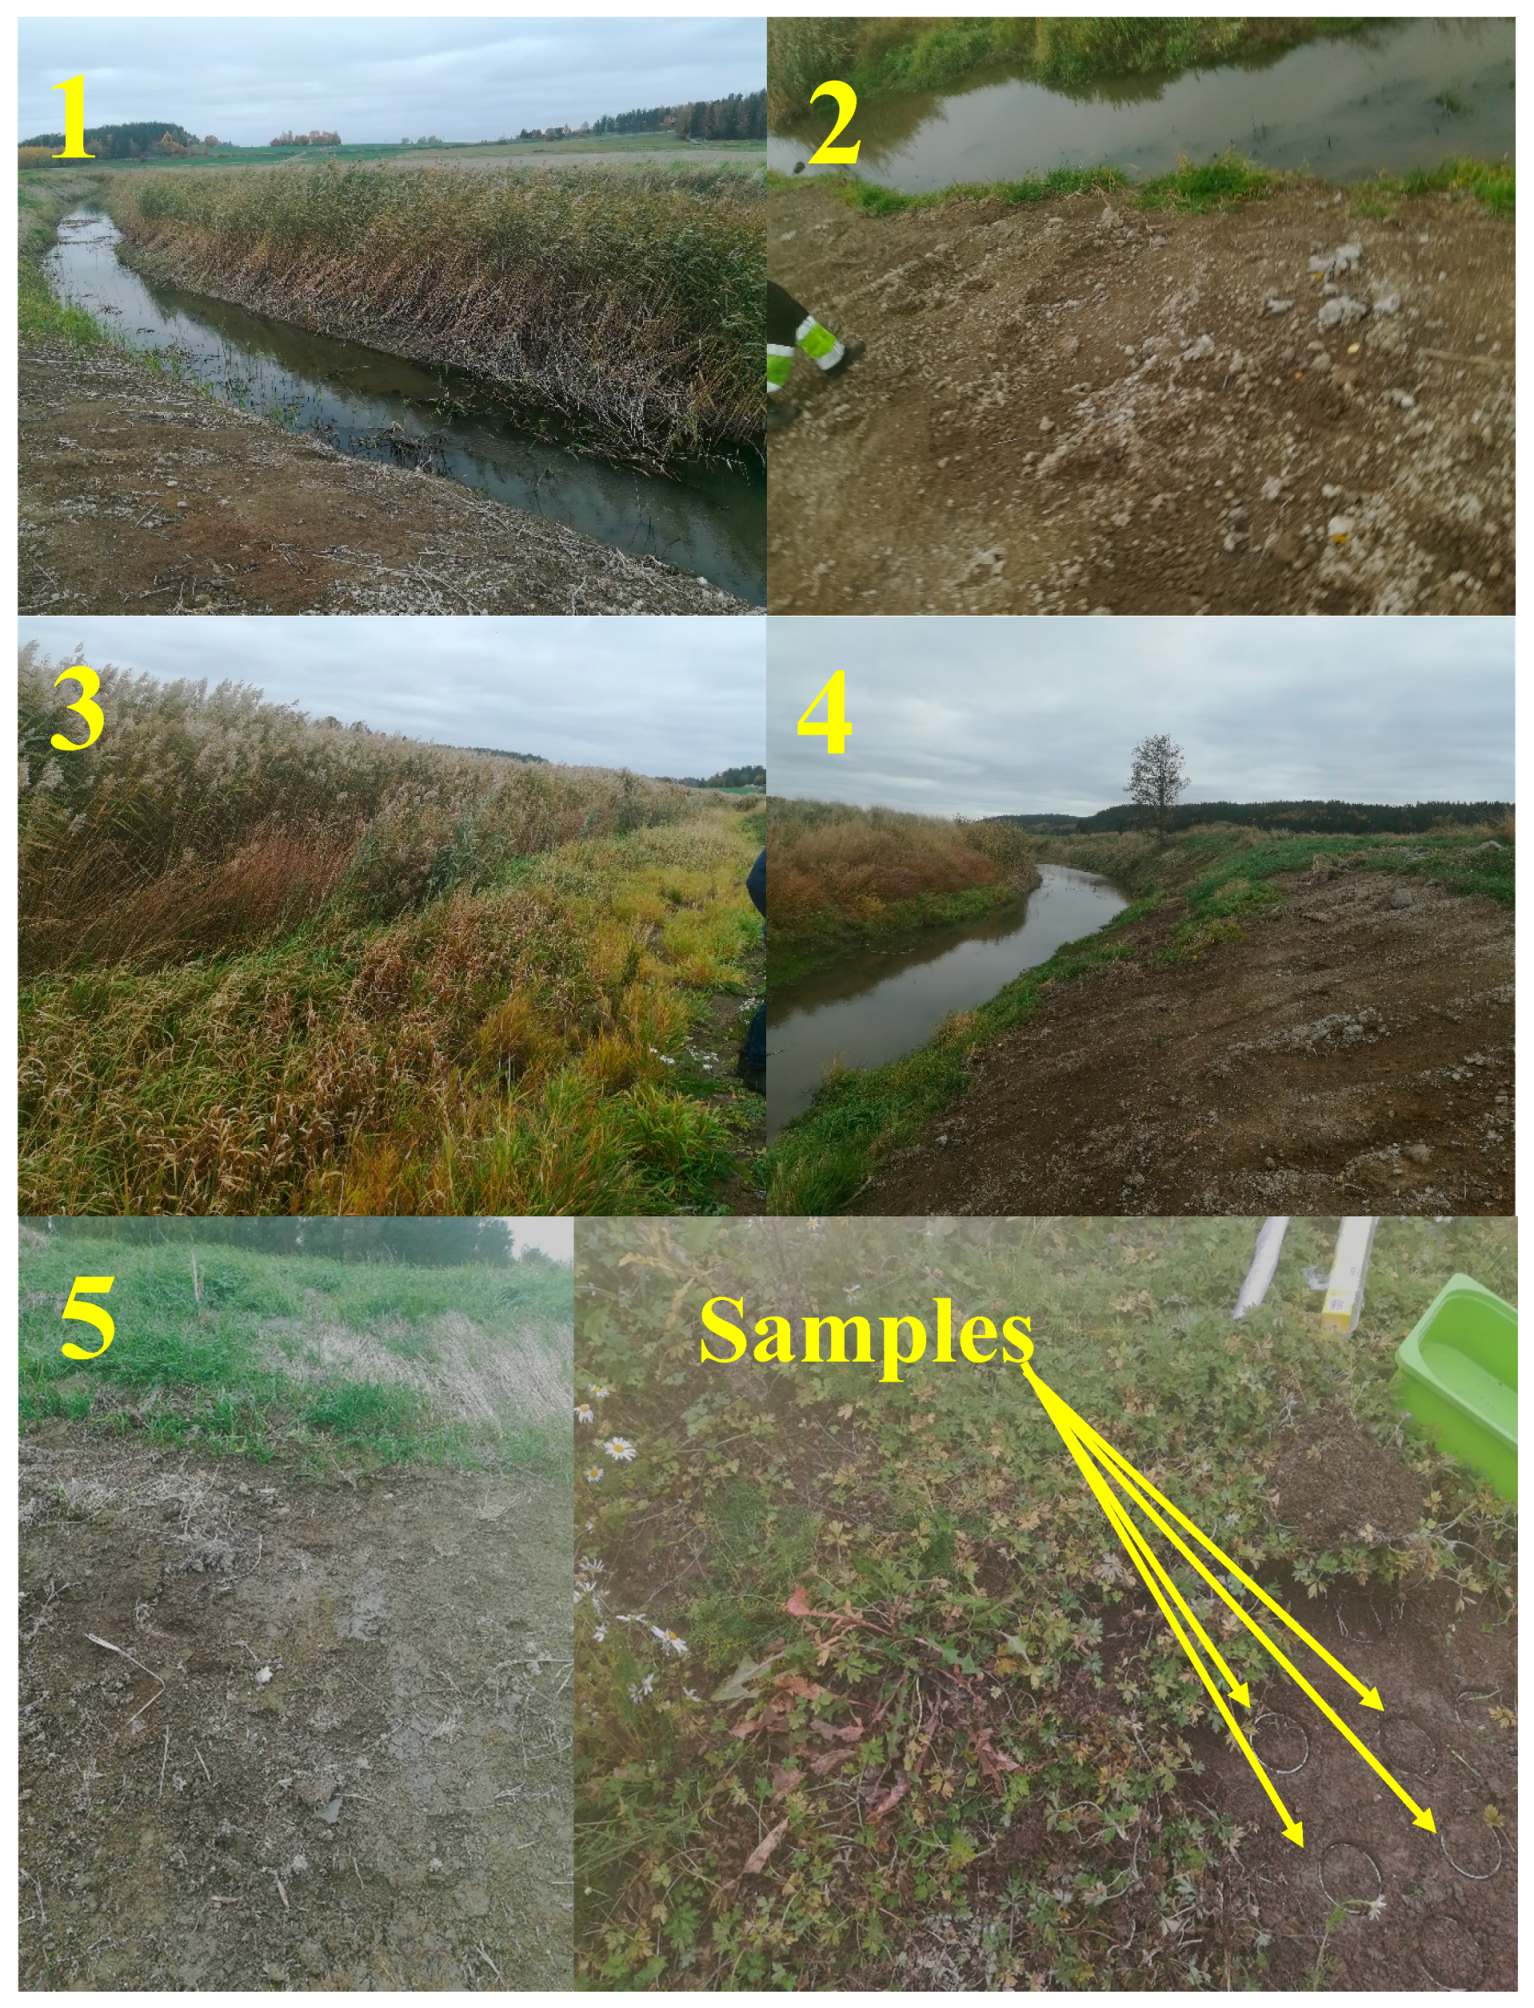
The root densities in soil samples from all ditch segments are shown in
Table 4. The average root densities were higher for ditch segments 1 and 3 than for segments 2, 4, and 5. However, it is important to note that, although as much care as possible was taken while gently washing the roots from the soil, some very fine roots might have been washed out along with the soil and water. In addition, although care was taken to trim the samples to the same volume, during the process some small stones or some very coarse roots created small holes in the samples, causing the volume to vary between samples. With these considerations, the estimated root densities in
Table 4 are only a rough indication, rather than precise density measurements.
Considering that the soil in all ditch segments studied was in the same textural class (silty clay loam) and taking root density as the only difference, the results were divided into two groups: vegetated (segments 1 and 3) and non-vegetated (segments 2, 4, and 5). The values of cohesion and angle of friction in
Table 4 were averaged accordingly, and the results are shown in
Table 5.
Using the parameters in
Table 5 and the geometry scenarios shown in
Figure 3, stability analysis was performed, and FoS values were obtained. For the stability analysis, a specific weight of soil of 20 kN/m
3 was used. The results of the stability analysis are shown in
Table 6, where values below 1 indicate unstable surface and values above 1 stable surface.
The results showed that a simple flattening of the surface, i.e., going from a slope of 1:0.25 to 1:0.5, increased the stability of the surface, converting an unstable scenario (FoS = 0.9 without any vegetation) into a marginally stable situation (FoS = 1.12 without any vegetation) (
Table 6). The vegetation that is almost always present in the areas surrounding drainage ditches increased the stability of ditch surfaces slightly further (e.g., for a root depth of 0.1 m and 1:0.5 slope, FoS increased from 1.12 to 1.14) (
Table 6). Presence of vegetation on the bank surface added to the effect of surface flattening, considerably increasing the stability of the bank (e.g., for a root depth of 0.1 m, on increasing the slope from 1:0.25 to 1:0.5 (flattening) and with vegetation present on the bank surface, the scenario went from a unstable case of FoS = 0.9 to stable at FoS = 1.34 (49% increment)). The overall stabilizing effect of the added cohesion by roots in the soil agrees with results published in the literature, particularly as regards bank stabilization [
17,
36]. In addition, the results showed that a change in slope from 1:0.25 to 1:1 (a reduction in slope angle) and promoting the presence of vegetation on the bank surface (non-maintained segment) changed the scenario from an unstable case of FoS = 0.9 to stable at FoS = 2.05. This highlights the problematic nature of ditch management, which must balance the need to maintain ditch capacity for flow against the need to keep ditch banks stable, while minimizing the maintenance costs.
Table 7 compares the estimated shear stresses caused by flowing water obtained for the different slopes and Manning’s coefficient values with the range of critical shear stress (τ
crit) values obtained with the CSM for the different segments and different moisture conditions (see
Table 3). The critical shear stresses obtained using Equation (7) varied slightly with the slope magnitude, with the lowest τ
bank values obtained for the 1:1 slope and the highest values for the 1:0.25 slope (
Table 7).
The estimated hydraulic shear stresses acting on the banks were higher than the estimated critical shear stress for erosion for the non-vegetated (maintained) and vegetated segments (
Table 7). However, the non-maintained segment 3 had an estimated critical shear stress that was close to the acting shear stress caused by moving water (16.1 Pa). This suggests that the presence of vegetation is likely to protect the soil against erosion, which generally agrees with findings elsewhere [
37,
38]. Finally, the values for hydraulic shear stress were based on year-average flow (2.5 m
3/s), and are likely to increase during the period of high flow. In such conditions, vegetated segments would be better prepared to resist the increased hydraulic shear stresses than bare soil.


