1. Introduction
In Indonesia, like other contexts, spatial and legal data collection for systematic land titling projects are often considered challenging tasks, especially for local land offices. It is not easy for local land offices to collect and verify the required documents completely, especially considering the pluralism inherent to the underlying land tenure structure. The issue makes formal land registration in Indonesia challenging [
1]. Under the current legal and institutional framework, Indonesian systematic land titling activities are procedurally demanding and rigid, requiring active participation from communities, villages, and government officers, owing to uncoordinated and sporadic registration activities in the past [
2].
Fit for purposes land administration (FFP LA) principles aim to accelerate land registration activities utilizing spatial, institutional, and legal framework and also call for incremental improvement [
3]. FFP LA has been tested, if not implemented, worldwide [
4,
5]. Although there are comprehensive FFP LA implementing guidelines available [
6], see also [
7], finding the best-fit land registration and spatial data collection method suitable for the country context remains a significant task in itself: there are no one size fits all approaches. Further, managing the financial, political, legal, and administrative aspects regarding large-scale registration campaigns remains challenging, even when FFP LA approaches are used.
Indonesia’s current progress on land registration provides an example to examine how quality, cost, and speed can be leveraged to reach the Indonesian government’s goal of registering all unregistered land parcels by 2025. The central government launched PTSL (
Pendaftaran Tanah Sistematik Lengkap—a complete systematic land registration for all land parcels using fixed boundary approaches with terrestrial and photogrammetry surveys) as mandated by the President through President Instruction No. 2/2018. Before PTSL was launched in 2017, the capacity for land mapping and certification was around one and a half million land parcels per year. Since 2017, the land registration campaign has resulted in a massively increased workload for ATR/BPN. In 2017, PTSL covered five million land parcels, and in 2018 the number of parcels increased to seven million. The target is to complete nine million land parcels in 2019
1. The remaining, more than 50 million land parcels, are aimed to be registered completely by 2025. PTSL was designed to map all land parcels and to certify unregistered land parcels nationwide covering each village.
Two years post-implementation of PTSL, completeness is still seen as a big challenge as land offices frequently focus only on unregistered parcels, leaving parcels with conflicts, floating titles, and unregistered parcels, decidedly unmapped. From PTSL results in 2018, it was shown that of the 7.7 million land parcels covered, 62.1% in total could be followed up with formal registration, whilst 24.6% could not be certified due to uncertain landowners’ legal status. Meanwhile, 13.2% from the total were unmapped land titles and about 2,200 cases were either conflicting or in the court. On the issue of uncertain landowners, constituting almost 25%, this is caused by several factors: (i) local land offices lack access to formal documents regarding the underlying rights; (ii) unknown and in-absentia landowners; and (iii) unsettled family disputes due to disagreement over land inheritances. Moreover, the central government has in place stringent standards for land offices to produce land titles. Low-level problems are rooted in institutional arrangements and contribute more than technical problems, these being related to the land office’s capacity to survey and map land parcels. This leaves the mapping of many land parcels in villages incomplete. Incompleteness leads to uncertainties of rights of registered land parcels in villages: previous studies have therefore correctly questioned the links between formal land titling, tenured security and livelihood improvement [
8,
9,
10,
11].
In order to have a systematically registered and complete land administration system, a country-specific approach, which is fast but reliable is required. Community-driven, participatory, and crowdsourced approaches promote an efficient and complete land boundary inventory that can be used for many purposes, including environmental protection and land certification [
12,
13,
14,
15,
16,
17]. The body of knowledge for community-driven, participatory, crowdsourced, and volunteered data collection in the research domain of land administration has evolved in recent years [
4,
5,
18,
19,
20,
21]. Participatory mapping practices for customary and indigenous land rights and land protection, especially for forested and rural areas, including in Indonesia, have evolved in decades [
22]. However, participatory mapping that produces “citizen cadastre” [
23] that followed up with formal recognition of rights and land titles in collaboration with national land offices is just a few or just emerging. FFP LA and systematic land titling emphasizes working with communities to fill gaps, for example, in accelerating adjudication processes [
24], or for eliminating the social constraints [
25] related to land governance. However, measuring the acceptance and consequences of such a community-based land registration has not been conducted for the land administration domain, especially in Indonesia.
In response, this paper aims to provide an analysis, based on a comparative framework, between the existing systematic land registration approach (i.e., PTSL) on the one hand, and the participatory approach, (i.e., participatory land registration—PaLaR), on the other. The analysis focuses specifically on the areas of cost, time, usability, and quality of the methods. Specific attention is given to the spatial quality of the methods used in PaLaR. According to the FFP LA guidelines, policy reforms in the spatial, legal, and institutional framework are required to accelerate land administration completeness. In the Indonesian context, the country has surveyed and mapped more than 20 million land parcels for three years using PTSL. Nevertheless, as mentioned above, about 24% out of mapped land parcels are not ready for first-titling due to unclear ownership, or due to low participation from the community. Thus, the challenges lie more in increasing community participation to provide legal and administrative data, whilst preserving the quality of spatial data collection when using PTSL. Taking this into account, in order to achieve the aim, the research applied two participatory land registration pilots to facilitate the spatial and legal data collection led by community representatives in Tanggamus and Grobogan. The results of spatial and legal data collection in the pilots were compared with the results using the PTSL approach. This paper aims to provide a collaborative analysis regarding spatial quality, effectiveness, and efficiency of participatory approach and tools, which are lacking in the current FFP literature. This paper will also then identify lessons learned with regard to the institutional and legal framework.
This paper is structured as follows.
Section 2 presents the materials and methods including the background and the location of the pilots and the methods of the comparative assessments. Further, it discusses the challenge and impact of increasing participation during the registration process and the modernization of the data collection methods [
7,
26] using usability perspectives. Two pilots, presented here, applied some FFP LA principles, but harmonized, as much as possible, with the current underlying spatial and legal frameworks.
Section 3 presents the results of the comparative assessments.
Section 4 discusses the lessons learned and required improvements and arrangements to increase the speed and usability degree of participatory land administration, in order to scale from pilots to national policy.
2. Materials and Methods
2.1. Methods in the Field: PTSL vs. PaLaR
PTSL is a government program dealing with systematic land title registration of all unregistered land parcels in rural areas in Indonesia. Land registration activities cover survey, mapping, registration, and certification of all land parcels in a village. As in one village, there can be land parcels that have been certified previously, the mapping should also deal with boundaries of registered land parcels, in order to create an up-to-date and complete representation of land ownership boundaries in the village. PTSL is conducted as a top-down approach program starting with the determination of the village as a PTSL location.
Indonesia applies mandatory boundary demarcation in land titling projects based upon Government Regulation (No 24/1997). For surveying and mapping land parcels, a special task force consisting of government surveyors or licensed surveyors are mandated to collect spatial data of land boundaries. In parallel to that team, a juridical team is deployed to collect and verify the legal data concerning the landowner identity and underlying ownership data. Juridical teams are land office employees assigned by the head of the land office. The budget to run PTSL was allocated from either the national budget, or local budget, or Corporate Social Responsibility Funds, or funds by the local community. Standards and procedures for the technical implementation and budget have been officially assigned through the Ministry of ATR/BPN. Steps of the PTSL approach include (a) determination of PTSL location; (b) spatial data collection; (c) legal data collection; and (d) data processing that includes legal data verification, validation, and titling. As suggested in previous research [
27], mandatory boundary demarcation still faces challenges in terms of social and non-technical issues, leading to low participation.
This paper also assesses an approach, called PaLaR (participatory land registration), a community-centered data collection and facilitation for village-level land registration campaigns. In contrast to PTSL, PaLaR tends towards a bottom-up approach rather than a top-down: spatial and legal data collection is done completely through the community representatives with the guidance of government officers.
The PaLaR approach was implemented in two villages residing in Central Java and Lampung, through a cooperation between the Ministry of ATR/BPN from Indonesia and Kadaster from the Netherlands. Community representatives are referred here as the community-based land registration committees (CLRC, or interchangeably called “the committee” herein), who performed the field activities (spatial and legal data collection). PaLaR explores the use of community-centered data collection and production, to ensure that tenure security for all can be achieved successfully. It is hypothesized that by trading-off between efficiency and quality, in implementing fit for purpose land registration for Indonesia, the method can provide a design for massive scale and fast land titling.
As PaLaR is intended to produce the same official titles as PTSL, without changing the administrative processes, a comparison between PTSL (government-led land titling activities) and PaLaR (government-facilitated and community-based land titling activities) should be done using the same activities of both PTSL and PaLaR (i.e., socialization, spatial data collection, legal data collection, data processing, and certification).
Socialization refers to field activities disseminating information about the systematic land registration campaigns.
Spatial data collection relates to field activities done by surveyors to survey and store information regarding boundary points, adjacency and ownerships of land parcels for first-titling purposes.
Legal data collection refers to field and office activities to collect underlying formal documents specifying the owner and the ownership status of land parcels. The required data include signed application forms, official personal identity verified by the civil registry, an underlying proof of land ownership (e.g., a statement letter from the village office) and the newest land tax bill from the Municipality Office.
Data processing refers to office activities to validate the completeness and the validity of the submitted documents.
The differences between PTSL and PaLaR methods on implemented four plans are presented in the
Table 1.
Data processing and certification using GeoKKP software for all land parcels in two village pilots were done by the corresponding Land Office’s staff. For the GeoKKP entry, the local staff must validate the digital data against the paperwork.
Figure 1 provides a graphical overview of the described workflow designed for the PaLaR pilots.
2.2. Materials in the Field
Narrowing to the work underpinning this work, subsequent to the above procedures, a spatial data quality assessment was performed to compare geometric quality against the reference data for both the test data and the resulting data from survey and mapping activities done by the CLRC team, using GNSS tools during the field survey of boundary points. Reference data was acquired by the research team using RTK GNSS/GPS mapping using L1/L2 geodetic devices for parcels that had been previously surveyed by the CLRC. CLRC accompanied the research team to show the boundary markers and in communicating with landowners during the collection of reference data.
The study utilized an app ‘Meridia Collect’, to collect the spatial and legal data. It ran on a tablet that was connected to a GNSS device, which is an L1 low-cost GNSS, known as Emlid Reach RS. On the backend, Meridia Collect was supported with Podio to support the online data management, and to cover data quality checking. Data integration with the national system, i.e., GeoKKP, was completed manually by local land offices after receiving the registration data from the community team.
Core functionalities in Meridia Collect were the Carta and Terra functionality. Carta was used to delineate parcels, including the use of snapping tools. Terra was used to map agreed-upon point boundaries in the field, using the GNSS mapping tool. Legal data collection frequently used Register to enable data entry (interview/typing), document digitalization, photos, and fingerprints. In addition, the dashboard application was provided to do spatial data quality checking including topology and snapping tools, and legal and spatial data integration.
2.2.1. Reference Data
Field measurements of the reference data were completed using the RTK method with L1/L2 GNSS geodetic devices. The RTK method was undertaken using the available CORS (continuously operating reference system). Here, the correction parameters were transferred using a standard NTRIP (network transport of RTCM via the Internet protocol). The base station was not a fixed CORS station, but, rather, a GNSS receiver that was positioned freely in the field adjusting to possible field obstructions.
Field measurements were conducted using GNSS geodetic devices (L1/L2) with an achievable accuracy of 10 cm. During the field measurements, boundary points that were demarcated in the field through markers were collected/measured by the CLRC members, under the supervision of the landowners. The results of the measurements were represented as shapefiles that could be directly compared with the other data sample. For the field measurements, the following GNSS receiver was used: (Brand: South Type: Galaxy G1), produced in 2017, with the following specifications (gathered from the handbook of the device):
| Channel | 220 Channels |
| Signal Tracking | GPS, GLONASS, Galileo, Beidou, QZSS, WAAS, MSAS, EGNOS, GAGAN, E5A, E5B |
| RTK Survey | Horizontal 8 mm + 1 ppm; Vertical 15 mm + 1 ppm |
| RTK initialization time | 2 m, 8 s |
| Data Format (differential) | CMR+, CMRx, RTCM 2.x, RTCM 3.x |
| Data format (GPS output) | NMEA 0183, PJK, binary code |
| Network support | VRS, FKP, MAC, NTRIP protocol; NFC module, USB, Radio, Bluetooth |
| Market price in 2018 | IDR 250.000.000, 00 (2 pcs set as Base-Rover) |
2.2.2. Evaluation Data
The evaluated datasets were the data collected in PaLaR using a local coordinate/reference system, captures through a Base (ground control point) and Rover configuration, and a tablet, which was connected to a low-cost GNSS receiver, Emlid Reach RS+, which had the following specifications:
| Channel | 72 Channels |
| Signal Tracking | GPS/QZSS L1, GLONASS G1, BeiDou B1, Galileo, E1, SBAS |
| RTK Survey | Horizontal 7 mm + 1 ppm; Vertical 14 mm + 2 ppm |
| RTK initialization time | 2 m, 8 s |
| Data Format (differential) | RTCM2, RTCM3 |
| Data format (GPS output) | NMEA, ERB, plain text |
| Network support | USB, RS232, PPS, Bluetooth, Radio, NTRIP |
| Market price in 2018 | IDR 26.500.000, 00 (2 pcs set as Base-Rover) |
In addition to land boundaries, the app also captures registration documents, including ID cards, application forms, tax receipts, letters of ownership from the village office, required for first-titling. Data collection done by CLRC was stored in Meridia Collect. After data cleaning was completed by a Meridia data officer, the data was submitted to Tanggamus and Grobogan local land offices. Data collected were classified as parcels with registration data (ready for land certification), parcels without registration data (considered as K4/already registered or K3/not ready to be registered), and interviews only (without spatial data collection).
2.3. Methods in the Office
2.3.1. Quality Assessments
This study was looking at the data quality and the procedure quality that resulted from participatory land registration. Here, ‘quality’ refers to the “totality of characteristics of a product that bear on its ability to satisfy stated and implied needs” (ISO 2002, originally in ISO standard 8402). The data quality that was seen as essential here were spatial data quality, logical consistency, and completeness. Meanwhile, the procedure quality that was considered essential for land registration for this study included time, cost, and usability of the application used by the community. The set of measures for these two quality themes and their corresponding attributes is given as follows.
From the literature, spatial data quality can be broken down into elements of quality, characterizing the fitness of the product against specific standards (also known as producer accuracy). Some known international standards define spatial data quality: i.e., ISO 1957:2013 on Spatial Data Quality, and ASPRS (American Society for Photogrammetry and Remote Sensing) on ASPRS Positional Accuracy Standards [
28]. From a different perspective, quality can also be seen as fitness for use, where quality is seen to meet the specific purposes for the use, either by an expert or common users following a possible list of fitness- for-use criteria (see, e.g., [
29,
30]).
According to geospatial information literature, five to eleven elements can be used to distinguish spatial data quality [
31]. For assessing the spatial data collected, at least six elements are commonly used to describe quality: lineage, positional accuracy, attribute accuracy, logical consistency, completeness, and semantic accuracy. In these two pilots, the geospatial data quality assessment was focused only on positional accuracy, logical consistency, and completeness.
Positional accuracy can be seen as the accuracy of the coordinate values. This can be calculated as relative or absolute positional accuracy. Absolute positional accuracy is defined as the accuracy of test coordinate values against the reference coordinate values. As the land parcels form polygonal areas, the accuracy here is assessed per the differences in point position and area between the test dataset (dataset collected by CLRC) and reference dataset (dataset collected by the research team).
Logical consistency deals with the contradictions that violate compliance between the schema and structure of the spatial dataset and the values represented in the collected data. Logical consistency includes topological consistency and validity of attributes compared to the conceptual schema [
32]. It may also include format consistency [
33].
Completeness refers to “the relationship between database objects and the abstract universe of all such objects”, [
34] or measures related to accessing data and missing data [
33].
Spatial data quality was assessed through the comparison of the evaluation dataset against the reference dataset. The reference dataset represented an ideal PTSL spatial data collection using the RTK GNSS method, following the normal land titling/PTSL technical guidelines. The surveyed points of the PALAR’s land parcels were assessed using a point accuracy test. For assessing the quality of polygon areas of PALAR’s land parcels, this study implemented the polygonal area assessment.
Point accuracy shows the closeness of the evaluation data to the reference data and is assumed to have a better result and be closer to the standard of point measurement. It yields a displacement line of length between the evaluation and reference point datasets. Point accuracy was often used to evaluate OpenStreetMap (OSM) data quality (see [
35,
36]).
In addition to point and area evaluation, an assessment of the completeness and logical consistency of the data collection was also done. Completeness herein refers to the completion of the spatial data collection for one village. The national (PTSL) standard demands that results of the cadastral mapping of a village are categorized as existing certified land parcels (K4), undisputed land parcels not ready for certification (K3), disputed land parcels (K2), and undisputed land parcels ready for certification (K1). A score between 0% and 100% will determine the completeness of the mapping. Completeness can also be seen as the completion of legal data collection. Legal data collection will result through the entry of the legal data regarding the legal information of the landowners’ identity (e.g., family card and identity card) and land ownership underlying status (e.g., a letter from the village, transaction deed, tax receipt, and so forth). Legal data completeness is specified as “Yes” or “No”.
Logical consistency refers to the fidelity of the relationships in the dataset collected in PaLaR. For land registration purposes, the topology of land parcels is a logical data consistency measure that is considered important. This ensures that the shape of the individual land parcel is closed properly and that adjacent land parcels are topologically correct. The topological and validity cleansing of collected data in Tanggamus and Grobogan was assessed.
2.3.2. Time Assessment
Time in this assessment refers to the number of hours and days to complete all activities, excluding the certification process, which is excluded as the process is within the government’s control. Some delays and breaks occurred in both pilots. For the assessment, use of time for spatial and legal data collection, idleness and break sessions were not counted. Time was seen as a stop-watch measurement for completing the spatial and legal data collection in the field.
The use of time to complete the land registration campaign during the PaLaR project was limited to the socialization and data collection time only. Other stages of the campaign, including data processing and certification, were not assessed. The actual data collection time was measured by the system embedded in the Meridia Collect app.
2.3.3. Cost Assessment
Significant cost in this assessment was money allocated from the government budget to finish the activities. As the budget of PaLaR only covered socialization and data collection, and partly data processing but no certification, the focus of cost assessment is on socialization and data collection activities only. The results of the cost assessment will be compared with international guidelines and can be used by stakeholders to plan the participatory land registration budget.
For this study, the land office and the committees in Tanggamus and Grobogan were interviewed regarding the costs for data collection
2. Costs that were not yet considered in the results of the project include a group discussion facilitated by JKPP, field training, hardware and software investments (e.g., tablets, GPS and document scanner, and software developments).
2.3.4. Usability Assessments
The term “usability”, as it is used in this paper, refers to the usability of the geospatial information interface used in the pilots and not to the geospatial data itself, as used in other works. Usability assessment was done to evaluate the effectiveness, efficiency, and usefulness of the mobile application to gather spatial and legal data from the community. Previous works have applied usability measures of mobile applications for participatory data collection [
37,
38], but no work has been done in support of land titling projects. The research measures were focused on effectiveness, efficiency, understandability of the interface, and how error-tolerant and engaging it was as recommended in the ‘5E usability measures’ [
39].
Usability assessments were completed by conducting interviews with users and observations during the use of the app to collect the field data. Here, “users” refer to CLRC members in Tanggamus and Grobogan. The app refers to the Meridia Collect app, the data collection tool used by CLRC.
3. Results
3.1. Statistics of the Overall Data
In total, 1000 points of land parcels in Tanggamus and 1697 points on land parcels in Grobogan were collected. The status of the data completion was captured at the end of the pilot project and is shown in
Table 2.
As of September 2018, final updates were provided by the two local land offices. The land parcel status in the Village of Kuripan, Tanggamus, and Wandan kemiri, Grobogan can be seen in
Table 3. In Tanggamus, PaLaR land parcels that were ready for land titling (K1) were 532, meanwhile in the Village of Wandan Kemiri, Grobogan, land parcels that were ready for land titling, were 686. It was about 50% in total, out of PaLaR land parcels that can be followed up with land titling. Other cases were K3 and K4. A typical example for K3 is landowners did not want to continue to participate in land registration programs for unconfirmed reasons (see its explanation in the Discussion). K4 means that land offices must take actions to improve the quality of land records as previously the land titles were either not mapped correctly or with no spatial information (known as floating titles).
3.2. Results of Spatial Data Quality Evaluation in Tanggamus
3.2.1. Results of Evaluation for Point Accuracy
Evaluation for positional accuracy was completed first by selecting land parcels identified in the referenced and evaluation dataset through the same number of points. The authors limited the evaluation of positional accuracy to paired boundary points found in both the referenced and evaluation dataset. In Tanggamus 15 parcels out of 33 had a different number of points.
The research team that recorded the point boundaries of the reference data was accompanied by CLRC during the survey. During the field survey to individual parcels, most landowners attended the field check. CLRC checked the points with the previously surveyed ones, by using the map provided by the tablet used in PaLaR or by consulting with the landowners. Most land parcels were demarcated in the field, hence point identification was easier.
Next, parcels in both the reference and evaluation dataset that had the same number of points per parcel were compared to determine the difference of the coordinates. This comparison produced a length of line (distance) between the reference and evaluation of boundary points. The average and standard deviation of the shiftings were calculated. The differences of the point coordinates between the reference and evaluation dataset for Tanggamus can be seen in
Figure 2. The average difference was 0.521 meters while the standard deviation was 0.570 meters. Poor results (>1.5 m) resulted from either poor data correction or points surveyed with GNSS floated solutions.
3.2.2. Results of Evaluation for Polygonal Features
The polygonal quality of land parcels was assessed using the area comparison method. The comparison method was used to compare parcels of the same unique ID from the evaluation and reference dataset. There were 33 samples of land parcels. From the polygonal area, an evaluation was done in Tanggamus, the results of the classification of the spatial data quality of area comparisons can be seen in
Table 4. Equal interval grouping was used to show the distribution of values of the results for area comparison.
Graphical views of spatial data quality derived from all methods can be seen in
Figure 3.
The visualization of polygon data for the evaluation and referenced land parcels can be seen in
Figure 4. It shows the differences of lengths of parcel boundaries between the reference and evaluation data.
Differences were caused by at least two factors: (1) location of points measured by CLRC were not exactly the same points as measured by the research team. In some cases, although the research team was accompanied by the CLRC during the measurements, there was uncertainty within the CLRC team regarding the location of the point because the field demarcation was not permanently installed or the landowner was not present and (2) effect of data cleaning in the post-processing by the Meridia data officers that included snapping or adding points, which produced different parcel boundaries. As seen in the parcel with the red circle, 22 different points existed between the reference and the evaluation datasets. This could have been caused by having no boundary demarcation in the field. A similar case also occurred with the land parcel indicated through the yellow circle.
Figure 5 (top) shows the evaluation versus the reference dataset, although the evaluation dataset here was not cleaned (before the geometric data cleaning process). In some cases,
Figure 5 (below), the differences may have resulted from wrong snapping during the data cleaning process. The differences between the reference and the evaluation dataset were less before than those after the data cleaning.
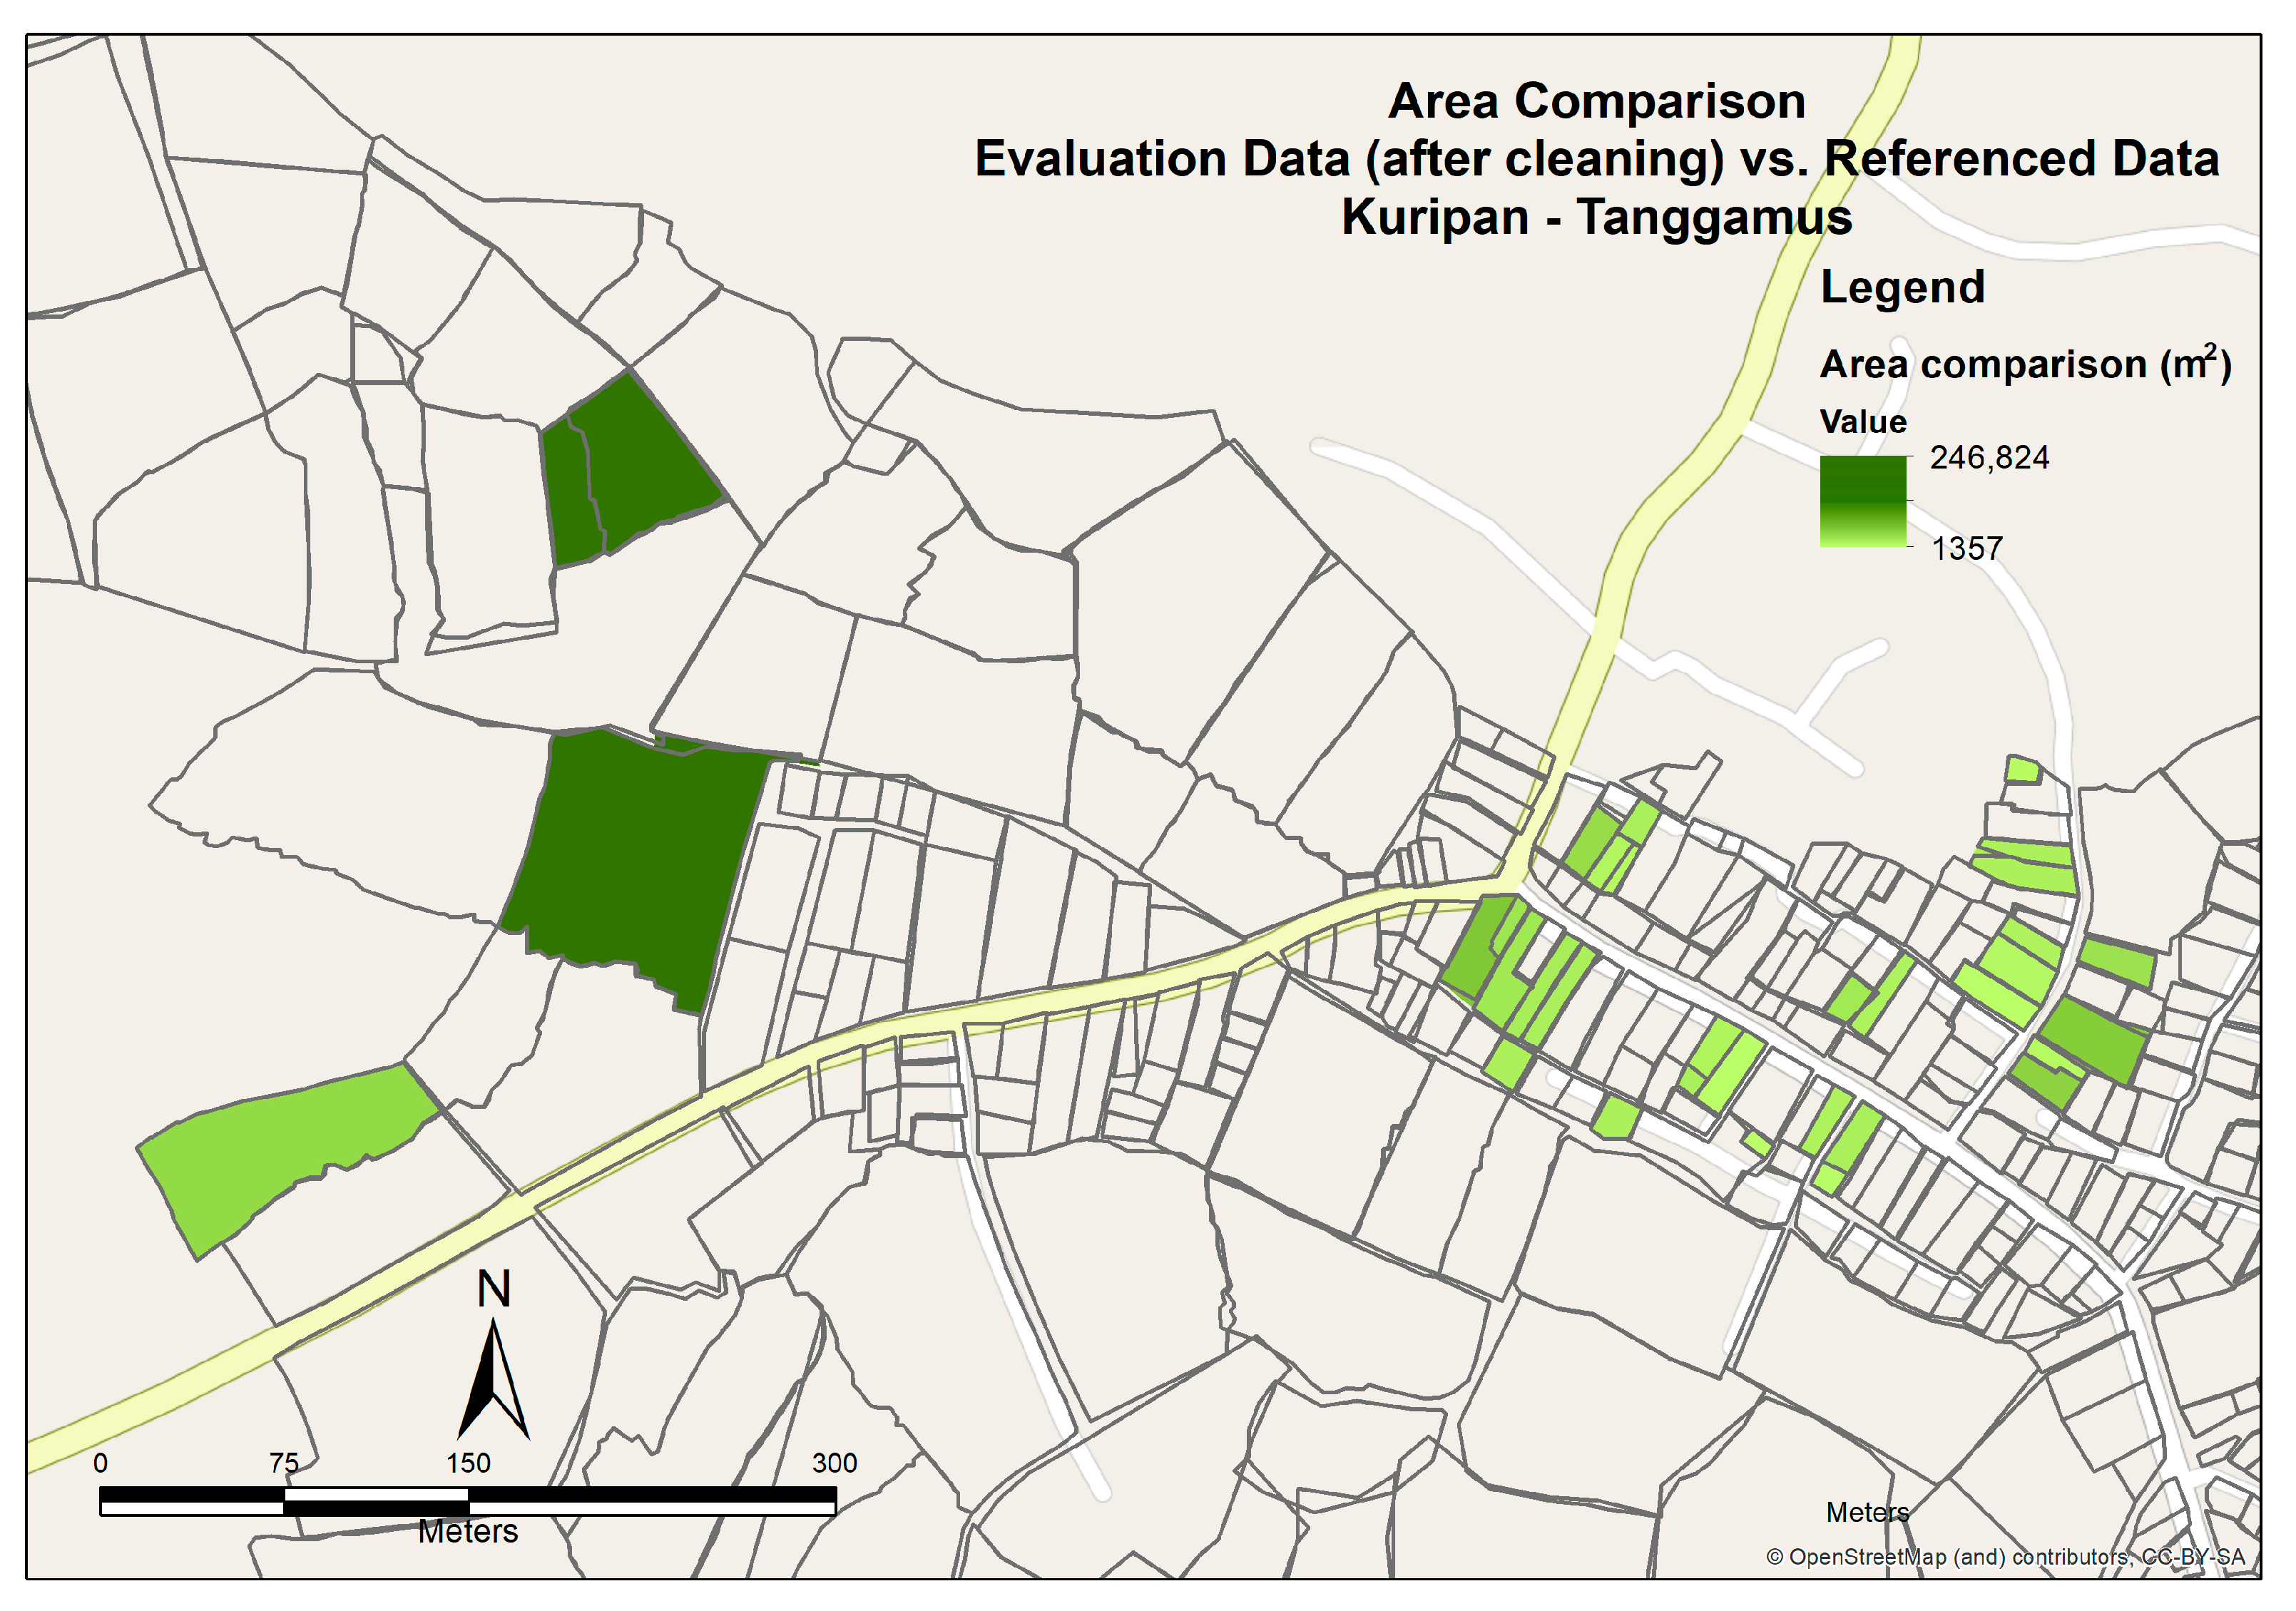
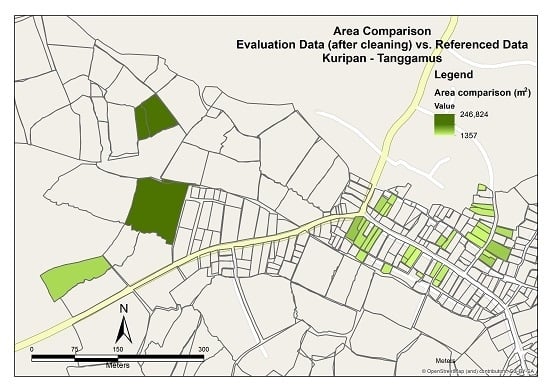
Furthermore, the difference in quality was visualized for both polygonal feature assessments. Darker colors represented lower quality, hence, for areal comparison, darker green meant lower quality. This meant a greater difference between the reference and evaluation datasets. Maps of polygonal quality of collected land parcels can be seen in
Figure 6. Darker means bigger differences or larger gaps.
3.2.3. Results of Logical Consistency
All parcel data collected from Tanggamus were checked for logical consistency. From checking activity, it can be concluded that topological consistency and attributes’ validity were good.
3.2.4. Results of Completeness
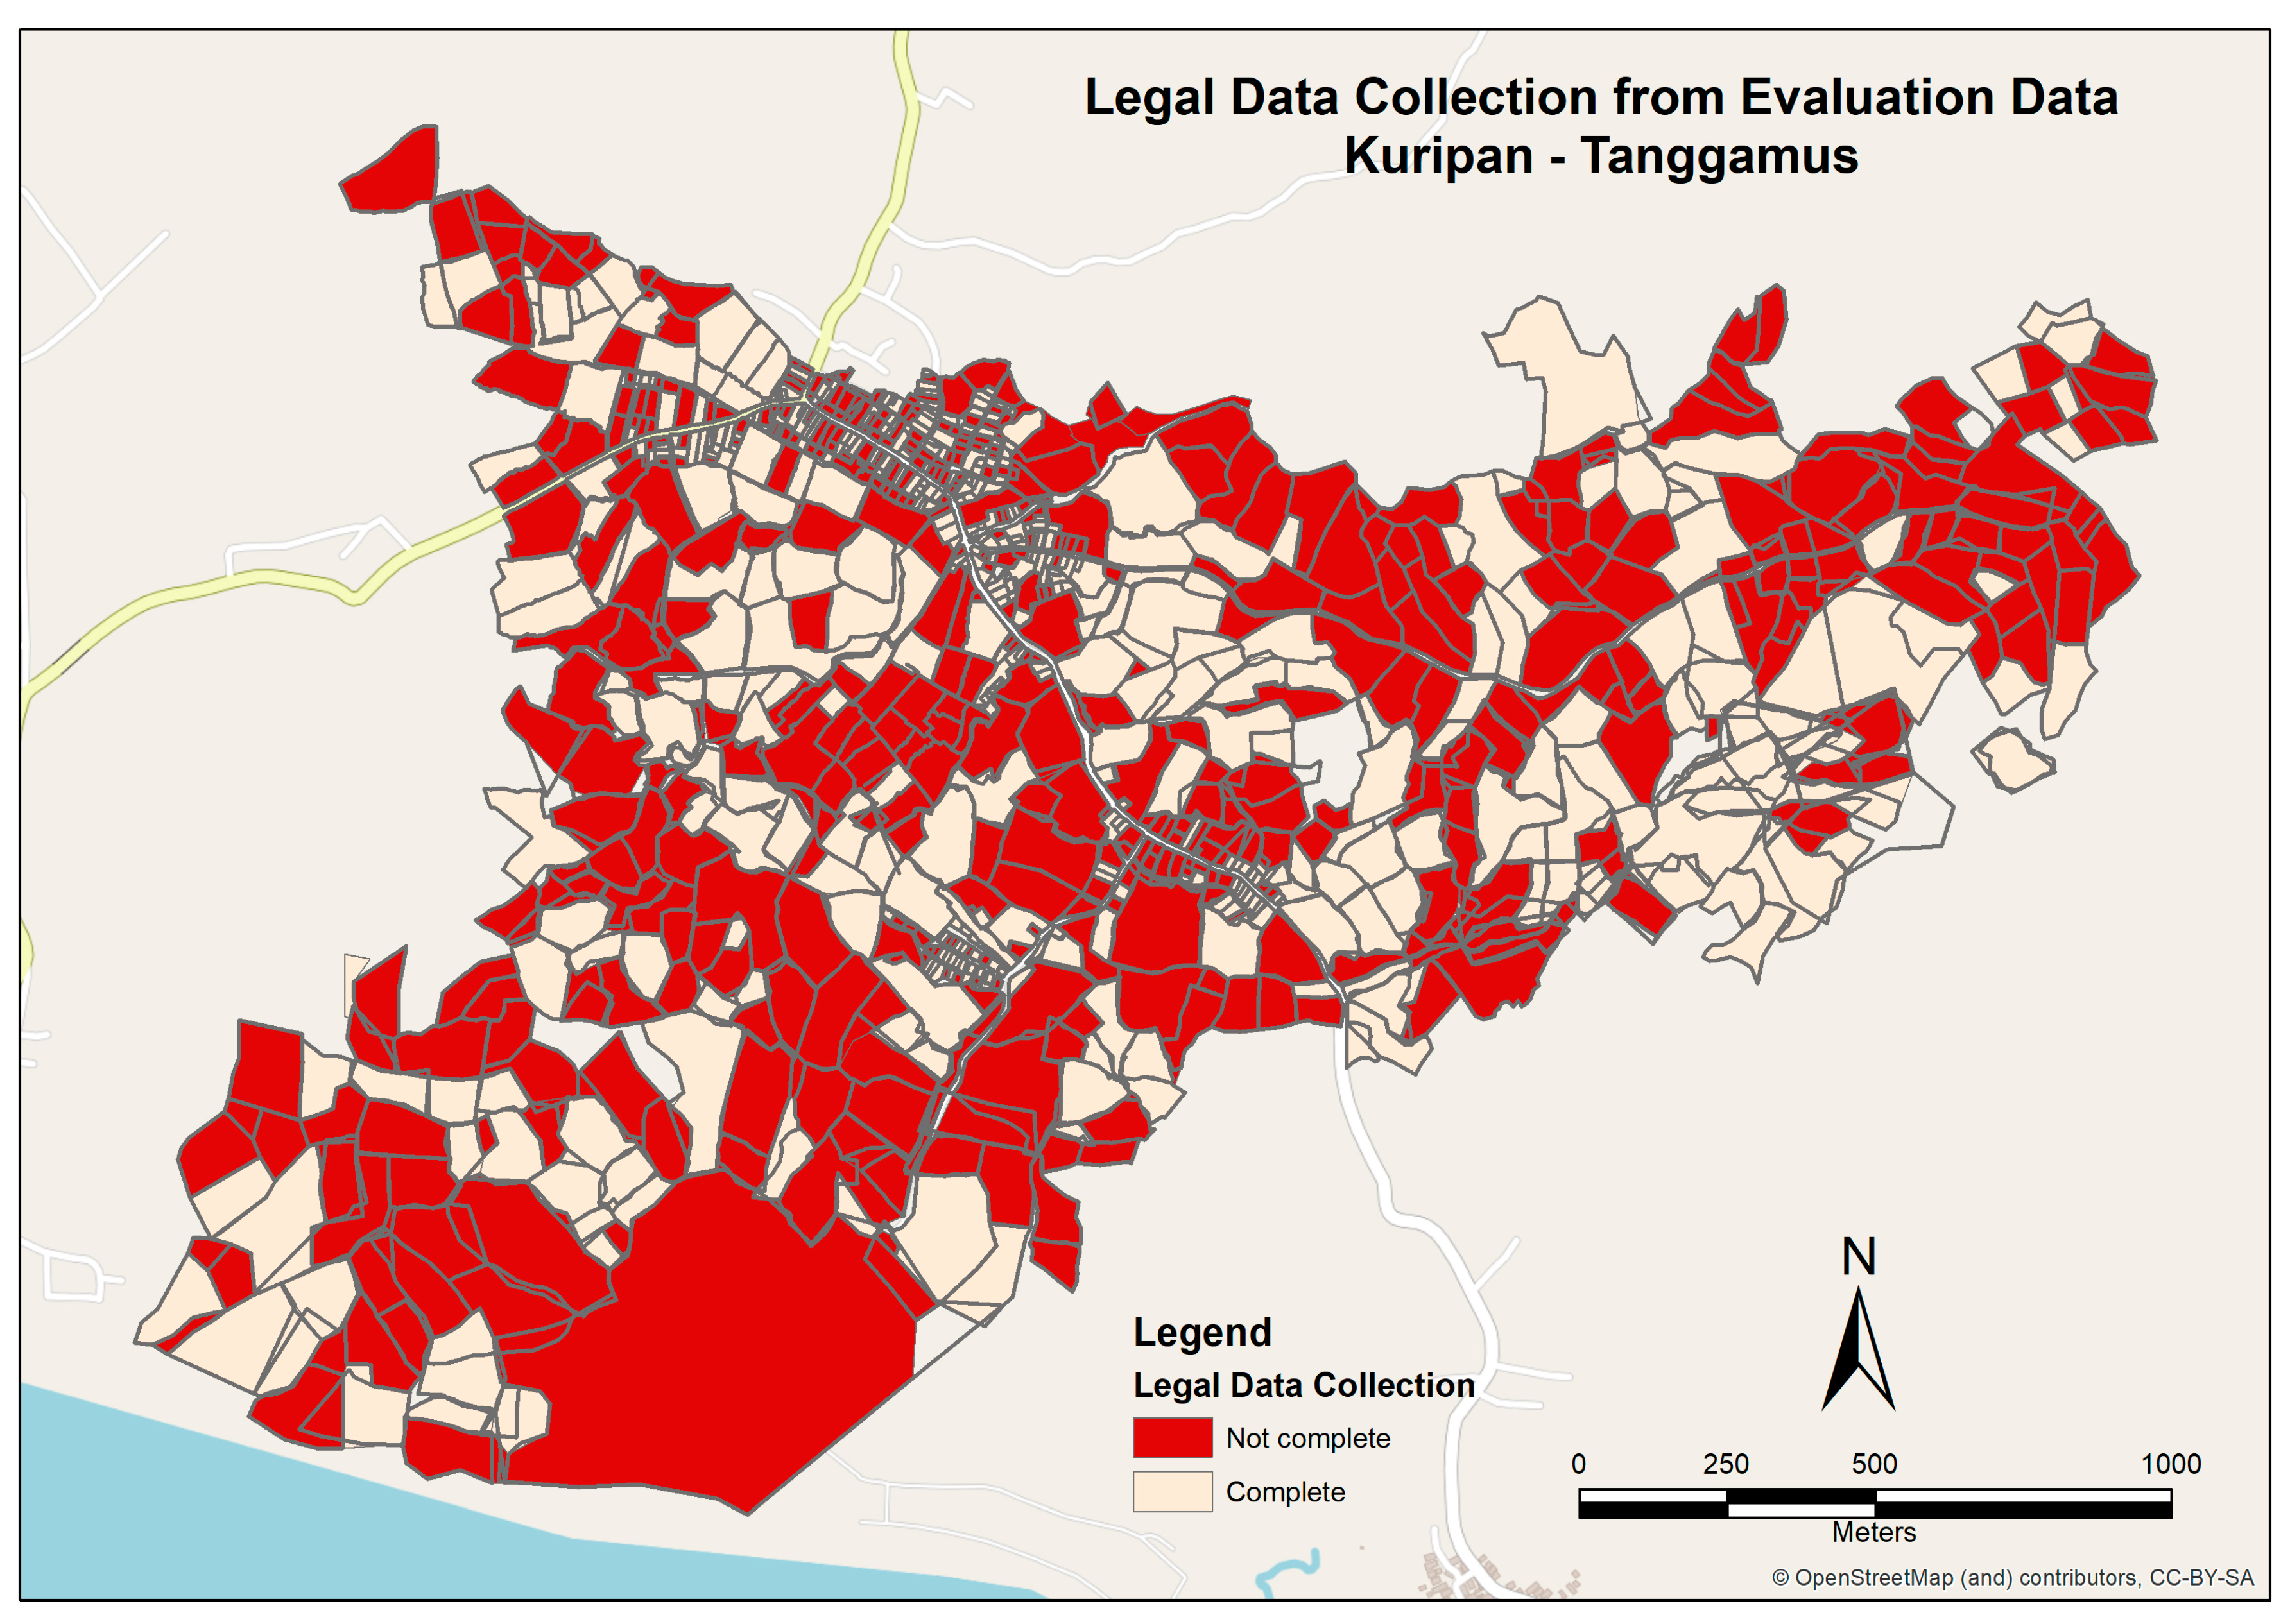
Completeness here refers to the completion of spatial data collection for one village. The final map produced should give clear information as to which land was categorized as existing certified land parcels (K4), undisputed land parcels not ready for certification (K3), disputed land parcels (K2), and undisputed land parcels ready for certification (K1). Completeness can also be seen as the completion of identification of all parcels and their ownership status. It can be concluded that the completeness was well achieved with the PaLaR method, as 100% of all land parcels were mapped.
In terms of legal data collection, as of August 2018, 465 out of 535 parcels were without legal data. This could have been because incomplete parcels (red) either were not registered or not ready to be registered (
Figure 7)
. Landowners who were not registered were generally less motivated to participate during the land registration.
For clarity, the results of the spatial accuracy assessment of the Grobogan pilot are presented separately in
Appendix A.
3.3. Legal Data Quality
Results of legal data quality were compiled based on interviews with Grobogan and Tanggamus land officers on the 24th of September 2018. Both local land offices believed the errors found in PaLaR data collection were acceptable, as similar errors were also recognized in PTSL. Examples of errors included: typographical errors, wrong addresses, invalidated or missing identity numbers, and family card numbers, and underlying ownership letters from villages. In terms of legal data collection, there were no serious issues in the data recorded through the data collector app. It can be said that the legal data quality from PaLaR data collection was acceptable, or at least comparable to PTSL.
3.4. Results of Cost Assessment
The costs of the PaLaR project were covered by the land office using the same unit price per parcel as targeted in the PTSL activity. Hence, it can be said that the costs allocated to the PaLaR activities, particularly in dealing with CLRC mobilization and field data collection, was well-covered using the PTSL budget.
In Tanggamus:
Legal and spatial data collection for K1 (ready to be registered) was paid at IDR 85.000/parcel. This was done by the CLRC. At the time of the report, there were 532 land parcels ready to be certified.
Legal data verification and data processing were done by the local land office using the PTSL budget.
The total expense was estimated to be IDR 65.2 million, comprising IDR 45.2 million for data collection (fees to CLRC) and about 20 million for preparation and socialization. For 532 land parcels that were certified, this meant that the cost for land registration was about IDR 122.600 /parcel with PaLaR (before legal data processing and certification by the land office), i.e., the land registration cost was 8.4 USD per parcel before legal data verification and certification activities of the Local Land Office.
In Grobogan:
Legal and spatial data collection for K1 (ready to be registered) was IDR 50.000/parcel. The activity was done by the CLRC. In total, there were 686 parcels in K1 status (ready to be registered);
Preparation, logistics, and legal data verification support from the village office was paid by the local land office with the amount of IDR 7.500/parcel;
Legal data verification and data processing was done by local land office using the standard PTSL budget; cost: 90.000/parcel;
The certification process would be 10.000/parcel using the standard PTSL budget.
The total expense was estimated to be IDR 59.5 million, comprising IDR 39.5 million for data collection (fees to CLRC) and 20 million for preparation and socialization. For the 686 land parcels that were certified, this meant the cost for land registration was IDR 86.650 /parcel for socialization and data collection activities, i.e., the cost was 5.9 USD/parcel before legal data processing and certification by the Land Office.
PTSL implementation in Tanggamus (field survey cost for Area III) was set to IDR 214.980 (by government surveyor), or IDR 330.240 (by licensed surveyor). Meanwhile, field cost for Area V, e.g., Grobogan, was IDR 114.340 (by government surveyor) or IDR 170.000 (by licensed surveyor). The cost specified in the PTSL project was all-inclusive of hardware and software. For example, costs for utilizing GNSS receivers (L1/L2 types) and CAD/GIS software were the responsibility of consultant/private surveyors. The summary of the cost comparison between PaLaR and PTSL is given in
Table 5.
The calculation of the cost only considered land parcels with K1 and K3 status, as currently the government only considers K1 and K3 land parcels for project costing. As seen in
Table 6, the PaLaR method offered a lower cost than PTSL. However, it is important to note that this measure was not considered the following cost used in the pilots: the group discussions facilitated by participatory facilitators outside community and government organization and training, training resources, and hardware and software investments. The PaLaR method implemented in this study is comparable to adjudication and survey activities done by the community specified in the cost and financing guideline [
40]. Still, the output of PaLaR is comparable to the type of fix boundary demarcation of systematic registration activity. The use of technology and the collaboration between government, community facilitator and community representatives produced a value for the money solution for participatory land registration.
3.5. Results of Time Assessment
Using the data provided by the application system, the duration of spatial data collection for both Tanggamus and Grobogan can be summarized as follows:
Mapping Completion Time
Kuripan: Rice paddy 39.67 min, Farming land 37.21 min, Residential 20.39 min;
Wandankemiri: Rice paddy 30 min, Farming land 18.11 min, Residential 24.48 min.
One should consider the difference in field terrain between the two pilots. Tanggamus has a steep topography with some rolling areas, especially towards the forested mountain and farming areas. Meanwhile, Wandan Kemiri, Grobogan, has a plain topography. This may lead to differences in field survey times.
Meanwhile, the total duration of the legal data collection can be extracted from the data capture completion as follows:
Interview submissions: 16.3 days
Mapping submissions: 25.0 days
Drawing submissions: 26.4 days
Based on the data given, the time spent for the completion of data collection in the Tanggamus and Grobogan cases can be seen in
Table 6.
It could be concluded that the actual time spent for legal and spatial data collection in PaLaR, both in Tanggamus and Grobogan, was consistent at 11.8–11.9 days for spatial data collection and 4.3 for legal data collection. This clearly indicates that the PaLaR method could accelerate the spatial and legal data collection. According to the PTSL procedure, the data collection time should not exceed 60 days, in total, for each village.
3.6. Usability Issues of the Data Collector Application
With the data collection process having been divided into two main activities, i.e., spatial and legal data collection, the results of the usability assessments are presented in
Table 7. The focus of the usability assessment was limited to the apps used to support CLRC. The feedback on usability parameters was mainly taken from structured interviews with CLRC members in Kuripan (Tanggamus) and Wandan Kemiri (Grobogan).
In terms of collaboration mechanics in participatory mapping activities [
41,
42], the role of CLRC members as facilitators and the tablet as the map interface (enabler) was assessed based on the communication and coordination criteria.
3.6.1. Communication
Some notes that were considered important were:
Synchronized map (linked legal and spatial data) positively speed up the process of collecting legal data and land parcels’ claims.
Village leaders and CLRC skills/competency to facilitate discussion and communication, as seen in Tanggamus, accelerated the data collection progress.
Maps were used as media to facilitate discussions of village boundaries and distribution of land parcels in RT.
3.6.2. Coordination
In terms of coordination matters, some notes can be addressed to PaLaR pilots, including:
Synchronized maps on tablets were used to effectively schedule and plan daily targets;
Wrong identification of land parcels was minimized when maps were used and local knowledge from village leaders was well-applied in the process;
Efficient field surveys and legal data collection was coordinated visually among CLRC members;
Validation of legal and spatial data by the Land Office staff was based on the submitted data.
Collaboration mechanics, in terms of coordination and communication across stakeholders in community-based data collection, were not deliberately prepared. As a result, data collection and validation processes, as well as stakeholders’ interactions, were not clearly understood by all village leaders and CLRC members. Regarding mobile and GPS technology use, software usability and utility for supporting data collection were still not optimal. Lessons learned from the two pilots regarding effectiveness, efficiency, ease of learning, error tolerance, and usability of the interface suggested software improvements to optimize the potential benefits of community-centered land titling projects.
4. Discussion
Whilst the comparative analysis was organized around the themes of data quality and procedure quality, and the derivative attributes of positional accuracy, logical consistency, completeness, time, cost, and usability—here, the discussion uses the three overarching FFP LA themes of spatial framework, legal framework, and institutional framework, to organize the discussion.
Lessons learned regarding the FFP LA spatial framework are as follows. First, the use of very high-resolution drone/aerial imagery for boundary delimitation and legal data collection was found to increase the clarity of the data collection. Second, great efficiency was found in ensuing legal data collection was well integrated with spatial data collection. This improves the digital capture of documents, photographs, and personal identity that eases data integration and entry to the KKP. However, more efficient results could be derived by the local land office if the connection between KKP and the mobile app was made earlier during the mapping process to the data checks. This integration would ease CLRC members in detecting parcels that were already mapped and in avoiding overlapping ownership claims. Additionally, regarding the overall efficiency of two pilots, a faster field data processing and cheaper cost can be obtained by the community when a seamless synchronization between field data collection and the KKP is in place.
In comparison to the normal PTSL approach, the PaLaR spatial data collection was proven to be cheaper but the results were less accurate in comparison to the typical PTSL spatial parcel data. This assessment was an important finding from the pilots, given the normal fix boundary approach that PTSL did (using field and photogrammetry surveys) has produced approximately 20 million land parcels within three years. The parcel data has grown from about 1 million land parcels before PTSL to seven million parcels a year during PTSL project. Nevertheless, the completeness of spatial and legal data collection, as the two PaLaR pilots produced, seem to be more promising than the typical PTSL method produced. The spatial accuracy for PaLaR method can be improved once a higher precision dual GNSS antenna was used as the survey sensor for the data collector app. Thus, the PaLaR method would increase the level of spatial completeness while reducing the cost of registration per parcel significantly.
This paper argues that the detail assessments on the quality of the products and the usability of methods as well as cost and time efficiency resulted from the study could benefit professionals working in land administration in designing the standards and workflow for community-based systematic land registration activities. Rwanda project costs 7 USD/parcel [
43] and Laos pilot costs 15.1 USD/parcel [
44] applied the general boundary. Tanzania Pilot costs 14–48 USD/parcel [
45] and this Indonesia PaLaR Pilot costs 12.5 USD/parcel applied a mix solution that tends towards the fix boundary. The collaborative work of community committee and government and NGO supported with a low-cost digital survey and mapping platform in Indonesia pilot promises completeness and low-cost solution for a country-context FFP implementation. According to costing and financing land administration system (COFLAS) guideline [
40], the similar output to PaLaR (fix boundary with little to big investments of GNSS network) would cost from 10–50 USD/parcel.
The outcome of this research is relevant to justify that FFP LA implementation is more than just switching from a field survey to aerial imageries in determining boundary points. As demonstrated in the pilots, the spatial framework can be solved through the participatory approach with the help of mobile technology. However, the biggest challenge is a lack of guidelines to relax institutional arrangements and legal incentives to attract landowners [
46,
47] to participate in the process entirely until their land certificates are delivered. Although the CLRC mapped all land parcels eligible for first titling in two villages, many landowners were still not submitting the registration requirements until the pilots were over. These failures to complete land registration were caused by several reasons, which have not been confirmed by the landowners. However, the CLRC told authors that some landowners voiced concerns regarding future yearly tax and informal payments after their lands are certified. Some others informed the CLRC about their internal family disputes regarding property inheritance, which makes land certification impossible to take place. After the pilot finished, we also learned that few landowners had less trust for village leaders. The real reasons why eligible landowners avoid participating in the first titling campaign are essential issues to explore which are not the focus of this paper, see, e.g., [
48]. However, this information strengthens the research topic questioning the relationship between the formal certification and the community perceived security to their property [
8,
9], or land registration effectiveness [
49], which are very diverging and heterogenic in developing countries [
50].
Four parties collaborate during the pilots, i.e., government, village leaders, community, and community facilitator. FFP LA literature has mainly focused on data collection processes [
4,
7,
51], especially on the use of aerial photos/satellite imageries to solve boundary determination issues. The literature that evaluates the community as the central actor in the participatory adjudication process for a systematic land registration project is very few if not available [
23]. The key for successful participation during the two pilots includes information delivery and clarity regarding the objectives and significance of the project as well as its benefits to the community. This information transformation took place during the socialization and the training. The government surveyor and administrator could then focus on the quality check of the collected data. We also learned that trust to the village leader as well as signs of a trustworthy process are essential for systematic land registration, see [
5,
48]. Although the two pilots successfully collected spatial and legal data, follow-up actions of individual landowners to process further the formal land registration, which includes submitting signed forms and making registration payments have proven problematic. This research has not delved into the investigation of the real reasons behind landowners’ decision to decline from the formal registration.
In terms of the legal framework, the current statutory requirement was fulfilled by the PaLaR method and it was compliant with the PTSL land registration method, in a way that fixed the boundary survey for residential areas. Moreover, visible boundary determinations using photogrammetric methods for paddy fields and farmland were done effectively within the community (see
Appendix A—
Appendix A.1). In terms of legal mandate, community members acted as data collectors, while local land offices acted as data validators. One issue still remains: contradictory boundary delimitation requires landowners and neighbors to agree and be in place during data collection. In the PaLaR pilots, this was still challenging in cases where existing landowners were living in other cities. From the pilots, it was shown that better participatory aspects in the PaLaR process, than those in PTSL approach, does not automatically mean a higher willingness for the community to register their land. Until the pilots were finalized, many land parcels were still in K3 status, as owners and their families did not show up to submit their signed registration forms and to show their original documents to the land officers. Legal instruments and incentives to ease their participation could increase their trust in the government’s land registration projects and thus reduce K3 problems. It is also thought that if boundary mapping could be a compulsory activity in each village, this will be promising for field validation, which is necessary to reduce unmapped certificates or K4. In this regard, all landowners, or their trusted representatives, who are receptive to the committee, will participate; otherwise, specific disincentives could emanate from the government. Government-facilitated participatory data collection with the PaLaR method needs legal backup (i.e., ministry regulation) to run smoothly.
Regarding institutional arrangements, the CLRC, or the committee, was set up by community members themselves and endorsed by the village and higher rank government officers. The composition of the CLRC should represent trusted community members or village leaders (seen as a trusted intermediary) from both genders, in order to make the data collection process trusted and followed by all landowners. Village leaders, who usually have strong knowledge of the history of the village and its land, were important in providing explanations to landowners and in mediating any land boundary disputes. Young residents were usually familiar with digital technology and were also expected to be active in assisting senior leaders in data communication to help mediate disagreements and conflicts. From the pilots, it was clear that transparency in managing the project budget at the community level was required from the beginning. This included transparency in financial allocation for CLRC members; salaries needed to be agreed upon local land offices, village offices, and the PaLaR team before the project could start. Further adoption of FFP LA principles in order to meet the country’s specific context, as suggested by Barry (2018) was made. For example, the strategy to set up a village committee as a formal team to conduct survey and mapping activities to all applied land boundaries rather than the boundary delineation only was made.
Coordination and activity arrangements facilitated by local offices should be done among all stakeholders. Budget specifications should be specified at the beginning of the project, including contracts and agreements with CLRC. As argued in
Section 4, PaLaR offers an accelerated time and cost-effectiveness for governments. Still, a legal framework for enabling the PaLaR budget model (with some improvements), to facilitate PaLaR implementation needs to be developed.
5. Conclusions
This work sought to explore whether an even more participatory approach to land registration in Indonesia, underpinned by FFP LA principles, could compare and even improve on the existing approach with respect to data quality and procedural effectiveness. In this regard, the developed PaLaR methodology was used to successfully create two complete village parcel maps in Kuripan, Tanggamus, and Wandan Kemiri, Grobogan. Although PaLaR lacked point accuracy compared to the reference data, their polygonal area differences were considered sufficiently small, at 5%, to comply with the current system requirements. The differences between the textual and graphical area led to an aerial validation of the cadastral map that was assumed to be relevant for this work. In this regard, according to FFP LA principles [
26], as discussed earlier, PaLaR suits local circumstances and can represent a complete title recording process with legal data quality and logical consistency. Eventually, the less accurate spatial boundaries (in comparison to the reference data) can be improved by replacing low-cost GNSS devices, as used in PaLaR, with more accurate, but more expensive, double frequency antenna GNSS receivers. Though in remote areas, where the canopy is very dense and topography varies heavily, and in areas where radio or internet connections did not exist, as seen in the hilly part of Kuripan Tanggamus, neither low nor high-cost GNSS will be useful.
The PaLaR pilot offered good prospects in regard to time efficiency that could be useful in accelerating land parcel mapping and registration. Using the PaLaR method, spatial data collection was completed within 11.8 days for each campaign in Tanggamus and Grobogan. The actual time to complete the legal data collection was 4.3 days. This is faster than the data collection using PTSL. However, the overall time to organize and complete participatory data collection still depends, among other factors, especially on community awareness as well as CLRC and local office preparedness. The method can be made more efficient when the connection to national land databases can be established. In this way, existing land boundaries and their corresponding data can be accessed by CLRC through the mobile app so overlapping surveys and duplication can be prevented.
The PaLaR pilot provides a good showcase for possibly cheaper (using only 36%–69% PTSL budget allocation) data collection for a possible countrywide FFP LA application for rural areas in Indonesia. The total money requested to collect spatial and legal data, as well as to create a complete village parcel map, was 8.4 USD/parcel before legal data processing and titling by land offices in Kuripan, Tanggamus and 5.9 USD/parcel before legal data processing and certification by the land office in Wandan Kemiri, Grobogan. However, it should be noted that the costs mentioned here were only related to data collection involving CLRC (before legal data processing and certification), while hardware and software investments, training, supervision, and validation costs were not considered and depend on the chosen tools and technologies. Nevertheless, the budget simulation from PaLaR pilots provides outstanding value for money that competitive to other similar projects [
43,
44,
45]. Additionally, a budgeting standard to support these community projects needs to be well-formulated. The authors suggest an extra-budgetary allocation to facilitate community participation enabling second-round field validation and information completion through the committee. This would ensure both quantitative and qualitative validity of mapped land information.
Many aspects related to technology used in the new approach, as demonstrated in the PaLaR project, should be reconsidered. More flexible but clear legal and institutional frameworks to enable CLRC with the support of NGOs (e.g., JKPP facilitators), working as para-surveyors in the process of data collection and verification, should be in place. Registrars and government surveyors in local offices should step back and take more a role as facilitators and validators of the results. This shift paradigm from “data collector” to “data validator and quality assessor” for government surveyors deserves attention and consideration. The expected changes should also include improvements in the policy for national surveys and improvements of budgeting standards when the PaLaR method is implemented as a mix of government-facilitated and community-centered land registration projects.

 ,
, 


