Article

Effect of Land Use and Land Cover Change on Soil Erosion in Erer Sub-Basin, Northeast Wabi Shebelle Basin, Ethiopia

by
Gezahegn Weldu Woldemariam
1,* and
Arus Edo Harka
2
1
Geoinformation Science Program, School of Geography and Environmental Studies, Haramaya University, P.O. Box 138, 3220 Dire Dawa, Ethiopia
2
Hydraulic and Water Resources Engineering Department, School of Water Resources and Environmental Engineering, Haramaya Institute of Technology (HiT), Haramaya University, P.O. Box 138, 3220 Dire Dawa, Ethiopia
*
Author to whom correspondence should be addressed.
Land 2020, 9(4), 111; https://doi.org/10.3390/land9040111
Submission received: 1 July 2019 / Revised: 4 August 2019 / Accepted: 10 August 2019 / Published: 5 April 2020

Abstract

:
Land use and land cover change (LULCC) is a critical factor for enhancing the soil erosion risk and land degradation process in the Wabi Shebelle Basin. Up-to-date spatial and statistical data on basin-wide erosion rates can provide an important basis for planning and conservation of soil and water ecosystems. The objectives of this study were to examine the magnitude of LULCC and consequent changes in the spatial extent of soil erosion risk, and identify priority areas for Soil and Water Conservation (SWC) in the Erer Sub-Basin, Wabi Shebelle Basin, Ethiopia. The soil loss rates were estimated using an empirical prediction model of the Revised Universal Soil Loss Equation (RUSLE) outlined in the ArcGIS environment. The estimated total annual actual soil loss at the sub-basin level was 1.01 million tons in 2000 and 1.52 million tons in 2018 with a mean erosion rate of 75.85 t ha−1 y−1 and 107.07 t ha−1 y−1, respectively. The most extensive soil loss rates were estimated in croplands and bare land cover, with a mean soil loss rate of 37.60 t ha−1 y−1 and 15.78 t ha−1 y−1, respectively. The soil erosion risk has increased by 18.28% of the total area, and decreased by 15.93%, showing that the overall soil erosion situation is worsening in the study area. We determined SWC priority areas using a Multi Criteria Decision Rule (MCDR) approach, indicating that the top three levels identified for intense SWC account for about 2.50%, 2.38%, and 2.14%, respectively. These priority levels are typically situated along the steep slopes in Babile, Fedis, Fik, Gursum, Gola Oda, Haramaya, Jarso, and Kombolcha districts that need emergency SWC measures.

1. Introduction

Soil erosion is a complex three-phase dynamic process involving detachment and transport of the particles or aggregate topsoil by the physical forces of wind, water, and gravity (mass movement) and immediate sediment deposition in downstream areas [1,2,3,4,5,6,7,8]. Water-induced soil erosion is indeed the most important land degradation problem worldwide [3,4,5]. Soil erosion has been documented as one of the greatest global problems that result in serious threats to natural resources, agriculture, and the environment [1,2,3,4,5,6,7]. Erosion displaces soil organic carbon and the most important nutrients, and consequently affects vegetation growth, biodiversity, and overall sustainability of ecosystem services and functions [2,3,4,5,6,7,8,9]. Soil erosion can also cause severe environmental problems, including soil and water degradation, a decrease in land productivity, and eutrophication and sedimentation of water bodies [3,4,5,6,7,8,9,10,11]. Numerous studies have reported that the magnitude of soil erosion rates has been accelerating worldwide due to land use and land cover change (LULCC) and inappropriate land use and management practices resulting in widespread land degradation process [2,3,4,5,12,13,14,15,16,17,18]. The global annual average potential soil loss due to water-caused erosion was estimated at 35 billion tons in 2001 [4]. LULCCs have been accounted for an overall increase of 2.5% in the global average soil erosion between 2001 and 2012 [4]. According to the study by the Global Soil Partnership (GSP) [13], around 75 billion tons of topsoil is lost annually due to erosion from the arable land worldwide that is equivalent to about $400 billion losses in agricultural production. In connection to this, the Food and Agriculture Organization (FAO) of the United Nations and Intergovernmental Technical Panel on Soils [14] stated that “if action is not taken to reduce erosion, total crop yield losses projected by the year 2050 would be equivalent to removing 1.5 million km2 of land from crop production–or roughly all the arable land in India”. In the developing countries where the overall economy and the livelihood of a majority of the population depend on the productivity of their land, the displacement of the most productive topsoil layer by erosion and a poor conservation practices have resulted in the reductions in agricultural production and land productivity potential and contributing to food insecurity [18,19].
With a population of about 107.53 million (estimated as of December 2018) growing at an annual rate of 2.46%, Ethiopia is the most populous landlocked country in the continent of Africa, and the second-most populous nation in Africa [20]. Agriculture sector, which accounts for about 50% of the Gross Domestic Product (GDP), 85% of the total export revenue, and over 80% of the total employment, is the main source of the country’s economy [21,22,23,24,25]. The great majority of the population is dependent on subsistence agriculture that is an overwhelming vulnerable to the recurrent droughts and land degradation [21,22,23,24,25,26,27,28]. Rapid population increase and growing demand posed a greater pressure on land resources, leading to severe soil erosion and land degradation in various parts of the country. To cope with the worsening environmental problems, a series of Soil and Water Conservation (SWC) programs have been launched in Ethiopia since the 1970s and 1980s [29]. Despite conservation measures taken over the past decades, land degradation is continued to threaten crop production and land productivity potential, and negatively affecting livelihood systems, food security, and the country’s economy [29,30,31,32]. It was estimated that the land degradation cost to an annual agricultural GDP range from 2% to 6.75% [21]. The loss of topsoil by water erosion in Ethiopia was estimated at 1.5 billion tons per annum with a mean erosion rate of 42 t ha−1 y−1 [27,28]. However, the magnitude of soil erosion rates varies across the physiographical regions in the country.
The Ethiopian highland, which covers about 44% of the country’s total geographical area and sustains the livelihood of about 87% of the population, is the most eroded physiographical regions in the country [33,34,35]. The estimated annual soil loss from the highland areas varies widely from 200 t ha−1 y−1 to as high as 300 t ha−1 y−1 [36,37,38,39,40]. Intense rainfall, low vegetation cover, rugged topography, and anthropogenic factors are thought to be the most important factors contributing to a higher rate of soil erosion. Deforestation, agriculture land and urban expansion, cultivation in upslope areas, uncontrolled and overgrazing were the major anthropogenic drivers of soil erosion in the highland areas of the country [27,38,40]. A report from the Soil Conservation Research Program (SCRP) indicates that almost 50% of the Ethiopian highlands were seriously eroded, while 4% of the highland areas have reached a level of irreversibility that they will no longer give economic productivity in the foreseen future [38,39].
Assessing and mediating the untoward effects of soil erosion risk while increasing productivity of land resources has become the key concern of policymakers and conservation planners around the world [5,11,15,16,17,18,41,42,43]. In order to control erosion risk at river basin and watershed scales, there is a need to predict spatially distributed rates of soil erosion and sediment yield [18,44,45]. Given the complexity of interplays among and within the physical and hydrological factors that involved soil erosion (e.g., topography, rainfall, vegetation cover, soil, and land use) and soil conservation practices, consistent estimation of soil loss rates in the river basins and watersheds remains a key challenge in soil erosion study [17,46,47,48]. The integration of hydrological models with a comprehensive geospatial dataset on the biophysical and the hydrological driven factors that cause soil erosion has been recognized as a promising approach for estimation of soil loss and sediment yield.
Over the past decades, numerous hydrological models ranging from relatively simple empirical models to more complex physically based prediction models have been developed for the derivation of spatially variable factors and estimating their combined effect on soil erosion and sediment yield [49,50,51,52,53,54,55,56,57,58,59,60,61,62,63]. As compared with the physical-based models, the empirical models are the widely used prediction tools due to their minimal data required and ease of application to estimate soil loss rates at a regional and global scale [4,44]. Among these models, the Revised Universal Soil Loss Equation (RUSLE) [54], which is a derivative of the Universal Soil Loss Equation (USLE) [50], is the most frequently applied model for predicting the long-term average annual soil loss caused by raindrop splash and runoff [63,64]. Recently with the advancement of satellite remote sensing and Geographic Information Systems (GIS), the adoptability of an empirical prediction model of RUSLE is considerably enhanced and soil erosion assessment at different spatial and temporal scales has become possible [4,45]. The RUSLE model have been extensively used in the various parts of the world for soil loss estimation and conservation planning by assimilating them with remotely sensed data and GIS method [2,3,4,5,11,64,65].
In the Upper Wabi Shebelle Basin, which is located in Ethiopia, soil erosion and land degradation have become serious environmental problems over recent decades. The combination of LULCC, steep slopes, climate, and unsustainable land management practices were found to be the influential factors aggravating the erosion problem at different scales [18,66,67,68,69,70,71,72,73,74,75]. Up-to-date spatial and statistical data on basin-wide erosion rates can provide an important basis for planning and conservation of soil and water ecosystems. Studies previously conducted in the Upper Wabi Shebelle Basin typically covered small catchment or watershed, and focused the assessment of soil loss, runoff, sediment yield, and groundwater recharges [18,67,68,69,70,71,72,73,74,75]. Such studies have been mainly supported by remote sensing data and GIS-based hydrological models. For instance, Senti et al. [71] examined soil erosion and sediment yield in the Lake Haramaya Catchment of eastern Ethiopia by using the Soil and Water Assessment Tool (SWAT) and Modified Universal Soil Loss Equation (MUSLE) models. They found that the anthropogenic drivers were major causes attributed to severe soil erosion occurring in the catchment [71]. Moreover, Woldemariam et al. [18] applied the RUSEL, GIS, and a Multi Criteria Decision Rule (MCDR) method to identify priority areas for SWC measures based on the severity levels of soil erosion risk in the Gobele Watershed, East Hararghe Zone, Ethiopia. Selecting the Lafto watershed in the Upper Wabi Shebelle Basin as their study area, Ayala et al. [68] applied the SWAT model to investigate the sensitivity of rainfall-runoff and sediment yield to SWC measures. Likewise, Megersa [69] conducted a similar study with an emphasis on Erer-Guda catchment and reported that the magnitude of rainfall-runoff and sediment yield was considerably higher on cultivated land than in another land covers. Furthermore, Gebere et al. [75] examined the impact of LULCC on the groundwater recharges of the Lake Haramaya Watershed in the East Hararghe Ethiopian highland. However, none of the past studies addressed how the patterns and the process of LULCC have changed the spatial extent of soil erosion risk over the past decades. Therefore, this study was intended to (i) assess the magnitudes of LULCC between 2000 and 2018; (ii) examine consequent spatial changes among erosion risk categories; and (iii) identify priority areas for SWC based on the severity levels of soil loss and erosion risk in the Erer Sub-Basin, Wabi Shebelle Basin, Ethiopia. The findings of the present study can provide an important foundation in planning a future intervention to minimize the untoward impacts of soil and water resource degradation in the study area. This study is also important to land degradation neutrality voluntary national target and strategy of Ethiopia [31], which is aimed to attain the land degradation neutral environment throughout the country by the year 2040.

2. Materials and Methods

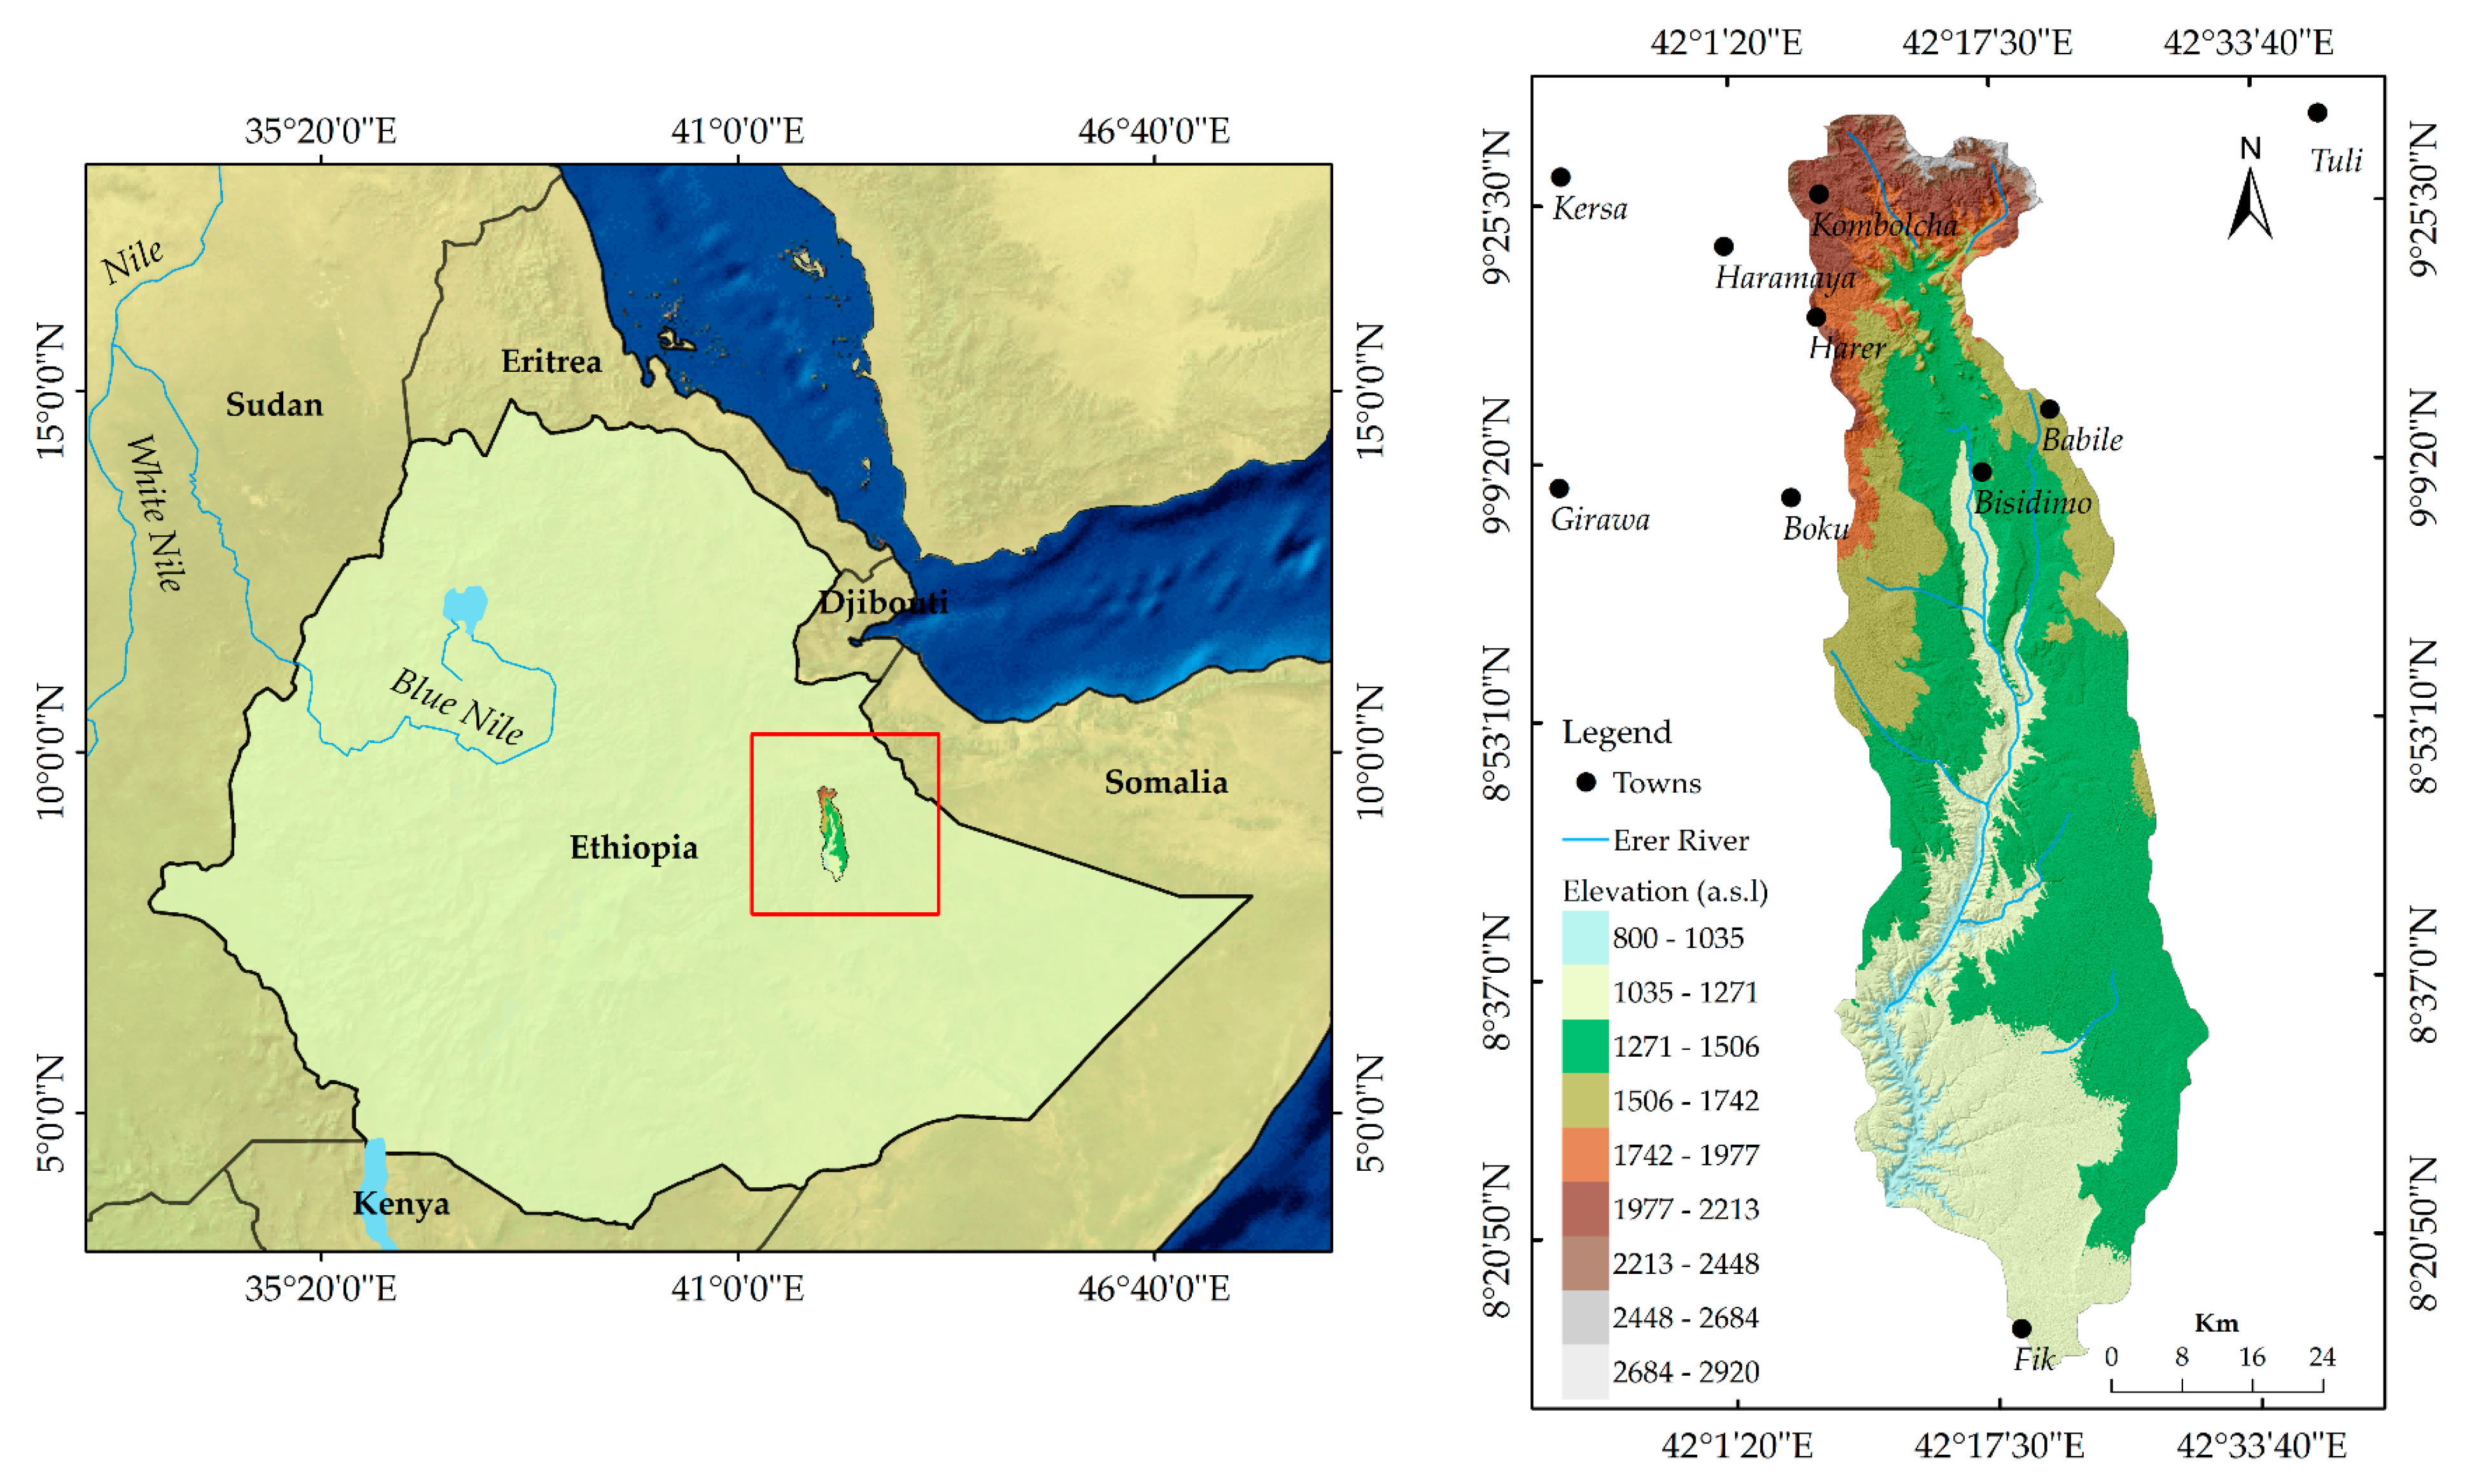
2.1. Description of the Study Area

The Wabi Shebelle Basin is one of the transboundary river basins in East Africa and a highly important basin in Ethiopia. This study was carried out in the Erer Sub-Basin within the Upper Wabi Shebelle Basin, which is located, geographically, between 08°12’35” N to 09°31’07” N latitude and 42°04’27” E to 42°31’07” E longitude with an elevation range of 800–2920 meters above mean sea level (Figure 1). The drainage area of the Erer Sub-Basin is about 3860 km2 of which, about 73.5% is classified as Kolla (warm semiarid), which ranges from 500 to 1500 meters, while Woinadega (cool sub-humid; 1500–2300 meters) and Dega (cool humid; 2300–3200-meters) account for about 25.12% and 1.36%, respectively, of the total drainage area [76]. The mean annual rainfall ranges between 744 and 1017 mm (based on data from three meteorological stations: Kombolcha, Babile, and Bisidimo) and mostly occurs during summer [77]. The mean monthly maximum temperature reaches up to 29.95 °C and a mean monthly minimum air temperature reaches up to 16.72 °C [77]. The dominant soil types include Calcaric regosols, Eutric nitosols, Eutric regosols, Dystric cambisols, Haplic xerosols, and Humic cambisols, with a proportion of each class contributing 4%, 8%, 20%, 19%, 49%, and 16%, respectively, of the total study area [78].

2.2. Data Collection

Four geospatial datasets collected from different sources were used in the present study, namely: rainfall data, Landsat satellite imagery, digital elevation model (DEM), and soil classification map. The average annual rainfall data for the period of twenty years (1998–2018) with fifteen meteorological stations (Babile, Bedeno, Boku, Bisidimo, Fik, Girawa, Haramaya, Harer, Jijiga, Kersa, Kombolcha, Kulubi, Legehida, Majo Weldya, and Tuli) was obtained from the National Meteorological Agency (NMA) of Ethiopia [77]. We used multispectral satellite data from Landsat 5 Thematic Mapper (TM) image (Path 166/Row 54) acquired on14 January 2000 and Landsat 8 Operational Land Imager (OLI) image (Path 166/Row 54) acquired on 20 March 2018. The Landsat images were retrieved from the United States Geological Survey (USGS) website via Landsat Look Viewer [79]. Moreover, the field survey and observations were conducted during January–March 2018 to collect ground truth data correspond to LULC classes of interest throughout the study area. We used a handheld Global Positioning System to mark the spatial locations of the reference data. Due to a constraint of field data, Google Earth Image was employed to collect reference samples for the 2000 image classification and accuracy assessment. LULC classes of the samples include bare land, cropland, forestland, settlement, shrubland, and water bodies. We identified the sampled LULC classes based on the field survey and previous experience about the study area. A total of 450-ground truth data was collected for the two-study period from the field stratified randomly to LULC classes and the high-resolution Google Earth image.
The DEM of a 30m pixel size was provided by the Ministry of Economy, Trade, and Industry of Japan and the National Aeronautics and Space Administration (NASA) [80]. In addition, the soil classification map and the attribute value of the soil classes were downloaded from the FAO Harmonized World Soil Database (HWSD) in the Environmental System Research Institute (ESRI) shapefile format [78]. A description of the soil classes is given in Table S1.

2.3. Methods

2.3.1. Delineation of the Sub-Basin Area

We performed the raster analysis based on the terrain data of the DEM [80] with a grid resolution of 30 m × 30 m and delineated the Erer Sub-Basin boundary using the Arc-Hydro extension tools in the ArcGIS software version 10.5 (Environment Systems Research Institute (Esri), Inc. Redlands, CA, USA).

2.3.2. LULC Classification

The LULC data of the Erer Sub-Basin was interpreted using satellite imagery from TM and OLI sensors. The two Landsat images were preprocessed to correct the inherent geometric, radiometric, and atmospheric distortion to produce more accurate interpretation results with actual ground scenes representation [81,82]. Of the spectral bands, each single-band image in the visible (blue, green, and red) and near infrared (NIR), and shortwave infrared (SWIR) spectral bands of TM (1–5,7) and OLI (2–7) sensors, with a 30 m pixel size, were combined to develop a multi-band composite images [83]. These spectral bands were chosen for their values in discriminating soil/vegetation, water body, and urban features [83]. A portion of Landsat images covering an area of interest (AOI) was extracted using the vector shapefile of the study area and the subset tool in ERDAS IMAGINE® software version 2015 (Intergraph Corporation, Huntsville, AL, USA). A preprocessed Landsat satellite images were classified into separate maps of LULC classes using a pixel-based supervised maximum likelihood classifier (MLC) approach. Based on Level 1 of the Anderson classification system [84], the six LULC classes identified in the study area—bare land, cropland, forestland, settlement, shrubland, and water body—have been classified for the 2000 and 2018 images separately.
Prior to change detection analysis one should assess the classification accuracy of LULC data generated from remotely sensed data to check the level of agreements between the reference samples and the classified images. In this study, the accuracies of the classified LULC image for 2000 and 2018 were validated using ground truth data. Out of 450-ground truth data generated based on the stratified random sampling method for the LULC classes, 150 reference points were used as training data for image classification. The remaining 300 references were used to validate the accuracy of the classified satellite image of the respective years. Overall accuracy, user and producer accuracies, and the Kappa (K^) coefficient were generated from the error matrices.

2.3.3. LULCC Analysis

The classified LULC imagery for 2000 and 2018 were overlaid in order to drive a cross-tabulation matrix showing the spatial conversions among LULC categories between 2000 and 2018. The diagonal entries indicate the amount of LULC categories that remained unchanged between Time 1 and Time 2, whereas the off-diagonal elements account for a conversion from one class to another LULC classes [85,86]. The change detection matrix was further analyzed in order to calculate gain, loss, persistence, net change, total change, swap, and gain to persistence, loss to persistence, the net change to persistence for each LULC category between Time 1 and Time 2 [85,86,87]. The loss column represents the amount of loss for a LULC category i between Time 1 and Times 2, while the gain row indicates the amount of gain for a LULC category j between the same periods [85]. The swap change incorporates the amount of both loss and gain to account for a LULC category lost in a given site to the corresponding gained in another site [85]. The computation of the swap change for a LULC category j requires pairing a grid cell of both gain (i.e., the differences between the column totals and persistence) and loss (i.e., the differences between the row totals and persistence) of a land category j (Equation (1)) [85].
S j = 2 min ( P j + P jj ; P + j P jj )
where S j is the amount of swap; P j + is a column sum of a land cover category; P jj is the amount of persistence in a land cover category; and P + j is the sum row amount of a land cover category.

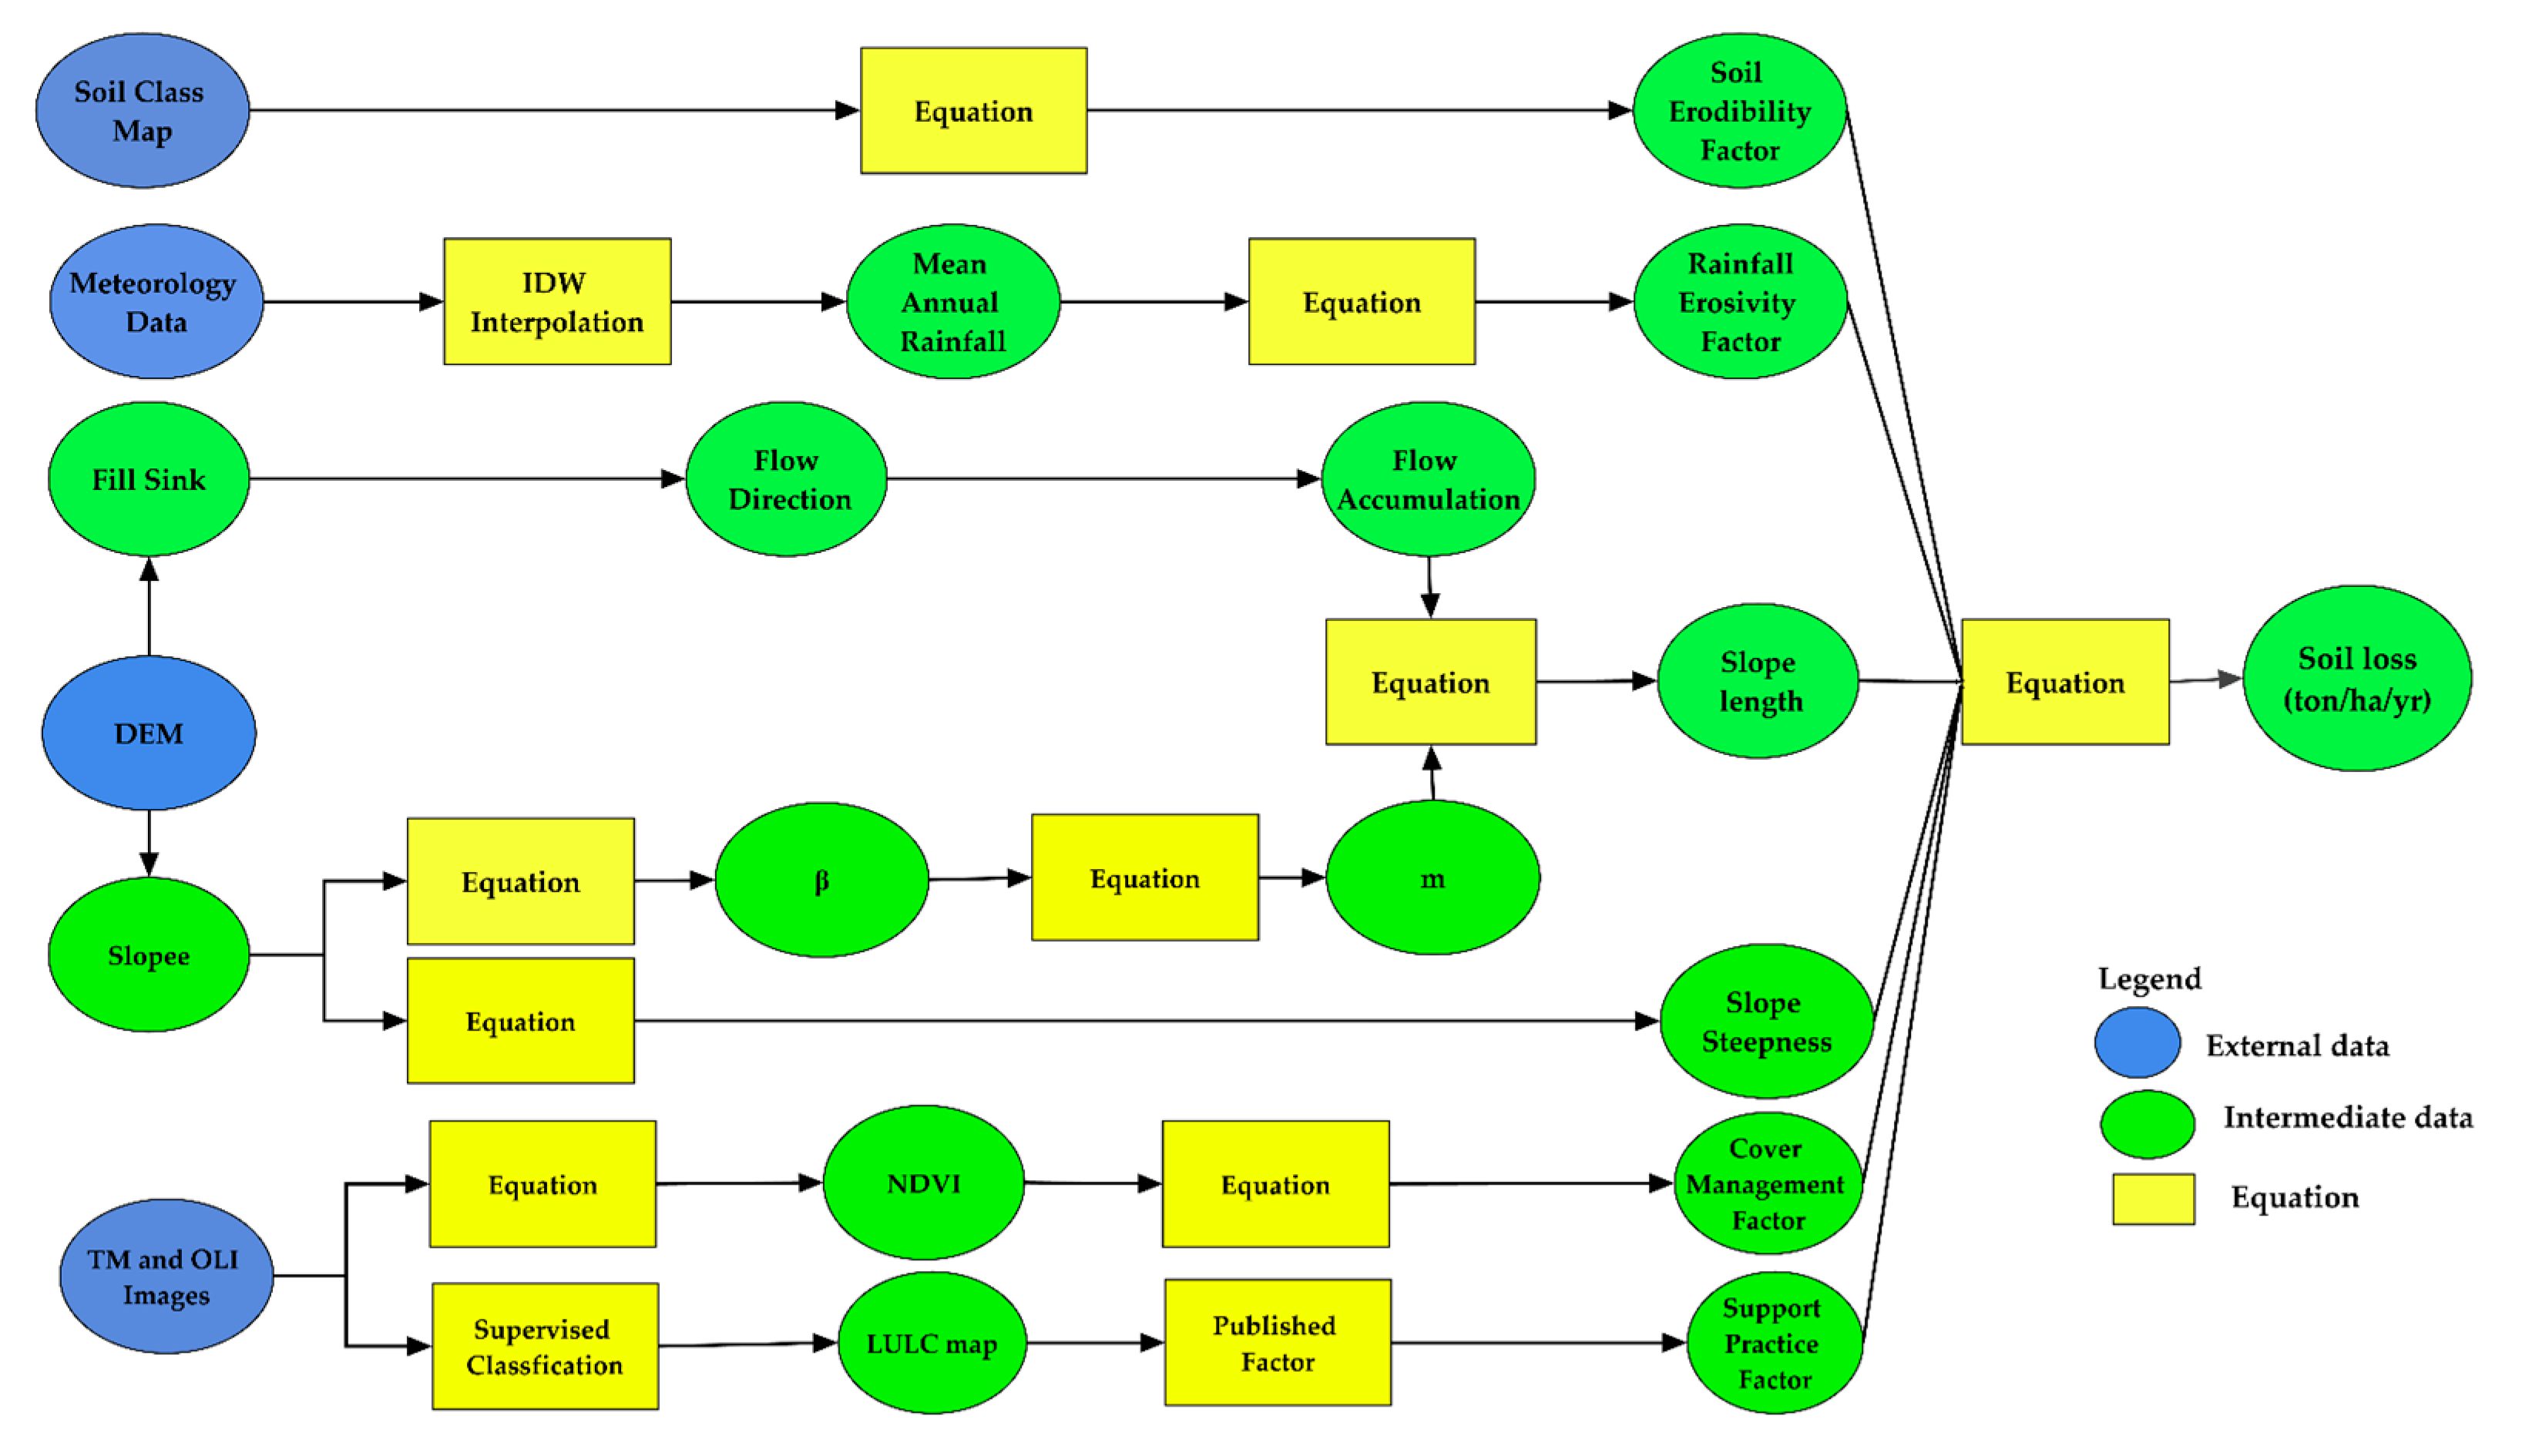
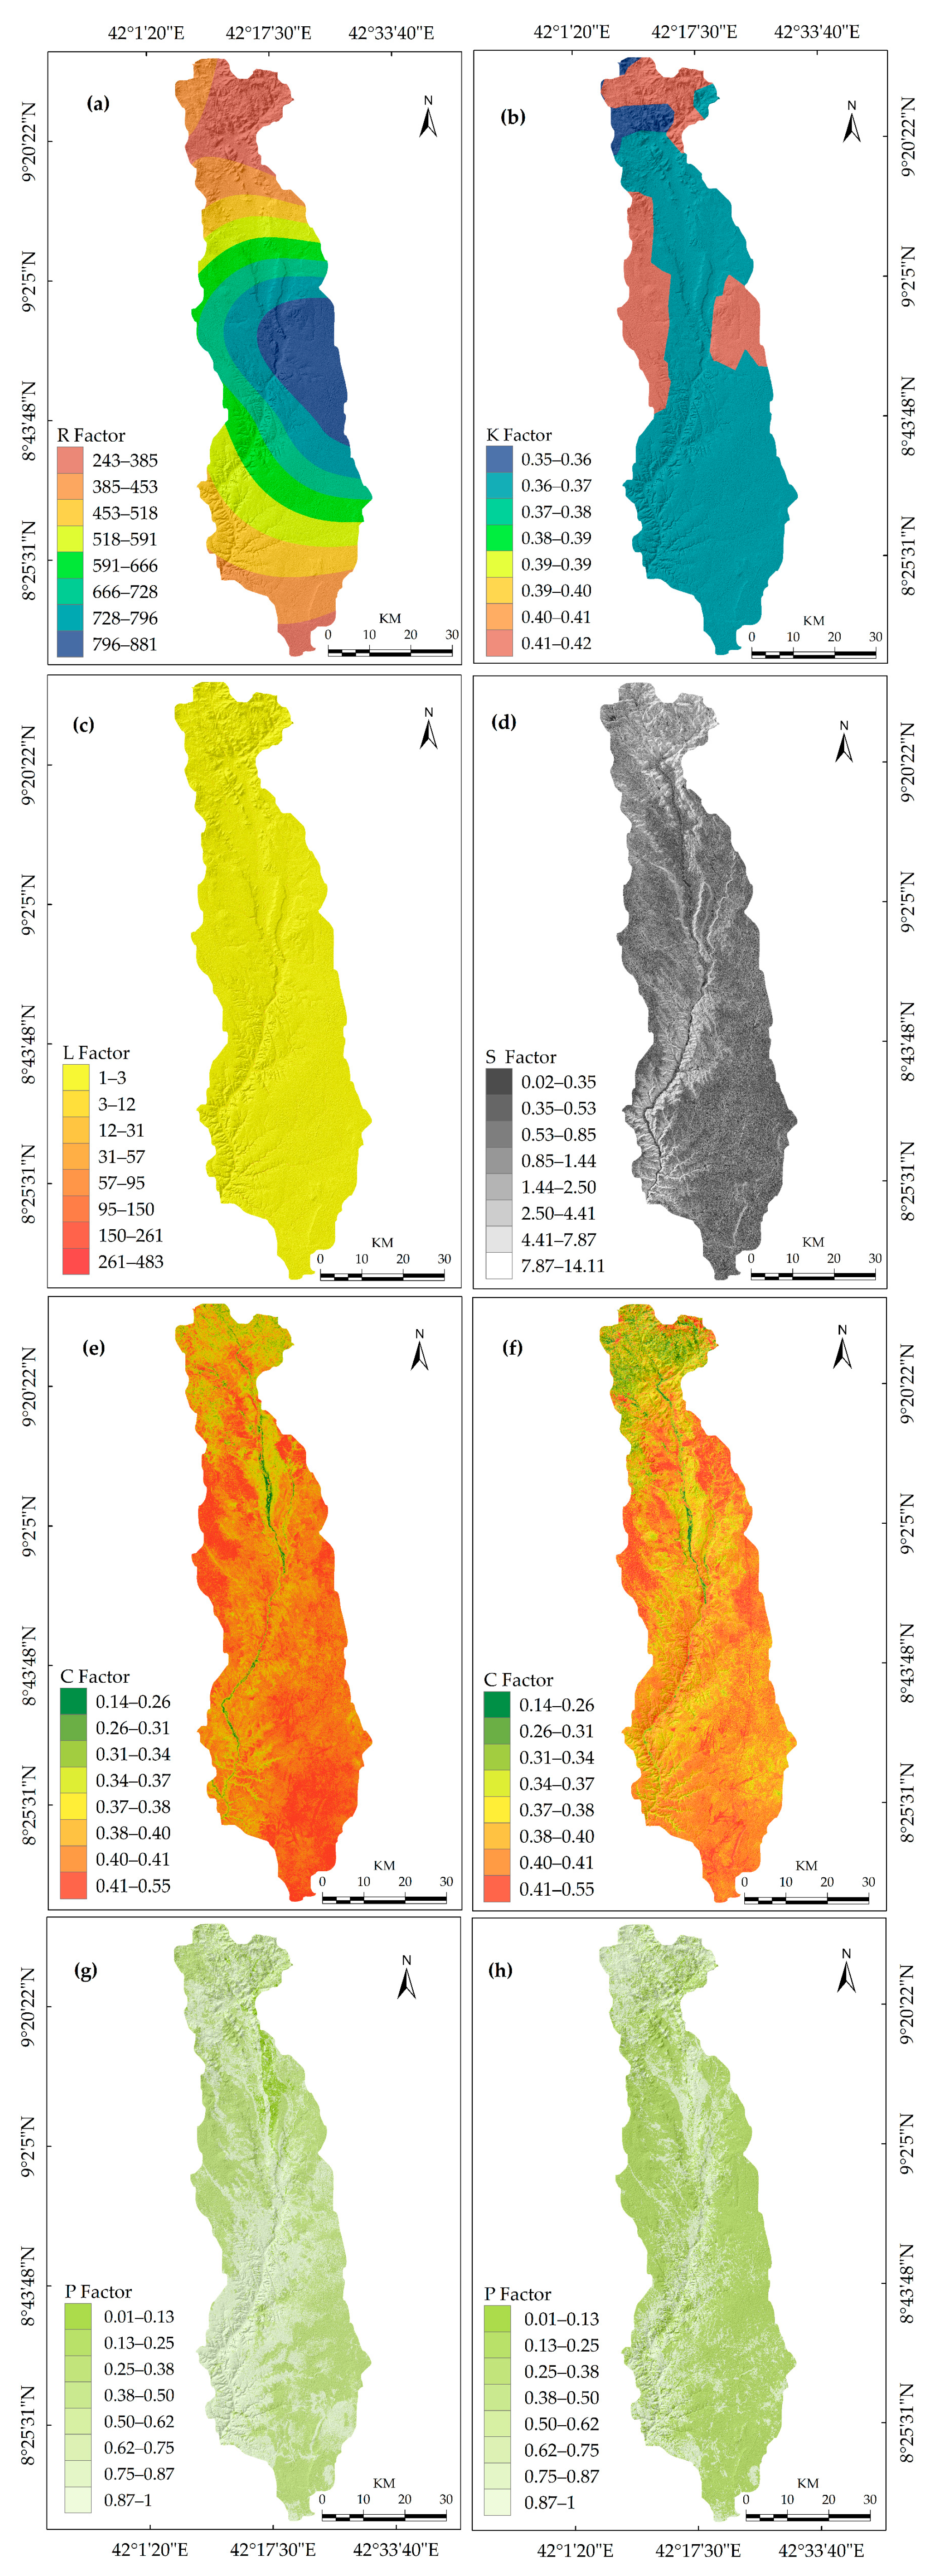
2.3.4. Determination of the RUSLE Factors

The empirical prediction model of RUSLE is a widely applied tool to estimate the long-term average annual soil loss from hillslopes due to rainstorm power and runoff [63]. Over the recent decade, the RUSLE and its adapted versions have been successfully tested at various hydrological basins and watersheds under different topography, climate, soil, and land-cover conditions [4,5,16,17,18,64,65]. In this study, the RUSLE model is chosen due to its adaptability at different spatial scales with a relatively minimal data required and easy to integrate with the ArcGIS environment for predicting soil loss [4,44]. Six input factors required for model application such as rainfall erosivity, soil erodibility, slope length and slope steepness, cover management, and conservation support practices (Figure 2) [52] were integrated using the model builder interface embedded in the ArcGIS software version 10.5 (Environmental Systems Research Institute (Esri), Inc., Redlands, CA, USA). Applying the nearest-neighbor method, all of the model factors derived from a multisource dataset with different spatial resolution were resampled to a 30 m × 30 m cell size and reprojected to a standard spatial reference system of World Geodetic System 1984 spheroid, Universal Transverse Mercator, and Adindan Zone 37 N. The RUSLE model equation is expressed as [54]:
A =   R × K × L × S × C × P
where A is average annual soil loss per unit area; R is the rainfall-runoff erosivity factor; K is a soil erodibility factor; LS is a slope length-steepness factor; C is a cover management factor; P is a support practice factor.
Figure 2 shows an overall framework established in the ArcGIS environment for the integration of six input factors, derived from multisource spatial datasets, into the RUSLE model to estimate the soil loss rates in the Erer Sub-Basin. The model was run to estimate the actual annual rates of soil loss in the study landscape for the years 2000 and 2018. The soil erosion risk within the study area was classified into eight categories, based on previous work by Uddin et al. [5], and the estimated mean soil loss rates (t ha−1 y−1): very low (< 5), low (5–10), low medium (10–15), medium (15–20), high medium (20–25), high (25–35), very high (35–50), and extremely high (>50). Areas with a mean annual soil loss rates lower than low were rated as tolerable soil loss limit [52]. We created a cross-tabulated change detection matrix by overlaying the erosion risk maps pixel-by-pixel and calculated the percentage change, persistence, gain, loss, net-change, and a net-change-to-persistence ratio of erosion risk classes between 2000 and 2018. Moreover, SWC priority areas were identified and mapped based on the severity levels of soil erosion risk and a cross-tabulated matrix showing changes among erosion risk classes between the observed periods. Prioritization was done based on an MCDR method. We followed the methodological framework of Zhang et al. [88], who tested the capability of an MCDR approach in identifying priority areas to control soil erosion.

Rainfall and Runoff Erosivity Factor (R)

Rainfall-runoff erosivity is the primary factor causing soil erosion and accounts for about 80% of the soil loss [52,89]. The R factor is an index that reflects the capability of rainfall-runoff to detach and transport the soil particles that are experimentally determined by taking into consideration the intensity and a maximum duration of rainfall in a particular area of interest (Figure 3a) [52,87,88,89,90,91,92]. The R factor value was calculated based on mean yearly precipitation for the period 1998–2018, computed as the mean of total rainfall at fifteen local metrological stations distributed across the sub-basin, using the erosivity computation formula of Lo et al. [92]:
R = [ 38.46 + ( 3.48   ×   P ) ]
where P is an annual average rainfall (mm).

Soil Erodibility Factor (K)

The soil erodibility factor, K, represents prolonged influences of soil profile characteristics and inherent soil properties on average soil loss measured on a standard plot condition [51,82,88,93]. The most important soil properties that affect soil erosion are soil organic matter content, soil texture, drainage ratio, and soil structure [5]. In this study, the K factor value was calculated based on the formula given by Wischmeier and Smith [52] using the FAO harmonized digital soil map [78], as follows (Equation (4)).
K = 2.1 × 10 6 × M 1.14 × ( 12 O M ) + 0.325 × ( P 2 ) + 0.025 × ( S 3 )
where M = (percentage silt + percentage very fine sand) (100 percent clay); OM = the percentage of organic matter content; P = profile permeability; and S = structure classes.
The spatial distribution of the soil erodibility in the Erer Sub-Basin is shown in Figure 3b, with mean values ranging from 0.36 t h MJ 1 mm−1 to 0.42 t h MJ 1 mm−1 (Table S1). The lowest value for soil erodibility was obtained from the dystric cambisols (0.36 t h MJ −1 mm−1) which are typically found in the northwest of the study landscape. The most erodible soil classes included the eutric regosols (0.37 t h MJ 1 mm−1) and the eutric nitosols (0.42 t h MJ 1 mm−1) with a relatively higher sand content (> 68 percent) are situated in the north, northeast, and southwest of the study landscape.

Slope Length and Steepness (LS) Factor

The dimensionless slope length and steepness factor, LS, represent the effect of slope gradient on soil loss, can be determined as a product of the slope length (L) and slope steepness (S) [90,91]. The increase in slope length and slope steepness can cause a higher overland flow speed and runoff volume, which result in a high amount of soil loss [92]. The LS factor of the RUSLE model represents the proportion of soil loss on a given slope length and steepness to soil loss from a 22.13 m slope length and a steepness of 9% with all other conditions remains the same [52,93,94]. The L and S factors were calculated from a 30m resolution DEM image covering the sub-basin area using the following equations (Figure 3c,d).
L = ( λ 22.1 ) m
where λ is the horizontal field slope length in meters, and m is the variable slope length exponent calculated from the ratio of rill-to-interrill erosion slope steepness: 0.5 for slopes steeper than 4.5%; 0.4 for slopes between 3%−4.5%; 0.3 for slopes between 1%−3%, and 0.2 on slopes lower than 1%.
To represent the heterogeneity of slope steepness in the sub-basin area, the slope gradients were sub-divided into a number of segments by taking into consideration the unit upslope contributing areas [94,95,96,97,98,99].
L i , j =   ( A i , j i n + D 2 ) m + 1 A i , j i n m + 1 D m + 1 × x i , j m × 22.13 m
where A i , j i n is the contributing area at the inlet of the grid cell (i, j) is measured in m2; D is the grid cell size (meters); x i , j is sin a i , j + cos a i , j ; Ai, j is the aspect direction of the grid cell (i, j); and m is the slope length exponent associated to the share of β of rill-to-interrill erosion (Equations (7) and (8)) [95,98]:
m = ( β 1 + β )
β = sin θ 0.0896 [ 0.56 + 3 × ( sin θ ) 0.8 ]
θ is the slope steepness angle in degrees (Equation (9a,b)) [96,100].
S = 10.8 sin θ + 0.03 ,   where   slope   gradient < 9 %
S = 16.8 sin θ 0.50 ,   where   slope   gradient 9 %

Cover Management (C) Factor

The cover management factor, C, represents the proportion of soil loss from the field under a given crop management practices to that from clean-tilled continuous plowed land [101]. Following De Jong [102], the cover management factor was interpreted based on the Normalized Difference Vegetation Index (NDVI) generated using satellite images from Landsat 5 TM and Landsat 8 OLI sensors. The estimated C factor for 2000 and in 2018 is given in Figure 3e,f.
C = 0.431 0.805   ×   NDVI

Support Practice (P) Factor

The P factor indicates the effects of various conservation practices in minimizing the amount and rate of soil loss owing to rainfall-runoff [96,103,104,105,106,107]. The value of the P factor is conventionally determined based on the types of soil conservation measures applied in a given area. Due to the constraints of field-based measurements concerning conservation practices put in place within the study area, we determined the values of the P factor based on an alternative method recommended by Wischmeier and Smith (Table 1) [52]. For this purpose, the LULC maps interpreted from the Landsat satellite images and the slope map determined from the DEM were used to drive the spatial distribution maps of the P factor in 2000 and 2018 (Figure 3g,h).

3. Results and Discussion

3.1. LULC Classfication

Six LULC classes identified in the Erer Sub-Basin were classified for the year 2000 and 2018, as shown in Figure 4. This includes bare land, cropland, forestland, settlement, shrubland, and water body, with a proportion of each LULC class in 2000 contributes 8.03%, 47.92%, 2.99%, 0.2%, 40.67%, and 0.18% of the total study area, respectively. Each LULC classes in 2018 accounts for 9.71%, 64.36%, 1.42%, 0.61%, 23.87%, and 0.03% of the total study area, respectively (Table 2). The classified LULC images illustrate that cropland was the most dominant LULC class in the study landscape in both 2000 and 2018, followed by shrubland and bare lands (Figure 4a,b).
Presented in Table 3 is a statistical summary of classification accuracy assessment for the 2000 and 2018 LULC images. The user’s accuracy, producer’s accuracy, Kappa (K^) coefficient, overall accuracy, overall K^ coefficient, commission and omission errors were utilized to validate the classification accuracies based on randomly generated reference points for LULC classes (Table 3). The diagonal values down an error matrix indicate reference samples that are accurately classified and off-diagonal entries are the misclassified references correspond to individual LULC classes. The overall classification accuracies attained based on the stratified random sampling method were 94.00% in 2000 and 96.33% in 2018, with a kappa coefficient of 0.93 and 0.95, respectively. The user’s and producer’s accuracies obtained per LULC classes ranged from 86.27% (bare land in 2000) to 100% (forestland, settlement, and water body in 2018) and, 80.00% (settlement in 2000) to 100% (shrubland in 2018), respectively. The bare land LULC class had a relatively high commission error, while the settlement had a relatively high omission error both in the 2000 and 2018 classified images. Thus, the classified satellite images have overestimated the bare land and underestimated settlement area. This is probably due to the spectral similarity of the bare land and the settlement LULC classes. From the statistical results of the classification accuracy assessment presented in Table 3, it was confirmed that the classified images agree with the training samples, and is, therefore, satisfactory to conduct a change detection analysis [81,82].

3.2. Assessment of LULCC in the Erer Sub-Basin

LULCC is closely related to human decisions and complex interactions among multiple activities, working at a location [108,109]. Up-to-date information about the dynamics of LULCC and its drivers is an increasingly important issue in the examination of environmental change for identifying the current resource situation and designing sustainable resource management measures [108,109,110]. The present study found a considerable LULCC in the Erer Sub-Basin, which is located in the Upper Wabi Shebelle Basin. The extent of changes varied among the LULC classes during the period between 2000 and 2018. During the study period, areas covered by forestland, shrubland, water body showed a considerable reduction (Table 4). The forestland converted during the period of the assessment totaled 60.60 km2, which is about 2.99% of the total area that covered in 2000. Likewise, shrub land cover has decreased in the study landscape by 41.31% of the total area. Water body also showed a reduction of 84.21% of the total area. The decline in a water body is probably due to the expansion of settlement and cropland in shrubland and forestland in the study landscape. On the contrary, bare land, cropland, and settlement LULC classes have increased by 20.9%, 34.31%, and 205%, respectively.
Changes between LULC classes in the period 2000–2018 are provided in Table 5. The loss column represents the amount of LULC that experienced a gross loss of category i between 2000 and 2018, while the gain row indicates the LULC that experienced a gross gain of class j between the same periods. The change detection matrix shows that overall, nearly 43.48% of the land within the study landscape experienced LULCC during the period between 2000 and 2018. As shown in Table 5, the major LULCCs identified during the study period were from shrubland to cropland (21.26% of the original shrubland has been converted to cropland), cropland to shrubland (6.99% of the original cropland has been converted to shrubland), shrubland to bare land (4.74% of the original shrubland has been converted to bare land), and forestland to shrubland (2.07% of the original forest has been converted to shrubland).
During 2000 and 2018, about 6.49% of the LULCC was occurred due to swap change, wherein a comparable area was gained and lost among the LULC classes (Table 6). During the study period, the persistence of the LULC classes accounts for 56.52% of the total area. The change analysis results generally indicate that the cropland and the shrubland were relatively the highest persistence LULC classes, whereas the water body was the lowest-persistence class. Out of the 47.92% and 40.67%, the cropland and the shrubland LULC classes covered in 2000 around 39.04% and 13.65% of the total area remained unchanged in 2018, and the remaining 8.88% and 27.02% were converted to other LULC classes, respectively. Similarly, the cropland showed the highest gross gain (25.32%) due to the area mainly converted from shrubland, bare land, and forestland. Although the cropland gained areas converted from shrubland, bare land, and forestland, it experienced a net loss of about 8.90 % of the total area. The shrubland experienced the highest net loss among the LULC classes. It accounts for about 27.02% of the total area (with about 21.26%, 4.74%, 0.80%, and 0.22% of shrub land swapped into cropland, bare land, forestland, and settlement, respectively), whereas about 160.44 km2 of new shrub land was established at the expense of cropland (6.99%), forestland (2.07%), bare land (1.07%), and water body (0.03%). The net change-to-persistence ratio was relatively higher for settlement, cropland, and bare land, showing their persistence in comparison to their net loss. On the contrary, the net change-to-persistence ratio was negative for a water body, forestland, and shrubland, suggesting their net loss rather than their persistence in the study landscape [85]. The findings of this study were consistent with numerous studies’ findings in other parts in Ethiopia [111,112,113,114,115,116,117,118,119], and elsewhere in the world [5,16,17]. These studies have revealed a heterogeneity in the spatial and temporal extent of LULCCs.
For example, Kindu et al. [111] found cropland expansion at the expense of woodlands, forest, and grassland in Munessa-Shashemene landscape of the Ethiopian highlands. Similar results were also found in the south-central Ethiopia, where agriculture land expansion has reached its peak on the suitable land over the period 1972–2013 and continued to occupy marginal lands affecting the forest biodiversity [112]. In accordance with the findings of the current study, Mengistu et al. [113] reported an increase in cropland while a downward trend in riverine trees and shrub-grassland in the Upper Dijo River Catchment of the south-central Ethiopia. Supporting our findings, another study investigated the dynamics of LULCC and the woody vegetation diversity in the human-driven landscape of the Gilgel Tekeze Catchment reported an increase in cropland and settlement area while a decrease in the forest and the bushland [114].
On their part, Fetene et al. [115] and Belay et al. [116] analyzed the LULCCs in the Awash National Park (ANP) and the Nech-Sar National Park (NSNP) in Ethiopia. Their studies’ findings showed that that the main drivers of LULCCs occurred within the two national parks–causing enormous destructions in wildlife habitat–has been attributed to changes in the land tenure system and regime changes, immigration, drought, poaching, and deforestation in combination with ever-increased pressure from the local community and livestock [115,116]. A recent report by Hailemariam et al. [117] also concluded that population growth resulted in a high demand for cropland expansion, which in turn, has triggered a decrease in the areas of forest cover, shrubland, and grassland in the Bale mountain eco-region of Ethiopia. In a related study conducted in the Gilgel Tekeze Catchment of the northern Ethiopia highlands, Haregeweyn et al. [118] suggested an integrated catchment management measures to minimize the adverse impacts of LULCC on sustainable hydrological system. Tadesse et al. [119], in contrast, reported a regeneration of vegetation cover in the Yezat Watershed of northwestern Ethiopia, which was attributed to an integrated watershed management practices taken over the period between 2010 and 2015.

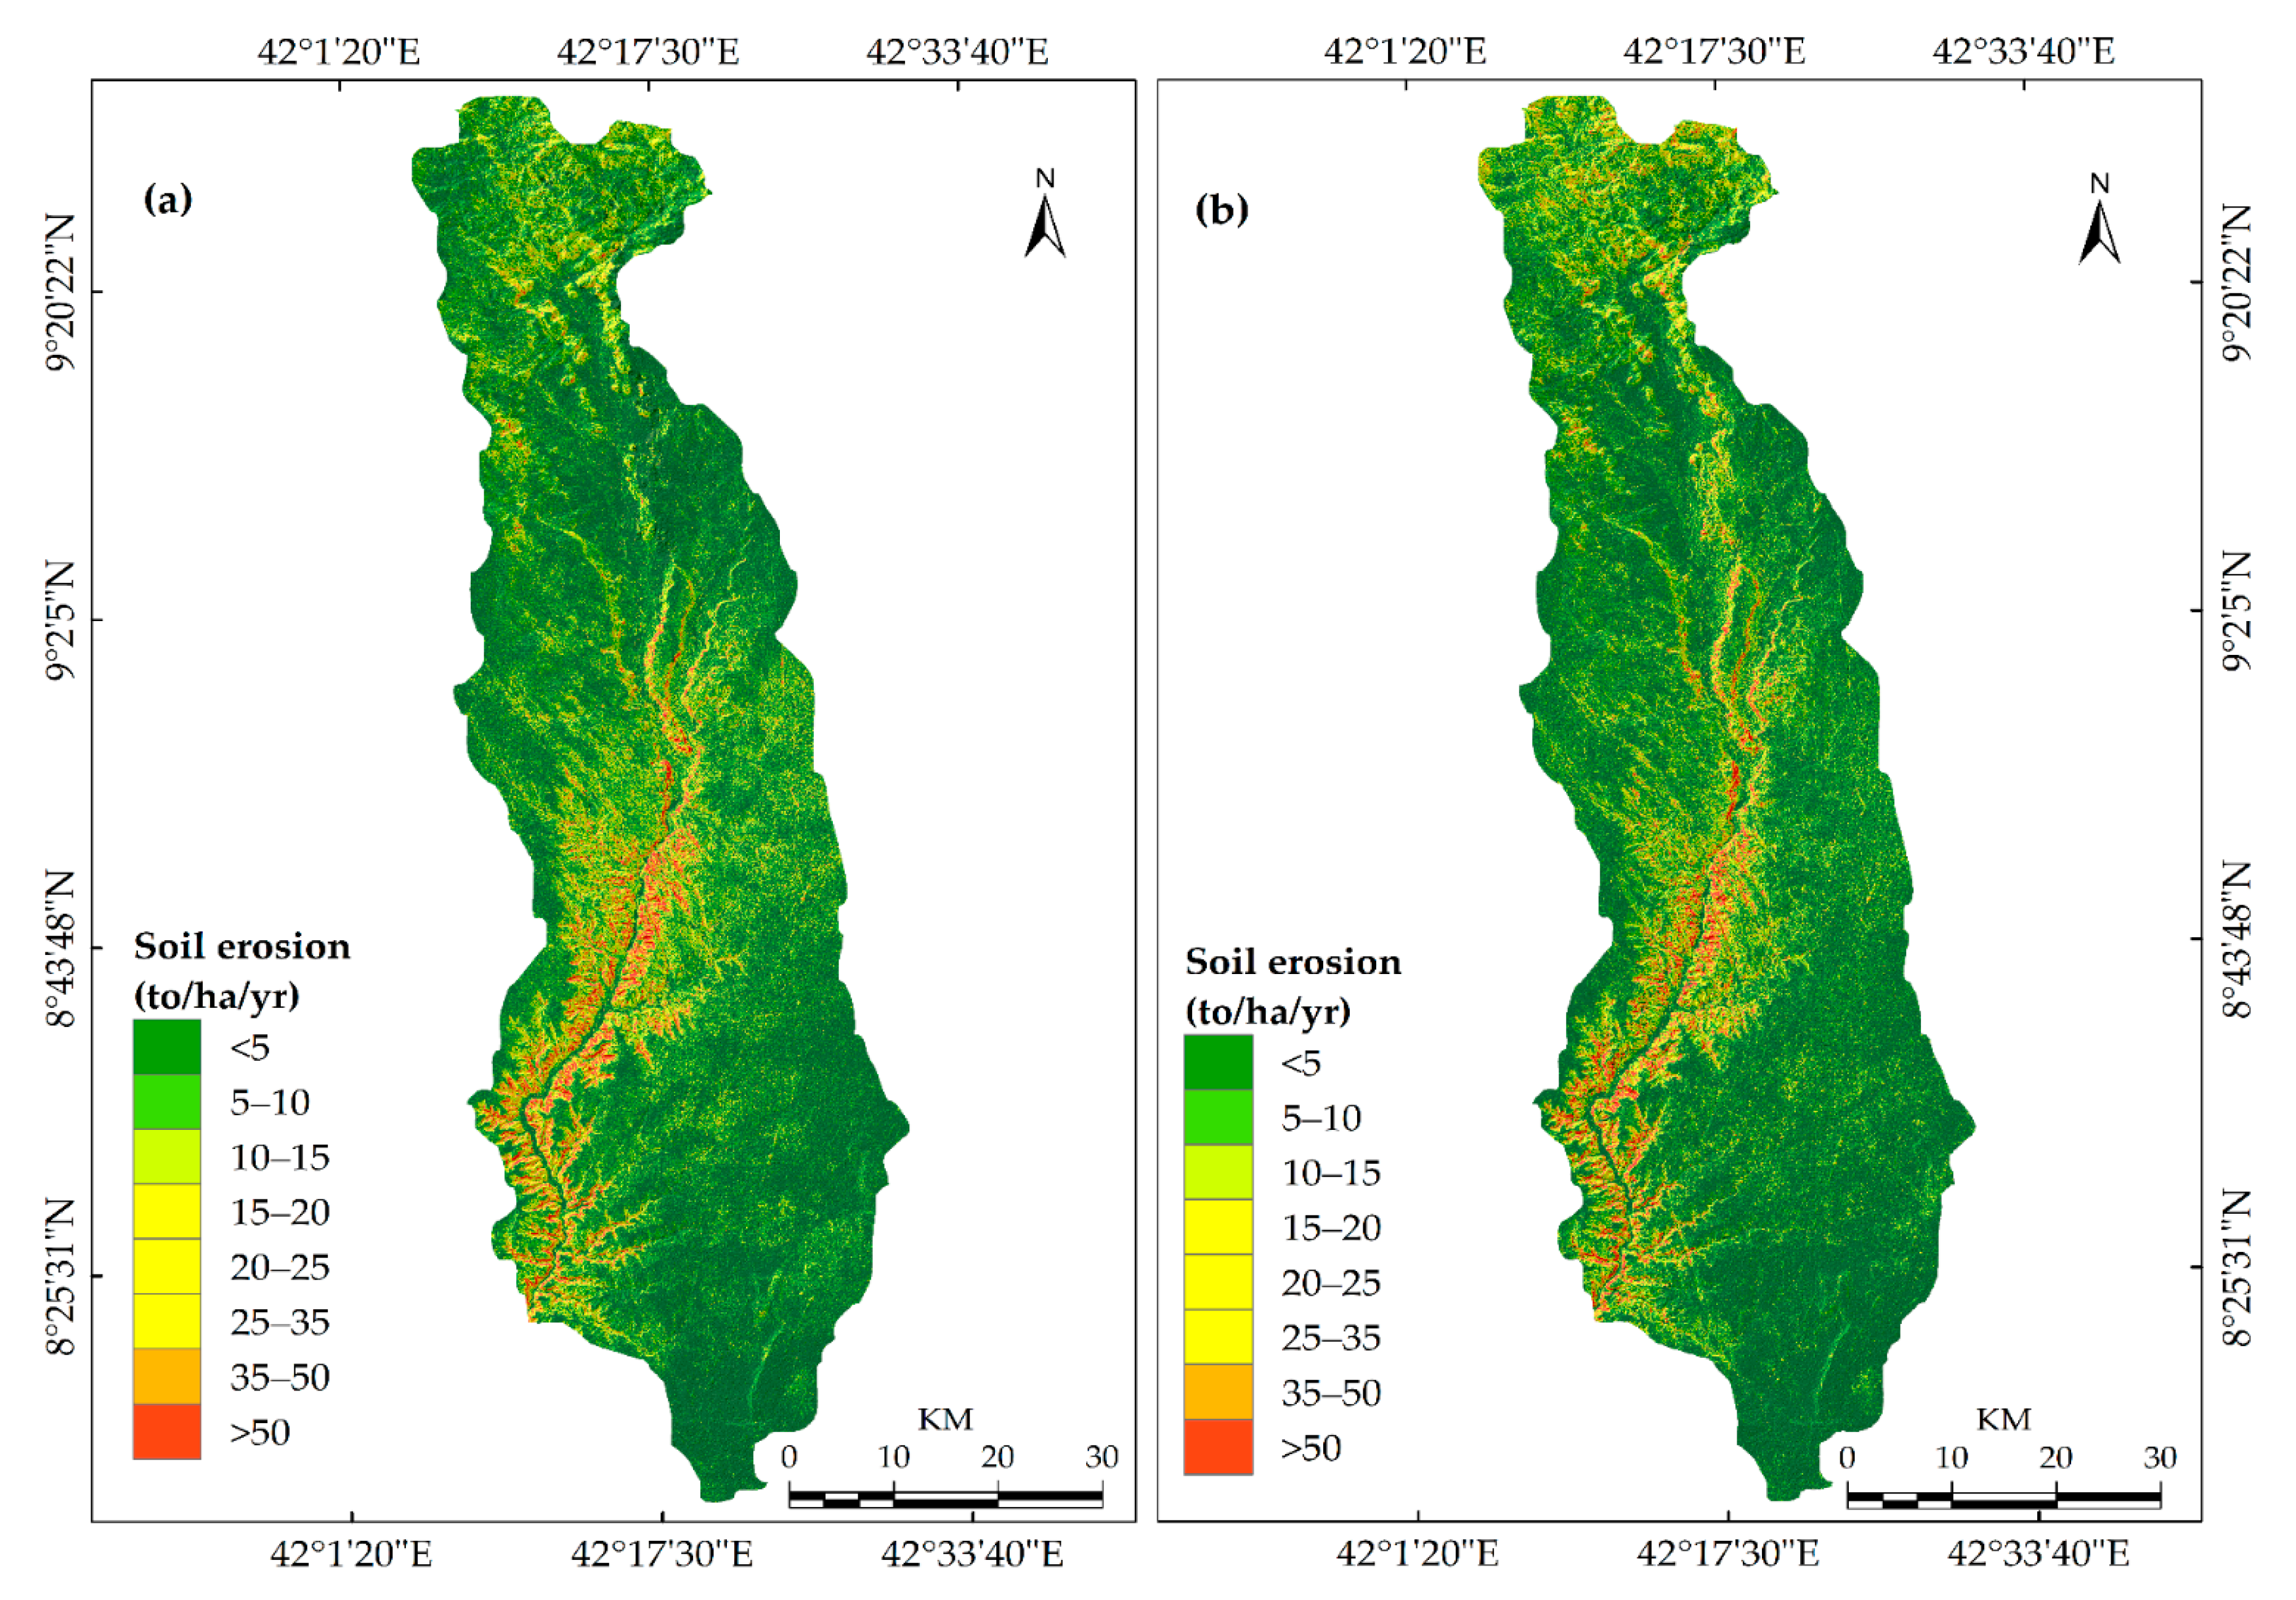
3.3. Overview of Soil Erosion in the Erer Sub-Basin

The spatial distribution of soil erosion risks in the Erer Sub-Basin is shown Figure 5a in 2000 and Figure 5b in 2018, while the estimated soil loss rates and the erosion risk classes are provided in Table 7. The estimated total annual actual soil loss in the study landscape was 1.01 million tons in 2000 and 1.52 million tons in 2018. Our estimate of soil loss falls within the range of the previous findings that estimated the soil loss rate in the highland areas of Ethiopia from 1248 to 23,400 million tons [30]. The soil erosion risk had shown a high spatial variation across the study landscape (Figure 5). As it can be observed from Figure 5, high soil erosion risk areas were located in the northeast, southwest, and the central parts of the Erer Sub-Basin, which are also, found in the rugged topography and steep slopes. Relatively less eroded areas were situated in the lower elevations in the eastern and western parts of the sub-basin, where the slope inclination is ranging from nearly zero to ten percent. Similar results have been reported by the earlier studies that attributed lower soil loss rate to gentle slopes while a higher soil loss in steep slope areas [18,120,121,122,123].
The mean annual soil loss rate was estimated at 75.85 t ha−1 y−1, 107.07 t ha−1 y−1, in 2000 and 2018, respectively, for the entire sub-basin. It was also found in this study that the mean soil loss of 2018 increased by an average of 41.16 t ha−1 y−1 when compared to the mean soil loss of 2000. The estimated mean annual soil loss rate in the present study area is considerably higher than that of the maximum tolerable soil loss limits estimated for the agro-ecological regions (18 t ha−1 y−1) [124] and soil formation rates for the various land units in Ethiopia [125], and to the normal soil loss tolerances indicated by the Wischmeier and Smith (5–11 t ha−1 y−1) [52]. The estimated mean rate of soil loss is also higher than the findings of previous investigators in the Upper Wabi Shebelle Basin [18,67,68,71], and other river basins in Ethiopia [126,127]. On the contrary, the estimated soil erosion rates are much lower than the local scale studies that estimated the soil loss rate of 935 t ha−1 y−1 in the Beshillo Catchment of the Blue Nile Basin [128]; 243 t ha−1 y−1 in northwestern highlands Ethiopia [129], and 321 t ha−1 y−1 in the eastern escarpment of Wollo [130].
According to the estimated rates of mean annual soil loss, the erosion risk was classified into eight classes extending from the very low to extremely high. The proportion of the area at very low risk covered a larger part of the sub-basin area (Table 7) accounts for about 48.87% and 46.22% of the total study area in 2000 and 2018, respectively. The area at very low and extremely high risk of soil erosion went down from 48.87% and 2.36% in 2000 to 46.22% and 2.14% respectively, in 2018. On the contrary, the low, low medium, medium, high medium, high, and very high have increased by 6.54%, 1.62%, 2.87%, 10.76%, 16.55%, and 16.55% of the total study area, respectively. Areas with a mean annual soil loss greater than low have increased by 3.80 % of the total study area. The results indicate that the estimated erosion rate for about 23.98% of the sub-basin area exceeds the maximum tolerable soil erosion threshold [52].
Table 8 presents the estimated soil loss from each LULC class in 2000 and 2018. The estimated mean soil loss increased for LULC classes during the period between 2000 and 2018, showing that the LULCC have detrimental impacts on soil loss by water erosion [4,16,17]. Understanding the dynamics in LULCCs and consequent changes in the distribution of soil erosion risk can provide a spatial decision support tool for conservation planners to develop an appropriate SWC measures. Settlement area that occupied about 0.20%, 0.61% of the sub-basin area, in 2000 and 2018, accounted for 2.64% and 1.99% of the total soil loss, respectively. During 2000 and 2018, the minimum amount of soil loss was estimated in water bodies, with a mean erosion rate of 0.02 t ha−1 yr−1 and 0.26 t ha−1 yr−1, respectively. The soil loss from the water body, forestland, and settlement was relatively low, and the annual soil loss from cropland was accounted for 42.06% and 48.34% of the soil erosion in 2000 and 2018, respectively.
The cropland, bare land, and settlement had become the main causes of soil erosion in the study landscape, as the estimated mean soil loss rate for the three LULC classes have increased 11.88, 6.80, and 2.44 t ha−1 yr−1; however, their rates of changes varied 34.31%, 20.91%, and 205%, respectively.
Our findings coincide with those of the recent study by Yesuph and Dagnew [128] who showed that the cropland under a mono-cropping and intensive cultivation in the upslope areas were responsible for severe soil erosion in the Beshillo Catchment of the Blue Nile Basin. Validating the present study’s findings, Belayneh et al. [120] also pointed out that cultivated land with a mean erosion rate of 45.68 t ha−1 yr−1 accounted for 62.06% of the total soil loss from the Gumara Watershed of the northwestern Ethiopia highland. The landscape that had experienced the LULCC during the period of the assessment accounted for about 43.48% of the total study area, of which about 11.44% revealed an increase in the estimates of soil loss of 75.66 t ha−1 yr−1. The remaining landscape under LULCC had undergone a decrease in actual soil loss of 116.63 t ha−1 yr−1. Of the landscape under LULCC experienced, a high in an estimated soil erosion rate corresponds to the area where the water bodies were changed to shrubland (increase in actual soil loss was 9.69 t ha−1 yr−1). Figure 6 shows that the second and the third detrimental LULCCs accounted for an increase in the actual soil erosion in the study area were conversions from forestland to shrubland (+9.51 t ha−1 yr−1) and from water bodies to bare land (+9.39 t ha−1 yr−1). At the same period, changes from forestland to bare land and settlement accounted for an increase in soil loss of 8.54 t ha−1 yr−1 and 7.02 t ha−1 yr−1, respectively. At the sub-basin level, the positive LULCCs that contributed to a significant reduction in the estimates of soil erosion were a change from shrubland to forestland and water body (Figure 6).
Table 9 shows the proportion of soil erosion risk classes change between 2000 and 2018. The diagonal of the transition matrix indicates the proportion of erosion risk classes that remained unchanged during the study period, while the off-diagonal elements account of a conversion from one class to other classes of soil erosion risk. The loss and gain row represent the percentage loss and gain in each erosion risk class, respectively. The change analysis results show that about 65.80% of the total erosion risk areas occupied in 2000 remained unchanged in 2018. The overall gain and loss of the soil erosion risk classes account for 34.21% and 34.18% of the total area, respectively. The highest net gain (12.64% of the total area) and gross loss (10.84% of the total area) was estimated in an erosion risk class of low. It accounts for about 0.83% of the total study area. The highest net-change (1.8% of the total area) and net-change-to-persistence ratio (2% of the total area) was estimated in the in the area at low and very high risk of erosion. The change analysis results indicate that the erosion risk areas increased by 8.28% of the total study area, and decreased by 5.93%, which reveals that the overall erosion risk condition is deteriorating in the study landscape. The present study’s findings agree with those of the recent study by Weldemariam et al. [18] who indicated that the situation of soil loss risk in the Gobele Watershed has been worsening due to increases in the proportion of erosion risk areas by 19.67% of the total watershed area between 2000 and 2016. Uddin et al. [5], in contrast, found improvement in the situation of soil erosion in Nepal, where the mean soil loss rates have decreased from 8.76 t ha−1 y−1 in 1990-to 7.49 t ha−1 y−1 in 2010. Validating these findings, Jiu et al. [131] stated that an increase of water level and river surface and afforestation measures taken in the period 2000−2015 significantly reduced the soil erosion risk in the Three Gorges Reservoir Region (TGRR), China. According to Jiu et al. [131], the interactions between NDVI and urbanisation as well as vegetation diversity and urbanisation are key factors influencing soil loss in the TGRR.

3.4. Determination Conservation Priority Levels

Several previous studies highlighted the positive outcome of SWC measures for mitigating erosion risk, restoration of the degraded land while improving the soil fertility and land productivity [5,35,36,37,38,39,40,41,42,43]. The design and implementation of SWC measures need a spatially intrinsic information on soil loss and severity levels erosion risk [18,47,99]. In view of the fact that the distributions of soil erosion risk have shown a spatial variation within the sub-basin, we identified and mapped areas with a higher soil erosion rate as priority areas for SWC measures using an MCDR method (Figure 7) [88]. Determination of conservation priorities was done based on the estimated soil erosion rates and the cross-tabulated change detection matrix of erosion risk classes changes between 2000 and 2018. The portion of the sub-basin area with high soil loss and increases in erosion risk grades were delineated in uppermost conservation priority levels (Table 10).
Eight SWC priority areas were identified at the sub-basin scale revealed that the top three priority levels delineated for urgent SWC measures represent those areas within a higher soil loss rate and the large increase in erosion risk levels, with an area of 271.28 km2 and accounts for 7.03 % of the sub-basin area. About 80.46% of the top three priority areas are situated in the Gursum, Babile, Fedis, Fik, and Gola Oda districts (Table S2), which are, located in the north, northeast, southwest, south, and south-west of the sub-basin. The remaining patches within these priority levels account for 19.54% of the total area, which are found in the upland within the Haramaya, Jarso, and Kombolcha districts, and the Harari Region that is located in the northern part of the sub-basin. The fourth-, fifth-, sixth-, seventh- and eighth-priority levels accounting for about 92.98% of the total study area need of negligible conservation measure to control soil loss and erosion risk.

4. Conclusions

Understanding the magnitude of LULCC and consequent changes in the spatial extent of soil erosion risk for the Erer Sub-Basin is the main aim of this study. The LULCC was examined based on multispectral Landsat satellite images acquired in 2000 and 2018. The soil erosion rate was estimated using the RUSLE model developed in the ArcGIS environment. According to our analysis, overall, nearly 43.48% of the land in the study area experienced LULCCs in the 18 years (2000–2018) study period. During the study period, cropland, bare land, and settlement increased from 47.92%, 8.03% and 0.20% in 2000 to 64.36%, 9.71% and 0.61%, respectively, in 2018. On the contrary, areas covered by forestland, shrubland, and water body have decreased from 2.99%, 40.67% and 0.18% to 1.42%, 23.87%, 0.03%, respectively, in 2018. The change analysis matrix showed that cropland gained 25.33%, while shrubland lost 27.02% of the total area. The bare land and cropland expansion were found to be the major drivers of LULCC contributing to high soil loss rates, wherein the entire study area, an estimated total of 1.5 million tons of soil was displaced in 2018, of which 48.34% and 36.01 is lost from cropland and bare land, respectively. The findings of the study generally elucidate that the LULCC have a detrimental impact on soil erosion. Mean soil loss rate increased from 75.85 t ha−1 y−1 in 2000 to 107.07 t ha−1 y−1 in 2018, with high erosion risk areas being in the central, northeastern, and southwestern Erer Sub-Basin. Based on the estimated rate of mean annual soil loss, erosion risk was classified into eight classes, showing that over one-third of the study landscape (76.01%) was estimated to have erosion risk below low medium with a man soil loss lower than 10 t ha−1 y−1. The erosion risk that experienced changes during the study period accounts for about 34.2% of the total study area, of which about 15.93% decreased and 18.28% showed an increase in the study landscape. This shows that the erosion risk condition is deteriorating in the study landscape. The study area was classified into eight SWC priority levels based on the severity levels of erosion risk. About 7.02% of the sub-basin area was found to be under the first-, second-, and third-priority levels that need intense SWC measures. Further detailed investigations based on data from primary and secondary sources would be important in identifying driving socioeconomic forces and consequences of LULCCs and suggest possible alternative options to establish sustainable resource management practices in the study area.

Supplementary Materials

The following are available online at https://www.mdpi.com/2073-445X/9/4/111/s1, Table S1: Attributes of soil units and calculated soil erodibility (K) factor. Table S2: List of priority districts identified for SWC planning in the Erer Sub-Basin.

Author Contributions

G.W.W. conceived and designed the method, performed the experiment, and drafted the manuscript. A.E.H. performed the experiment, reviewed, and commented on the manuscript. All authors have read and agreed to the published version of the manuscript.

Funding

This research received no external funding.

Acknowledgments

The authors would like to thank the three anonymous reviewers and the editors for their valuable comments for improving this article.

Conflicts of Interest

The authors declare no conflict of interest.

References

  1. Sujatha, E.R.; Sridhar, V. Spatial Prediction of Erosion Risk of a Small Mountainous Watershed Using RUSLE: A case-study of the Palar Sub Watershed in Kodaikanal, South India. Water 2018, 10, 1608. [Google Scholar] [CrossRef] [Green Version]
  2. Rahman, M.R.; Shi, Z.H.; Chongf, C. Soil erosion hazard evaluation: An integrated use of remote sensing, GIS and statistical approaches with biophysical parameters towards management strategies. Ecol. Model. 2009, 220, 1724–1734. [Google Scholar] [CrossRef]
  3. United Nations Environment Programme (UNEP). The Economics of Land Degradation in Africa; ELD Initiative: Bonn, Germany, 2015. [Google Scholar]
  4. Borrelli, P.; David, A.; Robinson, D.A.; Fleischer, L.R.; Lugato, E.; Ballabio, C.; Alewell, C.; Meusburger, K.; Modugno, S.; Schutt, B.; et al. An assessment of 21st century land use change on soil erosion. Nat. Commun. 2017, 8, 2013. [Google Scholar] [CrossRef] [PubMed] [Green Version]
  5. Uddin, K.; Abdul Matin, M.; Maharjan, S. Assessment of Land Cover Change and Its Impact on Changes in Soil Erosion Risk in Nepal. Sustainability 2018, 10, 4715. [Google Scholar] [CrossRef] [Green Version]
  6. Bergsma, E. Terminology for Soil Erosion and Conservation; International Society for Soil Science: Wageningen, The Netherlands, 1996. [Google Scholar]
  7. Oldeman, L.R. The global extent of soil degradation. In Soil Resil. Sustain. Land Use; CAB International: Wallingford, CT, USA, 1994; pp. 99–118. [Google Scholar]
  8. Boardman, J. Soil Erosion in Britain: Updating the Record. Agriculture 2013, 3, 418–442. [Google Scholar] [CrossRef] [Green Version]
  9. Stavi, I.; Lal, R. Variability of soil physical quality in uneroded, eroded, and depositional cropland sites. Geomorphology 2011, 125, 85–91. [Google Scholar] [CrossRef]
  10. Benavidez, R.; Jackson, B.; Maxwell, D.; Norton, K. A review of the (Revised) Universal Soil Loss Equation ((R) USLE): With a view to increasing its global applicability and improving soil loss estimates. Hydrol. Earth Syst. Sci. 2018, 22, 6059–6086. [Google Scholar] [CrossRef] [Green Version]
  11. Haregeweyn, N.; Tsunekawa, A.; Poesen, J.; Tsubo, M.; Meshesha, D.T.; Fenta, A.A.; Nyssen, J.; Adgo, E. Comprehensive assessment of soil erosion risk for better land use planning in river basins: Case study of the Upper Blue Nile River. Sci. Total Environ. 2017, 574, 95–108. [Google Scholar] [CrossRef] [Green Version]
  12. Bouma, J.; Batjes, N.H. Trends of World-Wide Soil Degradation. Bodenschutz 2000, 32, 33–43. Available online: http://edepot.wur.nl/313069 (accessed on 14 August 2019).
  13. Global Soil Partnership (GSP). GSP Endorses Guidelines on Sustainable Soil Management. Available online: http://www.fao.org/global-soil-partnership/resources/highlights/detail/en/c/416516/ (accessed on 20 February 2018).
  14. Food and Agriculture Organization (FAO). Intergovernmental Technical Panel on Soils (ITPS). Status of the World’s Soil Resources (SWSR) Main Report; FAO and ITPS: Rome, Italy, 2015. [Google Scholar]
  15. Wang, L.; Huang, J.; Du, Y.; Hu, Y.; Han, P. Dynamic Assessment of Soil Erosion Risk Using Landsat TM and HJ Satellite Data in Danjiangkou Reservoir Area, China. Remote Sens. 2013, 5, 3826–3848. [Google Scholar] [CrossRef] [Green Version]
  16. Karamage, F.; Zhang, C.; Ndayisaba, F.; Shao, H.; Kayiranga, A.; Fang, X.; Nahayo, L.; Nyesheja, E.M.; Tian, G. Extent of Cropland and Related Soil Erosion Risk in Rwanda. Sustainability 2016, 8, 609. [Google Scholar] [CrossRef] [Green Version]
  17. Sharma, A.; Tiwari, K.N.; Bhadoria, P.B.S. Effect of land use land cover change on soil erosion potential in an agricultural watershed. Environ. Monit. Assess 2011, 173, 789–801. [Google Scholar] [CrossRef] [PubMed]
  18. Woldemariam, G.W.; Iguala, A.D.; Tekalign, S.; Reddy, R.U. Spatial Modeling of Soil Erosion Risk and Its Implication for Conservation Planning: The Case of the Gobele Watershed, East Hararghe Zone, Ethiopia. Land 2018, 7, 25. [Google Scholar] [CrossRef] [Green Version]
  19. Sutcliffe, J.P. Economic Assessment of Land Degradation in the Ethiopian Highlands: A Case Study; National Conservation Strategy Secretariat, Ministry of Planning and Economic Development, Transitional Government of Ethiopia: Addis Ababa, Ethiopia, 1993.
  20. Ethiopia Population 2018 (Demographics, Maps, Graphs)-World Population Review). Available online: http://worldpopulationreview.com/countries/ethiopia-population/ (accessed on 24 December 2018).
  21. Yesuf, M.; Mekonnen, M.; Kassie, M.; Pender, J. Cost of Land Degradation in Ethiopia: A Critical Review of Past Studies; Environment for Development, World Bank: Washington, DC, USA, 2007. [Google Scholar]
  22. Berry, L. Land Degradation in Ethiopia: Its Extent and Impact; World Bank: Washington, DC, USA, 2003. [Google Scholar]
  23. United Nations Development program (UNDP). Country Economic Brief; UNDP: New York, NY, USA, 2014. [Google Scholar]
  24. Central Statistical Agency (CSA). Agricultural Sample Survey 2007/08 Utilization, Volume IV; Statistical Bulletin: Addis Ababa, Ethiopia, 2008. [Google Scholar]
  25. Ethiopian Economics Association (EEA). Report on the Ethiopian Economy; Ethiopian Economics Association: Addis Ababa, Ethiopia, 2008. [Google Scholar]
  26. Ethiopia’s Climate-Resilient Green Economy, Green Economy Strategy; Environmental Protection Authority: Addis Ababa, Ethiopia, 2011.
  27. Muluneh, A.; Stroosnijder, L.; Keesstra, S.; Biazin, B. Adapting to climate change for food security in the Rift Valley dry lands of Ethiopia: Supplemental irrigation, plant density and sowing date. J. Agric. Sci. 2017, 155, 703–724. [Google Scholar] [CrossRef]
  28. Gadissa, T.; Nyadawa, M.; Behulu, F.; Mutua, B. The Effect of Climate Change on Loss of Lake Volume: Case of Sedimentation in Central Rift Valley Basin, Ethiopia. Hydrology 2018, 5, 67. [Google Scholar] [CrossRef] [Green Version]
  29. Guide Line for Integrated Watershed Management; Ministry of Agriculture and Rural Development: Addis Ababa, Ethiopia, 2005.
  30. Food and Agriculture Organization (FAO). Ethiopian Highland Reclamation Study; FAO: Rome, Italy, 1986; pp. 37–46. [Google Scholar]
  31. Ethiopia-Land Degradation Neutrality National Report (ELDNR); The Federal Democratic Republic of Ethiopia: Addis Ababa, Ethiopia, 2015.
  32. International Food Policy Research Institute (IFPRI). Poverty and Land Degradation in Ethiopia: How to Reverse the Spiral; IFPRI: Washington, DC, USA, 2005. [Google Scholar]
  33. Ethiopia’s Agricultural Sector Policy and Investment Framework (PIF); Ministry of Agriculture and Rural Development (MoARD): Addis Ababa, Ethiopia, 2010–2020. Available online: https://r.search.yahoo.com/_ylt=AwrCmmaJy1Ndmz8ABSgPxQt.;_ylu=X3oDMTByOHZyb21tBGNvbG8DYmYxBHBvcwMxBHZ0aWQDBHNlYwNzcg/RV=2/RE=1565801481/RO=10/RU=https%3a%2f%2fwww.agri-learning-ethiopia.org%2fwp-content%2fuploads%2f2015%2f10%2fAgriculture-Policy-MTR_FINAL.pdf/RK=2/RS=GVtxvXmutBKVxIwMsnbzR0USICE- (accessed on 14 August 2019).
  34. Gashaw, T.; Bantider, A.; G/Silassie, H. Land Degradation in Ethiopia: Causes, Impacts and Rehabilitation Techniques. J. Environ. Earth Sci. 2014, 4, 98–104. [Google Scholar]
  35. Hurni, K.; Zeleke, G.; Kassie, M.; Tegegne, B.; Kassawmar, T.; Teferi, E.; Moges, A.; Tadesse, D.; Ahmed, M.; Degu, Y.; et al. Economics of Land Degradation (ELD) Ethiopia Case Study. Soil Degradation and Sustainable Land Management in the Rainfed Agricultural Areas of Ethiopia: An Assessment of the Economic Implications; Report for the Economics of Land Degradation Initiative; 2015; p. 94. Available online: https://www.eld-initiative.org/en/publications/eld-case-studies/#c905 (accessed on 20 September 2018).
  36. Hurni, H. Degradation and Conservation of the Resources in the Ethiopian highlands. Mt. Res. Dev. 1988, 8, 123–130. [Google Scholar] [CrossRef]
  37. Kidane, D.; Alemu, B. The Effect of Upstream Land Use Practices on Soil Erosion and Sedimentation in the Upper Blue Nile Basin, Ethiopia. Res. J. Agric. Environ. Manage. 2015, 4, 55–68. [Google Scholar]
  38. Akale, T.A.; Dagnew, D.C.; Belete, M.A.; Tilahun, S.A.; Mekuria, W.; Steenhuis, T.S. Impact of Soil Depth and Topography on the Effectiveness of Conservation Practices on Discharge and Soil Loss in the Ethiopian Highlands. Land 2017, 6, 78. [Google Scholar] [CrossRef] [Green Version]
  39. Soil Conservation Research Programme (SCRP). Soil Conservation Research Project Database Report 1982–1993; Ministry of Agriculture and University of Berne, Series Report III; Hundelafto Research Unit, Institute of Geography, University of Berne: Bern, Switzerland, 1996. [Google Scholar]
  40. FAO. Ethiopian Highland Reclamation Study (EHRS); Final Report; FAO: Rome, Italy, 1984; Volume 1, pp. 37–46. [Google Scholar]
  41. Bhattacharyya, R.; Ghosh, B.N.; Dogra, P.; Mishra, P.K.; Santra, P.; Kumar, S.; Fullen, M.A.; Mandal, U.K.; Anil, K.S.; Lalitha, M.; et al. Soil Conservation Issues in India. Sustainability 2016, 8, 565. [Google Scholar] [CrossRef] [Green Version]
  42. Cerdàa, A.; Rodrigo-Comino, J.; Giménez-Morera, A.; Keesstra, S.D. An economic, perception and biophysical approach to the use of oat straw as mulch in Mediterranean rainfed agriculture land. Ecol. Eng. 2017, 108, 162–171. [Google Scholar] [CrossRef] [Green Version]
  43. Keesstra, S.; Nunes, J.; Novara, A.; Finger, D.; Avelar, D.; Kalantari, Z.; Cerdà, A. The superior effect of nature based solutions in land management for enhancing ecosystem services. Sci. Total Environ. 2018, 610, 997–1009. [Google Scholar] [CrossRef] [PubMed] [Green Version]
  44. Bewket, W. Land Degradation and Farmers’ Acceptance and Adoption of Soil Conservation Technologies in the Dingil Watershed, Northwestern Highlands, Addis Ababa, Ethiopia. 2003. Available online: http://library.wur.nl/WebQuery/wurpubs/326000 (accessed on 26 December 2018).
  45. Van der Knijff, J.M.; Jones, R.J.A.; Montanarella, L. Soil Erosion Risk Assessment in Europe. Available online: https://www.researchgate.net/publication/237727657_Soil_Erosion_Risk_Assessment_in_Europe/link/55d1c0f208ae2496ee6580ca/download (accessed on 20 January 2018).
  46. Bagherzadeh, A. Estimation of soil losses by USLE model using GIS at Mashhad plain, Northeast of Iran. Arab. J. Geosci. 2014, 7, 211–220. [Google Scholar] [CrossRef]
  47. Efe, R.; Ekinci, D.; Cürebal, I. Erosion Analysis of Fındıkli Creek catchment (Northwest of Turkey) using GIS based on RUSLE (3D) Method. Fresenius Environ. Bull. 2008, 17, 576–586. [Google Scholar]
  48. López-Vicnte, M.; Quijano, L.; Palazon, L.; Gaspar, L.; Navas, A. Assessment of soil redistribution at catchment scale by coupling a soil erosion model and a sediment connectivity index (Central Spanish Pe-Pyrenees). CIG 2015, 41, 127–147. [Google Scholar] [CrossRef] [Green Version]
  49. Molla, T.; Sisheber, B. Estimating soil erosion risk and evaluating erosion control measures for soil conservation planning at Koga watershed in the highlands of Ethiopia. Solid Earth 2017, 8, 13–25. [Google Scholar] [CrossRef] [Green Version]
  50. Merritt, W.S.; Letcher, R.A.; Jakeman, A.J. A review of erosion and sediment transport models. Environ. Model Softw. 2003, 18, 761–799. [Google Scholar] [CrossRef]
  51. Rabia, A.H. Mapping Soil Erosion Risk Using RUSLE, GIS and Remote Sensing. In Proceedings of the 4th International Congress of ECSSS, EUROSOIL, Soil Science for the Benefit of Mankind and Environment, Bari, Italy, 2–6 June 2012; p. 1082. [Google Scholar]
  52. Wischmeier, W.H.; Smith, D.D. Predicting Rainfall Erosion Losses—A Guide to Conservation Planning; Agriculture Handbook No. 537; US Department of Agriculture Science and Education Administration: Washington, DC, USA, 1978; p. 168.
  53. Williams, J.R. Sediment routing for Agricultural Watersheds. Water Resour. Bull. 1975, 11, 965–974. [Google Scholar] [CrossRef]
  54. Renard, K.G.; Foster, G.R.; Weesies, G.A.; McCool, D.K.; Yoder, D.C. Predicting Soil Erosion by Water: A Guide to Conservation Planning with the Revised Universal Soil Loss Equation (RUSLE); Agriculture Handbook; USDA: Washington, DC, USA, 1997; Volume 703, pp. 1–251.
  55. Elwell, H.A.; Stocking, M.A. Developing a simple yet practical method of soil loss estimation. Trop. Agric. 1982, 59, 43–48. [Google Scholar]
  56. Knisel, W.G. CREAMS: A Field-Scale Model for Chemicals, Runoff and Erosion from Agricultural Management Systems; U.S. Department of Agriculture: Washington, DC, USA, 1980.
  57. Young, R.A.; Onstad, C.; Bosch, D.; Anderson, W. AGNPS: A nonpoint-source pollution model for evaluating agricultural watersheds. J. Soil Water Conserv. 1989, 44, 168–173. [Google Scholar]
  58. Arnold, J.G.; Srinivasan, R.; Muttiah, R.S.; Williams, J.R. Large area hydrologic modeling, and assessment part I: Model Development. J. Am. Water Resour. Assoc. 1998, 34, 73–89. [Google Scholar] [CrossRef]
  59. Beasley, D.B.; Huggins, L.F.; Monke, E.J. ANSWERS: A model for watershed planning. Trans. Am. Soc. Agric. Eng. 1980, 23, 938–944. [Google Scholar] [CrossRef]
  60. Laen, J.M.; Lane, L.J.; Foster, G.R. WEPP: A new generation of erosion prediction technology. J. Soil Water Conserv. 1991, 46, 8. [Google Scholar]
  61. Morgan, R.P.C.; Quinton, J.N.; Smith, R.E.; Govers, G.; Poesen, J.W.A.; Auerswald, K.; Chisci, G.; Torri, D.; Styczen, M.E. The European Soil Erosion Model (EUROSEM): A dynamic approach for predicting sediment transport from fields and small catchments. Earth Surf. Process. Landf. 1998, 23, 527–544. [Google Scholar] [CrossRef]
  62. Sharpley, A.N.; Williams, J.R. EPIC Erosion/Productivity Impact Calculator: 1. Model Documentation; USA Department of Agriculture Technical Bulletin No. 1768; USA Government Printing Office: Washington, DC, USA, 1990.
  63. Morgan, R.P.C.; Morgan, D.D.V.; Finney, H.J. A predictive model for the assessment of soil erosion risk. J. Agric. Eng. Res. 1984, 30, 245–253. [Google Scholar] [CrossRef]
  64. Koirala, P.; Thakuri, S.; Joshi, S.; Chauhan, R. Estimation of Soil Erosion in Nepal Using a RUSLE Modeling and Geospatial Tool. Geosciences 2019, 9, 147. [Google Scholar] [CrossRef] [Green Version]
  65. Milward, A.A.; Mersy, J.E. Adapting RULSE to model soil erosion potential in a mountainous tropica watershed. Catena 1999, 38, 109–129. [Google Scholar] [CrossRef]
  66. Alemayehu, T.; Furi, W.; Legesse, D. Impact of water overexploitation on highland lakes of eastern Ethiopia. Environ. Geol. 2007, 52, 147–154. [Google Scholar] [CrossRef]
  67. Assen, M. Land use/cover dynamics and its implications in the dried Lake Alemaya watershed, Eastern Ethiopia. J. Sustain. Dev. Afr. 2011, 13, 267–284. [Google Scholar]
  68. Ayala, G.; Berhanu, S.; Tolesa, O. Assessing the Effect of Soil and Water Conservation Practices on Runoff and Sediment Yield on Hunde Lafto watershed of Upper Wabi Shebelle Basin. Civ. Environ. Res. 2017, 9, 36–49. [Google Scholar]
  69. Megersa, S.L. Prediction of Runoff and Sediment Yield Using AnnAGNPS Model: Case of Erer-Guda Catchment, East Hararghe, Ethiopia. ARPN J. Sci. Technol. 2014, 4, 575–595. [Google Scholar]
  70. Setegn, S.G.; Yohannes, F.; Quraishi, S.; Chowdary, V.M.; Mal, B.C. Impact of Land Use/Land Cover Transformations on Alemaya Lake, Ethiopia. J. Indian Water Resour. Soc. 2009, 29, 40–45. [Google Scholar]
  71. Senti, E.T.; Tufa, B.W.; Gebrehiwot, K.A. Soil erosion, sediment yield and conservation practices assessment on Lake Haramaya Catchment. World J. Agric. Sci. 2014, 2, 186–193. [Google Scholar]
  72. Setegn, S.; Chowdary, V.M.; Mal, B.C.; Yohannes, F.; Kono, Y. Water Balance Study and Irrigation Strategies for Sustainable Management of a Tropical Ethiopian Lake: A Case Study of Lake Alemaya. Water Resour. Manag. 2011, 25, 2081–2107. [Google Scholar] [CrossRef]
  73. Solomon, M. Soil Erosion and Sedimentation Analysis of Lake Alemaya Catchments. Master’s Thesis, Alemaya University, Alemaya, Ethiopia, 2002. [Google Scholar]
  74. Muleta, S.; Yohannes, F.; Rashid, S.M. Soil erosion assessment of Lake Alemaya catchment, Ethiopia. Land Degrad. Dev. 2006, 17, 333–341. [Google Scholar] [CrossRef]
  75. Gebere, S.B.; Alamirew, T.; Merkel, B.J.; Melesse, A.M. Land Use and Land Cover Change Impact on Groundwater Recharge: The Case of Lake Haramaya Watershed, Ethiopia. In Landscape Dynamics, Soils and Hydrological Processes in Varied Climates; Melesse, A.M., Wossenu, A., Eds.; Springer Geography: Cham, Switzerland; Heidelberg, Germany; New York, NY, USA; Dordrecht, The Netherlands; London, UK, 2016; Volume 1, pp. 93–110. [Google Scholar]
  76. Ministry of Agriculture (MOA). Agroecological Zones of Ethiopia; MoA: Addis Ababa, Ethiopia, 2000.
  77. National Meteorological Agency (NMA). Mean Monthly Rainfall Data; NMA: Addis Ababa, Ethiopia, 2015. [Google Scholar]
  78. Food and Agriculture Organization (FAO). The Digital Soil Map of the World, Land and Water Development Division; FAO: Rome, Italy, 1995; Available online: http://www.fao.org/geonetwork/ (accessed on 20 March 2017).
  79. Landsat Look Viewer. Available online: http://landsatlook.usgs.gov (accessed on 25 January 2018).
  80. National Aeronautics and Space Administration (NASA); Land Processes Distributed Active Archive Center (LPDAAC). ASTER L1B; The United States Geological Survey (USGS)/Earth Resources Observation and Science (EROS) Center: Sioux Falls, SD, USA, 2016. Available online: http://www.gdem.aster.ersdac.or.jp/ (accessed on 28 November 2017).
  81. ERDAS Field Guide™, 5th ed.; ERDAS, Inc.: Norcross, GA, USA, 2009.
  82. Lillesand, T.M.; Kiefer, R.W.; Chipman, J.W. Remote Sensing and Image Interpretation, 5th ed.; John Wiley & Sons, Inc.: Hoboken, NJ, USA, 2004; p. 763. [Google Scholar]
  83. Department of the Interior U.S. Geological Survey. Landsat 8 (L8) Data Users Handbook; Department of the Interior U.S. Geological Survey: EROS Sioux Falls, SD, USA, 2016; p. 106.
  84. Anderson, J.R.; Hardy, E.E.; Roach, J.T.; Witmer, R.E. A Land Use and Land Cover Classification System for Use with Remote Sensor Data; U.S. Government Printing Office: Washington, DC, USA, 1976.
  85. Pontius, R.G.; Shusas, E.; McEachern, M. Detecting important categorical land changes while accounting for persistence. Agric. Ecosyst. Environ. 2004, 101, 251–268. [Google Scholar] [CrossRef]
  86. Braimoh, A.K. Random and systematic land-cover transitions in northern Ghana. Agric. Ecosyst. Environ. 2006, 113, 254–263. [Google Scholar] [CrossRef]
  87. Ouedraogo, I.; Barron, J.; Tumbo, S.D.; Kahimba, F.C. Land-cover transition in northern Tanzania. Land Degrad. Dev. 2015, 27, 682–692. [Google Scholar] [CrossRef]
  88. Zhang, X.; Wu, B.; Ling, F.; Zeng, Y.; Yan, N.; Yuan, C. Identification of priority areas for controlling soil erosion. Catena 2010, 83, 76–86. [Google Scholar] [CrossRef]
  89. Yu, B.; Rosewell, C. A robust estimator of the R-reaction for the universal soil loss eequation. Trans. ASAE 1996, 39, 559–561. [Google Scholar] [CrossRef]
  90. Renard, K.G.; Freimund, J.R. Using monthly precipitation data to estimate the R-factor in the revised USLE. J. Hydrol. 1994, 157, 287–306. [Google Scholar] [CrossRef]
  91. Han, X.; Lv, P.; Zhao, S.; Sun, Y.; Yan, S.; Wang, M.; Han, X.; Wang, X. The Effect of the Gully Land Consolidation Project on Soil Erosion and Crop Production on a Typical Watershed in the Loess Plateau. Land 2018, 7, 113. [Google Scholar] [CrossRef] [Green Version]
  92. Lo, A.; El-Swaify, S.; Dangler, E.; Shinshiro, L. Effectiveness of EI 30 as an Erosivity Index in Hawaii. Available online: http://agris.fao.org/agris-search/search.do?recordID=US8639059 (accessed on 20 August 2017).
  93. Alexakis, D.D.; Tapoglou, E.; Vozinaki, A.K.; Tsanis, I.K. Integrated Use of Satellite Remote Sensing, Artificial Neural Networks, Field Spectroscopy, and GIS in Estimating Crucial Soil Parameters in Terms of Soil Erosion. Remote Sens. 2019, 11, 1106. [Google Scholar] [CrossRef] [Green Version]
  94. Chang, T.J.; Asce, M.; Zhou, H.; Asce, S.M.; Guan, Y. Applications of Erosion Hotspots for Watershed Investigation in the Appalachian Hills of the United States. J. Irrig. Drain Eng. 2016, 142. [Google Scholar] [CrossRef]
  95. McCool, D.K.; Foster, G.R.; Mutchler, C.K.; Meyer, L.D. Revised slope length factor for the Universal Soil Loss Equation. Trans. ASAE 1989, 32, 1571–1576. [Google Scholar] [CrossRef]
  96. McCool, D.K.; Brown, L.; Foster, G.R.; Mutchler, C.K.; Meyer, L.D. Revised slope steepness factor for the Universal Soil Loss Equation. Trans. ASAE 1987, 30, 1387–1396. [Google Scholar] [CrossRef]
  97. Foster, G.R.; Wischmeier, W. Evaluating Irregular Slopes for Soil loss prediction. Trans. Am. Soc. Agric. Eng. 1974, 17, 305–309. [Google Scholar] [CrossRef]
  98. Desmet, P.; Govers, G. A GIS procedure for automatically calculating the USLE LS factor on topographically complex landscape units. J. Soil Water Conserv. 1996, 51, 427–433. [Google Scholar]
  99. Anache, J.A.A.; Bacchi, C.G.V.; Panachuki, E.; Sobrinho, T.A. Assessment of Methods for Predicting Soil erodibility in Soil Loss Modeling. São Paulo, UNESP. Geociências 2015, 34, 32–40. [Google Scholar]
  100. McCool, D.K.; George, G.O.; Freckleton, M.; Douglas, C.L.; Papendick, R.I. Topographic effect on erosion from cropland in the northwestern wheat region. T. Asabe 1993, 36, 771–775. [Google Scholar] [CrossRef]
  101. Panagosa, P.; Borrelli, P.; Meusburgerb, K.; Alewellb, C.; Lugatoa, E.; Montanarella, L. Estimating the soil erosion cover-management factor at the Europeanscale. Land Use Policy 2015, 48, 38–50. [Google Scholar] [CrossRef]
  102. De Jong, S.M. Derivation of vegetative variables from a Landsat TM image for modelling soil erosion. Earth Surface Proc. Landf. 1994, 19, 165–178. [Google Scholar] [CrossRef]
  103. Yahya, F.; Zregat, D.; Farhan, I. Spatial Estimation of Soil Erosion Risk Using RUSLE Approach, RS, and GIS Techniques: A Case Study of Kufranja Watershed, Northern Jordan. J. Water Resour. Prot. 2013, 5, 1247–1261. [Google Scholar]
  104. Arekhi, S.; Shabani, A.; Rostamizad, G. Application of the modified universal soil loss equation (MUSLE) in prediction of sediment yield (Case study: Kengir Watershed, Iran). Arab. J. Geosci. 2012, 5, 1259–1267. [Google Scholar] [CrossRef]
  105. Xu, L.; Xu, X.; Meng, X. Risk assessment of soil erosion in different rainfall scenarios by RUSLE model coupled with information diffusion model: A case study of Bohai Rim, China. Catena 2013, 100, 74–82. [Google Scholar] [CrossRef]
  106. Li, X.S.; Wu, B.F.; Wang, H.; Zhang, J. Regional soil erosion risk assessment in Hai Basin. J. Remote Sens. 2011, 15, 372–387. [Google Scholar]
  107. Troeh, F.R.; Hobbs, A.J.; Donahue, R.L. Soil and Water Conservation, 2nd ed.; Prentice-Hall Incorporation: Needham, MA, USA, 1991; pp. 81–86. [Google Scholar]
  108. Ariti, A.T.; Vliet, J.V.; Verburg, P.H. Land-use and land-cover changes in the Central Rift Valley of Ethiopia: Assessment of perception and adaptation of stakeholders. Appl. Geogr. 2015, 65, 28–37. [Google Scholar] [CrossRef]
  109. Meshesha, D.T.; Tsunekawa, A.; Tsubo, M.; Ali, S.A.; Haregeweyn, N. Land-use change and its socio- environmental impact in Eastern Ethiopia’s highland. Reg. Environ. Chang. 2014, 14, 757–768. [Google Scholar] [CrossRef]
  110. Bewket, W. Land cover dynamics since the 1950s in Chemoga watershed, Blue Nile Basin, Ethiopia. Mt. Res. Dev. 2002, 22, 263–269. [Google Scholar] [CrossRef] [Green Version]
  111. Kindu, M.; Schneider, T.; Demel, T.; Knoke, T. Land Use/Land Cover Change Analysis Using Object-Based Classification Approach in Munessa-Shashemene Landscape of the Ethiopian Highlands. Remote Sens. 2013, 5, 2411–2435. [Google Scholar] [CrossRef] [Green Version]
  112. Kibret, K.F.; Marohn, C.; Cadisch, G. Assessment of land use and land cover change in South Central Ethiopia during four decades based on integrated analysis of multi-temporal images and geospatial vector data. Remote Sens. Appl. Soc. Environ. 2016, 3, 1–19. [Google Scholar] [CrossRef]
  113. Mengistu, D.A. Remote Sensing and GIS-based Land Use and Land Cover Change Detection in the Upper Dijo river Catchment, Silte zone, Southern Ethiopia; Working papers on population and land use change in central Ethiopia; Addis Ababa University: Addis Ababa, Ethiopia, 2008. [Google Scholar]
  114. Tesfaye, S.; Guyassa, E.; Raj, A.J.; Birhane, E.; Wondim, G.T. Land Use and Land Cover Change, and Woody Vegetation Diversity in Human Driven Landscape of Gilgel Tekeze Catchment, Northern Ethiopia. Int. J. For. Res. 2014. [Google Scholar] [CrossRef] [Green Version]
  115. Fetene, A.; Hilker, T.; Yeshitela, K.; Prasse, R.; Cohen, W.; Yang, Z. Detecting Trends in Land use and Land Cover Change of Nech Sar National Park, Ethiopia. Environ. Manag. 2016, 57, 137–147. [Google Scholar] [CrossRef] [PubMed]
  116. Belay, S.; Amsalu, A.; Abebe, E. Land Use and Land Cover Changes in Awash National Park, Ethiopia: Impact of Decentralization on the Use and Management of Resources. Open J. Ecol. 2014, 4, 950–960. [Google Scholar] [CrossRef] [Green Version]
  117. Hailemariam, S.N.; Soromessa, T.; Teketay, D. Land Use and Land Cover Change in the Bale Mountain Eco-Region of Ethiopia during 1985 to 2015. Land 2016, 5, 41. [Google Scholar] [CrossRef] [Green Version]
  118. Haregeweyn, N.; Tesfaye, S.; Tsunekawa, A.; Tsubo, M.; Tsegaye, D.M.; Adgo, E.; Elias, A. Dynamics of land use and land cover and its effects on hydrologic responses: Case study of the Gilgel Tekeze catchment in the highlands of Northern Ethiopia. Environ. Monit. Assess. 2015, 187, 4090. [Google Scholar] [CrossRef]
  119. Tadesse, L.; Suryabhagavan, K.V.; Sridhar, G.; Legesse, G. Land use and land cover changes and Soil erosion in Yezat Watershed, North Western Ethiopia. Int. Soil Water Conserv. Res. 2017, 5, 85–94. [Google Scholar] [CrossRef] [Green Version]
  120. Belayneh, M.; Yirgu, T.; Tsegaye, D. Potential soil erosion estimation and area prioritization for better conservation planning in Gumara watershed using RUSLE and GIS techniques’. Environ. Syst. Res. 2019, 8, 1–17. [Google Scholar] [CrossRef]
  121. Karamage, F.; Zhang, C.; Kayiranga, A.; Shao, H.; Fang, X.; Ndayisaba, F.; Nahayo, L.; Mupenzi, C.; Tian, G. USLE-Based Assessment of Soil Erosion byWater in the Nyabarongo River Catchment, Rwanda. Int. J. Environ. Res. Public Health 2016, 13, 835. [Google Scholar] [CrossRef] [Green Version]
  122. Abate, S. Estimating soil loss rates for soil conservation planning in the Borena Woreda of South Wollo Highlands, Ethiopia. J. Sustain. Dev. Afr. 2011, 13, 87–106. [Google Scholar]
  123. Paiboonvorachat, C.; Oyan, T.J. Land-cover changes and potential impacts on soil erosion in the Nan watershed, Thailand. Int. J. Remote Sens. 2011, 32, 6587–6609. [Google Scholar] [CrossRef]
  124. Hurni, H. Guidelines for Development Agents on Soil Conservation in Ethiopia Soil Conservation Research Project; Community Forests and Soil Conservation Development Department, Ministry of Agriculture: Addis Ababa, Ethiopia, 1986.
  125. Hurni, H. Soil formation rates in Ethiopia. Ethiopian highlands reclamation study; Soil Conservation Research Project, FAO, UTF/ETH/037/ETH Working Paper 2; FAO: Rome, Italy, 1983. [Google Scholar]
  126. Yohannes, G.G. Soil Erosion Hazard in Errer Dembel Sub-Basin, in Shinille Zone of the Ethiopia Somali Regional State. Int. J. Environ. Sci. Nat. Res. 2019, 17, 555951. [Google Scholar] [CrossRef]
  127. Tesfaye, G.; Debebe, Y.; Fikirie, K. Soil Erosion Risk Assessment Using GIS Based USLE Model for Soil and Water Conservation Planning in Somodo Watershed, South West Ethiopia. IJOEAR 2018, 4, 35–43. [Google Scholar]
  128. Yesuph, A.Y.; Dagnew, A.B. Soil erosion mapping and severity analysis based on RUSLE model and local perception in the Beshillo Catchment of the Blue Nile Basin, Ethiopia. Environ. Syst. Res. 2019, 8, 1–21. [Google Scholar] [CrossRef] [Green Version]
  129. Gete, Z. Landscape Dynamics and Soil Erosion Process Modeling in the Northwestern Ethiopia Highlands; African Studies Series; University of Bern: Bern, Switzerland, 2000. [Google Scholar]
  130. Amare, B. Landscape transformation and opportunities for sustainable land management along the eastern escarpment of Wollo (EEW), Ethiopia. Ph.D. Dissertation, University of Bern, Bern, Switzerland, 2007. [Google Scholar]
  131. Jiu, J.; Wu, H.; Sen Li, S. The Implication of Land-Use/Land-Cover Change for the Declining Soil Erosion Risk in the Three Gorges Reservoir Region, China. Int. J. Environ. Res. Public Health 2019, 16, 1856. [Google Scholar] [CrossRef] [Green Version]
Figure 1. Location of the Erer Sub-Basin, North East Wabi Shebelle Basin, Ethiopia.
Land 09 00111 g001
Figure 2. Flowchart for the soil loss estimation using the Revised Universal Soil Loss Equation (RUSLE) model framed in the ArcGIS model-builder interface.
Land 09 00111 g002
Figure 3. Rainfall-erosivity (R) factor (a); Soil erodibility (K) factor (b); Slope length (L) factor (c), Slope steepness (S) factor (d); Cover management (C) factor in 2000 (e) and 2018 (f); Support practice (P) factor in 2000 (g) and 2018 (h) in the Erer Sub-Basin, North East Shebelle Basin, Ethiopia.
Land 09 00111 g003
Figure 4. Land use and land cover (LULC) map of the Erer Sub-Basin, North East Shebelle Basin, Ethiopia; (a) 2000 and (b) 2018.
Land 09 00111 g004
Figure 5. Soil erosion risk in the Erer Sub-Basin, North East Shebelle Basin, Ethiopia; (a) in 2000, (b) 2018.
Land 09 00111 g005
Figure 6. Land Cover Changes and their effects on soil erosion risk in the Erer Sub-Basin, North East Shebelle Basin, Ethiopia.
Land 09 00111 g006
Figure 7. Conservation Priority levels of the Erer Sub-Basin.
Land 09 00111 g007
Table 1. Conservation support practice (P) factor values [52].
Land Use TypeSlope (%)p Values
Agricultural land use0–50.1
5–100.12
10–200.14
20–300.19
30–500.25
50–1000.33
Nonagricultural land use0–1001.00
Table 2. Areal statistics of classified land use and land cover change (LULC) classes for 2000 and 2018.
LULC Class20002018
Area (km2)%Area (km2)%
Bare land310.008.03374.819.71
Cropland1849.7047.922484.3364.36
Forestland115.422.9954.81 1.42
Settlement7.720.2023.550.61
Shrubland1569.8840.67921.3923.87
Water body7.330.181.160.03
Total3860.051003860.05100
Table 3. Accuracy statistics for the classified LULC maps in percent.
Years/
Class Name
Classification Accuracy
Bare LandCroplandForestlandSettlementShrub
Land
Water BodyRaw TotalUser’s AccuracyCommission Error
2000
Bare land44007005186.2713.73
Cropland0800000801000
Forestland00450505090.0010.00
Settlement0002800281000
Shrubland60006507191.558.45
Water body0000020201000
Colum Total508045357020300
K^ statistics0.841.000.881.000.891
Producer’s Accuracy881001008092.86100Overall Accuracy = 94
Overall K^ = 0.93
Omission Error12.0000207.140
2018
Bare land48202005292.317.69
Cropland37401008196.303.70
Forestland0043000431000
Settlement0003200321000
Shrubland00207027494.595.41
Water body0000018181000
Colum Total51764535701300
K^ statistics0.910.951.001.000.931
Producer’s Accuracy9697.595.5691.4310090Overall Accuracy = 96.33
Overall K^ = 0.95
Omission Error42.504.448.57010
Table 4. Temporal change in the spatial extent of LULC classes in percentage (%).
LULC ClassRate of Changes (2000–2018)
Area (km2)%
Bare land64.8120.91
Cropland634.6334.31
Forestland−60.60−52.51
Settlement15.83 205.00
Shrubland−648.49−41.31
Water body−6.18−84.21
Table 5. Change matrix showing the LULC classes changes between 2000 and 2018 in percentage (%).
LULC ClassBare landCroplandForestlandSettlementShrublandWater Body2000
Bare land3.333.480.010.141.070.008.03
Cropland1.5539.040.180.166.990.0147.92
Forestland0.050.530.330.012.070.002.99
Settlement0.030.040.000.070.060.000.20
Shrubland4.7421.260.800.2213.650.0040.67
Water body0.010.010.100.010.03 0.020.19
Summary 56.52
20189.7164.361.420.6123.870.03
Table 6. LULCCs in the period 2000–2018 in percent.
LULC
Class
PersistenceGainLossTotal ChangeSWAPAbsolute Value of Net ChangeGain to
Persistence
Loss to
Persistence
Net Change to
Persistence
Bare land3.346.384.711.089.41.681.921.410.50
Cropland39.0425.328.8834.217.7616.440.650.230.42
Forestland0.331.092.663.752.181.573.308.06−4.76
Settlement0.070.540.130.670.260.417.711.865.86
Shrubland13.6510.2227.0237.2420.4416.80.751.98−1.23
Water body0.02 0.010.160.160.000.150.508.00−7.50
Total56.45 43.5543.5543.556.4937.06
Table 7. Areas (km2), percentages, and changes in soil erosion risk classes between 2000 and 2018.
Erosion Risk ClassSoil Loss
(t ha−1 y−1)
20002018Rate of Changes
(2000–2018)
Area (km2)% Area
(km2)
% Area
(km2)
%
Very low<51883.4948.871783.5046.22−99.99−5.31
Low5–101078.9027.991149.4329.7970.536.54
Low medium10–15399.0110.35405.4610.516.451.62
Medium15–20190.964.95196.455.095.492.87
High medium20–25104.222.70115.432.9911.2110.76
High25–3563.981.6674.571.9310.5916.55
Very high35–5042.511.1050.981.328.4719.92
Extremely high>5090.972.3682.602.14−8.37−9.20
Table 8. Mean soil loss rate with respect LULC classes in the Erer Sub-Basin.
LULC Class20002018
Mean Soil Loss
(t ha−1 yr−1)
Mean Soil Loss
(t ha−1 yr−1)
Bare land8.9815.78
Cropland25.7337.60
Forestland0.022.47
Settlement0.180.55
Shrubland10.1911.62
Water body0.020.26
Table 9. Change of erosion risk classes between 2000 and 2018.
Soil Erosion
Risk Class
Very LowLowLow MediumMediumHigh
Medium
HighVery HighExtremely HighTotal 2000Loss
Very low40.557.990.160.070.060.040.000.0048.878.32
Low4.5017.14.052.080.120.010.030.0527.9910.84
Low-medium0.613.144.310.181.210.790.110.0010.356.04
Medium0.220.931.381.520.020.040.430.424.953.43
High-medium0.140.480.091.060.620.010.000.302.702.08
High0.090.050.260.050.850.270.000.081.661.39
Very high0.050.000.170.010.070.650.110.021.100.99
Extremely high0.030.060.090.120.040.130.631.272.361.09
Summary 65.80
Total 201846.2029.7910.525.102.991.931.322.15
Gain5.6512.646.203.582.381.671.210.88
Net change−2.671.800.170.140.280.280.22−0.21
NP−0.070.100.040.090.451.042.00−0.17
Overall persistence (i.e., the sum of the diagonals denotes the proportion of unchanged classes account for the total area). Net change = gain – loss in percent. Np denotes a net change-to-persistence ratio (i.e., net change/diagonals of each class).
Table 10. Area of the conservation priority level of the study area.
Priority LevelArea (km2)Percentage (%)
1st priority level96.552.50
2nd priority level92.002.38
3rd priority level82.732.14
4th priority level139.873.62
5th priority level209.845.44
6th priority level444.1311.51
7th priority level903.3123.40
8th priority level1891.6349.01

