1. Introduction
Land use/land cover change (LULCC) is among the major factors that affect biophysical systems at all scales [
1]. The major concern in land use/land cover (LULC) results from their direct associations with the planet’s fundamental characteristics and processes. The productivity of land, biodiversity, land degradation, hydrological cycle, and environmental conditions are some of the processes [
2,
3,
4,
5]. LULCC interrupts the ability of natural systems to support human needs and increase the exposure of people and resources to climate change, socio-economic crises, and political worries by reducing ecosystem services [
1,
6,
7]. Additionally, local and global LULCC has increased in recent years [
4,
5,
6].
In the past, recognition of the importance of the natural environment for human well-being has been less influential in maintaining sustainable development and poverty alleviation strategies [
8,
9,
10]. However, the natural environment and poverty are highly correlated with sustainability and development. Depletion and degradation of land and water resources pose a great challenge to the sustainability of the farming system, food, income, and employment [
11]. The impacts are severe on the livelihoods of the poor, who are dependent on land and natural resources. The annual global cost of land degradation caused by LULCC and poor land management practice on cropland and grazing land is estimated to be about 300 billion United States Dollar [
12]. Sub-Saharan Africa accounts for the largest share, 22% of the total global cost of land degradation. A report by the Food and Agricultural Organization (FAO) [
13] showed that land degradation affects the health and livelihood of 1.5 billion people in the world, where women and the poor are most affected.
In recent years, the study of LULCC has become an important topic of research [
14,
15,
16,
17,
18,
19,
20,
21,
22]. Studies have shown that LULCC has been intense in the highlands of Ethiopia. In particular, the expansion of intensive agriculture, urbanization, and extraction of forest products are accelerating over time to meet the requirements of an increasing population [
14,
20,
23]. However, there are also studies that have reported different trends of LULCC. For example, Alemayehu et al. [
21] reported that agricultural land declined while the grassland increased in the Somodo watershed, southwestern Ethiopia. Miheretu and Yimer [
16] also reported the expansion of grassland and shrublands in the Gelan sub watershed, northern highlands.
LULCC processes are triggered by the interaction of anthropogenic and biophysical drivers [
14,
15,
18,
19,
20,
21,
24]. The drivers of LULCC include social, economic, biophysical, and political factors [
14,
25,
26]. The human and livestock population, different agricultural practices, urbanization, drought prevalence, and poor land-use planning have been reported as the main drivers of LULCC in Ethiopia. However, different places have different driving factors and consequences. For example, overgrazing and charcoal productions are the dominant driving factors in Afar and Somali regions of Ethiopia [
20], while forest grabbing for investments (coffee and tea plantation and, agriculture), settlements, poor law enforcement, shifting cultivation and land tenure policy has been significant drivers in southwestern Ethiopia. On the other hand, the multifaceted nature of the change drivers and their implications are often poorly understood and scarce in some regions. Furthermore, the national level investigations about the wide ranges of drivers and magnitude of LULCC and its implications are inadequate.
The upper part of the Blue Nile Basin is characterized by a very rich diversity of natural resources, including land, vegetation, genetic diversity, and water in a diverse biophysical and socio-economic environment experiencing multi-faceted pressures [
27,
28]. Population growth, deforestation, land degradation, a high rate of soil erosion and nutrient depletion, and climate variability are among the major pressures. Consequently, the intended sustainable development in different parts of Ethiopia in general and the study area, in particular, is confronted with the intensive LULCC in recent years.
Relatively abundant water resources in Ethiopia have played a minimal role in the development of the national economy. As a result, the country intends to place a priority on water resource development as an essential strategy for economic and social development [
29,
30]. The relevance of the water resources for the promotion of sustainable development, however, relies on the management of the ongoing and planned development projects.
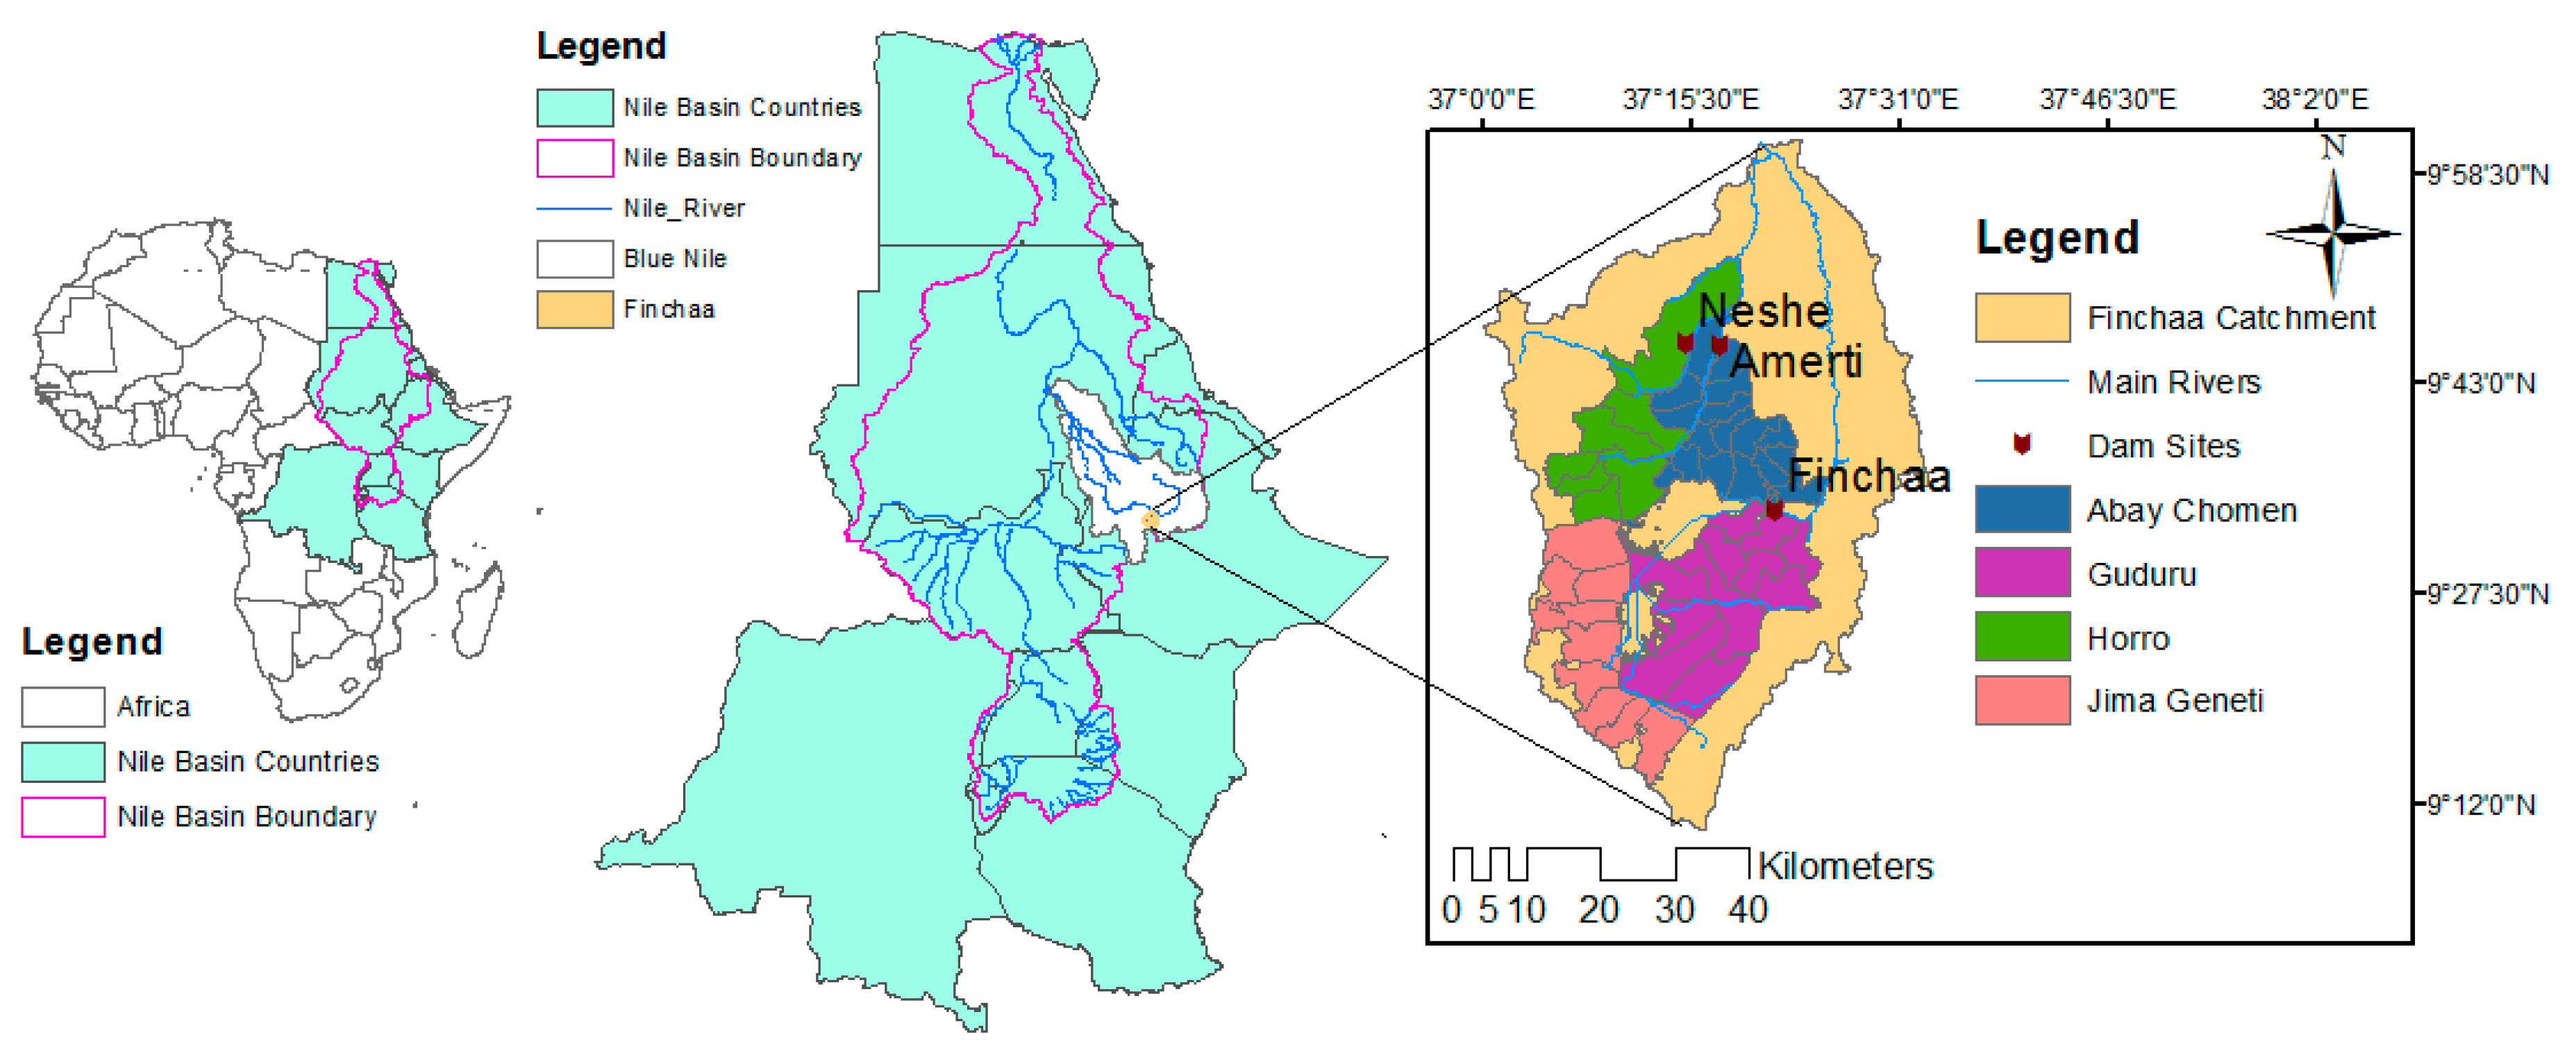
The Finchaa catchment has a large share of Ethiopia’s hydroelectric power, sugar, and ethanol supply. However, there has been limited multidisciplinary and independent research in the catchment compared to other areas. There are few studies on Finchaa catchment in LULCC [
31,
32,
33]. Ayana et al. [
31] studied how land use and management practices affect surface runoff and sediment yield based on hypothetical scenarios without considering the real spatio-temporal LULCC. Kebebew [
32] assessed the state of the LULCC in the Finchaa catchment by considering only downstream of the reservoirs, whereas Tefera and Sterk [
33] mainly focused on analyzing the LULCC caused by hydropower dam construction in Finchaa watershed. However, there is no information on the driving factors, spatial-temporal LULCC, and their implication on the entire Finchaa catchment. Thus, up-to-date and spatially accurate time series about land resources are required for the catchment. In LULCC studies, the most important activity involves advancing the understanding of the causes, processes, and patterns of the changes in different spatial and temporal scales [
26,
34]. Understanding the spatio-temporal trends of LULCC with a broader socio-ecological system at watershed scale helps to compare different part of the watershed and identify those that are at risk or susceptible to changes. This brings clear insight into the status of the watershed and helps to provide evidence-based interrelationship between the local people and watershed to facilitate more proactive approaches to maintain the water resources and land health.
The goal of this study is to investigate problems of scale and temporal variability of the LULCC in the Finchaa catchment. Specifically, the objectives of this study are (i) analyze the changes in land use/land cover over the last 30 years (1987–2017), (ii) examine the LULC inter-category transitions and the LULCC associations with slope, (iii) identify the major driving factors and explore the implications of the LULCC in Finchaa catchment.
3. Result and Discussion
3.1. Accuracy Assessment
The confusion error matrix and Kappa statistics used for the classification accuracy of 1987, 2002, and 2017 LULC maps are presented in
Table 3. The overall accuracy for the 1987, 2002, and 2017 maps was 81.7%, 85.4%, and 89.7%, respectively. The Kappa statistics were 0.78, 0.83, and 0.88 for the 1987, 2002, and 2017 maps, respectively. The Kappa statistics showed a strong agreement for the years 2002 and 2017, and good agreement for 1987 [
45].
3.2. Spatio-Temporal Distributions of Land Use/Land Cover Changes in Finchaa Catchment
Agricultural lands, the dominant land use type of the catchment, covered 36.27% of the study area in 1987, 42.64% in 2002, and 51.86% in 2017 (
Table 4). Similarly, urban and built-up areas and commercial farms increased from 1987 to 2017. The proportion of urban and built-up in 1987, 2002 and 2017 was 0.12%, 0.27%, and 1.91% of the total area, respectively. The swampy area and water bodies covered 3.57% and 4.31% area of the catchment in 1987, 3.12% and 5.94% in 2002, and 2.49% and 6.05% in 2017, respectively. With the construction of a sugar factory in the lowland areas of the catchment, sugar cane plantation began to appear around 1994. In 2002, the area of the commercial farm was around 4577.5 hectares (1.38%). Since the factory planned to double the production of sugar, the area coverage of sugarcane plantation expanded. Further, the new plantation site was established downstream of Neshe hydropower around 2012. Consecutively, the farm was expanded to 18372.7 hectares (5.55%) in 2017.
In 1987, forestland, rangeland, and grazing land were the major LULC accounting for 21.55%, 20.63%, and 13.55% of the catchment, respectively. Similarly, forestland, rangeland, and grazing land were the major LULC in 2002 and 2017. For the periods of 1987 to 2002 and 2002 to 2017, forestland and rangeland showed the highest decline, whereas agricultural land showed the highest increase. Comparatively, the LULCC was higher for the changes from 2002 to 2017 than the changes from 1987 to 2002.
The distribution of LULCC over 30 years is given by
Figure 2. Expansion in agriculture, commercial farm, and urban and built-up showed continuous increase whereas forestland, grazing land, range lands, and swampy area showed a continuous decline.
The spatio-temporal distribution of the LULC in the Finchaa catchment is presented in
Figure 3. The expansion of the commercial farm was in the lowland areas of the catchment, whereas the major changes in water bodies were upstream of the catchment. The area of grazing land, mainly short grasses with intermittent wetlands, were found in the upper part of the catchment in the Guduru District.
3.3. LULC Inter-Category Transitions and Changes Trajectories in Finchaa Watershed
The LULCC analysis of Finchaa showed that the catchment experienced intricate LULC transitions. LULC matrix was developed for the 1987–2002 and 2002–2017 transitions. Through the matrix, the areas gained, lost, persisted, and swapped among the LULC types were calculated (
Table 5).
During 1987–2002, the highest losses occurred in rangeland class, followed by forest land and grazing land. Urban and built-up areas followed by water bodies and swampy areas showed the lowest loss. Similar patterns of changes were observed during the 2002–2017 period with the highest losses shown by rangeland, followed by forest land and agricultural land, whereas the lowest loss was shown by urban and built-up followed by swampy area and water bodies. The highest gain for the period of 1987–2002 was shown by agricultural land followed by rangeland and forest land, whereas the lowest gain was shown by urban and built up followed by water bodies. For period’s 2002–2017, agricultural land followed by rangeland and grazing land has shown the highest gain while water bodies followed by swampy and urban and built-up area shows the lowest gain.
Concerning net persistence, the ratio of the net change (gain–loss) to diagonals of each class, urban and built-up area has shown the highest net change to persistence ratio during 1987–2002 and 2002–2017. The highest net change to persistence ratio implies the lowest persisting class of the LULC. The lowest persisting LULC class in the Finchaa catchment was urban and built-up followed by rangeland during 1987–2002, whereas agricultural land followed by grazing land has shown the highest persisting LULC class. During 2002–2017, urban and built-up, and commercial farm were the lowest persisting LULC, and water bodies followed by agricultural lands were the highest persisting LULC classes.
3.4. Land Use/Land Cover Change with Slope Gradients in Finchaa Catchment
The continuous demand for agricultural land brought changes in LULC, especially in higher slope areas. A large part of the land (22.7%) was found in moderately rolling (8% to 15%), followed by the strongly rolling slope (15% to 30%) with the dominant agricultural land. In 1987, forest lands were higher in undulating slope (2% to 5%), followed by the gently rolling slope (5% to 8%). However, in 2017 forest land was higher in the hilly slope (30% to 60%), followed by a strongly rolling slope. The shift by forest land dominance from the undulating and gently rolling to the hilly and strongly rolling was owing to the agricultural land expansion, urban and built up, and increased water body on the lower slopes. Over the three decades (1987 to 2017), agricultural land expanded with the maximum rate of expansion shown on slope classes of strongly rolling to very hilly. The forestland was decreased in all slope ranges with the maximum rate of loss in gently undulating to moderately rolling slopes. Likewise, the swamp area was decreased in all slope ranges.
From 1987 to 2017, the urban and built-up area expanded in all slope ranges with the highest expansion on the moderately rolling to gently rolling slopes. Grazing land was increased only on the slope ranges of 2–5% and 0–2% (gently undulating). The water bodies increased on all slope ranges except with higher slope areas. The highest increase by water bodies was shown on slope ranges from 0% to 2%. In contrast to water bodies, rangeland decreased on all slope ranges except in very hilly slope areas. The highest decline was shown in the slope ranges from 8% to 15%.
The spatial distribution of LULCC with terrain slope in 1987 and 2017 is given in
Table 6. Water bodies are dominant in 0% to 2% slope. However, in 2017, water bodies have increased in the slope range of 2–5% due to the construction of the Neshe reservoir.
3.5. Drivers and Impacts of Land Use/Land Cover Change
The results of FGDs, KIIs, and field observation revealed that both anthropogenic and natural processes derived LULCC. However, anthropogenic activities were found to be predominant and immediate as compared to the natural process as a driver of LULCC. Further, some drivers are not only limited to local specific issues; rather, they are regional, national, and global issues. From a range of different drivers, respondents perceived six human-related activities as major drivers of LULCC in the study area (
Table 7). The ranks are derived based on how the variables were selected frequently by the respondents.
Based on the information from KIIs and FGDs, the underlying causes of these drivers are the interrelated demographic, socio-economic, institutional, and technological factors. High population growth was perceived as the major driver of the demographic factor causing LULCC. According to the 2007 Population and Housing Census of Ethiopia, the total population of the Horro Guduru Wollega zone was 570,040 [
46]. The population was estimated to be 691,871 in 2014 and 747,158 in 2017 [
47]. According to KIIs and FGDs, resettlement, immigration, and natural population increases are the causes of population increase.
KIIs and FGDs showed that the focus of the government to build hydropower projects and irrigation projects were among the major socio-economic and institutional causes of LULCC. The expansion of irrigation projects increased commercial farms, and the construction of reservoirs increased water bodies in the catchment. Infrastructure and built-up are also increasing in the catchment. For example, the construction of institutes like the Teacher Training College, Technical and Vocational Education and Training, private colleges, the Wollega University Shambu campus, a sugar factory, the Horro Cattle breed production center, and the Shambu referral hospital contributed to urban and built-up area expansion.
The expansion of hydropower projects has displaced the community from their farmland and forced them to resettle in other places without adequate compensation. The increased resettlement on unproductive lands coupled with the relative depreciation of agricultural land made it difficult for inhabitants to remain, forcing them to move. Further, the lack of jobs for youths and urban developments in the catchment amplified the socio-economic activities for LULCC. Group discussions with the community and interviews with agricultural experts on how the construction of projects and weak environmental consideration caused LULCC were added as follows:
“The construction of Fincha Dam 1973, Amerti Reservoir in 1987, and Neshe Dam in 2012 displaced many households from their farmland and made the community landless. Then, those who have good wealth moved to the town and settled. The poor were forced to work for others who have owned land in other places. Others are also moved to the town to work daily labor activities.”
(Community Members, Abay Chomen District and Horro District, Focus Group Discussion, March 2018)
“The displacements of the community from reservoir areas have made land scarcity, especially in highland parts of the catchment. Consequently, there were efforts to drain wetlands mainly for agricultural land expansion, which was described in the local language as ‘Duula Caffee Qoorsuu’ to mean campaign of wetland draining. On the other hand, wetlands are not equally valued as natural resources. For example, there is no one accused of wetland degradation. The use of wetlands for agriculture limited the area of communal grazing where many livestock populations were allowed for grazing.”
(Agricultural Officer, Guduru District, Key Informant Interview, April 2018)
The expansion of agriculture on communal and private grazing lands reduced the area of grazing lands. Consequently, a small area of land is used frequently for grazing a livestock population beyond its capacity. The experience of the community in using controlled grazing is low.
According to KIIs and FGDs, the community perceived six major consequences of LULCC in Finchaa catchment. These include the decline of agricultural yield, biodiversity, and habitat loss, low and decreasing profitability of farmers, land and soil degradation, water resource decline, and extended aridity and drought.
Losses of soil fertility have caused the decline of agricultural yields. The following quotes show how crop yield and soil fertility is related to the profitability of the farmers:
“Agricultural yields are declined from time to time. Farmer’s profitability from agriculture is decreasing. In some areas, the application of fertilizer is not adequate to recover crop yields due to the high decline in soil fertility. Soil acidity is increasing in the region and lack of adequate resources to treat soil acidity have worsened the situation.”
(Agricultural Officer and Development Agent, Jima Geneti District, Key Informant Interview, May 2018)
“In the past, we used to produce adequate yields. But now, we are losing some parts of our farms as the land is becoming less fertile, and we are not getting adequate yields. Even, the benefits from the crop yields are not enough to cover the cost of the fertilizer. We are struggling just to get a hand to mouth production, and we are unable to support our children for a better life.”
(Farmer group, Jima Geneti District, Focus group Discussion, May 2018)
The beginning and expansion of the commercial farms initiated the community to start new cultivation in the lowland areas. A 67-year-old man described the past and present situation in the catchment as follows:
“I was born and grew up in Gudane village. When I was young, forestland, woodlands, and grasslands covered a significant portion of the area, and there were a variety of animals. I used to hunt animals like buffalo and bushbuck with my friends. But now, the forests are cleared, and it is difficult to find animals like buffalo in the area.”
(Abay Chomen District, March 2018)
The interview with the natural resource management expert on forest degradation was
“The community used to destroy forests to have new farmland, to build settlements, for charcoal and domestic fuel, timber and woodworks. Further, farmers expand agricultural lands to natural forests. After cutting the natural forests, the farmers plant exotic trees such as eucalyptus (Eucalyptus globulus), which were mechanisms to own the land. Consequently, forest covers are reduced to remnants and are remained around high pick mountain areas, inaccessible areas, and along streams and valleys areas.”
(Natural Resource Management officers, Abay Chomen District and Horro District, Key Informant Interview, March 2018)
Currently, landslides have become the common form of land degradation in Jima Geneti (upstream of Fincha Reservoir). They are the main sources of sediment/siltation for the reservoir. An expert interview regarding landslides and their challenge was quoted as follows:
“Landslide was found to be the major problems that destroyed the farmlands, roads, and sometimes houses. The community sometimes perceives landslide as a natural process. However, the areas affected by landslides are areas that have been covered with forest once, but the forest is cleared now and areas that receive high erosion from the hillside. Erosion from the roadside, where there is no proper outlet, also caused gully and landslides. The efforts to manage landslide was limited by resources and skill required as landslide is becoming frequent.”
(Natural Resources Management Officer and Environment and Climate Change Officer, Jima Geneti District, Key Informant Interviews, May 2018)
The other implication of LULCC revealed in the catchment was the decline of water resources. The discharges from the agricultural field and pollution from urban and domestic wastes are specified as the causes of water resource pollution in the catchment. The interview with the natural resource management expert regarding the status of the reservoir areas and streams described the issue as
“There is no established buffer zone for the reservoir areas, and there are no stream protections. The farmers cultivate until the edge of the stream and the streams are exposed to siltation and scouring by soil erosion. Braided rivers are formed when erosion deposits soil and the river depth gets decreased and begin to form new channels and even change the flow course.”
(Natural Resources Management officer, Horro District and Abay Chomen District, Key Informant Interview, March 2018)
“In several areas within the catchment, groundwater is an important source of water supply. In areas where wetlands are drained, the springs are dried out, the levels of hand-dug wells are declined.”
(Zonal Water Resources Officer, Horro Guduru Wollega Zone, Key Informant Interview, March 2018)
The field observation result was consistent with the interview. When the level of water in the reservoir area declines, free land will be formed. Then, farmers will use the free land for winter cultivation (locally named “Bone”) and when the reservoir fills, it will submerge the farm areas and take all the minerals and soil into the reservoir.
Figure 5 shows a free area used for winter cultivation around the Fincha reservoir.
5. Conclusions
The quantitative spatio-temporal evidence obtained through interpretations of satellite images shows that Finchaa has undergone significant LULCC since 1987. Between 1987 and 2017, agricultural land, commercial farm, urban and built-up areas increased while rangeland, grazing lands, and swampy area decreased. The transition matrix developed to assess inter-category transitions and the change trajectories highlight the dominant dynamic events and internal conversions between LULC classes. The urban and built-up areas show the highest ratio of the net change to persistence, whereas agricultural land has shown the lowest net change to persistence ratio in the 1987–2002 transition. In general, the highest net change to persistence ratio is associated with the lowest persisting LULC classes. The spatial distribution of LULCC with slope shows a continuous expansion of agriculture and settlement and a reduction of forestland and swampy along all slopes. The rangeland has been decreased in all slope ranges except hilly slope areas.
Agricultural expansion, urbanization and infrastructure developments, timber and woodworks, resettlement, uncontrolled grazing, and weak environmental considerations were identified as the major driving factors of LULCC. The adverse impacts of LULCC are associated with the underlying causes of human activities related to the environment, socio-economic, biophysical, and institutional problems. The decline of agricultural yield, biodiversity and habitat loss, low and decreasing profitability of farmers, land and soil degradation, water resource decline, and extended aridity and drought are the major impacts of LULCC perceived by the community. Notably, increased cultivation of lands situated either on steep slopes or in flood-prone areas requires urgent action to avert the challenges of land and soil degradation as it is threatening the survival of forest remnants and other important natural resources. Further, the lifespan of the three reservoirs in the catchment depends on the sustainability of natural resources management.
The qualitative and quantitative study of the LULCC, its driving forces, and the impacts presented in this study could help a decision-maker by providing information that supports integrated watershed management and future developments. Special attention should be given to rehabilitate the degraded lands and to protect the natural resource in the catchment. With this, the undesirable effects of complex environmental dynamics in the catchment can be reduced.


