Abstract
One of the major consequences of expansive urban growth is the degradation and loss of productive agricultural land and agroecosystem functions. Four landscape metrics—Percentage of Land (PLAND), Mean Parcel Size (MPS), Parcel Density (PD), and Modified Simpson’s Diversity Index (MSDI)—were calculated for 1 km × 1 km cells along three 50 km-long transects that extend out from the Adelaide CBD, in order to analyze variations in landscape structures. Each transect has different land uses beyond the built-up area, and they differ in topography, soils, and rates of urban expansion. Our new findings are that zones of agricultural land fragmentation can be identified by the relationships between MPS and PD, that these occur in areas where PD ranges from 7 and 35, and that these occur regardless of distance along the transect, land use, topography, soils, or rates of urban growth. This suggests a geometry of fragmentation that may be consistent, and indicates that quantification of both land use and land-use change in zones of fragmentation is potentially important in planning.
1. Introduction
Projections suggest that over two-thirds of the world’s population will live in urban centres by 2050 [1], and that a major part to this growth will be due to people migrating from the countryside [2,3,4]. Over the last 30 years, the global rate of urban land occupation [5,6] has been double the rate of urban population growth [7]. Agricultural land loss due to urbanization has been highlighted by a number of researchers [8,9,10,11,12,13,14], and has raised a number of environmental concerns; e.g., declining quality of soil and water assets, loss of natural habitat, decreased plant and animal diversity, and compromised ecological functions [15,16]. The urban sprawl that can be anticipated (given urban population projections) will increase demands for land for housing, industry and infrastructure; thereby consuming more agricultural land at the edges of cities [2,17,18]. This will lead to irreversible and unsustainable land–use transitions at the cost of productive agricultural land in peri-urban areas [19,20,21], where open spaces and scarce remnant ecosystems with high ecological and conservation values are already threatened [22].
Urban fringes—the transitional zones between urban and rural areas [23]—are characterized by highly dynamic, spatially heterogeneous land-use and land-cover changes [24,25]. This takes place because of the relatively lower land prices in these zones and the high frequency of land tenure change [26,27]. Compared to urban environments, the faster rates of housing and infrastructure growth and the higher proportion of remnant ‘green’ spaces lead to different landscape structures at the fringe. Research has also demonstrated that urban growth leads to increased land fragmentation [28] and landscape diversity [29] in these areas. The diverse arrays of land uses that result from these processes create spatially heterogeneous, complex land-use configurations [30,31,32,33,34]. However, a concern for planners and people implementing land management policies in urban fringe environments is that the quantitative land-use data they require is often accompanied by relatively low levels of accuracy [35,36].
A recent development in understanding the influence of urbanization on land use has been the use of urban-to-rural gradient analysis [34,37,38]. This concept originated as a combination of elements drawn from landscape ecology and urban ecology [39,40], and has been used to synthesize complex anthropogenic land transitions worldwide [31,34,41,42,43,44,45,46,47]. The continuous representation of land-use intensity and the spatial arrangement of land use along gradients is more effective in land-use planning than conventional, discrete spatial measurements [48]. Urban-to-rural gradient analysis is also useful for examining gradual landscape change at urban fringes. The approach has other advantages, e.g., in environmental modeling it is used to minimize subjectivity in categorizing variability, and in describing ecological processes at urban fringes [49]. It is also used to represent land-use as a gradient and for measuring the spatial attributes of land parcels along gradients, both of which improve our ability to interpret landscapes [31,50]. Geographically-referenced points along gradients enable spatial and non-spatial data to be aggregated for systematic landscape comparisons [51,52,53]. Finally, these continuous information gradients can be utilized to understand landscape structures and potential land-use variations in complex land systems.
Landscape metrics calculated along these gradients have been used to identify land structure elements, and their changing patterns, to describe the effects of urban development at the margins of several cities [31,34,42]. Vizzari and Sigura [48] claim that gradient analyses enable interactions between land-use types to be identified precisely when exploring land transitions. In this research, landscape structure is defined as the spatial configuration of land parcels (i.e., their size and spatial arrangement) and their composition (land-use presence and amount of each land parcel in the landscape) [54].
This paper reports the application of urban-to-rural gradient analysis to understand agricultural land fragmentation at the urban fringes of Adelaide. In previous research, landscape metrics have been plotted along transects, but the relationships between them have not been integrated into gradient analyses. Four landscape metrics—Parcel Density (PD), Mean Parcel Size (MPS), Percentage of Land (PLAND) and Modified Simpson’s Diversity Index (MSDI)—were used to quantify and characterize land fragmentation along transects extending from the Adelaide CBD into surrounding rural areas. A novel element of the research is the quantitative analysis of agricultural land-use presence in zones of active land fragmentation at the urban fringe. In this context, urban-to-rural transects were used as georeferenced land-use information gradients that integrate measurements of land-use, while simultaneously examining landscape structure and land-use changes.
2. Materials and Methods
2.1. Study Area
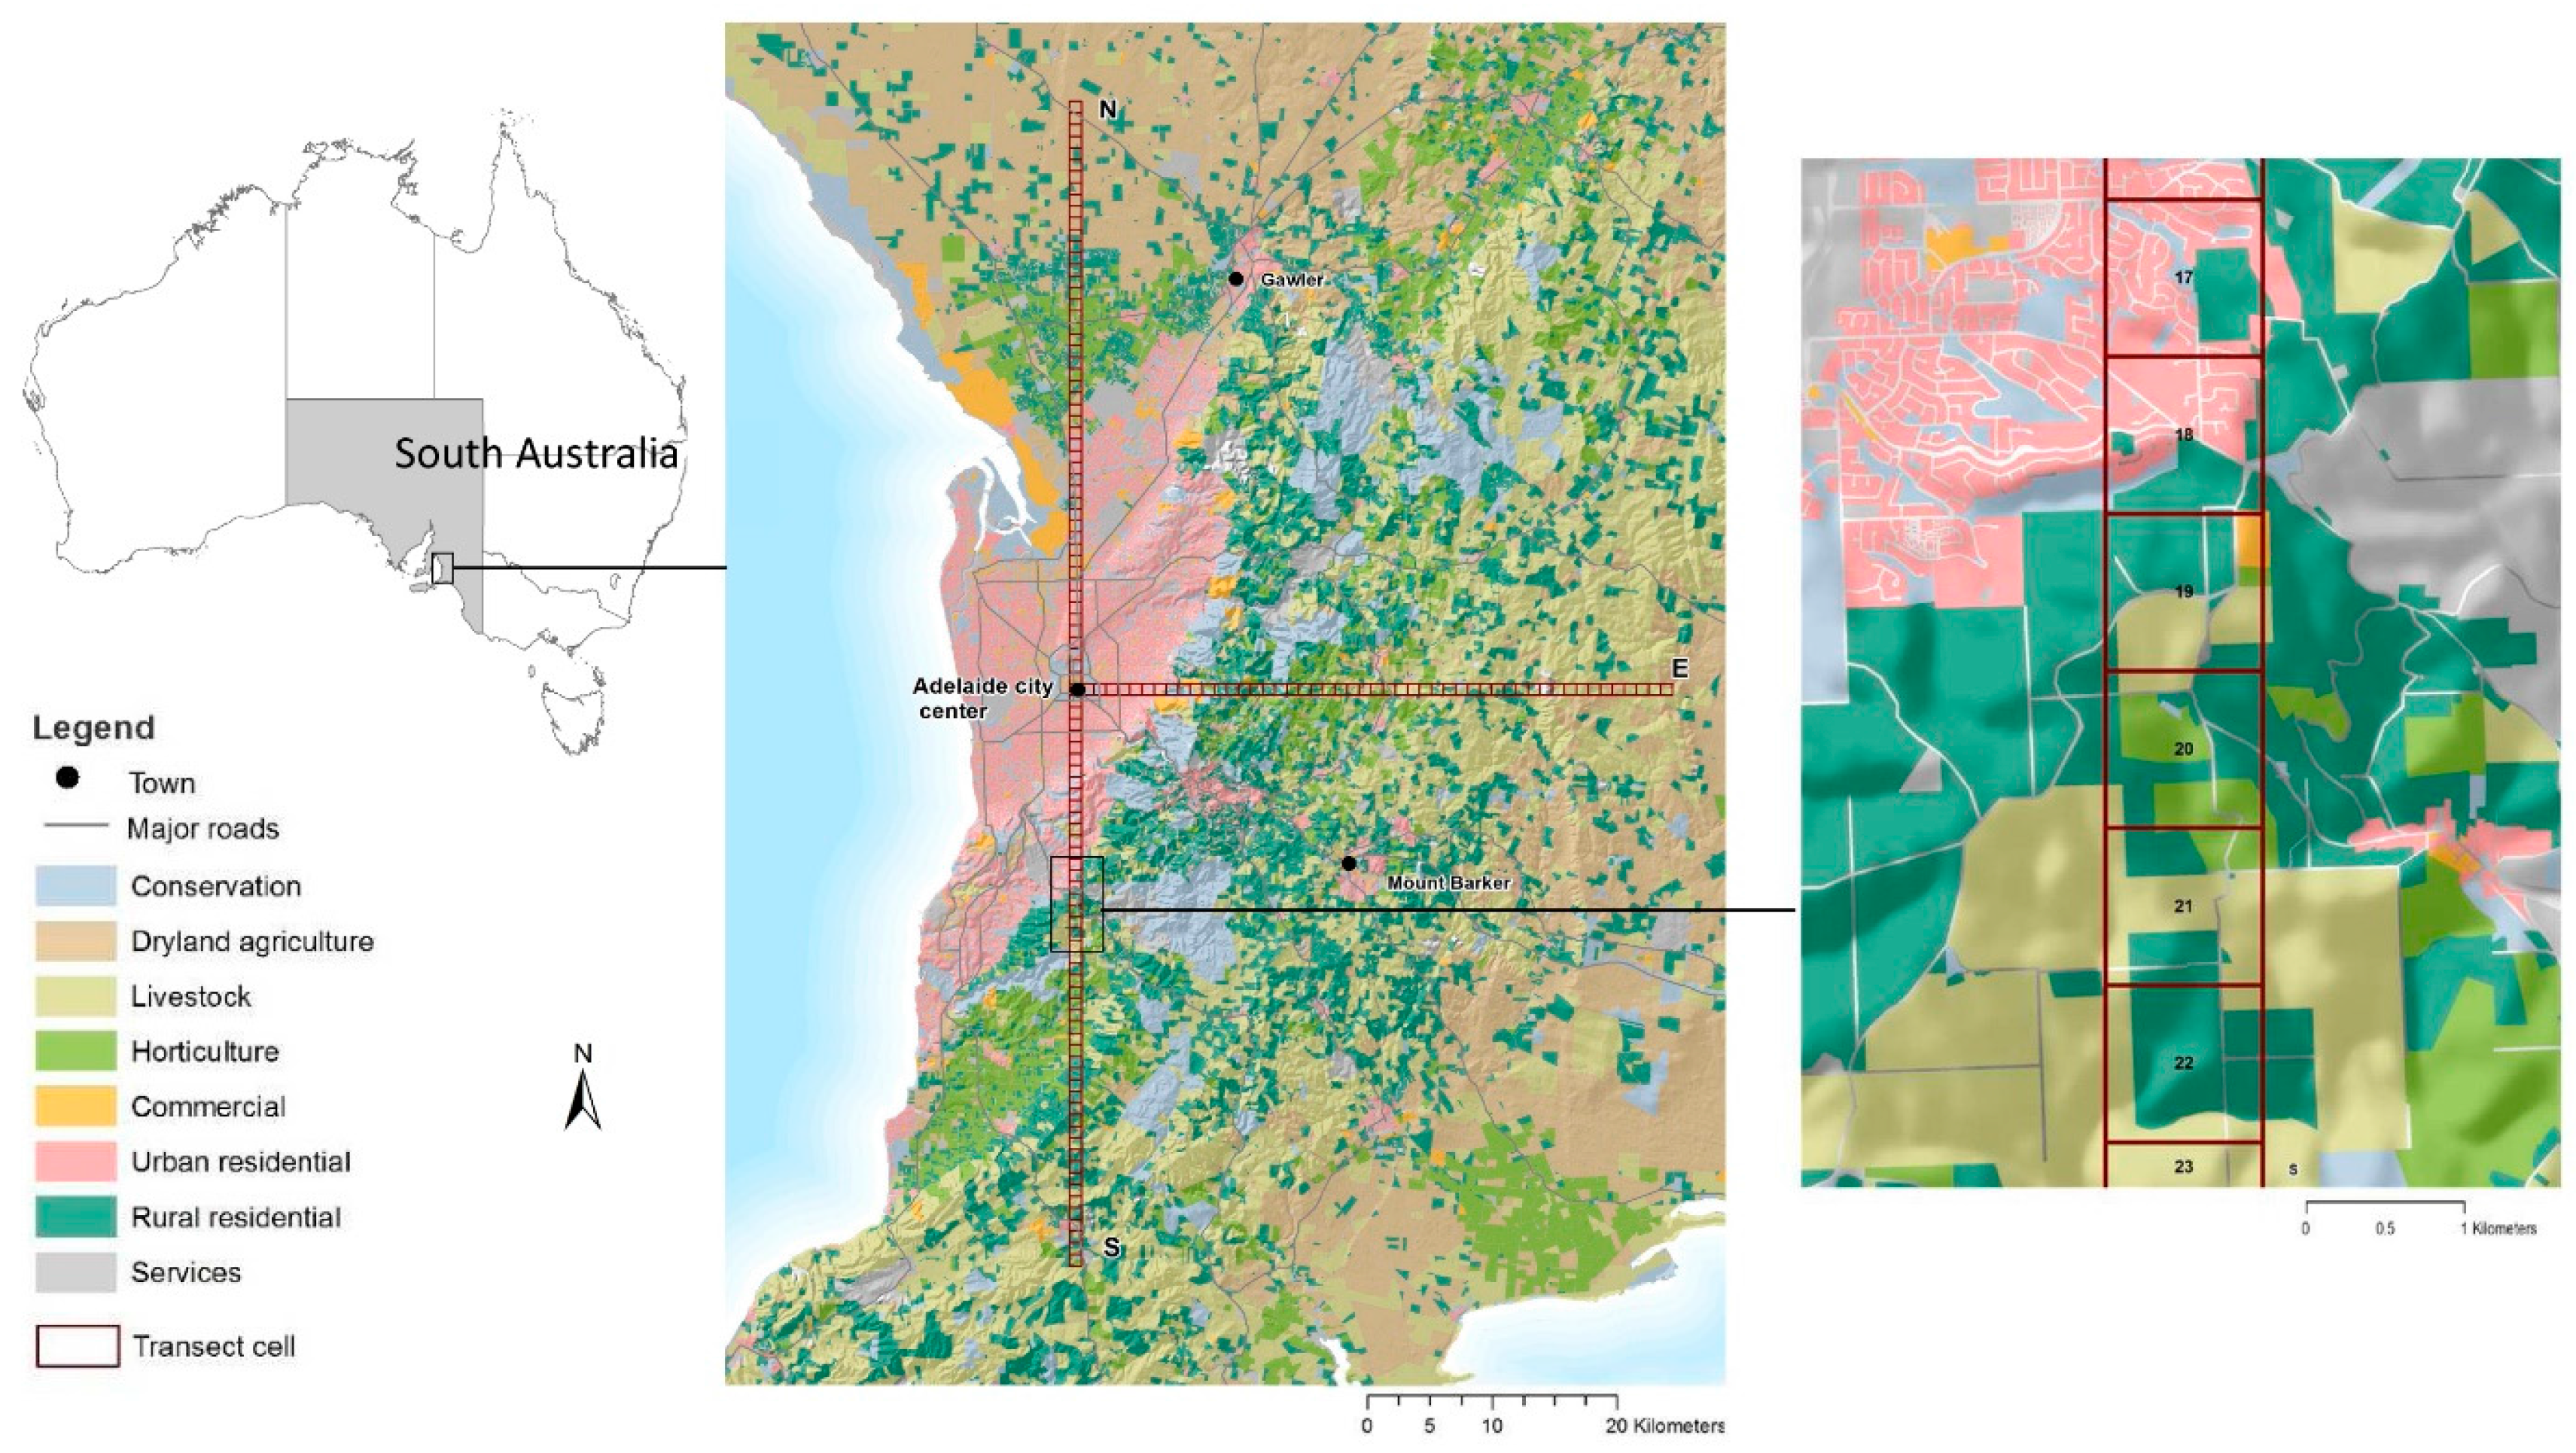
Adelaide—the capital of South Australia—is a coastal city surrounded by sprawling residential and modern industrial suburbs to the north and south. In addition, satellite towns to the east and north, Mount Barker and Gawler (Figure 1), are being incorporated into the urban fabric of the metropolitan area. Adelaide’s fringes are urban frontiers that impinge on intensive horticulture and dryland agriculture in the northern plains; a conservation green belt with mixed agricultural land use in the Adelaide Hills to the east; and traditional agricultural areas focused around high value, globally-recognized wine regions to the south (McLaren Vale) and north-east (Barossa Valley). Population growth and economic diversification are increasing the demand for land for housing, transport and industrial infrastructure. In turn, this has led to significant pressure on adjacent productive agricultural land.
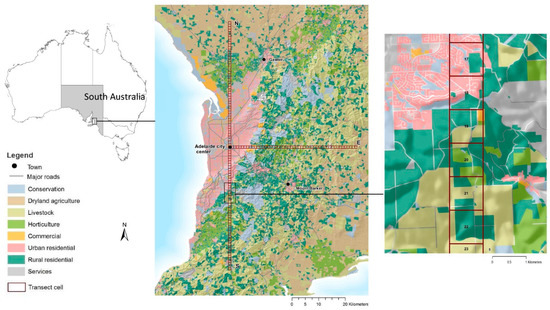
Figure 1.
Land-use distribution in Adelaide and its surrounding areas (Source: DPTI 2014). The urban-to-rural transects are overlain in red. The inset map to the right shows an enlargement of the urban-to-rural transect south of the city.
The variations in rural land use at the northern, eastern and southern margins of Adelaide provide a heterogeneous setting in which to test urban-to-rural gradient analysis. Transects were used to sample land-use gradients 50 km outwards from the Adelaide CBD in northerly, easterly and southerly directions (Figure 1).
Previous researchers using gradient analysis [31,55] have mapped urban-to-rural gradients along transport corridors. It is probable that this leads to a bias toward the investigation of urban land use. However, as this paper’s research focus is on the incorporation of different types of agricultural land into an expanding urban area, it was decided to maximize the agricultural land use considered in the gradient analysis. Therefore, they were not oriented along main routes out of Adelaide, but in three cardinal directions. In fact, there are many routes out of Adelaide, which are orientated in a variety of directions. Therefore, each of these transects has some transport corridor influence. The transects were sampled over 50 km so that they are comparable and of sufficient length to cover all the types of parcels where agricultural land is being incorporated into the urban fabric of the city.
This study uses a single statewide cadastral dataset produced by the South Australian Government’s Department of Planning, Transport and Infrastructure (DPTI) in 2014, which is publically available online (http://data.sa.gov.au). The primary purpose of this dataset is to assess council rates and levies based on land parcel valuations. The attributes of the dataset that are pertinent to this research are: land parcel identity codes; land-use categories; and the land-use classes occurring in each of the land parcels. It contains nineteen land-use categories (Table 1), which were regrouped into eight land-use classes for the purposes of this research. Sixteen categories were regrouped into five land-use classes—Conservation, Urban residential, Rural residential, Commercial and Services. Three categories—Dryland agriculture, Livestock land and Horticulture land—were not changed.

Table 1.
Scheme used to reclassify land-use categories in the cadastral dataset (2014) to land-use classes for this research.
2.2. Urban-To-Rural Gradients at Urban Fringes
Urban-to-rural gradients [34] were used to visualize and analyze land use along three 50 km long transects, each of which comprise 50 1 km × 1 km cells. ArcGIS© 10.2.1 (ESRI: Redlands, CA, USA) was used for all spatial data analyses. The 1 km2 cell-based transects were produced using the Fishnet tool by defining the spatial areas for cell references. They were overlain on the cadastral dataset and land-use information extracted for each cell. These data were then compiled using the tabulation tool in ArcGIS spatial analyst extension. Each cell in the resulting dataset includes a unique identifier and the areas of each of land-use class (Table 1) within each cell.
Landscape metrics have been used extensively in conservation biology, but their application in land-use research to measure, characterize, analyze, and visualize landscape structure is far less common, particularly in urban areas [41,56,57,58]. Four landscape metrics were calculated from the attributes for each cell in the three transects (Table 2). The percentage of each land-use class in each cell (PLAND) provides data on compositional changes in land use along the gradients. MPS and the PD are measurements of key spatial features along the transects. Finally, MSDI is a measure of the proportional abundance of the land-use classes in each cell, and is an indicator of land-use diversity. Plots of each of the metrics for each gradient enabled landscape structures to be visualized and analyzed.

Table 2.
Landscape metrics used for spatial feature characterization.
2.3. Landscape Matrix Analysis
The relationships between MPS and PD were investigated to examine the extent of land fragmentation with distance along each transect. The associations between MPS and PD demonstrate probable land structure variations in the landscape, and trend lines were used to visualize the nature of the relationships between MPS and PD.
The study area contains the following median land parcel areas: LL (Livestock land) (59 ha), DL (Dryland cultivation) (50 ha), and HL (Horticultural land) (12 ha). HL has a minimum size of 2.5 ha, which probably represents intensive irrigated vegetable cultivation or small vineyards. The median (12 ha) to minimum (2.5 ha) size of HL land parcels allows the range in the number of agriculture-based land parcels which are likely to occur in a 1 km2 (100 ha) cell to be estimated. Horticultural land (HL) was used to define the PD range between 7 and 35 N/km2, because it is the agricultural land-use type with the smallest median parcel size. Therefore, it is the land-use class that will provide the maximum number of land parcels in a 1 km2 (100 ha) cell. It is believed that this range of values indicates a high potential for transforming agricultural to urban land-uses at urban fringes. This is due to high property values, proximity to built-up areas, and that they frequently experience government-promoted land subdivision and land re-zoning for urban development. Rauws and De Roo [26] have identified these land-use change drivers as “pull factors” which are influenced by urban economies converting non-urban land uses to urban form at the peri-urban areas. Therefore, in the scatter diagrams, a common range of PD from 7 to 35 N/km2 is used; where a 1 km2 cell can have 7 to 35 land parcels/km2 that are highly vulnerable to change in land use. The agriculture-based land parcel information associated with the cells from the land cadastral dataset was extracted within this range of patch densities.
3. Results
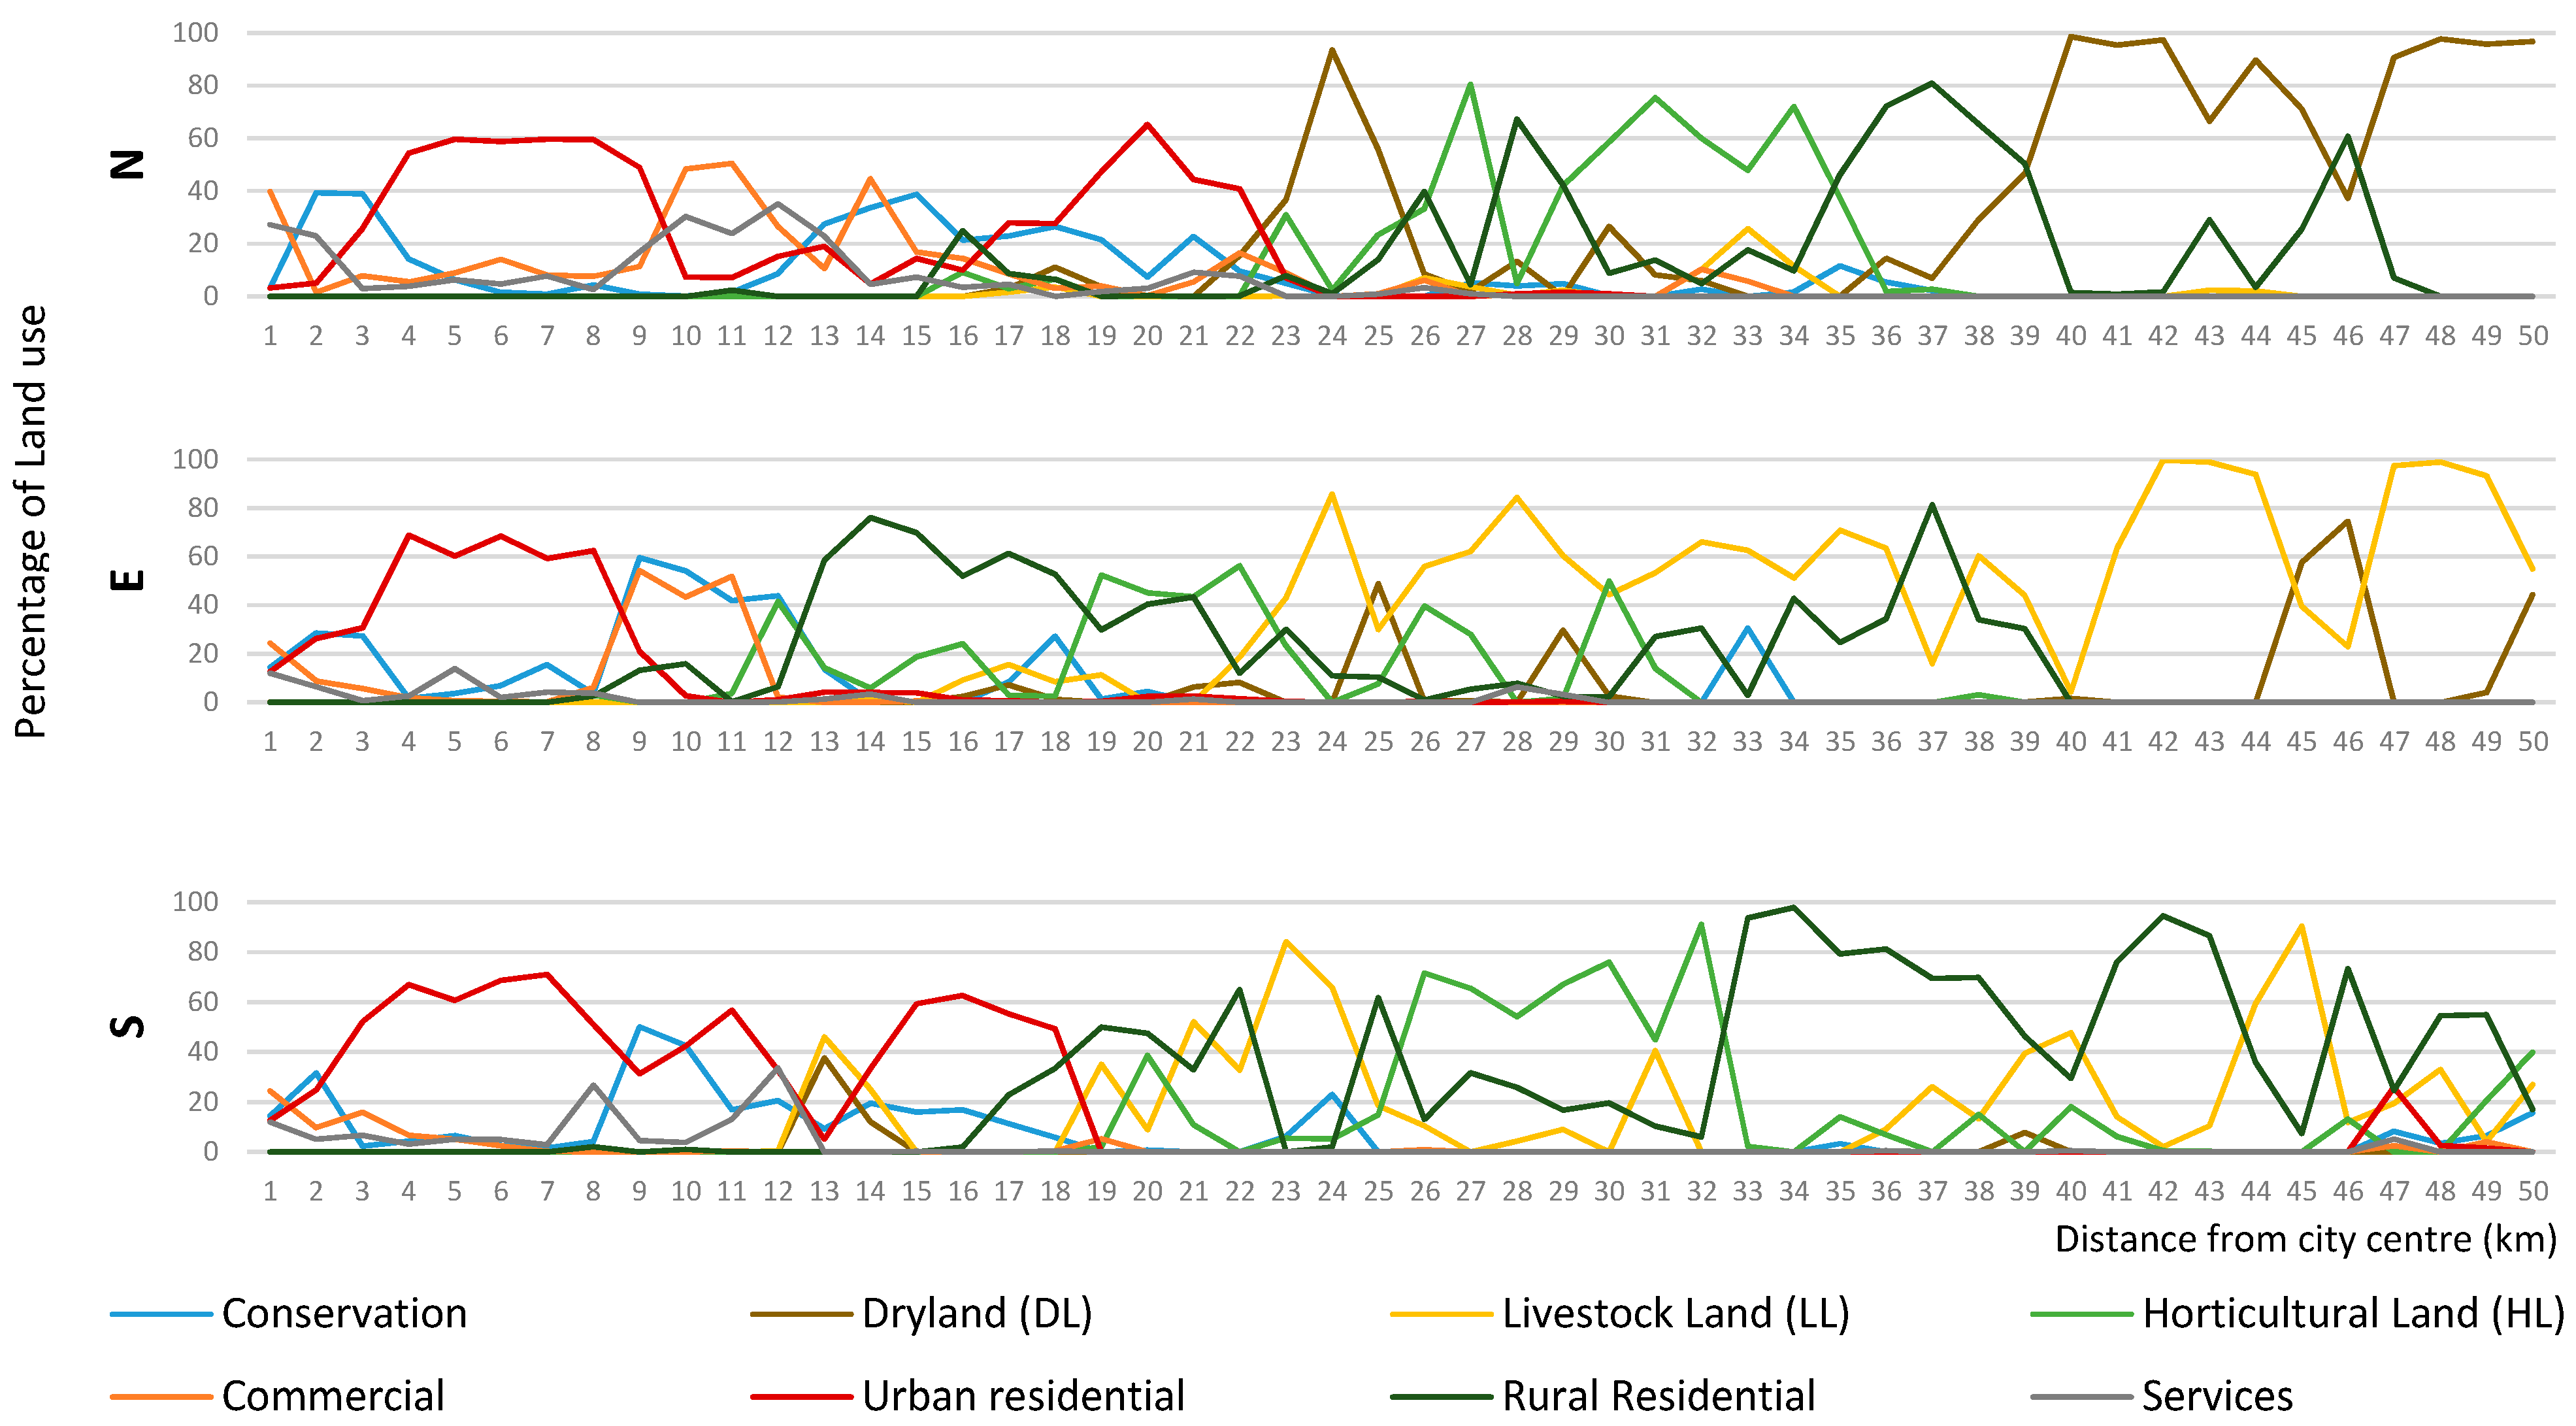
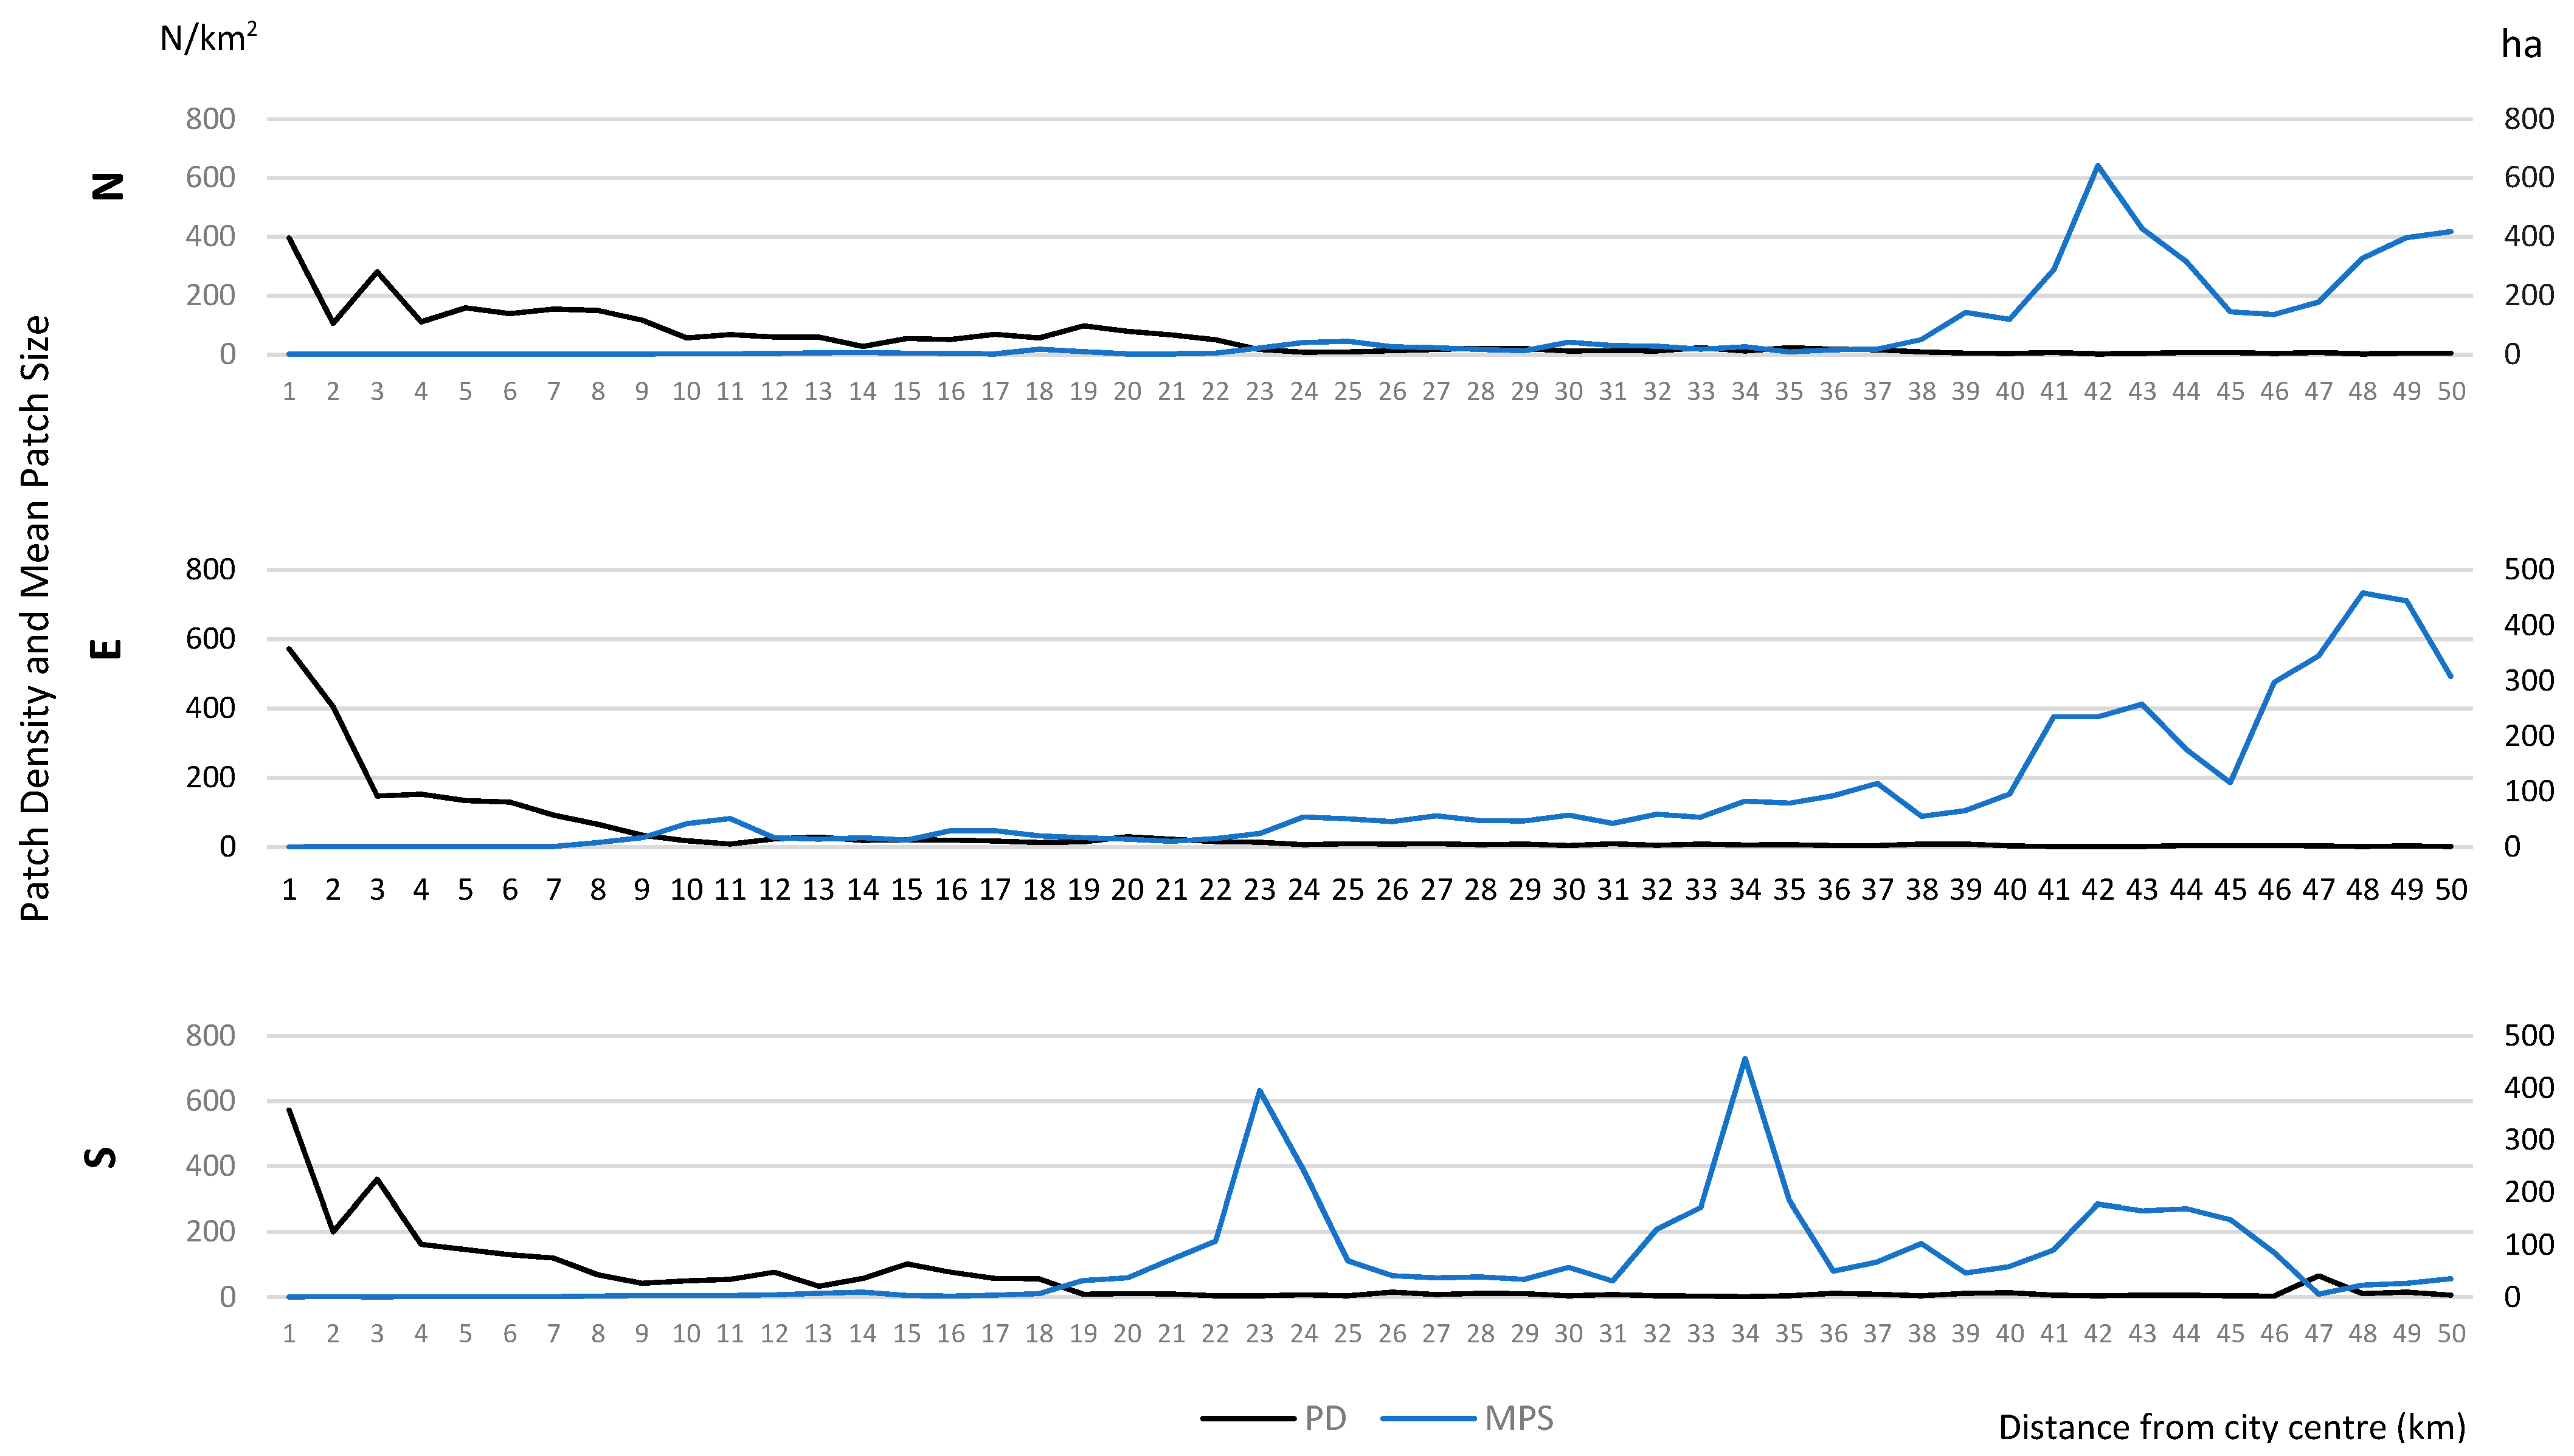
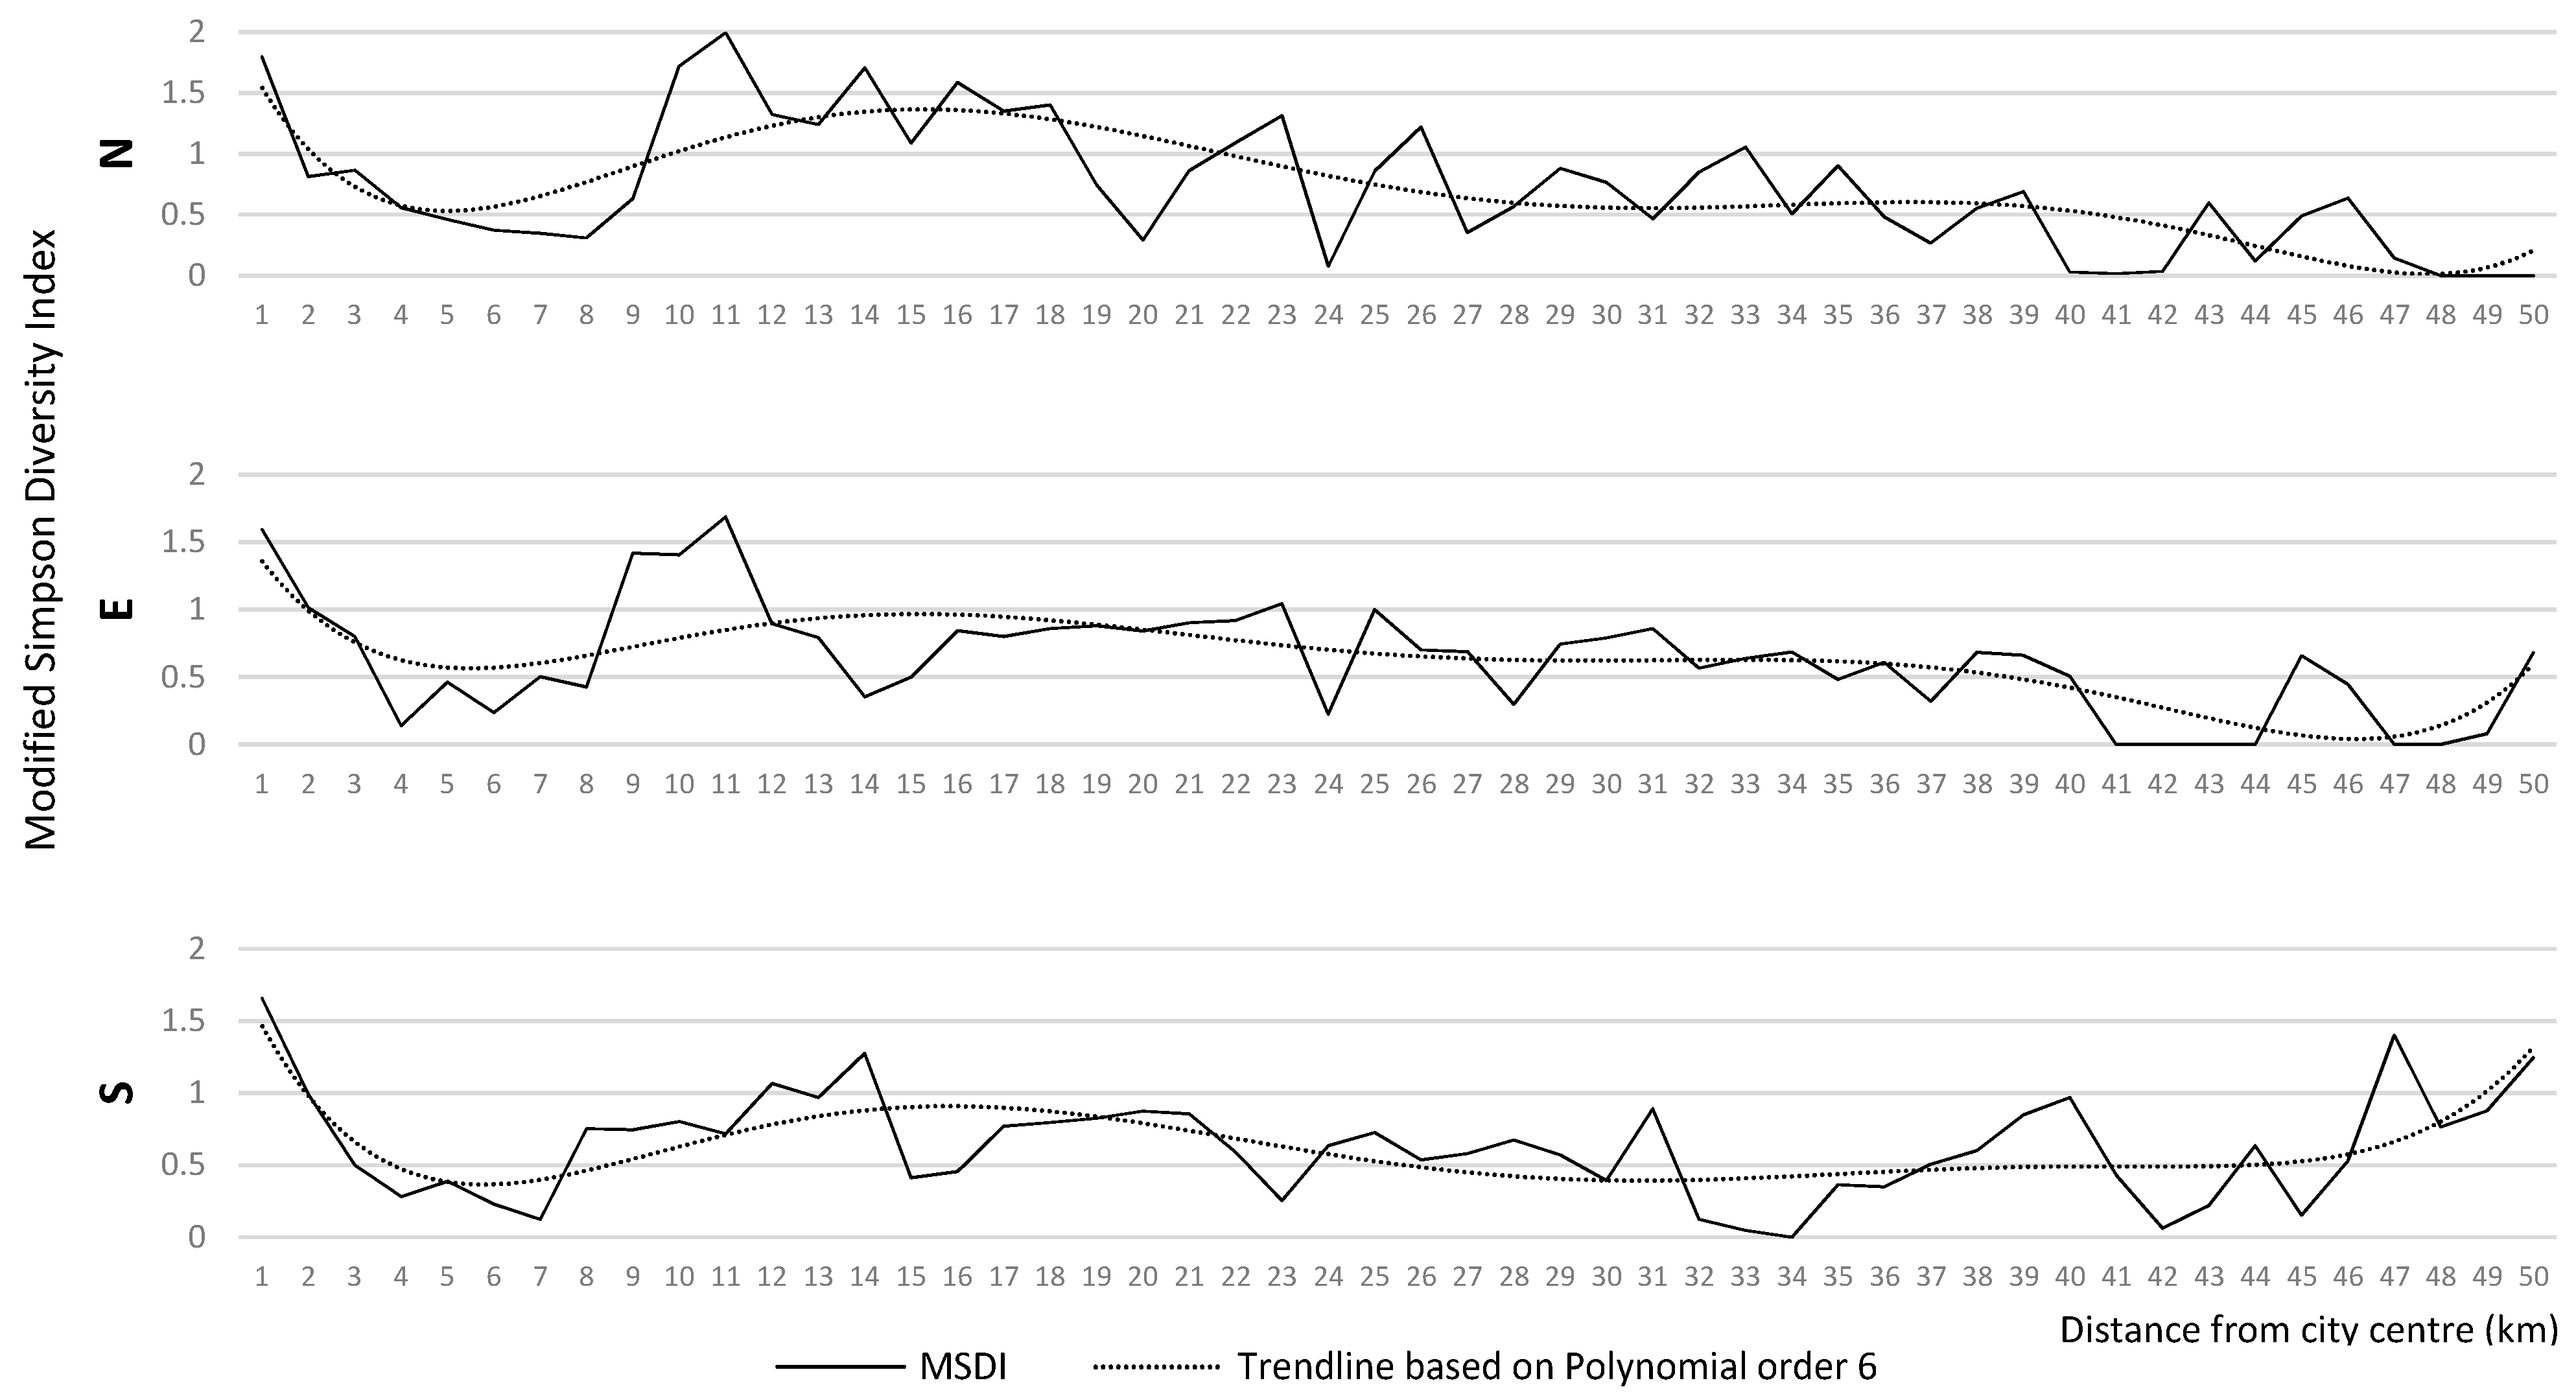
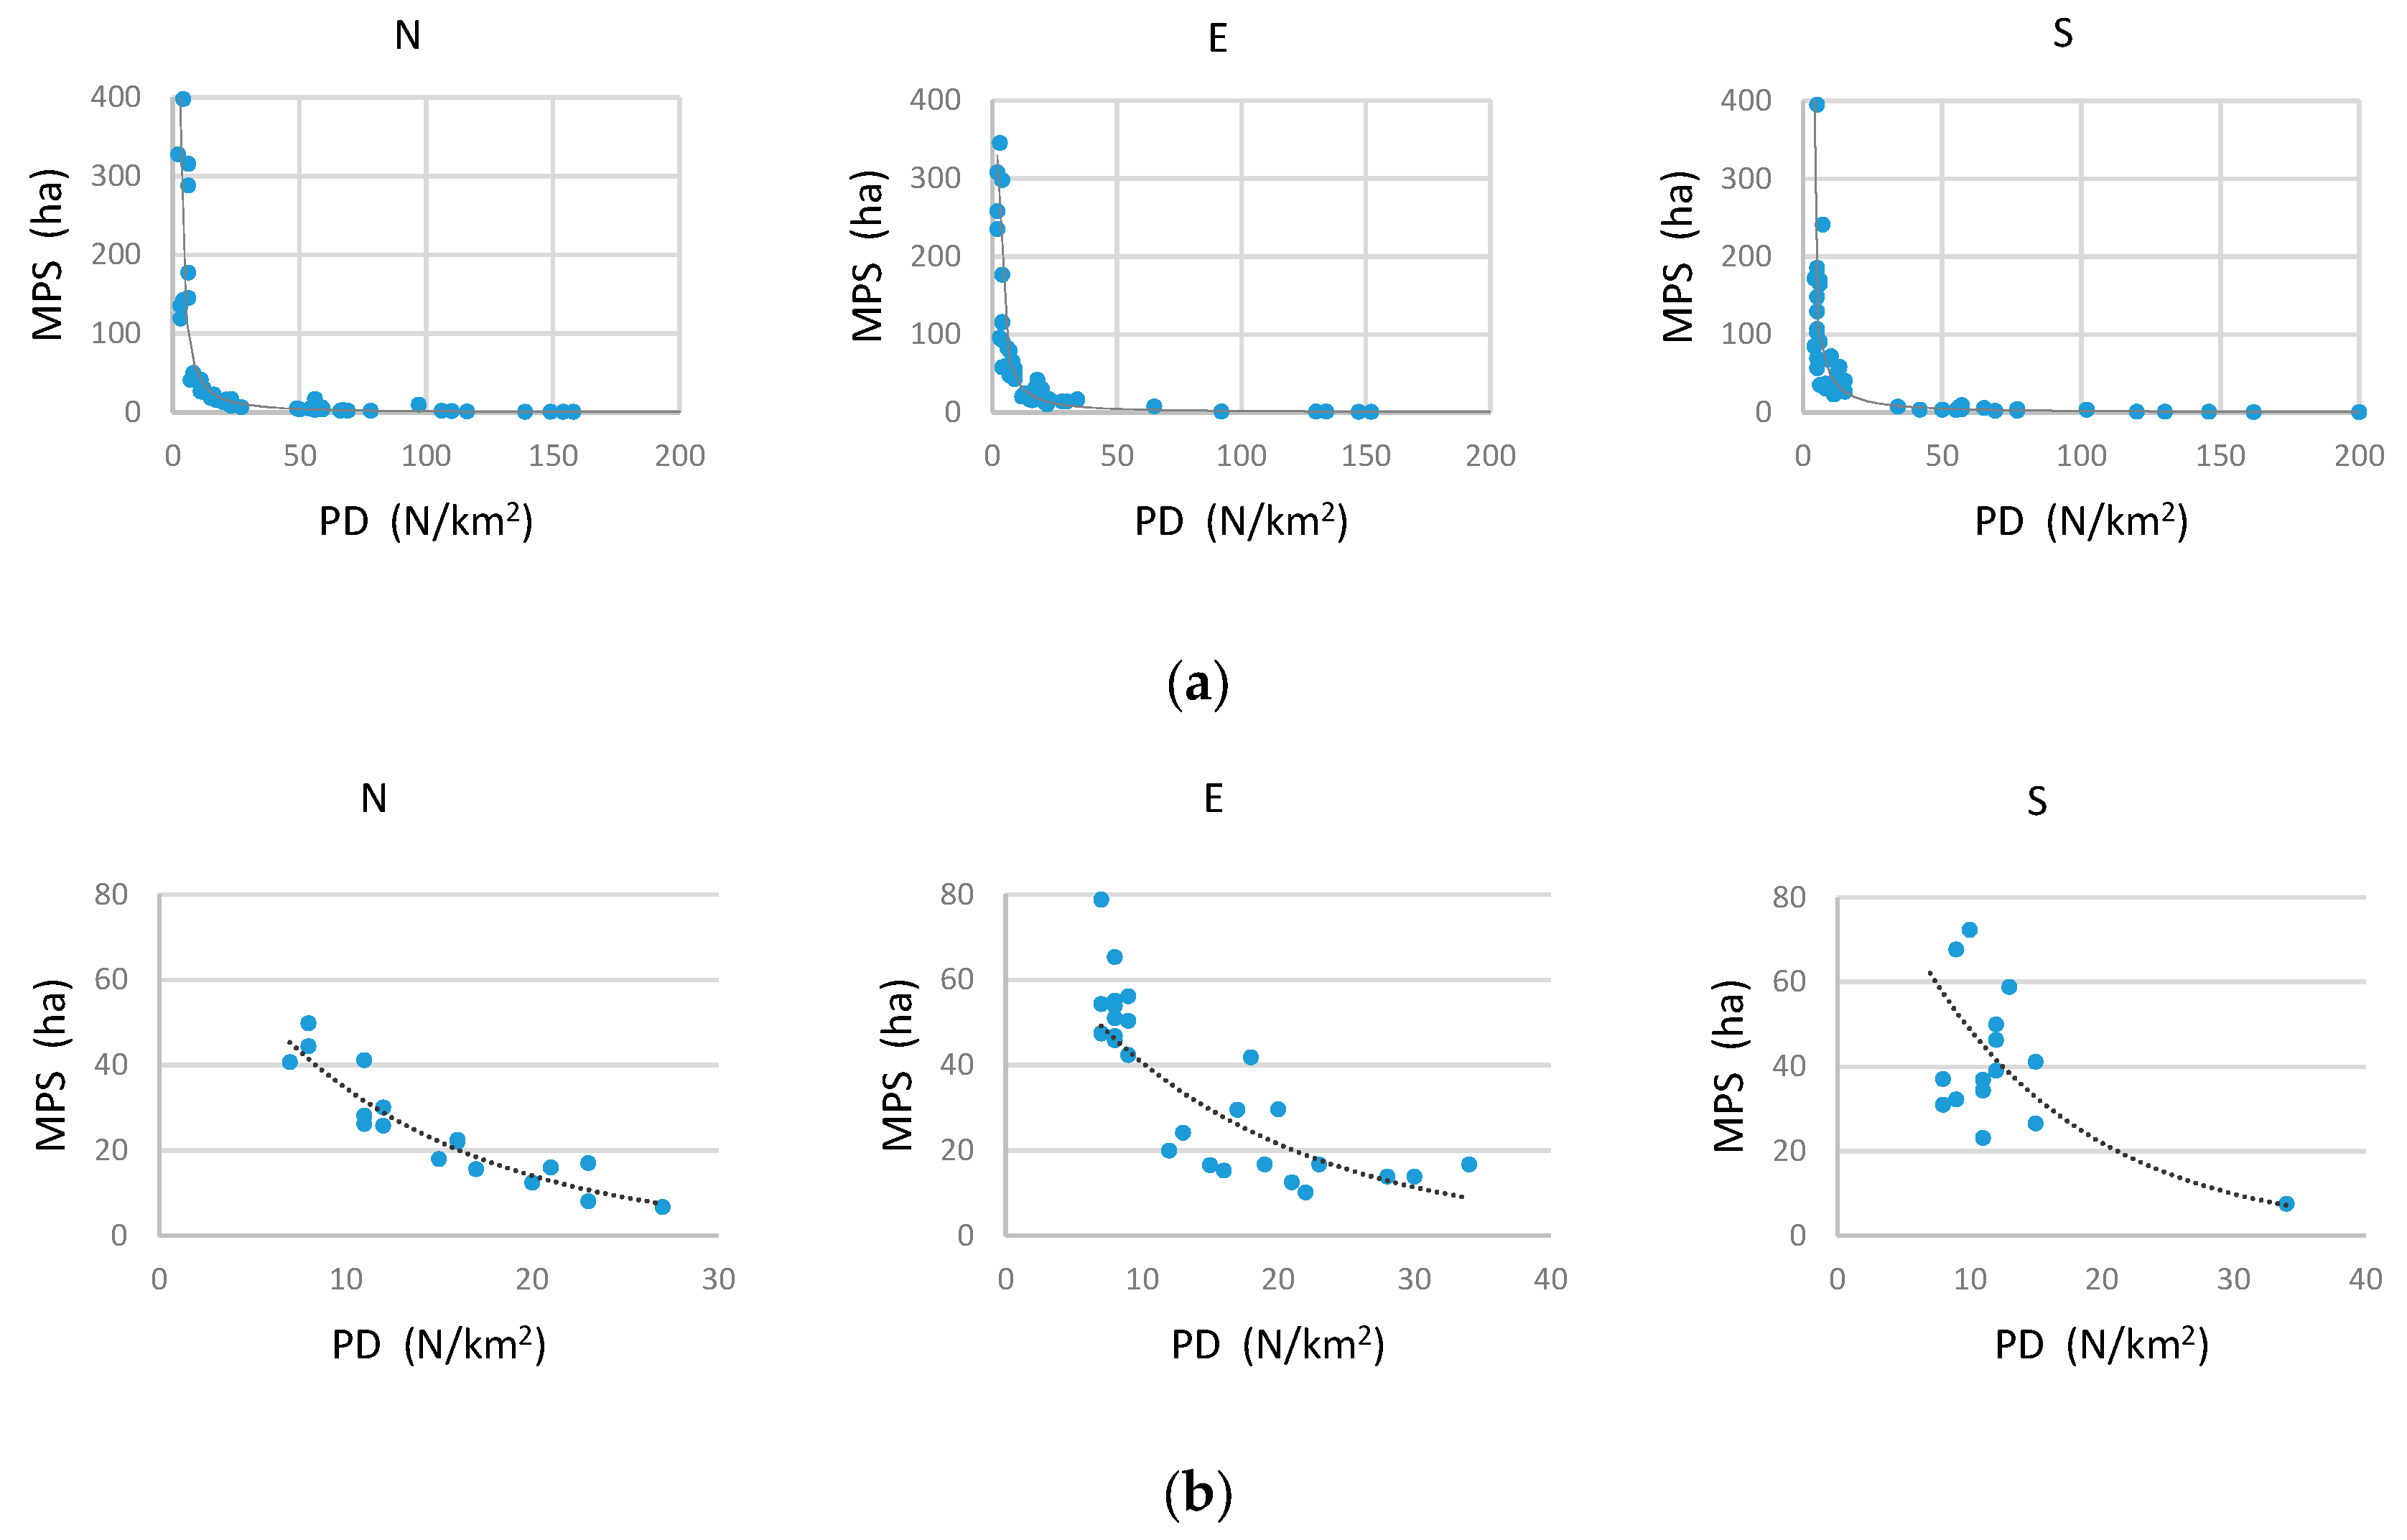
Landscape metric values were plotted along the three urban-to-rural gradients; north (N), east (E) and south (S); PLAND in Figure 2, MPS and PD in Figure 3, and MSDI in Figure 4. PLAND values for the eight land-use types (Figure 2) illustrate the variations in land-use composition along the transects, thereby demonstrating the urban, peri-urban and rural characteristics of these transects. The PLAND values along these three transects show high percentages of urban land uses near the city centre, a gradual change to higher percentages of agricultural land uses at the end of the transects, and a heterogeneous mix of land-use types in the peri-urban areas. MPS and PD have a negative relationship (Figure 3), with greater MPS values being associated with lower PD values. Figure 5a illustrates the association between MPS and PD of the land parcels for each transect. Figure 5b shows the relationship between PD and MPS in the ranges 0–40 N/km2 and 0–80 ha, respectively, for each transect. MSDI is somewhat similar between transects (Figure 4), and shows that diversity generally declines with distance from the CBD. However, it is noteworthy that the southern transect has relatively lower landscape diversity than the other two.
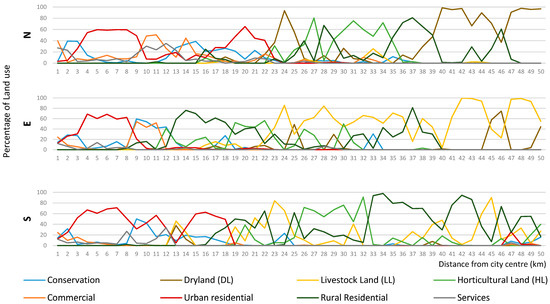
Figure 2.
PLAND: north (N), east (E) and south (S) transects.
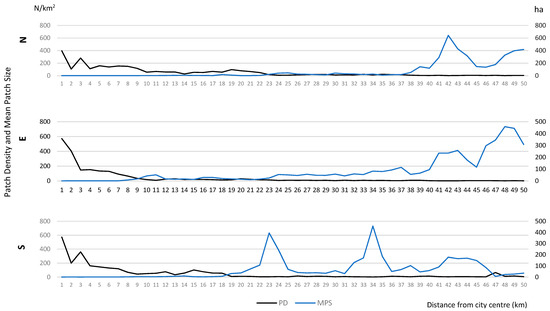
Figure 3.
Patch Density (PD) and Mean Patch Size (MPS): north (N), east (E) and south (S) transects.
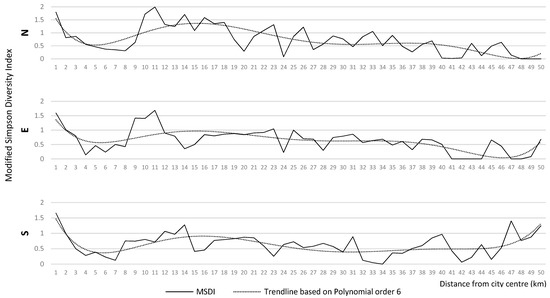
Figure 4.
Modified Simpson Diversity Index: north (N), east (E) and south (S) transects.
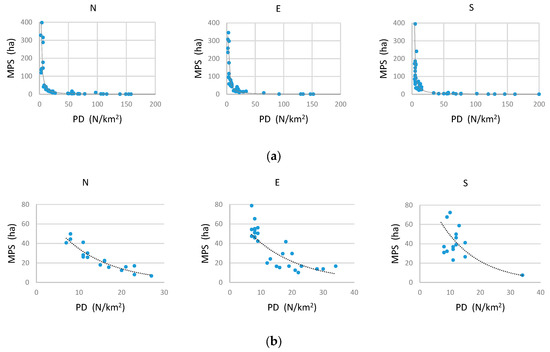
Figure 5.
(a) MPS-PD plots: north (N), east (E) and south (S) transects. (b) Enlargements of MPS_PD plots in the 7 < PD < 35 range.
3.1. Agricultural Land-Use Presence
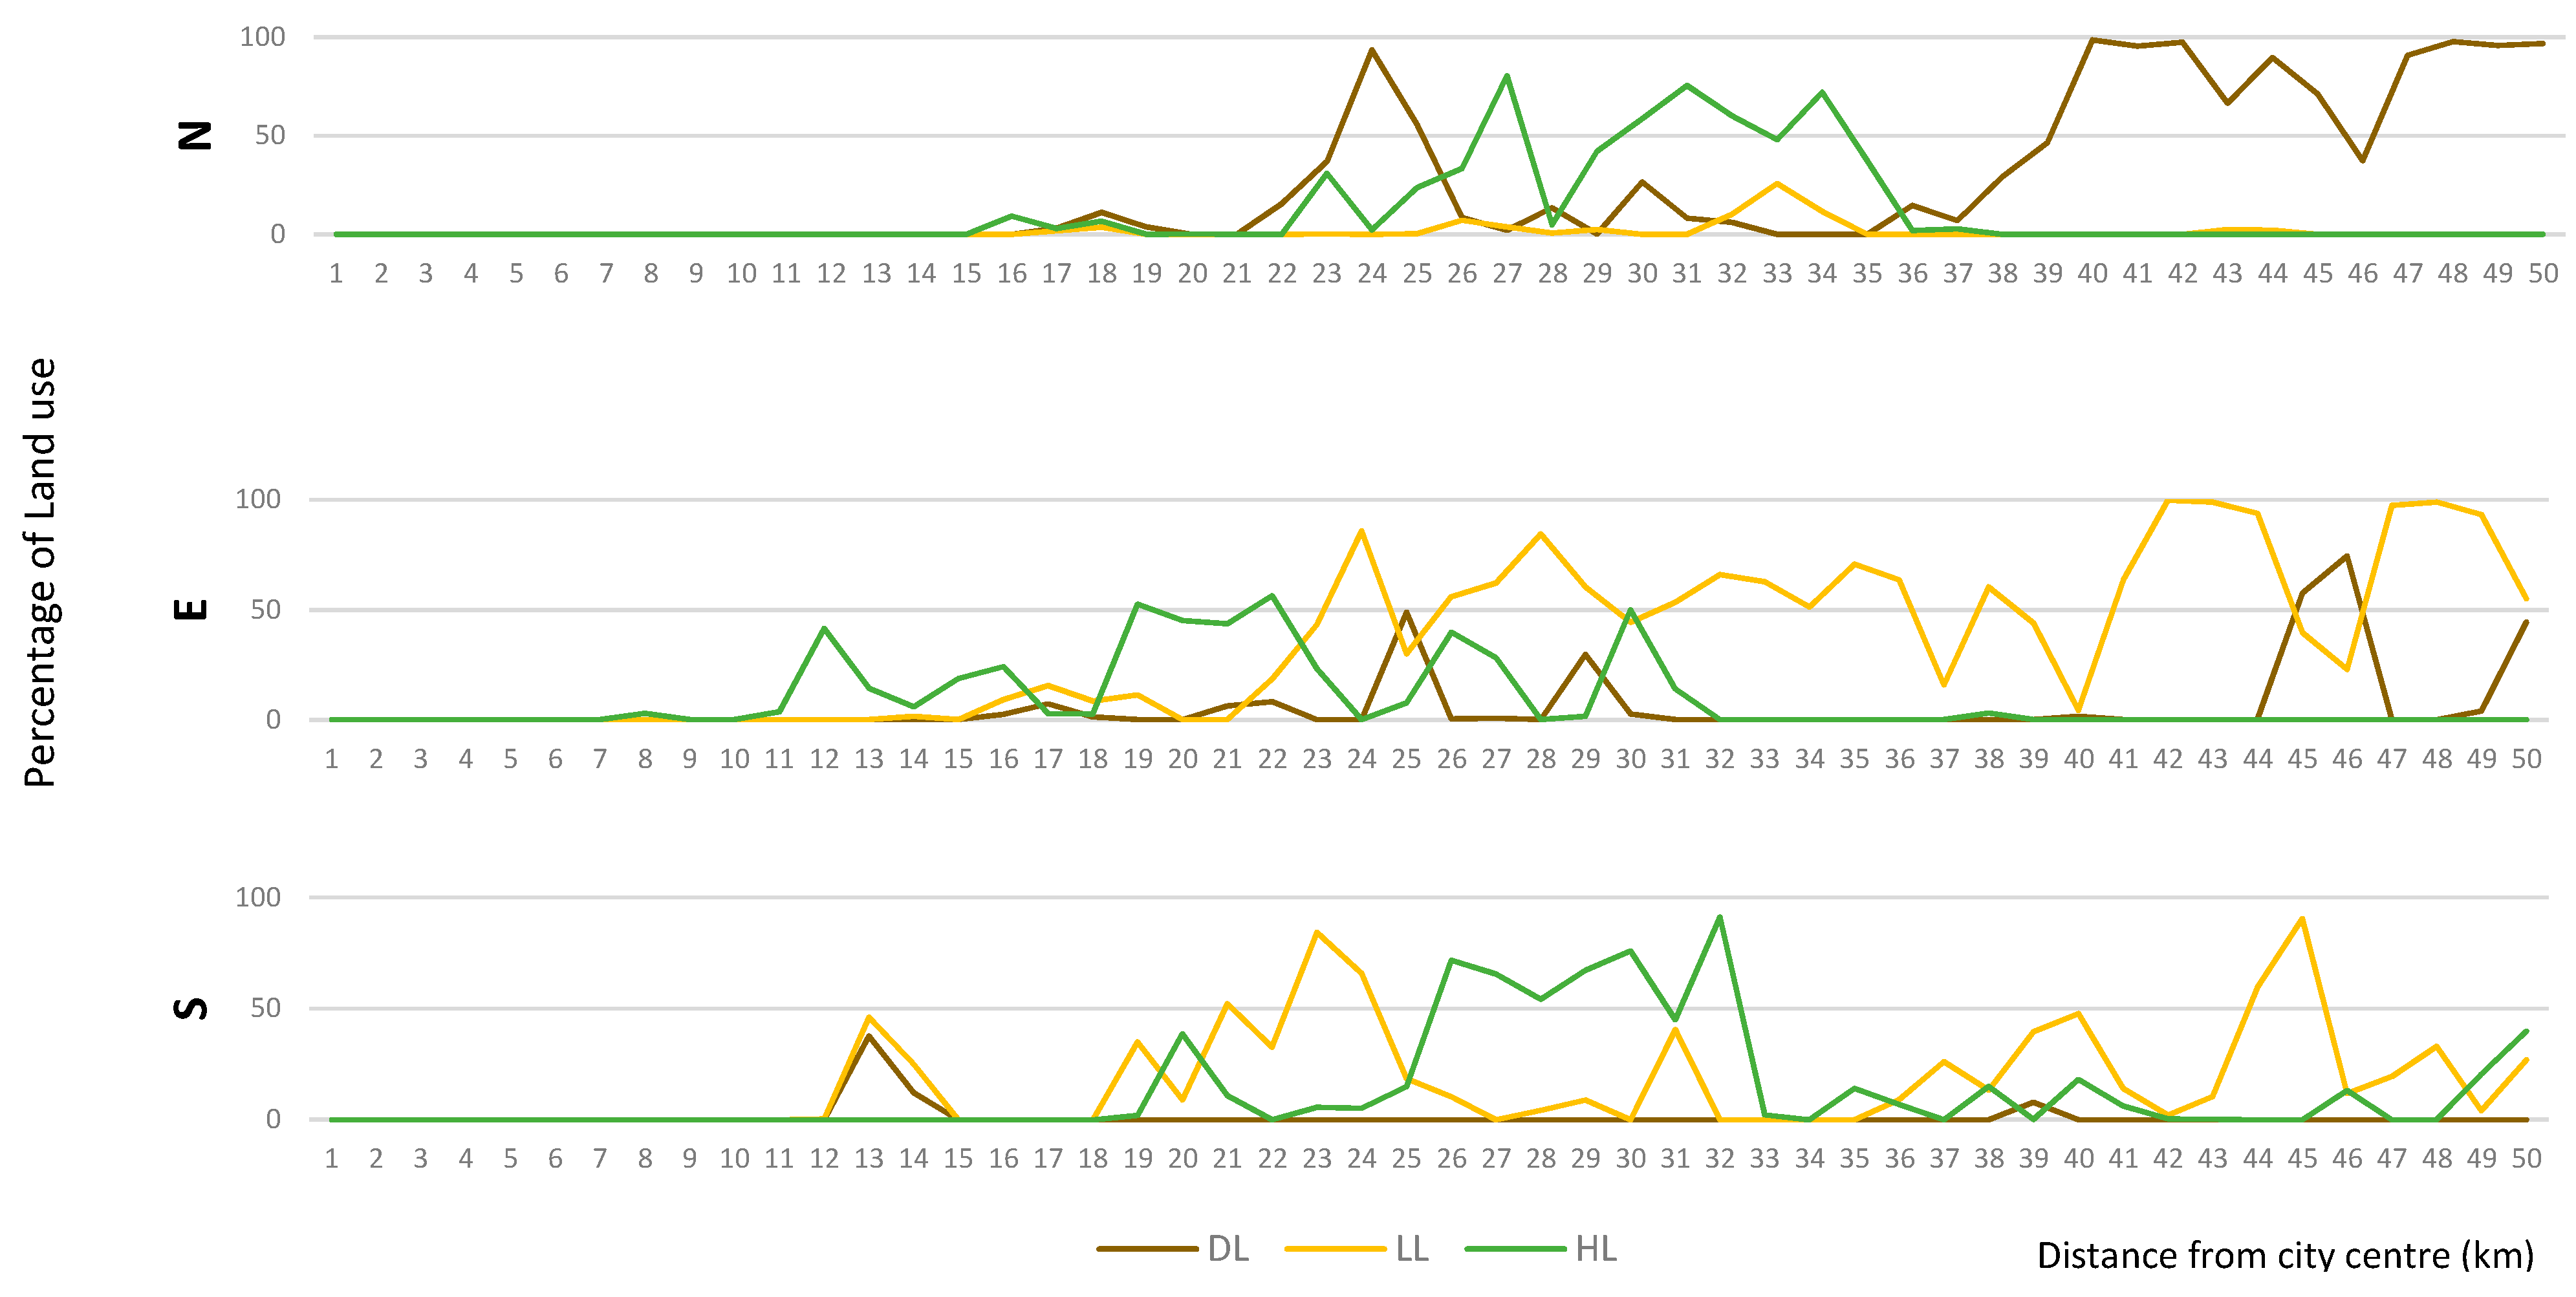
The PLAND values for Dryland agriculture (DL), Livestock land (LL) and Horticulture (HL) along the three transects are shown in Figure 6. The northern transect shows three distinctly different zones of land use. The built-up area, between 0–15 km, has low agricultural PLAND for the three agricultural land uses, and high PD and low MPS. Between 15 and 37 km the agricultural land-use percentages are HL (61.4%), DL (31.6%), and LL (6.8%). These represent mainly intensive vegetable production, rain-fed cereal cultivation, and sheep and horse grazing, respectively. This 22-km long zone presents a typical urban fringe landscape structure, with increasing MPS and decreasing PD. The landscape beyond the fringe (>37 km) is dominated by Dryland agriculture, and mainly comprises rain-fed wheat, barley and olive groves, which occupy large land parcels in a rural landscape. Land-use presence in the zones of high fragmentation is provided in Figure 7.
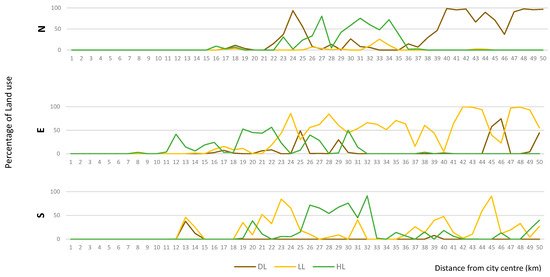
Figure 6.
Percentage of the total land area occupied by each agricultural land-use type: north (N), east (E) and south (S) transects.

Figure 7.
Areas prone to land fragmentation between PD 7 and 35 for each transect.
The first 10 km of the eastern transect represents the built-up areas of eastern Adelaide. The three agricultural land-uses of the Adelaide Hills—sheep and cattle rearing (LL, 52.7%); vegetable cultivation, fruit orchards and wineries (HL, 38.5%); and rain-fed crops (DL, 8.7%) characterize the transect from 11 to 32 km. The MPS of the land parcels in this hilly terrain are relatively small. Livestock land and Dryland cultivation dominate the transect beyond 33 km.
The southern transect is significantly different from the northern or eastern transects in terms of agricultural land use. Beyond the built-up area, which covers the first 18 km of the transect, LL and HL have much higher shares of the overall land use than DL. The landscape from 18 to 33 km has an agricultural land use split of HL (60.1%), LL (39.2%), and DL (0.7%). This combination characterizes the complex land use of McLaren Vale, which has transitioned from a mixed grazing and horticultural region, to one of vineyards and olive groves, with some grazing being retained at the margins. The amount of LL increases in the landscape beyond 33 km. However, in these final 17 km, PLAND values of Rural residential land and Urban residential land increase, leading to correspondingly higher MSDI values. The changes in these metrics demonstrate the influence of the town of Victor Harbor, which is located beyond the end of the transect. Table 3 summarizes agricultural land presence in the three transects:

Table 3.
Summary of the agricultural land along the three gradients.
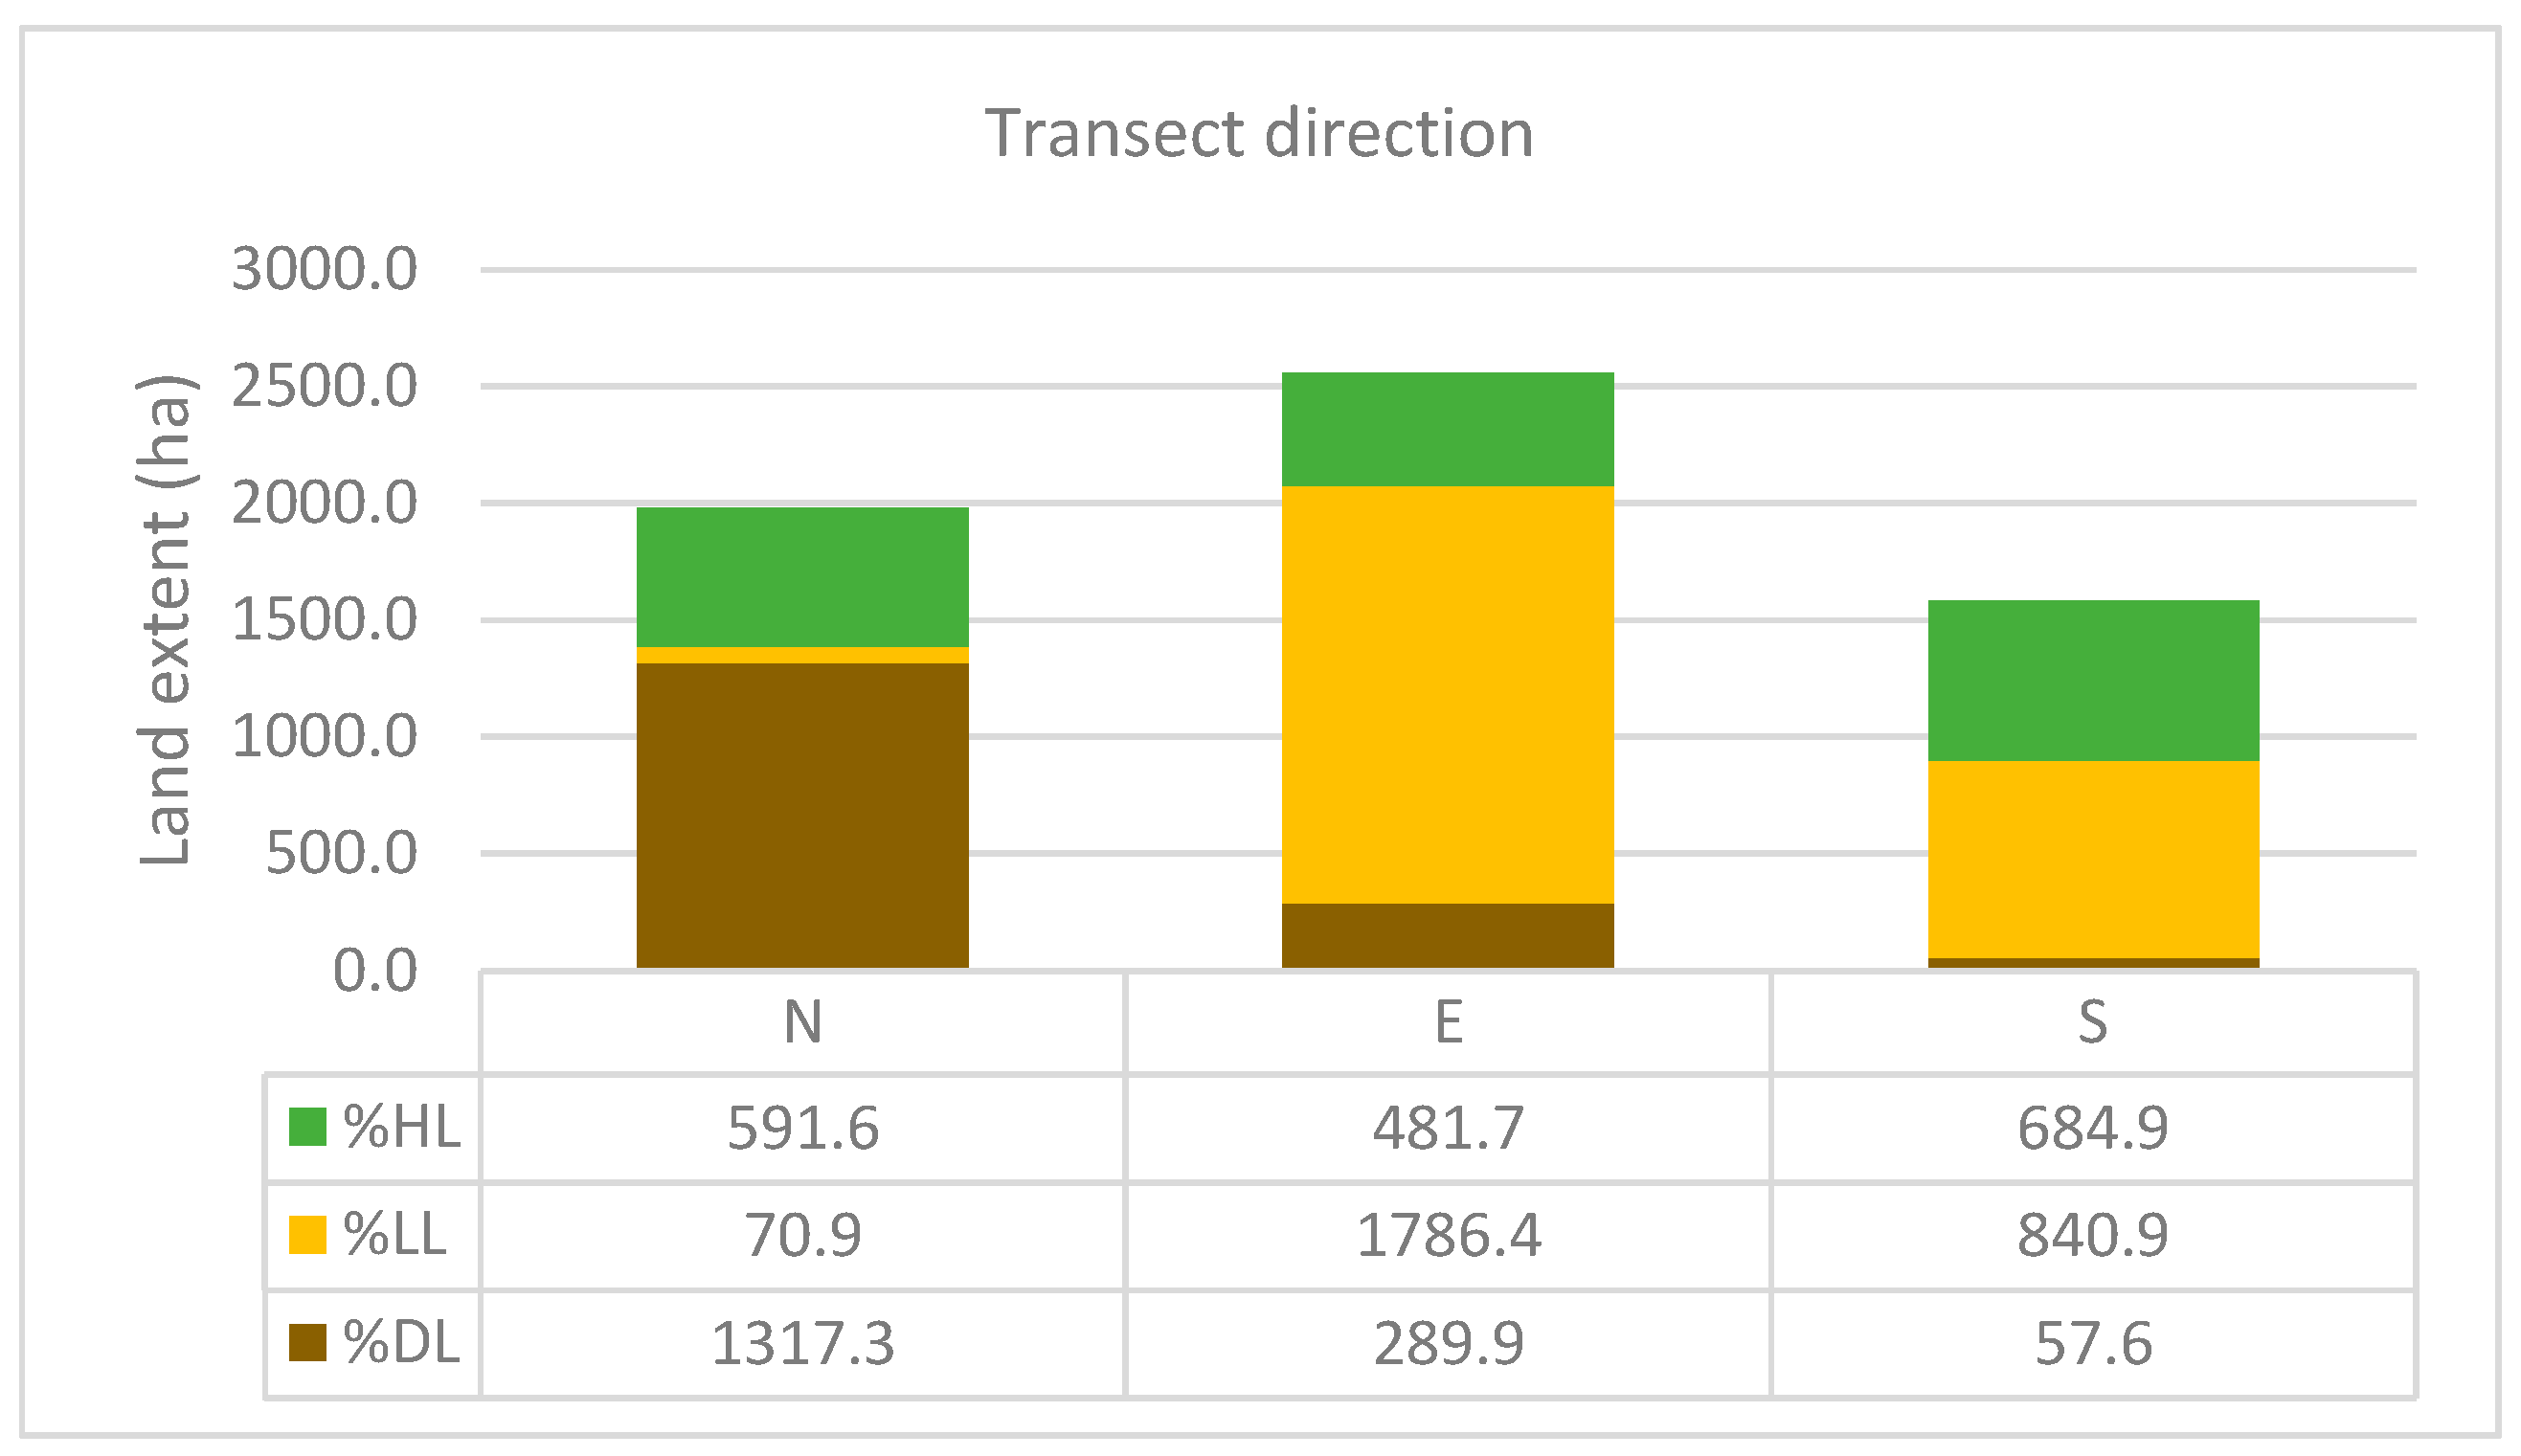
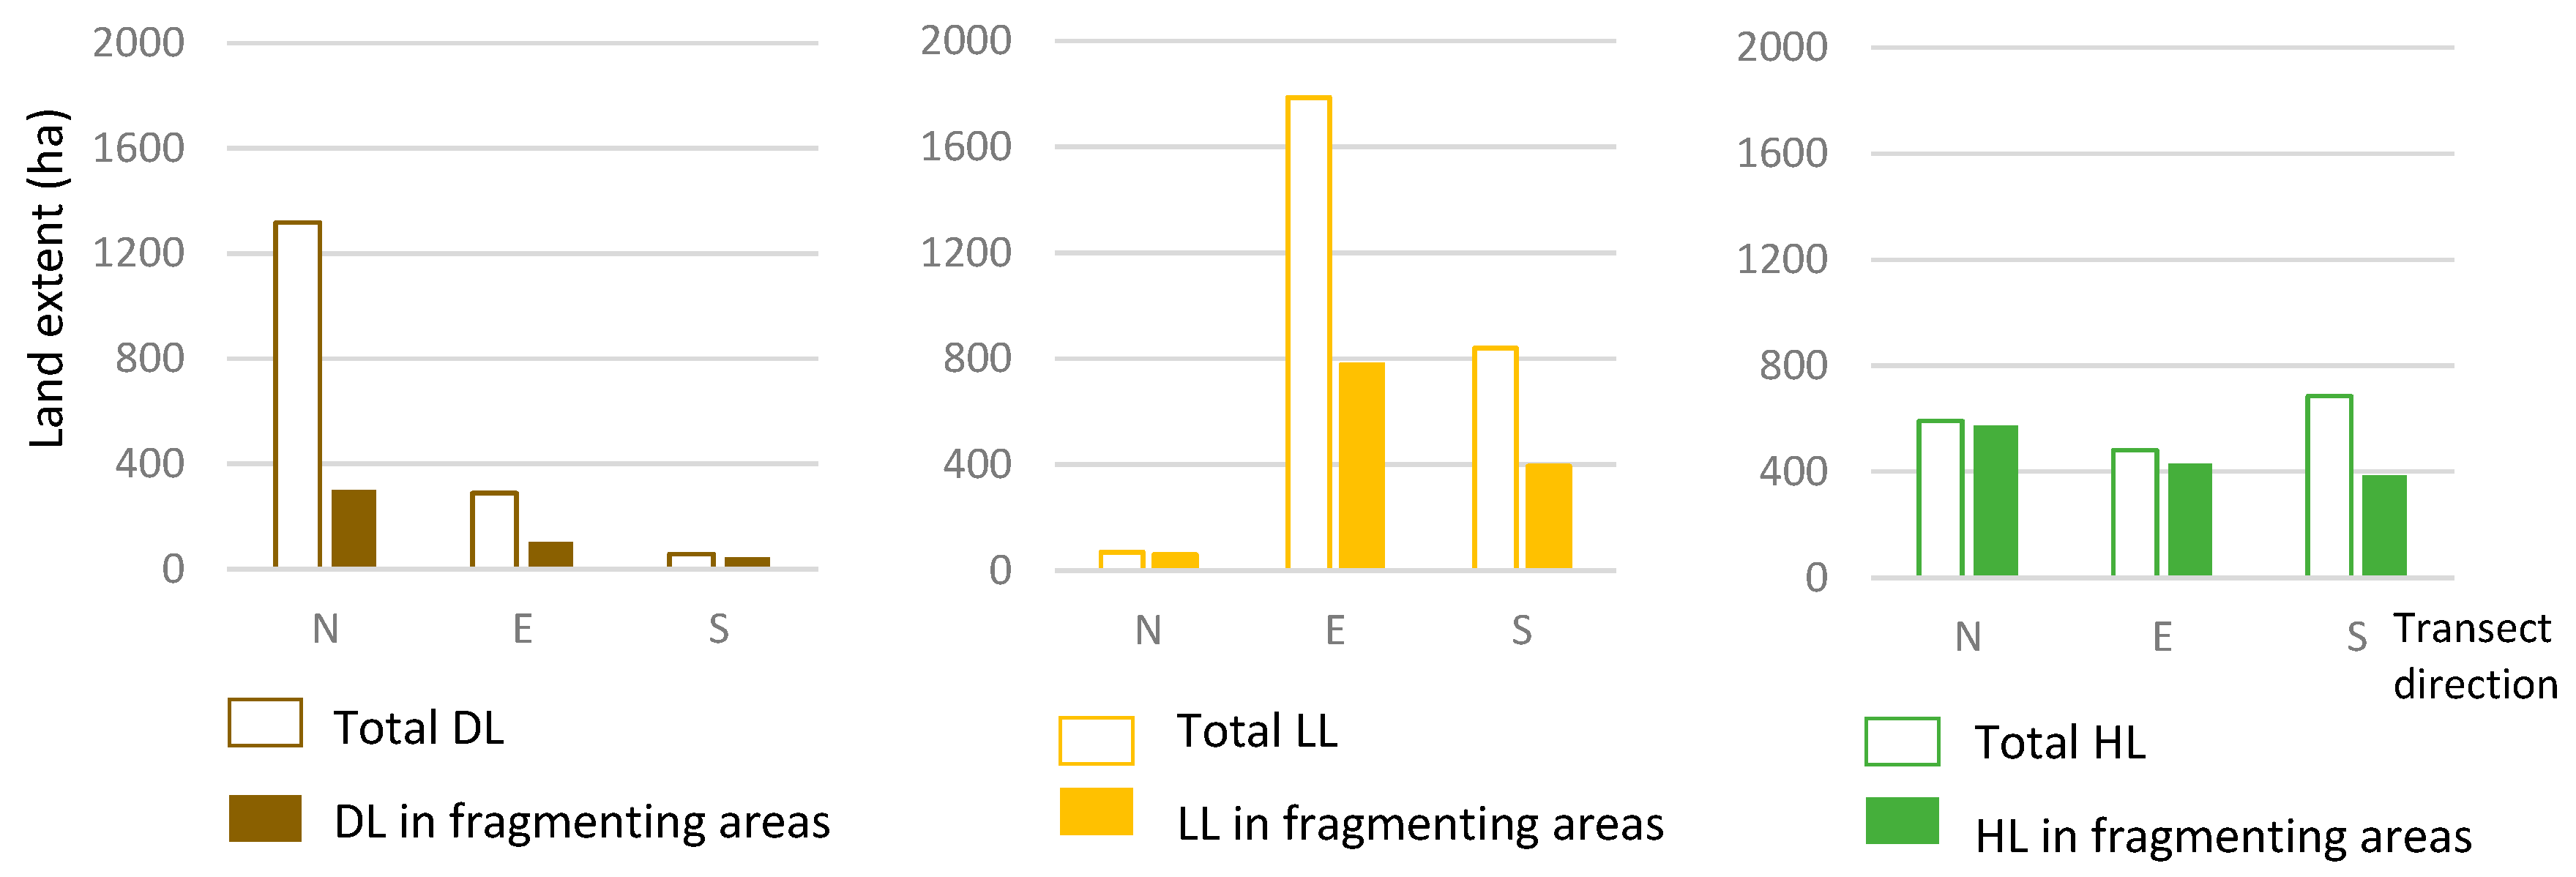
The total amount of agricultural land in each transect is summarized in Figure 8. The eastern transect has the highest amount of agricultural land (2558 ha, 51.2%), comprised of 11% DL, 70% LL and 19% HL. The southern transect has the lowest amount of agricultural land (1583 ha, 31.6%: 4% DL, 53% LL, 3% HL). The northern transect has 1979 ha (39.6%) under the three types of agricultural land-use, and is dominated by Dryland cultivation, accounting for 66% of all agricultural land.
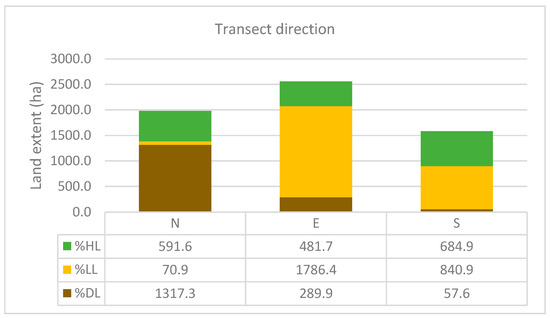
Figure 8.
Total agricultural land extent and the land use type percentages in the north (N), east (E) and south (S) transects.
3.2. Agricultural Land Fragmentation
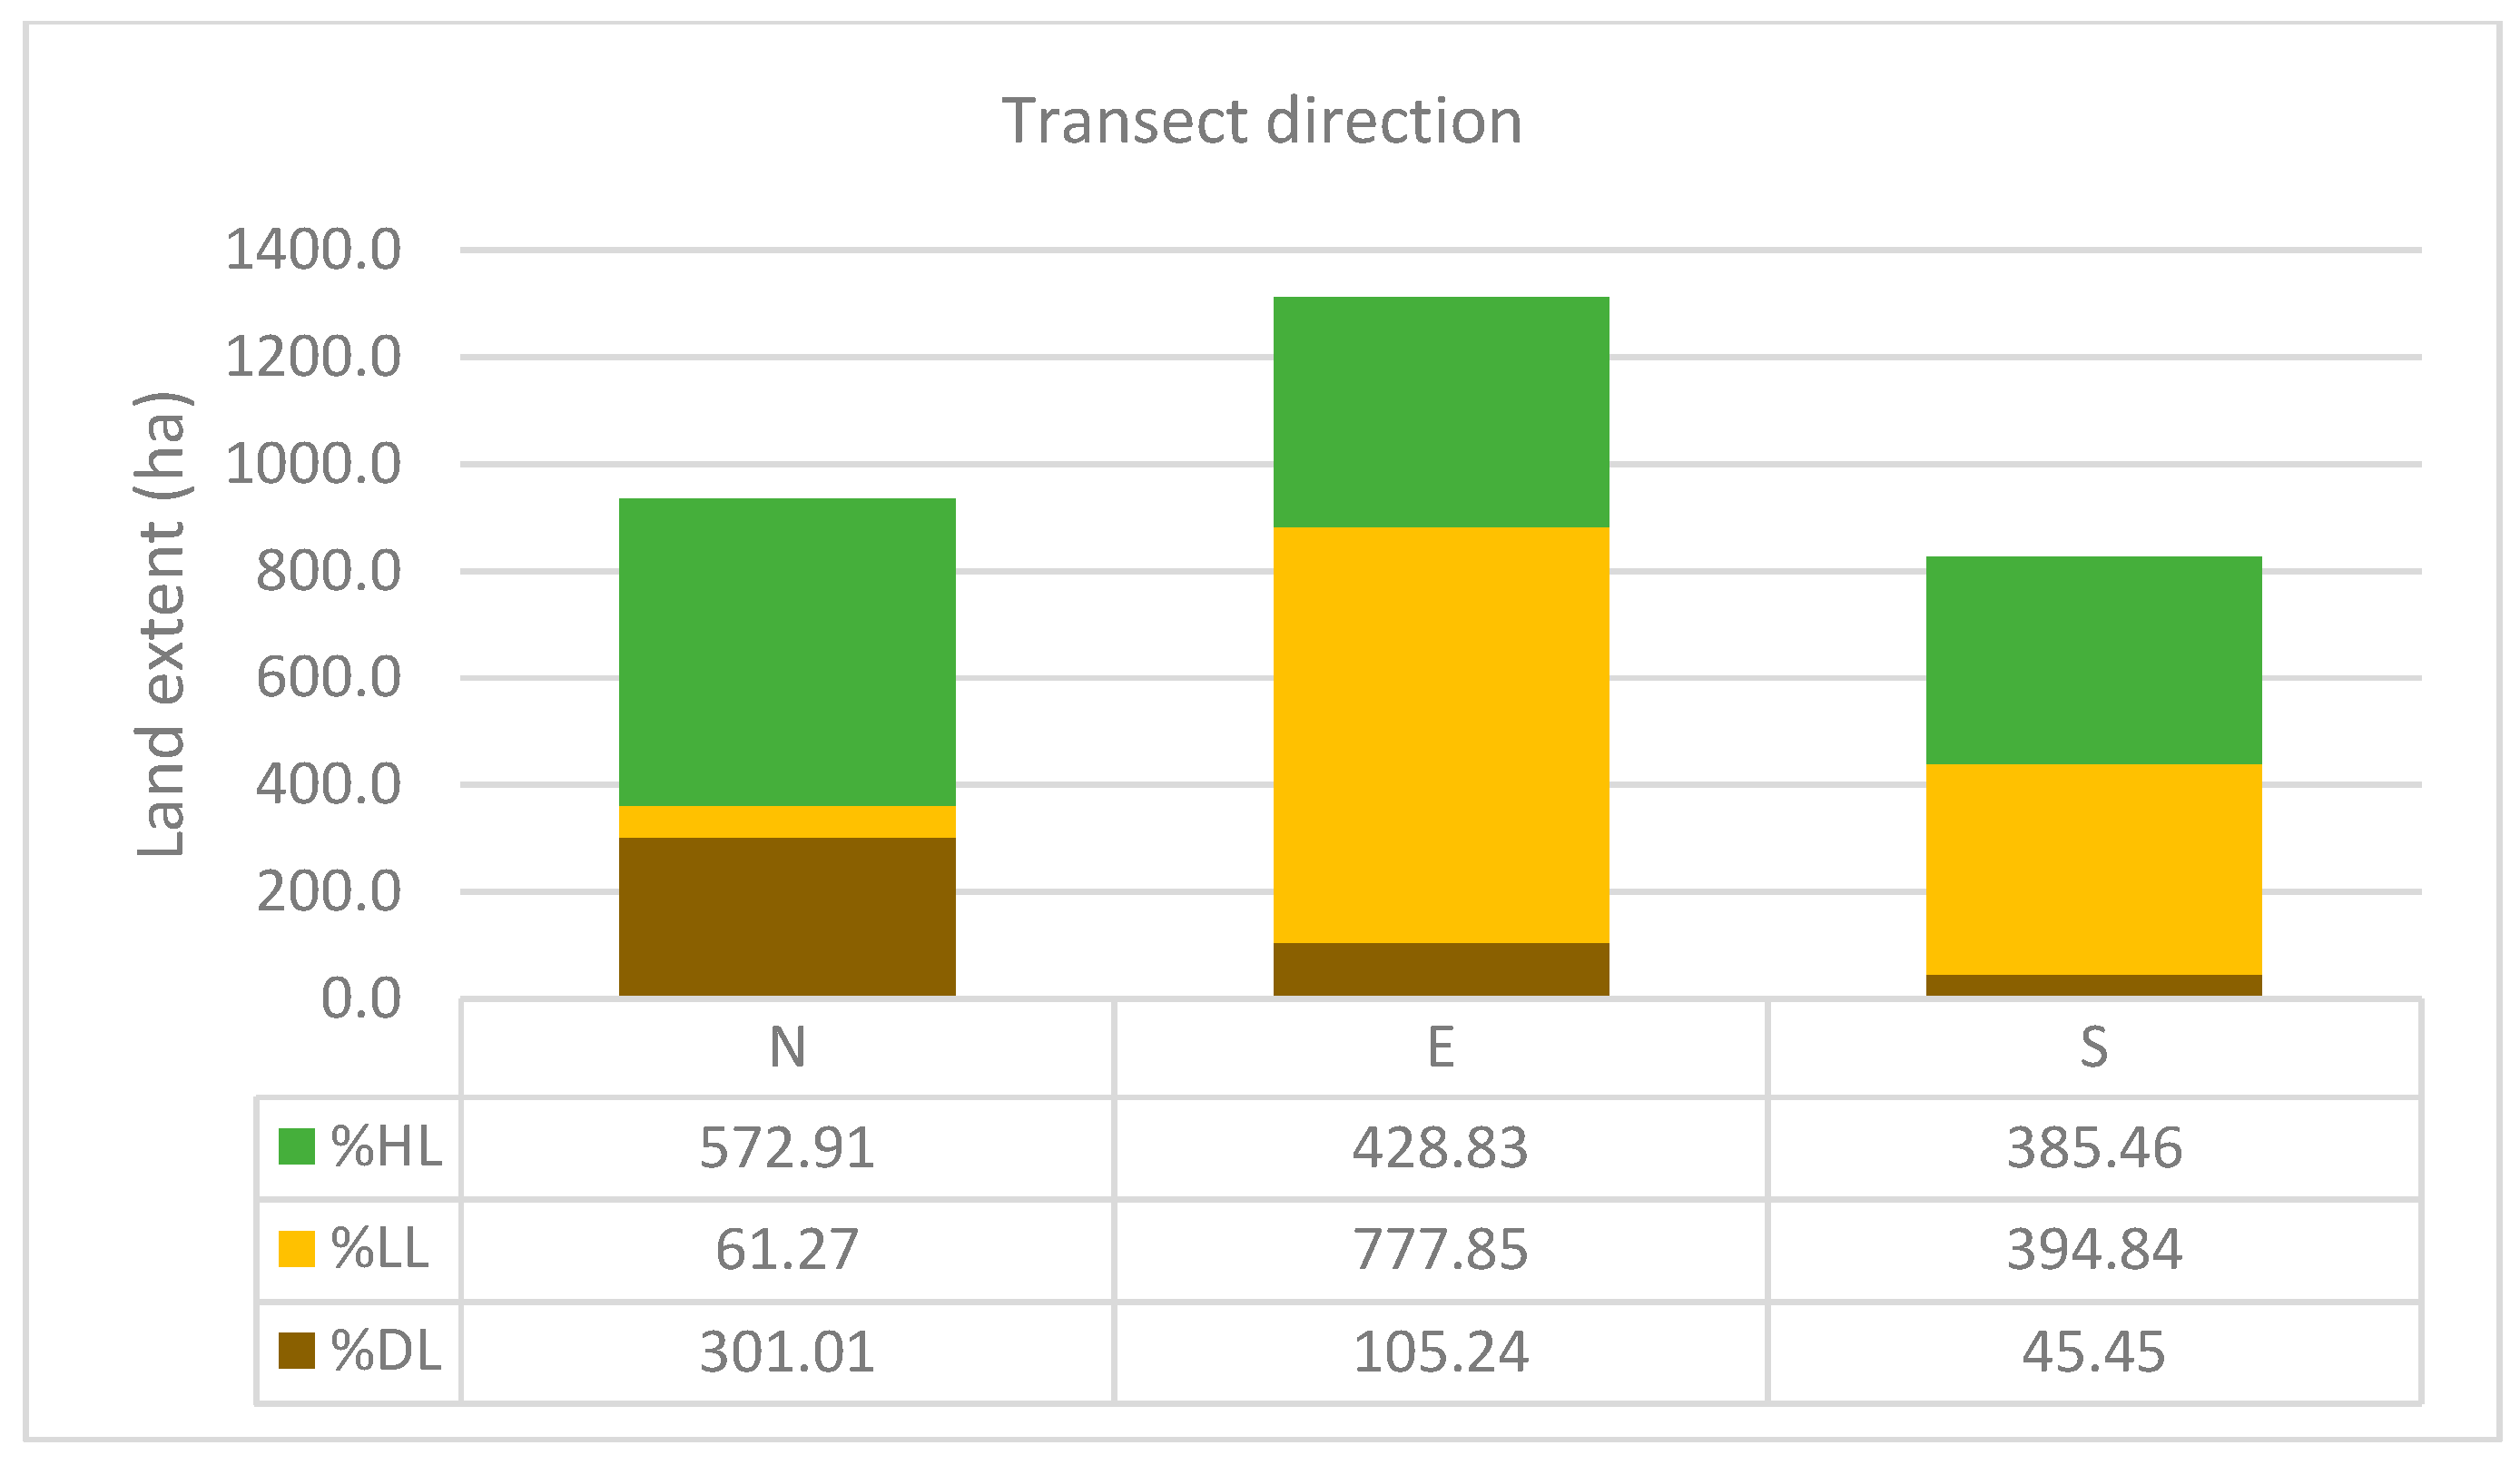
MPS and PD were used to characterize agricultural land fragmentation along each transect. In considering the zone where PD ranges from 7 to 35 N/km2, the critical zones for land fragmentation in the northern and eastern gradients extend for 15 km and 20 km, respectively (Figure 7). This zone is disjunctive in the southern transect, and extends from 19 km to the end of the transect. Figure 9 shows the amount of land occupied by the agricultural land uses in the zones of land fragmentation for each transect, while Figure 9 shows the corresponding percentage data. The total amounts of agricultural land of all types in the zones of high fragmentation are: 935.1 ha, 1311.9 ha and 825.7 ha for the northern, eastern and southern transects, respectively. Figure 10 displays the amount of each class of agricultural land in the zones of fragmentation. Horticultural land comprises a large component in each transect, and dominates the northern transect. Livestock grazing accounts for the highest proportions of agricultural land in the zones of high fragmentation in the eastern and southern transects, but is a minor element in the northern transect. Dryland agriculture has a low presence in the zones of fragmentation in all three transects. This is only encountered with any frequency in the northern transect, where there is significant contemporary urban fringe formation on land formerly used for rain-fed cereal cultivation on the Northern Adelaide Plains.
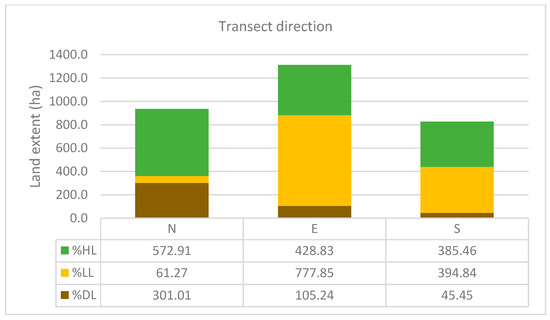
Figure 9.
The agricultural land extent and the land use type percentages in the zones of high land fragmentation.
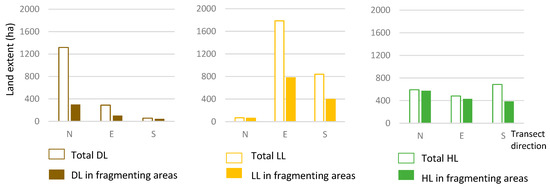
Figure 10.
The extent of DL, LL, HL in zones of high land fragmentation: north (N), east (E) and south (S) transects.
4. Discussion
Weng [42], in applying gradient analysis, found that landscape fragmentation is positively correlated with the degree of urbanization, and results in agricultural land loss at urban fringes. Therefore, as agricultural land is generally the major land-use category beyond the fringe, it is the major land reserve for meeting the land demands of urban development in sprawling cities such as Adelaide. Moreover, fragmentation is the key spatial manifestation of the process of incorporating agricultural land into transitional, urban fringe landscapes.
This research confirms the presence of agricultural land along all three gradients, and that fragmentation can be easily visualized and quantified using a combination of gradient analysis and landscape metrics. It is the first application of these techniques in the Australian context. More importantly, this research provides an advance on previous analyses of the incorporation of agricultural land into the urban fabric of cities, by comparing the conversion processes acting on three types of agricultural land (Dryland agriculture, Livestock grazing and Horticulture).
4.1. Land Structure Analysis along Gradients
This research presents a novel method for investigating agricultural land fragmentation at the urban fringe, by analyzing the associations between mean patch size and patch density. Notwithstanding the differences in the land-use geographies along the transects, scatter plots of MPS and PD for the three transects showed similar patterns of cell organization with respect to patch density and mean patch size. Cells associated with the horizontal parts of the trend lines (Figure 5) indicate low levels of association between MPS and PD; e.g., a decline in MPS from 400 ha to approximately 100 ha leads to very little increase in PD, which remains at <7 N/km2. When PD reaches approximately 35 N/km2, further increases are not accompanied by significant changes in MPS, i.e., the vertical parts of the trend lines in Figure 5. This means that the zone bounded by PD values of 7 to 35 N/km2 is a critical zone of land fragmentation in which the relationship between MPS and PD is very sensitive. For example, a decrease of one hectare in MPS leads to an increase in PD of 0.52 N/km2 (in the northern transect), 0.54 N/km2 (eastern transect), and 0.33 N/km2 (southern transect) in this study.
The cell values that correspond to the zone of high fragmentation are well distributed in the northern and eastern transects (Figure 5b). This indicates that large land parcels are being fragmented in a regular and incremental manner to create progressively smaller parcels, and that the resulting increases in PD are responses to rapid urban development to the north and east of Adelaide. More clustered cell values in the southern transect indicate a differently organized landscape structure. The corresponding cell values in the southern transect cluster between a MPS of 22–70 and PD of 7–5. It is believed that this pattern derives from an urban fringe that is characterized by larger land parcels that can be attributed to the size of vineyards and planning restrictions on the post-sale use of vineyards due to the implementation of the Character Preservation (McLaren Vale) Act 2012 [59]. That is, fragmentation is not occurring at the same rate or in the same way as it is on the eastern and northern fringes of the city.
Overall, the results demonstrate that it is the contemporary land-use transformation processes that explain the landscapes metrics measured. This validates the use of landscape metrics derived for cells along transects to characterize landscape structures. For example, the urban fringe to the south has a lower MPS for agricultural land than in the north and east; and that the difference is due to the high frequency of vineyards in the south compared to the dominance of dryland cereal fields in the north, and extensive grazing areas and fruit orchards in the east. Furthermore, this method can be used to understand the influences of regional towns on land-use transitions—a point that is rarely considered in peri-urban studies [48]. For example, in the southern transect, the influence of the town of Victor Harbor on land fragmentation and land-use changes near the end of the transect is clear in comparison to the other two transects.
If landscape metrics are to be used effectively in assessing land fragmentation at urban fringes, it is imperative that they are calculated for all cells and plotted along the entire transect, rather than simply focusing on the peri-urban areas. This allows emerging and existing areas of fragmentation to be identified objectively through the behavior of metrics.
4.2. Agricultural Land in the Areas of Fragmentation
The agricultural land types in the zones of high land fragmentation are, in order of decreasing area, Horticulture, Livestock grazing and Dryland cultivation. This differs from the total distribution of agricultural land along the three transects, which in order of decreasing area, are Livestock grazing, Horticulture and Dryland cultivation. This change in order highlights the importance of quantifying the agricultural land in high fragmentation zones, rather than analyzing agricultural land along an entire transect—particularly if the results are being used to make strategic land-use decisions regarding urban fringes.
It can be argued that quantifying agricultural land in fragmenting areas, instead of the total land presence, will improve planners’ understanding of the vulnerability of agricultural land in these transitional landscapes. For example, land under Dryland cultivation has the highest land-use presence in the northern transect, but only 20% of that land-use class in the transect is prone to fragmentation. The fact that agricultural land fragmentation occurring at the fringes of Adelaide can be identified and characterized using gradient analysis and landscape metrics (regardless of the different characteristics of the northern, eastern and southern transects) is testament to the robustness of the method. Moreover, different spatial configurations of land parcel arrangements can be identified. Figure 10 provides data on the proportions of different land-use classes in the three transects. These data reveal the importance of quantifying the individual land-use class measurements to identify the detailed land structure elements in these complex landscapes. Vizzari and Sigura [48] argue that whole gradient analysis is required in rural-to-urban analyses. Urban expansion in Australian cities occurs in less complex landscapes than those in world regions chararcterised by high levels of urbanization or rapid urbanization and unprecedented levels of development in tangled webs of complex rural-urban transitions [10], e.g., Japan, eastern China, south-east Asia, western Europe, and parts of North America. Nevertheless, the usefulness of whole gradient analysis is again emphasised in this research.
Land-use responses to urbanization stimuli are dependent on geographical location, and land ownership and land-use policies as integral parts of complex land systems [60]. Though this research illustrates a higher probability of land fragmentation in some types of horticultural land, other areas are much less affected, e.g., protected heritage wine making regions with large capital investments. This indicates that other attributes of land-use classes are important in determining the extent of fragmentation. In the northern transect, many intensively-cultivated vegetable farms are proximate to built-up areas, have relatively small investments currently, are operated by ageing land owners who are contemplating selling their farms, and are located in areas where local councils are actively re-zoning land. Therefore, it is land attributes that lead to fragmentation, rather than simply the spatial characteristics. This demonstrates the importance of integrating local knowledge and current urban development policies into future urban-to-rural gradient analyses to improve outcomes.
The method outlined in this paper can be applied to different geographies, where a land dataset (or land-use maps derived from remotely sensed data) with land-use attributes exists to provide justifiable evidence for probable agricultural land transitions. An analytical approach such as this, which uses a single dataset, could overcome issues that exist with analyses based on multiple data sets [61], e.g., data incompatibility, error generation and variations in data definitions associated with previous landscape studies. Though some limitations would still exist, such as human error in data collection and spatial analysis.
Integration of the gradient method with the analysis of landscape metrics leads to two main advances. First, it improves the interpretability of transitional processes on agricultural land at city fringes by focusing measurements on particular areas (e.g., agricultural land within zones of fragmentation), while still analyzing the landscape structure in an urban-to-rural continuum. Secondly, it enhances information richness for improved peri-urban land-use planning strategies within planning and policy-making groups at different levels of land governance (e.g., local government to state level), as well as for other stakeholder groups who share common interests in effective management of peri-urban land. These include primary industries, biological conservation, natural resource management and recreational opportunities.
5. Conclusions
This research integrated landscape metrics into urban-to-rural gradient analysis to deepen our understanding of the geographies of agricultural land-use change at the urban fringes of Adelaide. The study reveals that less well-regulated horticultural land uses are the most vulnerable to urban expansion, though well-protected horticultural land experiences much lower levels of conversion and fragmentation. Land uses related to livestock grazing and rearing have a larger presence than horticulture, but are less likely to change. Dryland agriculture is the least vulnerable for urban sprawl.
The research findings confirm that integrating landscape metrics and urban-to-rural gradient analysis provides a robust method that works equally well under different natural environments, rates of urban growth, and types of land use. A new finding is that MPS and PD can be used to identify zones with high rates agricultural land fragmentation. These occur where PD ranges from 7 to 35 N/km2, regardless of distance from the city centre, land use, topography, soils and rates of urban growth and suggest a geometry of fragmentation that may be consistent.
Integrating landscape metrics into gradient analysis has the potential to provide a wide range of stakeholders, ranging from planners to conservation and primary production groups, with a rich source of information on agricultural land-use configurations, and their interdependencies. Further it can provide them with the ability to systematically compare spatially quantifiable land-use metrics along urban-to-rural gradients. Nonetheless, we suggest there are further opportunities to test the robustness of this method in urban fringe landscapes in different types of cities around the world.
Acknowledgments
This research was funded by the doctoral study grant—Australian Postgraduate Award (APA)—from the Commonwealth Government of Australia to Suranga Wadduwage. We acknowledge the Department of Planning, Transport and Infrastructure (DPTI) in South Australia for providing raw data for this study and the constructive comments made by the international land use researchers at the Global Land Project meetings in Taiwan and at the ‘Land Lab’ meetings at Flinders University. We appreciate the constructive comments of the three anonymous reviewers, and the grammatical insights of Cécile Cutler.
Author Contributions
Suranga Wadduwage designed the study, analyzed the data and drafted the initial manuscript. Andrew Millington made critical suggestions on the methods, results and the discussion, and redrafted some sections of the manuscript. Neville Crossman and Harpinder Sandhu contributed to drafting the manuscript in different stages to ensure compliance to contemporary land use research themes. All four authors contributed to writing the paper.
Conflicts of Interest
The authors declare no conflict of interest. The sponsor had no role in the design of the study; in the collection, analyses or interpretation of data; in the writing of the manuscript; nor in the decision to publish the results.
References
- United Nations. The State of Asian and Pacific Cities 2015 Urban Transformations Shifting from Quantity to Quality; United Nations: New York, NY, USA, 2015; p. 204. [Google Scholar]
- Seto, K.C.; Fragkias, M.; Güneralp, B.; Reilly, M.K. A meta-analysis of global urban land expansion. PLoS ONE 2011, 6, e23777. [Google Scholar] [CrossRef] [PubMed]
- Schneider, A.; Mertes, C.; Tatem, A.; Tan, B.; Sulla-Menashe, D.; Graves, S.J.; Patel, N.N.; Horton, J.A.; Gaughan, A.E.; Rollo, J.T.; et al. A new urban landscape in East–Southeast Asia, 2000–2010. Environ. Res. Lett. 2015, 10, 034002. [Google Scholar] [CrossRef]
- Fragkias, M.; Langanke, T.; Boone, C.; Haase, D.; Marcotullio, P.J.; Munroe, D.; Olah, B.; Reenberg, A.; Seto, K.; Simon, D. Land Teleconnections in an Urbanizing World; GLP Workshop Report, GLP Report No. 5; Global Land Programme: Bern, Switzerland, 2012; p. 22. [Google Scholar]
- Angel, S.; Parent, J.; Civco, D.L.; Blei, A.; Potere, D. The dimensions of global urban expansion: Estimates and projections for all countries, 2000–2050. Prog. Plan. 2011, 75, 53–107. [Google Scholar] [CrossRef]
- Stefan, B.; Helmut, S.; Walter, P.; O'Brien, M.; Garcia, F.; Sims, R.; Howarth, R.W.; Kauppi, L.; Swilling, M.; Herrick, J. ASSESSING GLOBAL LAND USE: Balancing Consumption With Sustainable Supply; UNEP Publication: Nairobi, Kenya, 2014; p. 131. [Google Scholar]
- Seto, K.C.; Güneralp, B.; Hutyra, L.R. Global forecasts of urban expansion to 2030 and direct impacts on biodiversity and carbon pools. Proc. Natl. Acad. Sci. USA 2012, 109, 16083–16088. [Google Scholar] [CrossRef] [PubMed]
- Shi, Y.; Sun, X.; Zhu, X.; Li, Y.; Mei, L. Characterizing growth types and analyzing growth density distribution in response to urban growth patterns in peri-urban areas of Lianyungang City. Landsc. Urban Plan. 2012, 105, 425–433. [Google Scholar] [CrossRef]
- Debolini, M.; Valette, E.; François, M.; Chéry, J.-P. Mapping land use competition in the rural–urban fringe and future perspectives on land policies: A case study of Meknès (Morocco). Land Use Policy 2015, 47, 373–381. [Google Scholar] [CrossRef]
- Handayani, W. Rural-urban transition in Central Java: Population and economic structural changes based on cluster analysis. Land 2013, 2, 419–436. [Google Scholar] [CrossRef]
- Appiah, D.O.; Bugri, J.T.; Forkuor, E.K.; Boateng, P.K. Determinants of peri-urbanization and land use change patterns in peri-urban Ghana. J. Sustain. Dev. 2014, 7, 95–109. [Google Scholar] [CrossRef]
- Malaque, I.R.; Yokohari, M. Urbanization process and the changing agricultural landscape pattern in the urban fringe of Metro Manila, Philippines. Environ. Urban. 2007, 19, 191–206. [Google Scholar] [CrossRef]
- Piorr, A. Peri-Urbanisation in Europe: Towards European Policies to Sustain Urban-Rural Futures; Synthesis Report; PLUREL [Sixth Framework Programme]; Forest & Landscape, University of Copenhagen: Copenhagen, Denmark, 2011. [Google Scholar]
- Piorr, A.; Ravetz, J.; Tosics, I.; PLUREL. Peri-urbanisation in Europe: Towards European Policies to Sustain Urban-Rural Futures: Synthesis Report; Forest & Landscape: Copenhagen, Denmark, 2011. [Google Scholar]
- Matson, P.A.; Parton, W.J.; Power, A.; Swift, M. Agricultural intensification and ecosystem properties. Science 1997, 277, 504–509. [Google Scholar] [CrossRef] [PubMed]
- Flynn, D.F.; Gogol-Prokurat, M.; Nogeire, T.; Molinari, N.; Richers, B.T.; Lin, B.B.; Simpson, N.; Mayfield, M.M.; DeClerck, F. Loss of functional diversity under land use intensification across multiple taxa. Ecol. Lett. 2009, 12, 22–33. [Google Scholar] [CrossRef] [PubMed]
- Xiao, J.; Shen, Y.; Ge, J.; Tateishi, R.; Tang, C.; Liang, Y.; Huang, Z. Evaluating urban expansion and land use change in Shijiazhuang, China, by using GIS and remote sensing. Landsc. Urban Plan. 2006, 75, 69–80. [Google Scholar] [CrossRef]
- Liu, J.; Hull, V.; Batistella, M.; DeFries, R.; Dietz, T.; Fu, F.; Hertel, T.W.; Izaurralde, R.C.; Lambin, E.F.; Li, S.; et al. Framing sustainability in a telecoupled world. Ecol. Soc. 2013, 18. [Google Scholar] [CrossRef]
- Jiang, Y.; Swallow, S.K. Providing an ecologically sound community landscape at the urban–rural fringe: A conceptual, integrated model. J. Land Use Sci. 2015, 10, 323–341. [Google Scholar] [CrossRef]
- Pham, V.C.; Pham, T.-T.-H.; Tong, T.H.A.; Nguyen, T.T.H.; Pham, N.H. The conversion of agricultural land in the peri-urban areas of Hanoi:(Vietnam): Patterns in space and time. J. Land Use Sci. 2014. [Google Scholar] [CrossRef]
- D’Amour, C.B.; Reitsma, F.; Baiocchi, G.; Barthel, S.; Güneralp, B.; Erb, K.-H.; Haberl, H.; Creutzig, F.; Seto, K.C. Future urban land expansion and implications for global croplands. Proc. Natl. Acad. Sci. USA 2016. [Google Scholar] [CrossRef]
- Crossman, N.D.; Bryan, B.A.; Ostendorf, B.; Collins, S. Systematic landscape restoration in the rural–urban fringe: Meeting conservation planning and policy goals. Biodivers. Conserv. 2007, 16, 3781–3802. [Google Scholar] [CrossRef]
- Thapa, R.B.; Murayama, Y. Land evaluation for peri-urban agriculture using analytical hierarchical process and geographic information system techniques: A case study of Hanoi. Land Use Policy 2008, 25, 225–239. [Google Scholar] [CrossRef]
- Seto, K.C.; Sánchez-Rodríguez, R.; Fragkias, M. The new geography of contemporary urbanization and the environment. Annu. Rev. Environ. Resour. 2010, 35, 167–194. [Google Scholar] [CrossRef]
- Nagendra, H.; Unnikrishnan, H.; Sen, S. Villages in the city: Spatial and temporal heterogeneity in rurality and urbanity in Bangalore, India. Land 2013, 3, 1–18. [Google Scholar] [CrossRef]
- Rauws, W.; de Roo, G. Exploring transitions in the peri-urban area. Plan. Theory Pract. 2011, 12, 269–284. [Google Scholar] [CrossRef]
- Liu, Y.; Feng, Y.; Pontius, R.G. Spatially-explicit simulation of urban growth through self-adaptive genetic algorithm and cellular automata modelling. Land 2014, 3, 719–738. [Google Scholar] [CrossRef]
- Irwin, E.G.; Bockstael, N.E. The evolution of urban sprawl: Evidence of spatial heterogeneity and increasing land fragmentation. Proc. Natl. Acad. Sci. USA 2007, 104, 20672–20677. [Google Scholar] [CrossRef] [PubMed]
- Lambin, E.F.; Turner, B.L.; Geist, H.J.; Agbola, S.B.; Angelsen, A.; Bruce, J.W.; Coomes, O.T.; Rodolfo Dirzo, R.; Fischer, G.; Carl Folke, C.; et al. The causes of land-use and land-cover change: Moving beyond the myths. Glob. Environ. Chang. 2001, 11, 261–269. [Google Scholar] [CrossRef]
- Allan, J.D. Landscapes and riverscapes: The influence of land use on stream ecosystems. Annu. Rev. Ecol. Evol. Syst. 2004, 257–284. [Google Scholar] [CrossRef]
- Luck, M.; Wu, J. A gradient analysis of urban landscape pattern: A case study from the Phoenix metropolitan region, Arizona, USA. Landsc. Ecol. 2002, 17, 327–339. [Google Scholar] [CrossRef]
- Kuang, W.; Liu, J.; Dong, J.; Chi, W.; Zhang, C. The rapid and massive urban and industrial land expansions in China between 1990 and 2010: A CLUD-based analysis of their trajectories, patterns, and drivers. Landsc. Urban Plan. 2016, 145, 21–33. [Google Scholar] [CrossRef]
- Lambin, E.F.; Meyfroidt, P. Land use transitions: Socio-ecological feedback versus socio-economic change. Land Use Policy 2010, 27, 108–118. [Google Scholar] [CrossRef]
- Haase, D.; Nuissl, H. The urban-to-rural gradient of land use change and impervious cover: A long-term trajectory for the city of Leipzig. J. Land Use Sci. 2010, 5, 123–141. [Google Scholar] [CrossRef]
- Bunker, R.; Houston, P. Prospects for the Rural-Urban Fringe in Australia: Observations from a Brief History of the Landscapes around Sydney and Adelaide. Aust. Geogr. Stud. 2003, 41, 303–323. [Google Scholar] [CrossRef]
- Houston, P. Re-valuing the fringe: Some findings on the value of agricultural production in Australia’s peri-urban regions. Geogr. Res. 2005, 43, 209–223. [Google Scholar] [CrossRef]
- Kroll, F.; Müller, F.; Haase, D.; Fohrer, N. Rural–urban gradient analysis of ecosystem services supply and demand dynamics. Land Use Policy 2012, 29, 521–535. [Google Scholar] [CrossRef]
- Andersson, E.; Ahrné, K.; Pyykönen, M.; Elmqvist, T. Patterns and scale relations among urbanization measures in Stockholm, Sweden. Landsc. Ecol. 2009, 24, 1331–1339. [Google Scholar] [CrossRef]
- McGarigal, K.; Cushman, S. The Gradient Concept of Landscape Structure; Cambridge University Press: Cambridge, UK, 2005; Chapter 12. [Google Scholar]
- Godron, M.; Forman, R. Landscape Modification and Changing Ecological Characteristics, in Disturbance and Ecosystems; Springer: Berlin/Heidelberg, Germany, 1983; pp. 12–28. [Google Scholar]
- McDonnell, M.J.; Pickett, S.T.; Groffman, P.; Bohlen, P.; Pouyat, R.V.; Zipperer, W.C.; Parmelee, R.W.; Carreiro, M.M.; Medley, K. Ecosystem processes along an urban-to-rural gradient. Urban Ecosyst. 1997, 1, 21–36. [Google Scholar] [CrossRef]
- Weng, Y. Spatiotemporal changes of landscape pattern in response to urbanization. Landsc. Urban Plan. 2007, 81, 341–353. [Google Scholar] [CrossRef]
- McDonnell, M.J.; Hahs, A.K. The use of gradient analysis studies in advancing our understanding of the ecology of urbanizing landscapes: Current status and future directions. Landsc. Ecol. 2008, 23, 1143–1155. [Google Scholar] [CrossRef]
- Larondelle, N.; Haase, D. Urban ecosystem services assessment along a rural–urban gradient: A cross-analysis of European cities. Ecol. Indic. 2013, 29, 179–190. [Google Scholar] [CrossRef]
- Vizzari, M.; Sigura, M.; Antognelli, S.; Kovačev, I. Ecosystem services demand, supply and budget along the urban-rural-natural gradient. In Proceedings of the 43rd International Symposium on Agricultural Engineering, Actual Tasks on Agricultural Engineering, Opatija, Croatia, 24–27 February 2015. [Google Scholar]
- Forman, R.T.; Godron, M. Landscape Ecology; John Wiley & Sons: New York, NY, USA, 1986; p. 619. [Google Scholar]
- McDonnell, M.J.; Pickett, S.T.; Pouyat, R.V. The Application of the Ecological Gradient Paradigm to the Study of Urban Effects, in Humans as Components of Ecosystems; Springer: Berlin/Heidelberg, Germany, 1993; pp. 175–189. [Google Scholar]
- Vizzari, M.; Sigura, M. Landscape sequences along the urban–rural–natural gradient: A novel geospatial approach for identification and analysis. Landsc. Urban Plan. 2015, 140, 42–55. [Google Scholar] [CrossRef]
- Bridges, L.M.; Crompton, A.E.; Schaefer, J.A. Landscapes as gradients: The spatial structure of terrestrial ecosystem components in southern Ontario, Canada. Ecol. Complex. 2007, 4, 34–41. [Google Scholar] [CrossRef]
- Warren, P.S.; Ryan, R.L.; Lerman, S.B.; Tooke, K.A. Social and institutional factors associated with land use and forest conservation along two urban gradients in Massachusetts. Landsc. Urban Plan. 2011, 102, 82–92. [Google Scholar] [CrossRef]
- Shkaruba, A.; Kireyeu, V.; Likhacheva, O. Rural–urban peripheries under socioeconomic transitions: Changing planning contexts, lasting legacies, and growing pressure. Landsc. Urban Plan. 2016. [Google Scholar] [CrossRef]
- Joo, W.; Gage, S.H.; Kasten, E.P. Analysis and interpretation of variability in soundscapes along an urban–rural gradient. Landsc. Urban Plan. 2011, 103, 259–276. [Google Scholar] [CrossRef]
- Díaz-Varela, E.; Roces-Díaz, J.V.; Álvarez-Álvarez, P. Detection of landscape heterogeneity at multiple scales: Use of the Quadratic Entropy Index. Landsc. Urban Plan. 2016, 153, 149–159. [Google Scholar] [CrossRef]
- McGarigal, K.; Marks, B.J. Spatial Pattern Analysis Program for Quantifying Landscape Structure; Gen. Tech. Rep. PNW-GTR-351; US Department of Agriculture, Forest Service, Pacific Northwest Research Station: Corvallis, OR, USA, 1995.
- Zhang, Z.; Tu, Y.; Li, X. Quantifying the spatiotemporal patterns of urbanization along urban-rural gradient with a roadscape transect approach: A case study in Shanghai, China. Sustainability 2016, 8, 862. [Google Scholar] [CrossRef]
- Liu, Z.; He, C.; Wu, J. The relationship between habitat loss and fragmentation during urbanization: An empirical evaluation from 16 World Cities. PLoS ONE 2016, 11, e0154613. [Google Scholar] [CrossRef] [PubMed]
- Wrbka, T.; Erb, K.-H.; Schulz, N.B.; Peterseil, J.; Hahn, C.; Haberl, H. Linking pattern and process in cultural landscapes. An empirical study based on spatially explicit indicators. Land Use Policy 2004, 21, 289–306. [Google Scholar] [CrossRef]
- Millington, A.C.; Velez-Liendo, X.M.; Bradley, A.V. Scale dependence in multitemporal mapping of forest fragmentation in Bolivia: Implications for explaining temporal trends in landscape ecology and applications to biodiversity conservation. ISPRS J. Photogramm. Remote Sens. 2003, 57, 289–299. [Google Scholar] [CrossRef]
- South Australian Government (Ed.) Character Preservation (McLaren Vale) Act 2012; Government of South Australia: Adelaide, SA, Australia, 2013.
- Ornetsmüller, C.; Verburg, P.H.; Heinimann, A. Scenarios of land system change in the Lao PDR: Transitions in response to alternative demands on goods and services provided by the land. Appl. Geogr. 2016, 75, 1–11. [Google Scholar] [CrossRef]
- Walcott, J.J.; Zuo, H.; Loch, A.D.; Smart, R.V. Patterns and trends in Australian agriculture: A consistent set of agricultural statistics at small areas for analysing regional changes. J. Land Use Sci. 2013, 9, 453–473. [Google Scholar] [CrossRef]
© 2017 by the authors. Licensee MDPI, Basel, Switzerland. This article is an open access article distributed under the terms and conditions of the Creative Commons Attribution (CC BY) license (http://creativecommons.org/licenses/by/4.0/).

