Article

Measurement-Based Power Optimization Technique for OpenCV on Heterogeneous Multicore Processor

1
Department of ECE, Ajou University, Suwon 16499, Korea
2
Department of Computer Science and Engineering, Seoul National University, Seoul 08826, Korea
*
Author to whom correspondence should be addressed.
A large part of this work was done while Kyoseung Koo was a B.S. student at Ajou University.
Symmetry 2019, 11(12), 1488; https://doi.org/10.3390/sym11121488
Submission received: 11 November 2019 / Revised: 29 November 2019 / Accepted: 2 December 2019 / Published: 6 December 2019

Abstract

:
Today’s embedded systems often operate computer-vision applications, and are associated with timing and power constraints. Since it is not simple to capture the symmetry between the application and the model, the model-based design approach is generally not applicable to the optimization of computer-vision applications. Thus, in this paper, we propose a measurement-based optimization technique for an open-source computer-vision application library, OpenCV, on top of a heterogeneous multicore processor. The proposed technique consists of two sub-systems: the optimization engine running on a separate host PC, and the measurement library running on the target board. The effectiveness of the proposed optimization technique has been verified in the case study of latency-power co-optimization by using two OpenCV applications—canny edge detection and squeezeNet. It has been shown that the proposed technique not only enables broader design space exploration, but also improves optimality.

1. Introduction

Many existing embedded systems, such as robots, drones, or Internet-of-Things devices, often utilize computer-vision processing. Examples of computer vision on embedded systems include obstacle avoidance navigation systems on robots [1], yawning detection during driving [2], and drone-based trail perception in forests [3]. They perform computer-vision algorithms that demand high computing capability. Typically, embedded system designs are associated with non-functional concerns.  They often have execution time-constraints to guarantee real-time responsiveness. In addition, as many embedded devices are battery-powered, minimizing power consumption is considered an important design objective. Because the hardware platform for embedded devices is resource-constrained, it is a challenge to fulfill the timing and power requirements simultaneously. Thus, in many cases, such computationally intensive workloads of computer-vision algorithms are typically managed remotely by being offloaded to high-performance cloud systems [4].
However, such an offloading approach incurs considerable communication between cloud systems and devices, thus resulting in latency, bandwidth, and power issues. Furthermore, the offloading is only feasible when reliable network supports are readily and constantly available. Thus, as an alternative to cloud offloading, it is necessary to enable the on-device operation of computer-vision algorithms in embedded systems. It is typical to computationally manage heavy workloads using specialized accelerators or dedicated hardware logic in embedded systems; however, this accelerator approach is no longer suitable for computer-vision algorithms, as the algorithms continuously evolve. A software-based implementation is required to efficiently manage such constantly evolving algorithms. Therefore, currently, commercial off-the-shelf multicore processors [5] are typically used in embedded systems for managing computationally heavy workloads that are subject to changes in the future.
In the design of multicore embedded systems, it is essential to determine which part of the algorithm is to be executed on a certain core—that is, mapping optimization. Many techniques or computer-aided design tools have been proposed to solve this mapping problem [6]. To effectively optimize complex applications on a multicore processor, nonfunctional behaviors, such as execution time or power consumption, of each part of the target algorithm must be known a priori in the optimization phase. Once the internal structure of the target algorithm and these nonfunctional behaviors are modeled accordingly in a well-structured representation [7,8], mapping optimization can be regarded as a combinatorial optimization, and any known mathematical solutions, such as integer linear programming or evolutionary algorithms, can be used for optimization. This is a so-called model-based design, and most existing multicore mapping techniques adopt this approach [6].
However, the symmetry between the algorithm and model cannot be easily captured in the computer-vision applications considered herein, thus making the model-based design methodology unsuitable. The reasons are as follows: Firstly, the complexity or level of abstraction of the algorithm is much higher than that of ordinary embedded software. Many conditional software execution paths and data-dependent processing are involved; therefore, a monolithic representation of the algorithm is typically infeasible. Secondly, the execution time of a certain part of the algorithm is difficult to model in a simple way. For instance, a function may exhibit vastly different execution times and memory traffic depending on the image or window size. Finally, many computer-vision algorithms are distributed as executable libraries, as exemplified in an open-source library, OpenCV [9]; thus, restructuring the algorithms in a model-based design framework requires considerable engineering efforts.
Hence, we herein propose to optimize computer-vision applications on a multicore processor without any modeling. Conventionally, in model-based designs, the data or control flow of software is specified as a directed graph; additionally, the execution time or power consumption of nodes, called actors, must be modeled appropriately. To eliminate such modeling efforts, we propose to perform measurement-based adaptive optimizations with respect to the given power or timing constraints. That is, a simple profiling interface is inserted at the core parts of the application source code; subsequently, the performance measurement and optimization are performed sequentially and repeatedly. This measurement-based optimization has also been applied in other domains [10,11], such as in cases where modeling and analysis are difficult.
There have been some studies on the optimization of power and execution time of OpenCV algorithms in embedded systems. Most of these studies pertain to real-time applications executed on embedded systems using specific OpenCV image processing algorithms [12,13,14]. In addition, many of them obtain improvements in performance by using GPGPUs [15,16]. Furthermore, OpenCV is optimized for low power by configuring low-power, DSP- based hardware [17] or implementing FPGA-based, low-power image processing platforms [18]. While certain OpenCV algorithms have been optimized for specific embedded systems in these studies, our proposed technique enables general design space explorations of power and execution time for various multicore embedded systems.

2. Background

In this section, we present background information regarding OpenCV, a public open-source computer-vision library that we try to optimize, as well as a genetic algorithm (GA) which we used as an optimization engine.

2.1. OpenCV

OpenCV [9] is a library that provides programming functions to solve computer-vision problems. Many computer-vision applications use this library as it provides a considerable number of algorithms and examples with well-documented references. Typically, a computer-vision application contains one or more algorithms which are associated with each other in execution dependencies. Figure 1 illustrates a canny edge detection application, an official OpenCV example, in which two OpenCV functions are sequenced in a task graph format. In this example, two OpenCV functions are invoked in order: c v t C o l o r ( ) , which converts the color type of an image; and C a n n y ( ) , which performs the canny edge detection algorithm.
Note that some OpenCV algorithms can be executed in parallel, as they are operated upon multiple independent data sets. Such a parallel algorithm is called a parallel task and is executed simultaneously on a multicore processor using OpenCV’s parallel framework. In this example, three parallel tasks are found: C o n v e r t C o l o r , E d g e D e t e c t i n g , and F i n a l P a s s .
The parallel framework of OpenCV implements the parallel tasks in p a r a l l e l _ f o r _ functions. Several parallelization alternatives are provided by OpenCV for the p a r a l l e l _ f o r _ functions which are tailored to the special parallel architectures, such as CUDA or OpenCL-based GPGPUs, or low-level parallelization libraries, such as POSIX Threads (pthread), Intel TBB [19], and OpenMP [20]. In this work, we target the p a r a l l e l _ f o r _ function implemented using pthread, as it is generally applicable to any multicore system. In this case, the parallelization decision is made by three configuration parameters: v, w, and c. In order to utilize the data parallelism of an OpenCV application, the input image is split into w sub-images (Parameter w here corresponds to variable n s t r i p e s in the OpenCV source code). Parameter c means the chunk size is to be handled at a single thread execution—that is, c sub-images are processed within a single thread execution. Lastly, parameter v represents the number of thread instances generated to handle the given workload.
The p a r a l l e l _ f o r _ function processes an image with the above-mentioned configurations in the following steps. Firstly, the input image is divided into pieces (w sub-images) and v threads are spawned to handle the parallel task. Among the total w sub-images, a thread takes c sub-images per invocation. Upon completion of a thread, it is checked to see whether there are any unprocessed sub-images remaining. If so, it is invoked again for a new set of c sub-images. Otherwise, it reports the completion of the parallel processing with an output image. In the case that we have <v = 2, w = 6, c = 3>, for instance, the input image is partitioned into 6 sub-images, and 2 threads process them in a simultaneous way. As a thread handles 3 sub-images (chunks) at a single invocation, those two threads are only invoked once. The parallel framework of OpenCV can be seen as a realization of the fork-join data parallelism [21,22], where the data parallel workloads are partitioned into small chunks of the same size and properly distributed over a number of threads. Note that this fork-join parallelism can also be found in other parallel and distributed processing domains, such as Hadoop [23].
In OpenCV (version 3.4.X), the above configurations remain unoptimized in a hard-coded way. By default, v is fixed to be the number of cores in the target system, while w and c are determined in an ad hoc manner. The sub-image size is manually defined as a constant by the algorithm designer. For instance, in C o n v e r t C o l o r ( ) , the sub-image size is fixed as 64 KB, and thus, w is also fixed to the input image size divided by 64 KB. The chunk size c is fixed to 1—that is, the thread always handles a single sub-image per invocation. We identify these crude constant parameter assignments as a big room for optimization. For instance, embedded systems with insufficient power budgets require a design that operates at low power by reducing v even if the execution time may get enlarged.
It is noteworthy that the latest version of OpenCV library is 4.1.2; however, the proposed technique has been implemented and evaluated in version 3.4.1. Although the default thread function of OpenCV 4.0.0 (or later) has been changed from pthread to s t d : : t h r e a d , we believe that the proposed technique can also be implemented in different thread libraries without loss of generality, as it is not dependent upon a specific hardware.

2.2. Genetic Algorithm (GA)

The genetic Algorithm (GA) is an evolutionary algorithm that imitates the mechanism of natural selection. This meta-heuristic algorithm is widely adopted for obtaining near-optimum solutions in a large and complex design space exploration; therefore, it has been typically used in optimization problems that are difficult to solve in polynomial time. For instance, Hornby et al. [24] developed an evolved antenna by an evolutionary design program to obtain the best radiation pattern, and Nakaya et al. [25] used an adaptive GA for sequence-pair-based, very large-scale integration (VLSI) floor planning. In the case where more than one design objective is optimized at the same time, multi-objective evolutionary algorithms have also been proposed [26,27]. Many existing works, including that by Kang et al. [28] optimized the multi-objective mapping problem by using multi-objective GA.

3. Proposed Optimization Technique

We propose to take a measurement-based approach to the optimization of OpenCV parallelization with respect to the given execution time (latency) and power consumption requirements. Thus, it requires no prior knowledge on the application and underlying hardware architecture. As shown in Figure 2, the proposed technique comprises two distinct parts: optimization and measurement. The optimization part is not performed on the target board directly, but separately performed on a host PC to avoid adverse effects on the measurement. Its objective is to derive optimized configurations for the parallel_for_ functions using a design space exploration (DSE) engine running on the host. Once a candidate configuration is obtained, it is sent to the target board over the TCP/IP channel established between the host PC and target board. Then, the configuration is applied to the target board by means of the developed configuration manager, and the latency and power consumption are directly measured in the target board. These measurements are delivered back to the DSE engine on the host PC, and the optimization procedure continues using these as evaluation results.

3.1. Optimization Part

The optimization part shown in the left-hand side of Figure 2 uses the DSE engine on the host PC to search for the optimal configuration. Since the derivation of optimal parallel configuration over the power and latency is a complex combinatorial optimization, we implemented the multi-objective GA-based DSE engine based on a publicly available meta-heuristic solver framework, Opt4J [29]. Figure 2 shows the genotype structure of the GA designed to solve the proposed parallel configuration optimization problem. Note that P is the parallel configurations to be derived, and the ith configuration point is denoted as p i P , where it is associated with three positive integers, < v i , w i , c i >, as stated above. Thus, a genotype is assigned 3 · n slots, each of which is to be filled with a positive integer when there are n parallel configuration points in the target problem—that is, | P | = n .
Among the three values of p i , v i denotes the number of parallel and independent threads to handle the function, and thus a value is chosen in the range of 1 to the maximum parallelism degree ( m p d ). The number of sub-image partitions, w i is determined within the range of [ v i , w m a x ] where w m a x denotes the upper bound of the number of sub-image partitions. At last, the number of chunks, c i  is determined within the range of [1, w i / v i ]. Note that the minimum value of w i is lower-bounded by v i to avoid under-utilized threads. For instance, with < v i = 3, w i = 2, c i = 1>, two threads are simultaneously working on three sub-image partitions. In this case, after the first iteration, only one sub-image is left, meaning that one thread remains idle. These range adjustments of w and c are implemented in the GA engine, as illustrated in Algorithm 1.
Algorithm 1 Procedure of GA for the DSE of the proposed technique.
1:
n number of parallel tasks in the application;
2:
m o d e selecting mode in [ m e a n , m e d i a n , w o r s t ];
3:
 
4:
procedure Creator(n)
5:
     g e n o t y p e initializing genotype;
6:
    for i = 1 to n do                 ▹ adding < v i , w i , c i > about p i to genotype
7:
         g e n o t y p e .add( [ 1 , m p d ] , integer);
8:
         g e n o t y p e .add( [ 1 , w m a x ] , integer);
9:
         g e n o t y p e .add( [ 1 , w m a x ] , integer);
10:
    end for
11:
    return g e n o t y p e ;
12:
end procedure
13:
 
14:
procedure Decoder( g e n o t y p e , n)
15:
     p h e n o t y p e initializing phenotype;
16:
     i n d e x 1
17:
    for i = 1 to n do
18:
         v i g e n o t y p e [ i n d e x ] ;
19:
         w i g e n o t y p e [ i n d e x + 1 ] ;
20:
        if w i < v i then w i gene_regeneration( [ v i , w m a x ] , integer);
21:
         c i g e n o t y p e [ i n d e x + 2 ] ;
22:
        if c i > w i / v i then c i gene_regeneration( [ 1 , w i / v i ] , integer);
23:
         p h e n o t y p e .add( [ v i , w i , c i ] );
24:
         i n d e x i n d e x + 3 ;
25:
    end for
26:
    return p h e n o t y p e ;
27:
end procedure
28:
 
29:
procedureEvaluator( p h e n o t y p e , m o d e )
30:
    tcp.send(convert_send_protocol( p h e n o t y p e , m o d e );
31:
     [ p o w e r , e x e c u t i o n _ t i m e ] convert_receive_protocol(tcp.receive());
32:
    objective.add( p o w e r , min);
33:
    objective.add( e x e c u t i o n _ t i m e , min);
34:
end procedure
Algorithm 1 is an overview of the implementation of the DSE engine in Opt4J. A combinatorial optimization using the Opt4J framework requires the definitions of the following three procedures: Creator, Decoder, and Evaluator. The generation of initial candidate solutions is implemented in Creator, as illustrated in lines 4–12. For each of p i among n configurations, three positive integers are randomly assigned for v i , w i , and c i . The generated candidate solutions are verified and properly modified, if necessary, in Decoder. The range corrections for w i and c i are illustrated in lines 20 and 22, respectively. By using Decoder, arbitrarily generated candidate solutions (genotypes) are now corrected and returned as valid solutions (phenotypes). The optimality of each phenotype is evaluated by Evaluator. As the evaluations are made by actual measurements performed at the target board, information on the phenotype should be transferred to the target board (line 30). Then, the measurement results are obtained at line 31 through the blocking TCP/IP read from the target board, and these evaluation results are delivered to the DSE engine (lines 32–33).
Note that an evaluation transaction is not based on a single measurement, but consists of a number of measurements of the repeated executions of the application. To be more specific, each configuration is measured by I m a x times, as will be illustrated in the following subsection. This is to cope with the uncertainties or variations of the performance in OpenCV applications running on modern computer systems, where many SW or HW components are dynamic. For instance, the CPU scheduler or frequency governor may work differently depending on the given working conditions, such as the temperature or power budget.
In this regard, the profiling mode (a variable called mode) should be properly set, as the second argument (line 29) during the evaluation, to be one of the followings: mean, medium, and worst. Depending on the characteristics of the target system to be optimized, one of the mean, median, and worst values of the multiple measurements is chosen as the representative evaluation value. For instance, in the case that it is crucial to respect the given latency constraint, it is desirable to adopt the w o r s t mode, since the execution latency is optimized considering the worst case during the measurement.

3.2. Measurement Part

The measurement part shown in the right-hand side of Figure 2 is responsible for the actual measurement of the application with respect to the given candidate solution P derived by the DSE engine. As the proposed technique performs the measurement directly in the target board, it requires modifications of the OpenCV code. In order for the proposed technique to be generically applicable to any OpenCV applications, the required code modifications should not include any application- or system-specific statements. In this sense, a set of generic APIs that encapsulate the activities of the measurement part, as summarized in Table 1, is defined and implemented as a library to enhance the portability of the proposed technique.
The TransmissionManager library is for the communication between the host PC and the target board. The target board can obtain the candidate configuration (P) and profiling mode ( m o d e ) by invoking r e c e i v e ( ) . On the completion of profiling, the measurement results, that is, the power consumption and latency, are sent to the host side via s e n d ( ) .
The second library, ParallelConfiguration, was developed in parallel.cpp and parallel_impl.cpp in the OpenCV source codes to manage the profiling on the target board. The measurement mode can easily be turned on and off by invoking s e t E n a b l e ( ) , and it can be checked whether the system is under measurement or not with g e t E n a b l e ( ) . A candidate configuration can be applied to the target board by invoking s e t ( ) of ParallelConfiguration.
After the configuration is applied as intended, the MeasurementUnit library actually performs the measurements of the running application. Note that this library is implemented using system-specific APIs. In the proposed technique, we used Linux system calls to measure the execution time, while the device driver provided by the board vendor [30] was utilized to access the integrated power sensor. The starting and end points of the profiling were set by invoking s t a r t ( ) and s t o p ( ) , respectively. When the measurement mode is on, the profiling is automatically performed for the marked region, and the individual result is obtained by invoking g e t P r o f i l i n g ( ) . As stated in the previous section, multiple measurements, that is, I m a x times, are repeatedly performed for the same application, and a statistically representative value, e.g., mean, median, or worst, is chosen depending on the mode value. By invoking getProfilingStatistics(), a proper statistical value for the given argument mode can be obtained.
Algorithm 2 exemplifies how the measurement part works in the canny edge detection application shown in Figure 1 using the APIs explained above. At the beginning, the TransmissionManager receives the candidate configurations and profiling mode at line 1, and turns on the measurement mode at line 2. Note in Figure 1 that there are three parallel tasks to be optimized in the given example. So, the parallel configuration also consists of three configurations: p 1 for C o n v e r t C o l o r ( ) , and p 2 and p 3 for the two parallel tasks in C a n n y ( ) . The starting and end positions were set at lines 5 and 10, respectively to encompass the core part of the OpenCV workload. After the measurements were performed by I m a x times by iterating the loop in lines 3–12, the representative statistical values were derived at line 13 and transferred to the host side at line 14.
Algorithm 2 An OpenCV code modification example using the proposed technique for the canny edge detection application.
1:
[ P , m o d e ] TransmissionManager.receive();
2:
ParallelConfiguration.setEnable(true);
3:
for i = 1 to I m a x do
4:
    input_image← getting input image;
5:
    MeasurementUnit.start();
6:
    ParallelConfiguration.set( p 1 );
7:
    ConvertColor(input_image, gray_image);                 ▹ Function with a parallel task
8:
    ParallelConfiguration.set( [ p 2 , p 3 ] );
9:
    Canny(gray_image, output_image]);             ▹ Function with two parallel tasks
10:
    MeasurementUnit.stop();
11:
     [ p o w e r i , e x e c u t i o n _ t i m e i ] MeasurementUnit.getProfiling();
12:
end for
13:
[ p o w e r s e l e c t , e x e c u t i o n _ t i m e s e l e c t ] MeasurementUnit.getProfilingStatistics( m o d e );
14:
TransmissionManager.send( p o w e r s e l e c t , e x e c u t i o n _ t i m e s e l e c t );

4. Evaluations

As evaluations, we performed the co-optimization of the power consumption and latency of OpenCV applications using the proposed optimization technique in a heterogeneous multicore embedded system. As summarized in Table 1, the proposed technique was implemented in C++ as libraries, and thus can be applied to any OpenCV application that uses OpenCV’s parallel framework. We adopted two widely used examples from the OpenCV tutorial for evaluations. Also, in order to demonstrate the effectiveness of the proposed technique in comparative evaluations, we chose two comparison targets: the original OpenCV configuration (without any modification), and an ad hoc optimization. For the ad hoc optimization, we tried to keep the parallelism degree (v) and the number of sub-image partitions (w) the same, based on the observation that this is good for avoiding the unbalanced assignment of sub-images to threads, while keeping the chunk size as 1—that is, c = 1 . A number of configurations can be generated from this ad hoc optimization by varying v within the range of [1, m p d ].

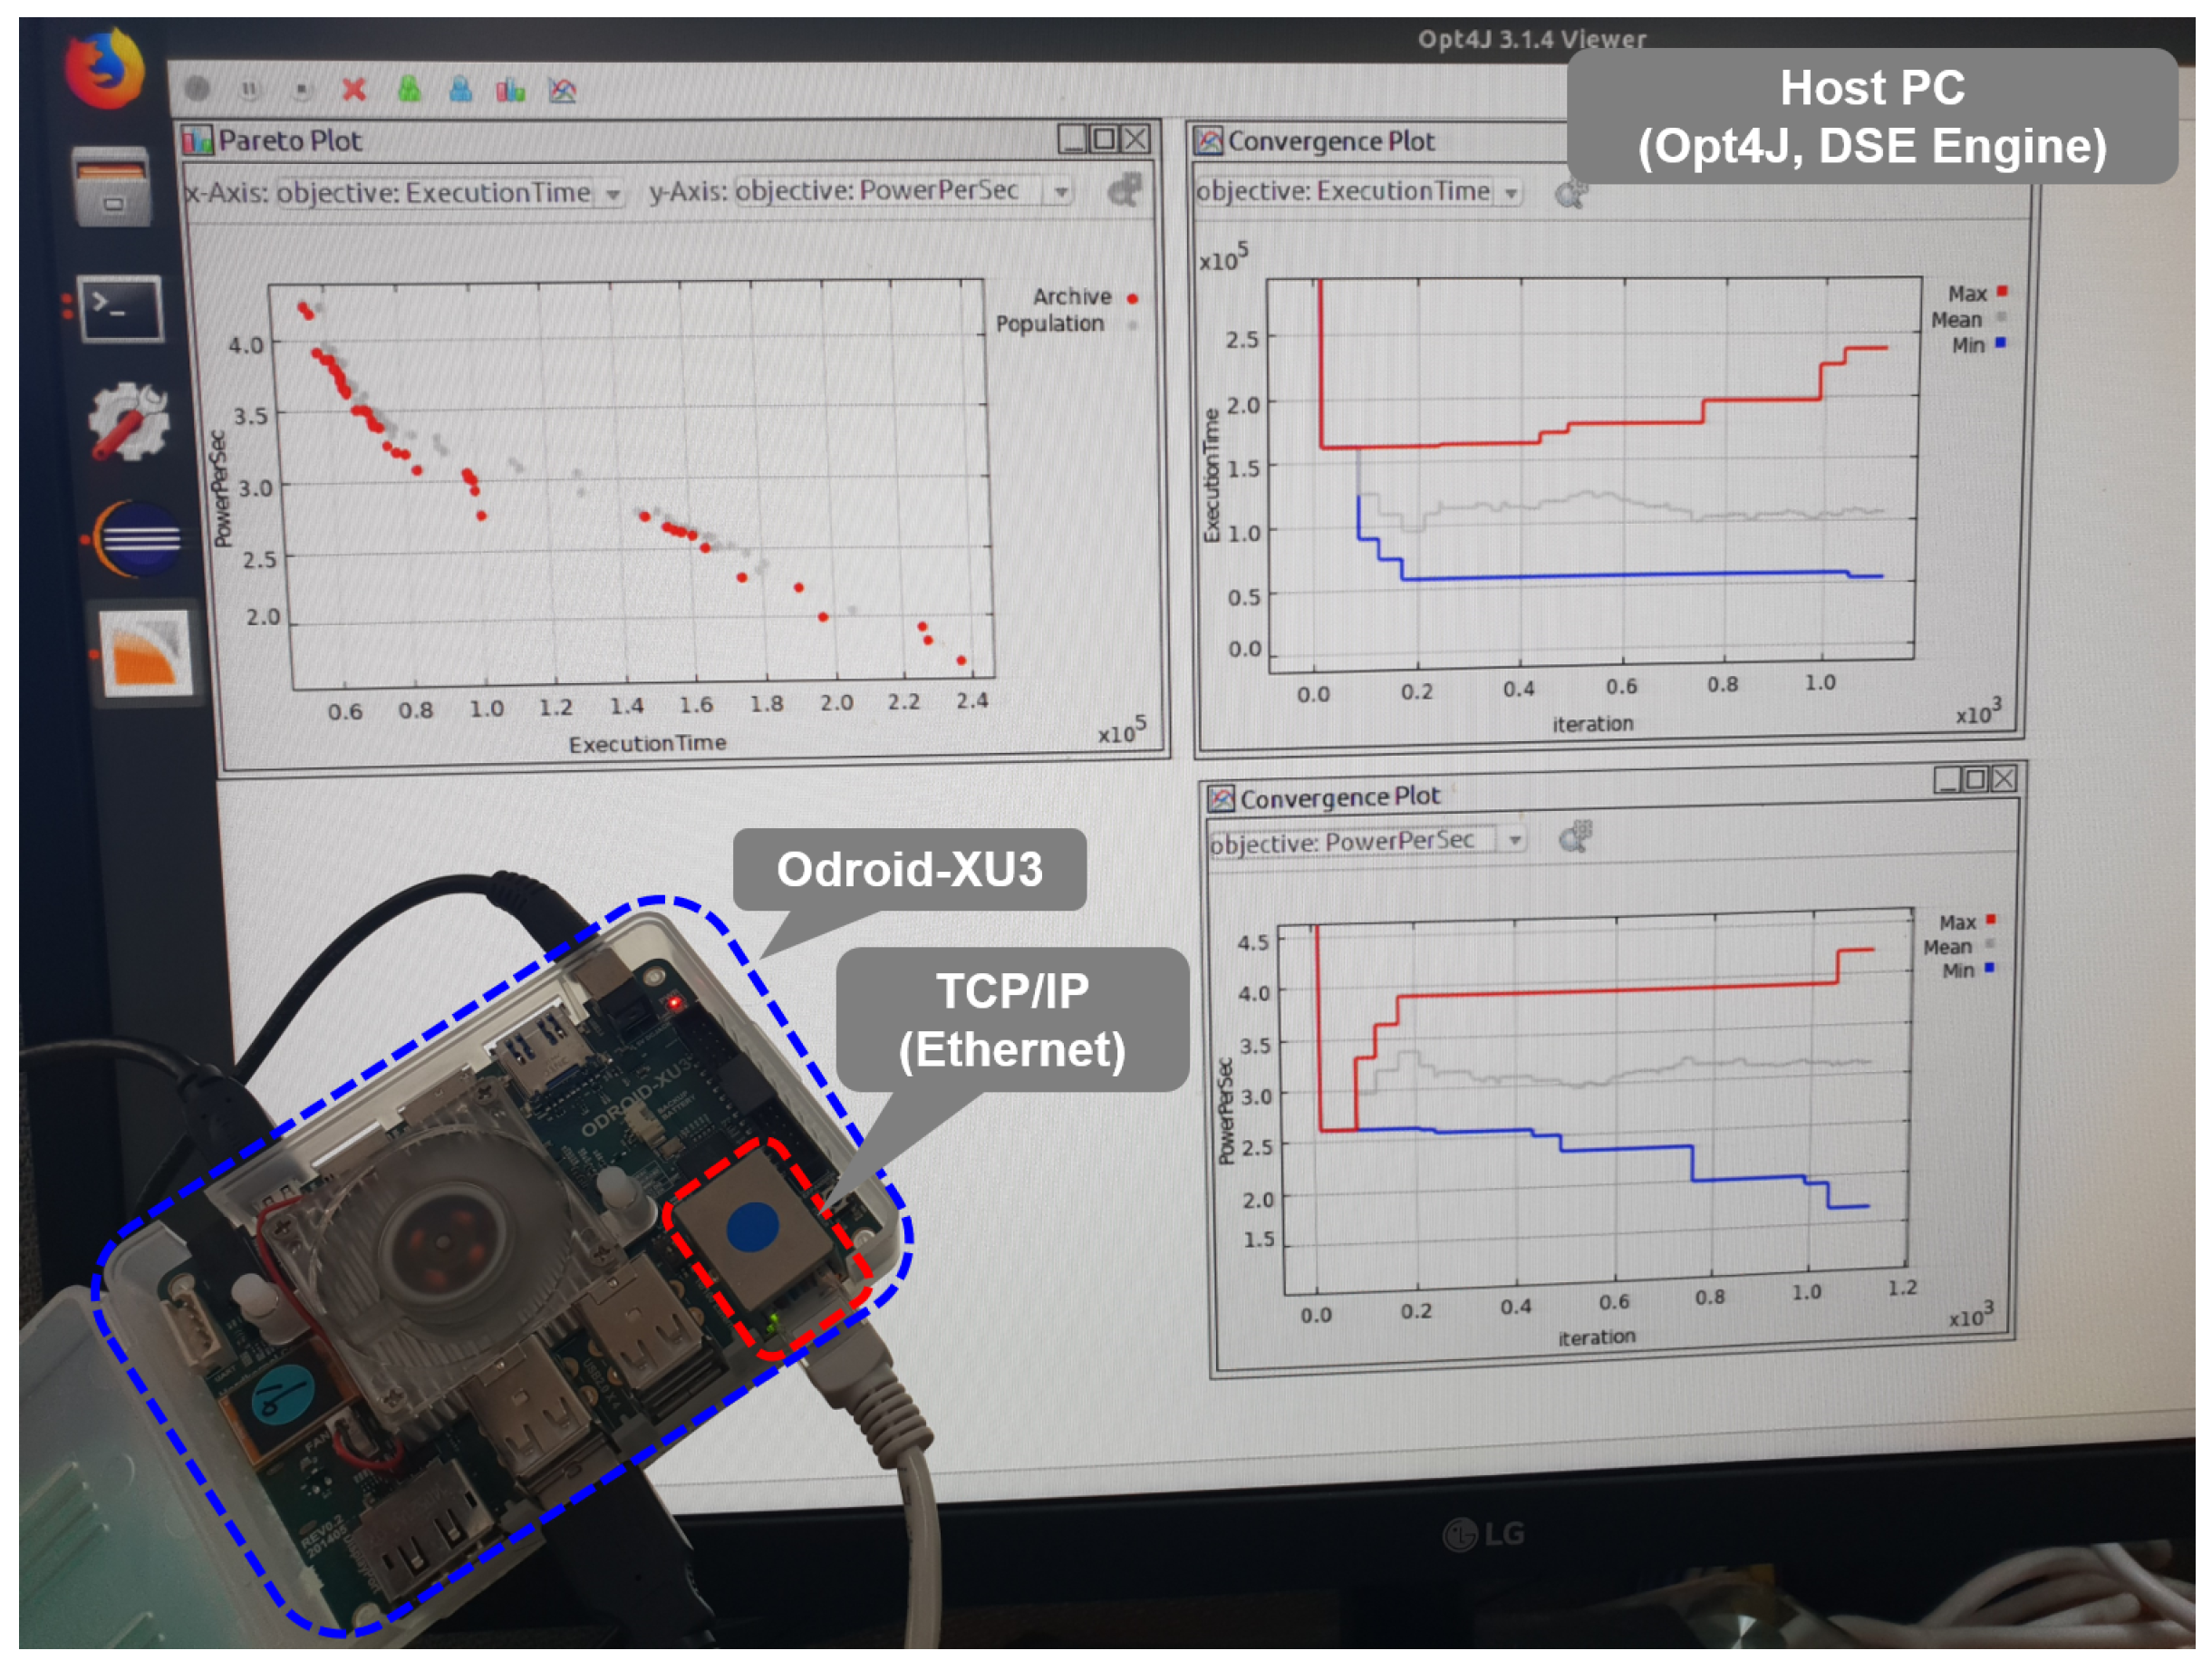
4.1. Experimental Setup

We evaluated OpenCV 3.4.1 on an embedded multicore board, Odroid-XU3 [30], which has a heterogeneous octa-core architecture with 2 GB memory that runs Ubuntu 16.04 LTS (kernel version 4.9.61). This board has a big.LITTLE architecture with four Cortex-A15 (big) and four Cortex-A7 (LITTLE) cores. The big core showed faster performance with larger power consumption, while the LITTLE one exhibited slower performance with reduced power consumption. The target board Odroid-XU3 uses clock gating, in which the operating frequencies of the big cores can be throttled when the temperature gets too high. In order to perform the evaluation within the reasonable temperatures without losing the cores dynamically, we turned off two big cores—that is, we only used two big and four LITTLE cores. The power measurement on Odroid-XU3 is enabled by its on-chip current sensor, INA231, which is integrated in the board and accessed by the developed MeasurementUnit library. It is noteworthy that such heterogeneous architectures motivate the proposed technique. In a homogeneous architecture, replicating the parallel tasks by the number of cores would not result in significantly unbalanced workloads between the cores. On the other hand, in the case that the computed capabilities of cores are heterogeneous as above, some cores may remain idle if the parallelism degree and workload partitioning do not fit well to the given architecture.
The parameters of the GA engine were set as follows. The maximum parallelism degree ( m p d ) which upper-bounds v values was set to the number of cores 6, that is, m p d = 6 , while the number of sub-image partitions was upper-bounded by 128, that is, w m a x = 128 . The number of repeated profiling, I m a x , was set to 16.
Figure 3 shows the actual experimental environment of the proposed technique. The host PC runs Opt4J, the DSE engine, and connects to the target board Odroid-XU3 via TCP/IP communication on ethernet. On the bottom-left of the Figure, it can be seen that Odroid-XU3 executes the target OpenCV application with the parallel configurations derived from the DSE engine on the host PC.

4.2. OpenCV Examples Used for Evaluation

The official OpenCV repository contains a number of examples that support various computer languages and platforms. Among them, for the purposes of evaluation, we selected two popular examples written in C++: (1) the canny edge detection application, and (2) the squeezeNet [31] application (for deep neural networks). The canny edge detection is a popular and important application that is directly used in video object segmentation and tracking [32] or robot path planning [33]. It takes 1920 × 1080 images as input, and processes them through C o n v e r t C o l o r ( ) and C a n n y ( ) . As shown in Figure 1, C o n v e r t C o l o r ( ) has one parallel task, while C a n n y ( ) has two. Thus, in total, three parallel configurations need to be optimized for the three parallel tasks. The squeezeNet application is a deep neural network module which was pre-trained through Caffe [34] using ImageNet datasets [35]. Cases of real-world use of SqueezeNet include real-time road-object segmentation [36] and semantic segmentation for autonomous driving [37]. It works with 227 × 227 input images, and there exist two parallel tasks in convolution and max-pooling, respectively. Thus, the SqueezeNet application has two parallel configuration points to be optimized.

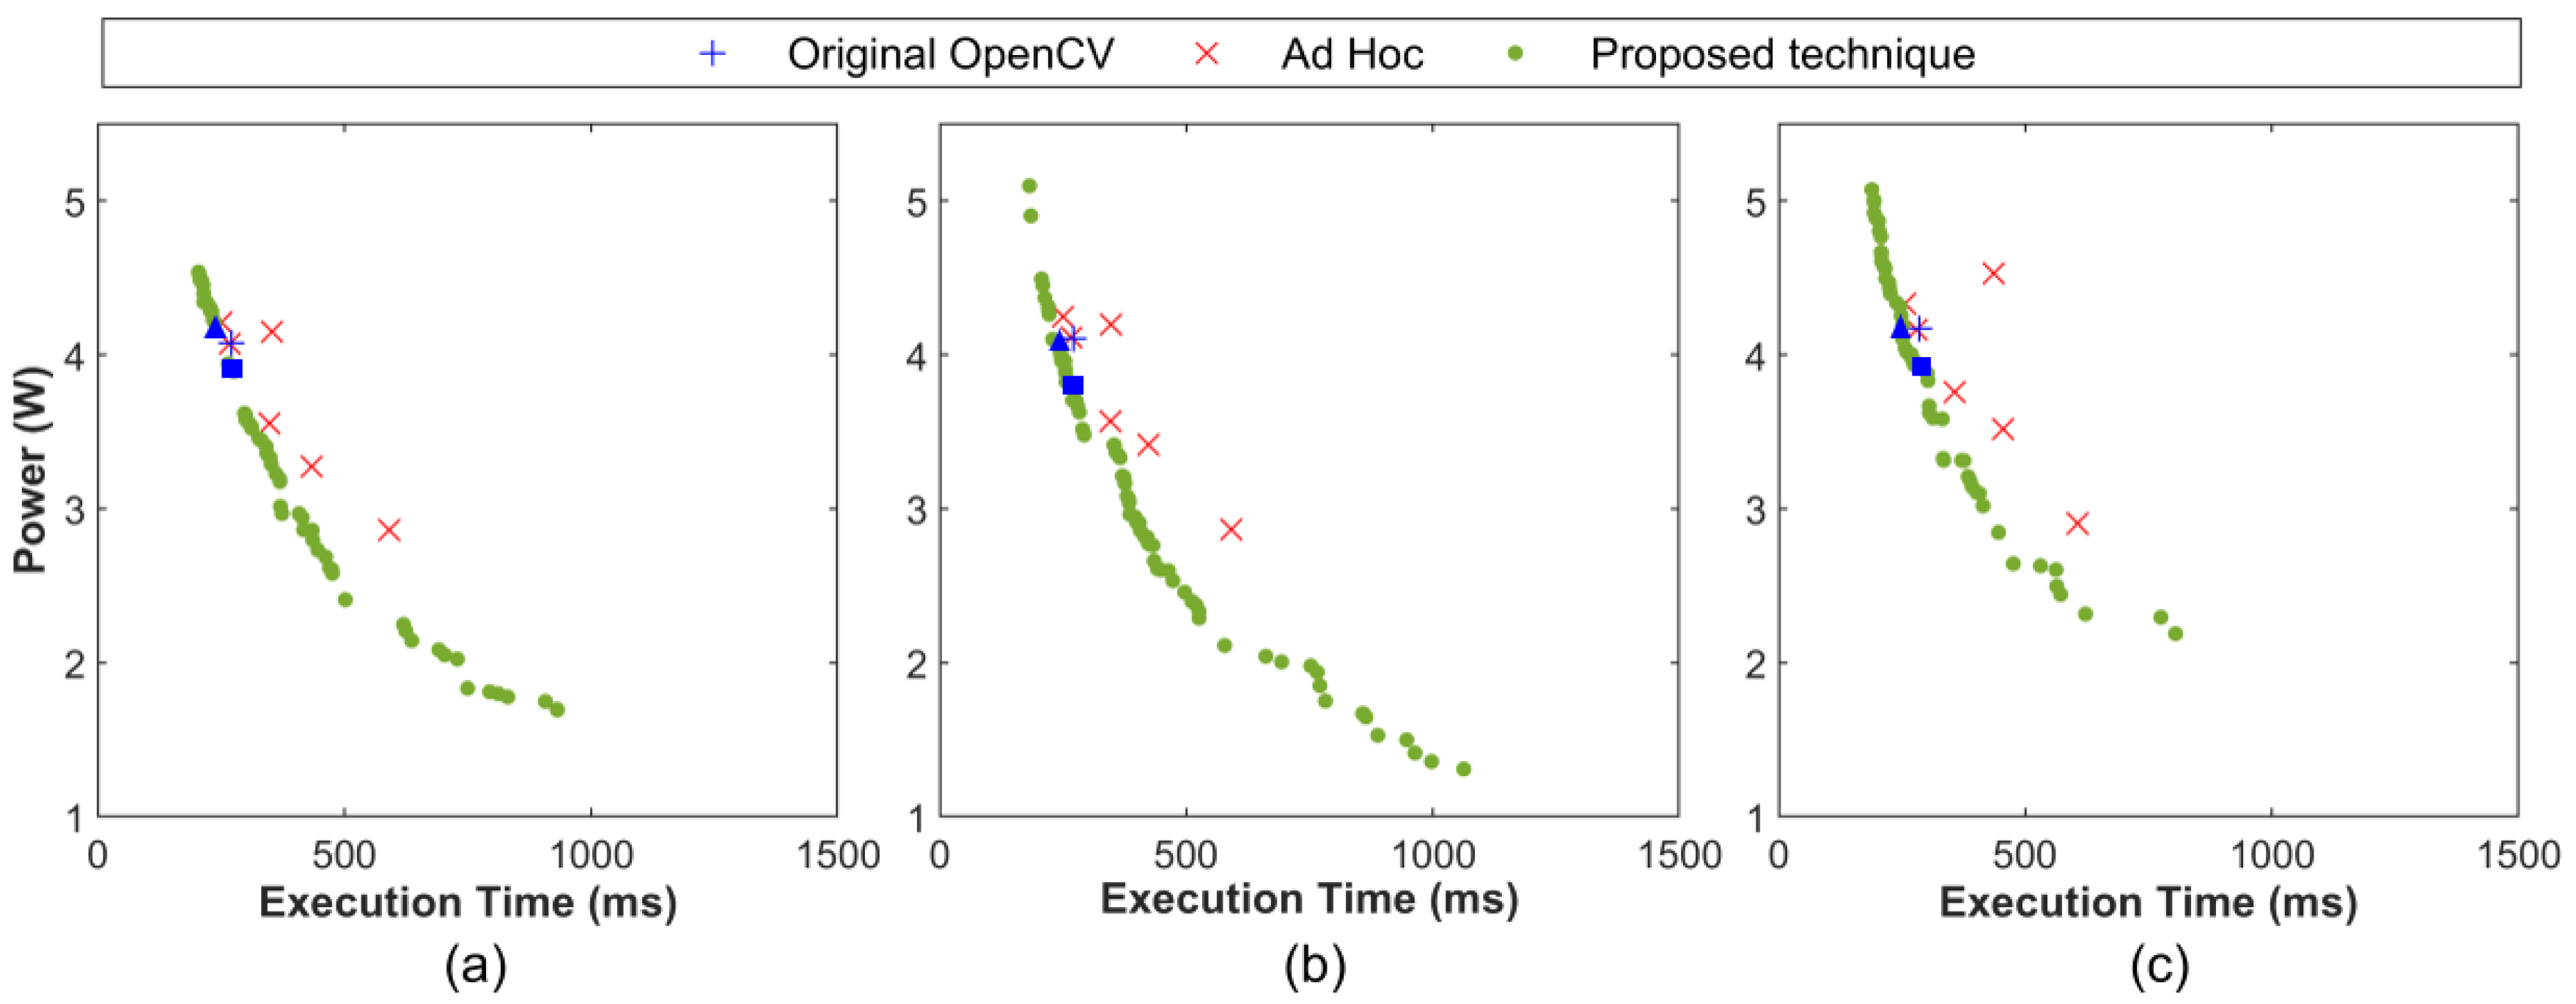
4.3. Latency-Power Co-Optimization of OpenCV Applications

We performed latency-power co-optimization for the above-mentioned OpenCV applications using the proposed technique. That is, we tried to discover parallel configurations that formed a pareto-front solution on two-dimensional co-ordinates of the two design objectives to be minimized: latency and power consumption.
The co-optimization results of the canny application are shown for the different profiling modes—mean, median, and worst—in Figure 4a–c, respectively. The original OpenCV configuration was plotted as ‘+’ as a comparison target. Note that it has a single fixed point, where the execution latency is 65.68 ms and the power consumption is 3.91 W in the mean mode, as the parallel configuration is hard-coded as follows: < v 1 = 6 , w 1 = 31 , c 1 = 1 > for C o n v e r t C o l o r ( ) , < v 2 = 6 , w 2 = 6 , c 2 = 1 > for E d g e D e t e c t i n g ( ) , and < v 3 = 6 , w 3 = 6 , c 1 = 1 > for F i n a l P a s s ( ) . In addition, six different configurations derived by the ad hoc optimization (from v = w = 1 to v = w = 6 ) (the maximum value is set to 6 as the maximum parallelism degree (mpd) is 6) were also plotted as ’X’ in the Figures. In all three modes, the original OpenCV configuration is dominated (In the multi-objective optimization, solution A is said to be dominated by B if all the objectives of A are worse than those of B) by one of the configurations derived from the ad hoc optimization.
The configurations obtained by the proposed technique are plotted as green circles in the Figures. It can easily be noticed that a broader design space exploration is enabled by the proposed technique, and a pareto-front that dominates both the original OpenCV and the ad hoc optimizations is derived. Among the derived configurations, the one with the lowest power ( 1.44 W) resulted in the latency of 254.86 ms in the mean mode. This suggests that the proposed technique could reduce the power consumption by 63.17 % at the cost of increased latency. On the other extreme, the configuration with the smallest latency ( 48.78 ms) resulted in a power consumption of 4.27 W. This proves the effectiveness of the proposed technique as a constraint-aware optimization method. If the system is to be optimized with respect to the target latency of 300 ms, for instance, we could reduce the power consumption by more than 60% from the original configuration.
Among the configurations derived from the proposed technique, the one that showed the closest latency to the original OpenCV configuration is highlighted as blue squares (■). In the mean mode, it exhibited a slightly increased latency of 65.71 ms. In this case, however, the power consumption was reduced by 12.53 % (to 3.42 W). We also made a comparison with the one with the closest power consumption, highlighted as blue triangles (▲). While its power consumption was slightly less than the original ( 3.90 W), the latency was improved by 15.16 % ( 55.72 ms). These observations confirm that the individual configurations derived by the proposed technique outperform the original configuration in terms of both latency and power consumption.
We could observe the similar tendencies from other profiling modes, as shown in Figure 4b,c. In the worst mode, the derived solution with the closest latency to the original OpenCV (■) resulted in the worst-case latency of 71.18 ms, and the worst-case power consumption of 3.41 W. In this case, the power consumption was reduced by 15.17 % at the cost of slightly increased (about 0.8 %) latency. In this case, the standard deviations of the worst-case latency and power were 2.71 and 0.15 , respectively, over the I m a x = 16 measurements. Regarding the derived solution with the closest power consumption (▲), while its power consumption was slightly more than the original one (increased from 4.02 W to 4.03 W), the latency was improved by 21.99 % (reduced from 70.57 ms to 55.05 ms). In this case, the standard deviations were 0.66 and 0.11 over the I m a x = 16 measurements. Again, the optimized configurations derived by the proposed technique outperformed the original configuration. It is noteworthy that in the worst mode, the proposed solution could not successfully derive many low-power configurations below 2 W, compared to other modes. Due to the conservative latency estimation in the worst mode, some configurations that were OK in other modes were not qualified in terms of latency.
The same latency-power co-optimization was performed for the squeezeNet application, and the results are shown in Figure 5. The original OpenCV configurations of the squeezeNet application are again shown as ’+’ marks for the three different profiling modes in Figure 5a–c. In the mean mode, the configuration was < v 1 = 6 , w 1 = 6 , c 1 = 1 > for convolution and < v 2 = 6 , w 2 = 6 , c 2 = 1 > for max-pooling, which resulted in a latency of 270.34 ms and power consumption of 4.08 W. In this case, the original OpenCV configuration was identical to one of the configurations obtained by the ad hoc optimization.
Similarly to the previous case, the proposed technique not only enabled broader design space exploration, but also showed better optimality over the latency and power consumption, as revealed by the green circles. In the mean mode, it could derive a number of configurations from the most power-efficient one (latency: 931.19 ms, power: 1.69 W) to the fastest one (latency: 204.05 ms, power: 4.53 W). In all three modes, the pareto-front curves obtained by the proposed technique dominated the configurations derived by the ad hoc optimization. Again, in the worst mode, it has been observed that the standard deviations of the worst-case latency and power are not so significant. In the closest latency solution (■), the standard deviations were 3.54 and 0.06 for latency and power, respectively over the I m a x = 16 measurements, while they were 0.88 and 0.07 in the closest power solution (▲). Similarly to the previous case, the proposed technique derived a less number of low-power configurations compared to other modes, due to the conservative latency estimation.
Lastly, we report the overheads caused by the proposed technique. We measured the latency and power consumption overheads by repeating the measurements with the optimization option enabled or disabled, that is, s e t E n a b l e ( t r u e ) or s e t E n a b l e ( f a l s e ) . Throughout the entire experiment set, the worst-case latency and power overheads were 1.22 % and 0.41 %, respectively, which we believe were insignificant. Furthermore, once a single optimal configuration is fixed for a certain system, it is possible to hard-code the obtained parameters in the OpenCV source codes without using the developed library.

5. Conclusions and Future Work

We herein proposed a latency-power co-optimization of OpenCV applications in a heterogeneous multicore processor. The existing model-based multi-core optimization techniques are not suitable for this problem since it is not easy to capture the behavior of OpenCV applications in formal models. Alternatively, we proposed taking a measurement-based optimization approach that requires no modeling efforts for the application and system. The proposed technique consists of two parts: optimization and measurement. For the optimization part, a GA-based optimization engine was executed on a separate host PC. The evaluations of the candidate configurations considered in the optimization part were performed in the target board by actually measuring the power and latency. Two popular OpenCV applications, canny edge detection and squeezeNet, were also optimized using the proposed technique as a case-study. The existing approaches, including the original OpenCV configuration, spawn threads as many as the number of cores and distribute the workload uniformly over the cores without considering the heterogeneous multi-core architecture. Compared with these existing methods, the proposed technique has been proven to be effective in finding a number of optimal solutions for various latency or power requirements.
Although the proposed approach has been verified only with two OpenCV applications on a single heterogeneous multi-core architecture in this paper, it is generally applicable to any system where performance or power measurements and TCP/IP communications are available. Regarding the application, the proposed technique is generally effective for any algorithm with fork–join data parallelism. As future work, we plan to generalize the proposed technique both in target applications and architecture. On one hand, it can be extended to consider other kinds of parallelisms, such as task or pipeline parallelisms; and on the other hand, it is also necessary to enhance the optimization engine to consider other parallel architectures, such as GPGPU. Both extensions require redefinitions of the genotype structure, tailored to the parallelism characterization or the workload hierarchy of the GPGPU programming framework, such as thread and thread block in CUDA.

Author Contributions

Conceptualization, H.Y., H.J. and K.K.; methodology, H.Y., H.J. and K.K.; software, H.J. and K.K.; validation, H.J.; investigation, H.Y., H.J. and K.K.; writing—original draft preparation, H.Y., H.J. and K.K.; writing—review and editing, H.Y. and H.J.; supervision, H.Y.; project administration, H.Y.; funding acquisition, H.Y.

Funding

This research was supported by the MSIT (Ministry of Science and ICT), Korea, under the ITRC (Information Technology Research Center) support program (IITP-2019-2018-0-01424) supervised by the IITP (Institute for Information & communications Technology Promotion), and by the National Research Foundation of Korea (NRF) grant funded by the Korea government (MSIT) (No. 2019R1F1A1064209).

Conflicts of Interest

The authors declare no conflict of interest.

References

  1. Ohya, I.; Kosaka, A.; Kak, A. Vision-based navigation by a mobile robot with obstacle avoidance using single-camera vision and ultrasonic sensing. IEEE Trans. Robot. Autom. 1998, 14, 969–978. [Google Scholar] [CrossRef]
  2. Omidyeganeh, M.; Shirmohammadi, S.; Abtahi, S.; Khurshid, A.; Farhan, M.; Scharcanski, J.; Hariri, B.; Laroche, D.; Martel, L. Yawning detection using embedded smart cameras. IEEE Trans. Instrum. Meas. 2016, 65, 570–582. [Google Scholar] [CrossRef]
  3. Giusti, A.; Guzzi, J.; Cireşan, D.C.; He, F.L.; Rodríguez, J.P.; Fontana, F.; Faessler, M.; Forster, C.; Schmidhuber, J.; Di Caro, G.; et al. A machine learning approach to visual perception of forest trails for mobile robots. IEEE Robot. Autom. Lett. 2015, 1, 661–667. [Google Scholar] [CrossRef] [Green Version]
  4. Soyata, T.; Muraleedharan, R.; Funai, C.; Kwon, M.; Heinzelman, W. Cloud-vision: Real-time face recognition using a mobile-cloudlet-cloud acceleration architecture. In Proceedings of the 2012 IEEE Symposium on Computers and Communications (ISCC), Cappadocia, Turkey, 1–4 July 2012; pp. 59–66. [Google Scholar]
  5. Levy, M.; Conte, T.M. Embedded multicore processors and systems. IEEE Micro 2009, 29, 7–9. [Google Scholar] [CrossRef]
  6. Singh, A.K.; Shafique, M.; Kumar, A.; Henkel, J. Mapping on multi/many-core systems: survey of current and emerging trends. In Proceedings of the 2013 50th ACM/EDAC/IEEE Design Automation Conference (DAC), Austin, TX, USA, 29 May–7 June 2013; pp. 1–10. [Google Scholar]
  7. Bhattacharyya, S.S.; Murthy, P.K.; Lee, E.A. Synthesis of embedded software from synchronous dataflow specifications. J. VLSI Signal Proces. Syst. Signal Image Video Technol. 1999, 21, 151–166. [Google Scholar] [CrossRef]
  8. Stefanov, T.; Zissulescu, C.; Turjan, A.; Kienhuis, B.; Deprettere, E. System design using Kahn process networks: the Compaan/Laura approach. In Proceedings of the Conference on Design, Sutomation and Test in Europe-Volume 1, Paris, France, 16–20 February 2004; IEEE Computer Society: Washington, DC, USA; p. 10340. [Google Scholar]
  9. Bradski, G. The OpenCV Library. Dr. Dobbs J. Softw. Tools 2000, 120, 122–125. [Google Scholar]
  10. Ng, T.E.; Chu, Y.H.; Rao, S.G.; Sripanidkulchai, K.; Zhang, H. Measurement-based optimization techniques for bandwidth-demanding peer-to-peer systems. In Proceedings of the IEEE INFOCOM 2003. Twenty-second Annual Joint Conference of the IEEE Computer and Communications Societies (IEEE Cat. No. 03CH37428), San Francisco, CA, USA, 30 March–3 April 2003; Volume 3, pp. 2199–2209. [Google Scholar]
  11. Rapita Systems Ltd. RapiTime. Available online: http://www.rapitasystems.com (accessed on 30 July 2019).
  12. Anuar, A.; Saipullah, K.M.; Ismail, N.A.; Soo, Y. OpenCV based real-time video processing using android smartphone. Int. J. Comput. Technol. Electron. Eng. (IJCTEE) 2011, 1, 58–63. [Google Scholar]
  13. Gurav, R.M.; Kadbe, P.K. Real time finger tracking and contour detection for gesture recognition using OpenCV. In Proceedings of the 2015 International Conference on Industrial Instrumentation and Control (ICIC), Pune, India, 28–30 May 2015; pp. 974–977. [Google Scholar]
  14. Li, D.; Liang, B.; Zhang, W. Real-time moving vehicle detection, tracking, and counting system implemented with OpenCV. In Proceedings of the 2014 4th IEEE International Conference on Information Science and Technology, Shenzhen, China, 26–28 April 2014; pp. 631–634. [Google Scholar]
  15. Pulli, K.; Baksheev, A.; Kornyakov, K.; Eruhimov, V. Real-time computer vision with OpenCV. Commun. ACM 2012, 55, 61–69. [Google Scholar] [CrossRef]
  16. Sung, H.W.; Chang, Y.M.; Wang, S.C.; Lee, J.K. OpenCV Optimization on Heterogeneous Multi-core Systems for Gesture Recognition Applications. In Proceedings of the 2016 45th International Conference on Parallel Processing Workshops (ICPPW), Philadelphia, PA, USA, 16–19 August 2016; pp. 59–65. [Google Scholar]
  17. Coombs, J.; Prabhu, R. OpenCV on TI’s DSP+ ARM® platforms: Mitigating the challenges of porting OpenCV to embedded platforms. Texas Instrum. 2011. Available online: https://www.embedded-vision.com/platinum-members/texas-instruments/embedded-vision-training/documents/pages/opencv-ti%E2%80%99s-dsparm%C2%AE-plat (accessed on 6 December 2019).
  18. Monson, J.; Wirthlin, M.; Hutchings, B.L. Implementing high-performance, low-power FPGA-based optical flow accelerators in C. In Proceedings of the 2013 IEEE 24th International Conference on Application-Specific Systems, Architectures and Processors, Washington, DC, USA, 5–7 June 2013; pp. 363–369. [Google Scholar]
  19. Pheatt, C. Intel® Threading Building Blocks. J. Comput. Sci. Coll. 2008, 23, 298. [Google Scholar]
  20. Dagum, L.; Menon, R. OpenMP: An Industry-Standard API for Shared-Memory Programming. IEEE Comput. Sci. Eng. 1998, 5, 46–55. [Google Scholar] [CrossRef] [Green Version]
  21. Martorell, X.; Ayguadé, E.; Navarro, N.; Corbalán, J.; González, M.; Labarta, J. Thread fork/join techniques for multi-level parallelism exploitation in NUMA multiprocessors. In Proceedings of the 13th International Conference on Supercomputing, Rhodes, Greece, 20–25 June 1999; Volume 20, pp. 294–301. [Google Scholar]
  22. Amer, A.; Maruyama, N.; Pericàs, M.; Taura, K.; Yokota, R.; Matsuoka, S. Fork-join and data-driven execution models on multi-core architectures: Case study of the FMM. In Proceedings of the 2013 28th International Supercomputing Conference, Berlin, Germany, 16–20 June 2013; pp. 255–266. [Google Scholar]
  23. Shafer, J.; Rixner, S.; Cox, A.L. The hadoop distributed filesystem: Balancing portability and performance. In Proceedings of the 2010 IEEE International Symposium on Performance Analysis of Systems & Software (ISPASS 2010), White Plains, NY, USA, 28–30 March 2010; pp. 122–133. [Google Scholar]
  24. Hornby, G.; Globus, A.; Linden, D.; Lohn, J. Automated antenna design with evolutionary algorithms. In Proceedings of the Space 2006, San Jose, CA, USA, 19–21 September 2006; p. 7242. [Google Scholar]
  25. Nakaya, S.; Koide, T.; Wakabayashi, S. An adaptive genetic algorithm for VLSI floorplanning based on sequence-pair. In Proceedings of the 2000 IEEE International Symposium on Circuits and Systems. Emerging Technologies for the 21st Century. Proceedings (IEEE Cat No. 00CH36353), Geneva, Switzerland, 28–31 May 2000; Volume 3, pp. 65–68. [Google Scholar]
  26. Zitzler, E.; Laumanns, M.; Thiele, L. SPEA2: Improving the strength Pareto evolutionary algorithm. TIK-Rep. 2001, 103. [Google Scholar] [CrossRef]
  27. Deb, K.; Pratap, A.; Agarwal, S.; Meyarivan, T. A fast and elitist multiobjective genetic algorithm: NSGA-II. IEEE Trans. Evol. Comput. 2002, 6, 182–197. [Google Scholar] [CrossRef] [Green Version]
  28. Kang, S.H.; Yang, H.; Schor, L.; Bacivarov, I.; Ha, S.; Thiele, L. Multi-objective mapping optimization via problem decomposition for many-core systems. In Proceedings of the 2012 IEEE 10th Symposium on Embedded Systems for Real-Rime Multimedia, Tampere, Finland, 11–12 October 2012; pp. 28–37. [Google Scholar]
  29. Lukasiewycz, M.; Glaß, M.; Reimann, F.; Teich, J. Opt4J—A Modular Framework for Meta-heuristic Optimization. In Proceedings of the Genetic and Evolutionary Computing Conference (GECCO 2011), Dublin, Ireland, 12–16 July 2011; pp. 1723–1730. [Google Scholar]
  30. Hardkernel. Odroid-XU3. Available online: https://www.hardkernel.com/shop/odroid-xu3 (accessed on 30 July 2019).
  31. Iandola, F.N.; Han, S.; Moskewicz, M.W.; Ashraf, K.; Dally, W.J.; Keutzer, K. SqueezeNet: AlexNet-level accuracy with 50× fewer parameters and <0.5 MB model size. arXiv 2016, arXiv:1602.07360. [Google Scholar]
  32. Kim, C.; Hwang, J.N. Fast and automatic video object segmentation and tracking for content-based applications. IEEE Trans. Circuits Syst. Video Technol. 2002, 12, 122–129. [Google Scholar]
  33. Al-Jarrah, R.; Al-Jarrah, M.; Roth, H. A novel edge detection algorithm for mobile robot path planning. J. Robot. 2018, 2018, 1–12. [Google Scholar] [CrossRef] [Green Version]
  34. Jia, Y.; Shelhamer, E.; Donahue, J.; Karayev, S.; Long, J.; Girshick, R.; Guadarrama, S.; Darrell, T. Caffe: Convolutional Architecture for Fast Feature Embedding. arXiv 2014, arXiv:1408.5093. [Google Scholar]
  35. Deng, J.; Dong, W.; Socher, R.; Li, L.J.; Li, K.; Fei-Fei, L. ImageNet: A Large-Scale Hierarchical Image Database. In Proceedings of the 2009 IEEE Conference on Computer Vision and Pattern Recognition CVPR09, Miami Beach, FL, USA, 20–25 June 2009; pp. 248–255. [Google Scholar]
  36. Wu, B.; Wan, A.; Yue, X.; Keutzer, K. Squeezeseg: Convolutional neural nets with recurrent crf for real-time road-object segmentation from 3d lidar point cloud. In Proceedings of the 2018 IEEE International Conference on Robotics and Automation (ICRA), Brisbane, Australia, 21–26 May 2018; pp. 1887–1893. [Google Scholar]
  37. Treml, M.; Arjona-Medina, J.; Unterthiner, T.; Durgesh, R.; Friedmann, F.; Schuberth, P.; Mayr, A.; Heusel, M.; Hofmarcher, M.; Widrich, M.; et al. Speeding up semantic segmentation for autonomous driving. In Proceedings of the MLLITS, NIPS Workshop, Barcelona, Spain, 5–10 December 2016. [Google Scholar]
Figure 1. Example for performing a canny edge detection application.
Symmetry 11 01488 g001
Figure 2. Overview of the proposed technique.
Symmetry 11 01488 g002
Figure 3. Configuration of the actual experimental environment of the proposed technique.
Symmetry 11 01488 g003
Figure 4. Power consumption and latency measurements of the canny edge detection algorithm for three different profiling modes: (a) mean, (b) median, and (c) worst.
Symmetry 11 01488 g004
Figure 5. Power consumption and latency measurements of the squeezeNet application for three different profiling modes: (a) mean, (b) median, and (c) worst.
Symmetry 11 01488 g005
Table 1. Summary of APIs developed in the proposed technique.
API TypesAPI NamesFunctionalities
TransmissionManagersend()Transfer power and execution time to the host PC
receive()Receive P and m o d e from the host PC
ParallelConfigurationsetEnable()Turn on or off the measurement mode for openCV
getEnable()Check if the measurement mode is on or not
set()Apply the configuration of P to the target parallel function
MeasurementUnitstart()/stop()Set the starting and end point of the measurement
getProfiling()Obtain the measured power consumption and execution time
getProfilingStatistics()Obtain the statistics value for the given m o d e value

