Article

Using Stochastic Decision Networks to Assess Costs and Completion Times of Refurbishment Work in Construction

by
Grzegorz Śladowski
*,
Bartłomiej Szewczyk
,
Bartłomiej Sroka
and
Elżbieta Radziszewska-Zielina
Faculty of Civil Engineering, Institute of Construction Management, Cracow University of Technology, 31-155 Cracow, Poland
*
Author to whom correspondence should be addressed.
Symmetry 2019, 11(3), 398; https://doi.org/10.3390/sym11030398
Submission received: 5 March 2019 / Revised: 13 March 2019 / Accepted: 14 March 2019 / Published: 19 March 2019

Abstract

:
According to the concept of sustainable development, the process of extending the life-cycle of existing buildings (including historical ones) through their restoration not only generates benefits from their layer use but also—and primarily—constitutes a chance for their substance to survive for use by future generations. Building restoration projects are usually difficult to plan, primarily due to the limited amount of information on the technical condition of existing structures and their historical substance, which often makes the scope of renovation works difficult to determine. At the stage of planning such a project, it is, therefore, reasonable to consider various scenarios of its implementation, the occurrence of which can be both random and can be generated by the decision-maker. Unfortunately, in practice, the right tools for planning such projects are not used, which in effect generates problems associated with underestimating their completion time and costs. In subject literature, there are proposals of the use of stochastic and decision networks to assess the course of various projects that are characterised by having indeterminate structures. However, these networks are limited to modelling tasks that either occur purely randomly or are fully generated by decision-makers. There are no studies that enable the modelling and optimisation of the structure of a project while taking into consideration both the random and decision-based nature of carrying it out. In the article, the authors proposed a stochastic decision network that enables the correct modelling of projects with a multi-variant structure of being carried out. For the purpose of analysing the network model, elements of mathematical programming were used to determine optimal decisions (in terms of expected costs and completion times of carrying out a project) that control the structure of the project being modelled. The entirety of the authors’ proposal was backed by a calculation experiment on an example of a refurbishment construction project, which confirmed the application potential of the proposed approach.

1. Introduction

One of the missions of contemporary civilisation is the protection of cultural heritage by preventing the decay of its elements, the appropriate conservation, development and propagation of its values. Historical structures are an essential element of historical heritage and in the reality of today can only survive if they are considered to fulfil some useful function by society [1,2]. In the Treaty of Lisbon [3], we can find numerous references to the subject of the relationship between the concept of sustainable development and historical heritage. The preservation of a historical structure and restoring its utilitarian value is associated with the process of its restoration. The character and scope of restoration work primarily depends on its type of architectural and structural system, the state of the preservation of its historical substance, the technical condition of the building, including the quality of its physical and chemical properties and the mechanisms of the materials used in its construction, as well as the suitability of these materials for reuse in the existing structure.
Determining the estimated values of the time and cost of restoring a historical structure is a specific process that is difficult to carry out due to the following factors:
  • The complicated course of design work and the unpredictable process of obtaining legal opinions and approvals of proposed refurbishment solutions, the lack of approval of design solutions by architectural conservation authorities.
  • Difficulty in determining the scope of work (a high probability of additional or replacement types of work) due to the limited identification of the structure of an existing building, e.g., the technical condition of foundations uncovered while performing construction work can require different forms of reinforcing them.
  • In the case of historical buildings, it is possible that discoveries will be made during construction work, resulting in additional archaeological digs, as well as more construction and conservation work [4], e.g., the replacement of existing plasters on a historical structure can result in the discovery of polychromes underneath.
The above-mentioned problems cause attempts at estimating the time and cost of carrying out such projects to be affected by a high level of imprecision. An analysis of the results of surveys that had been conducted among developers, designers and contractors from Poland, Lithuania and Slovakia who possess experience in such projects confirmed the occurrence of the problem of the low accuracy of assessments of the costs of project completion [5]. The respondents highlighted the necessity of including the possibility of performing additional and replacement works as a part of the plan in cost assessments, which will, in turn, reduce the deviation of the actual expenditure incurred from their planned volumes [5]. Therefore, it became necessary to develop an appropriate planning approach to the initial (e.g., at the stage of the restoration work feasibility study) assessment of the costs of such projects, in which different scenarios of carrying them out will be taken into account.
So-called task networks are some of the typically used tools in the planning and controlling of projects. These networks are based on graphs and are a form of the graphical representation of a project’s plan, with a defined structure of dependencies between project tasks. Regardless of the type of these networks, it is possible to distinguish elements common to them, such as tasks, events, dependencies between tasks, as well as parameters (time, cost and other types of parameters) characteristic of the projects modelled using these networks.
One of the criteria of the classification of task networks is the division based on their logical structure, which can either be determinate or non-determinate. Networks with a determinate structure (so-called deterministic networks) are suitable only for modelling one scenario of the carrying out of a planned project, for which tasks and the technological and organisational relations between them are clearly defined.
Many methods of the analysis of task networks with a non-determinate logical structure were published in subject literature, with the most well-known methods being: CPM (Critical Path Method) and its probabilistic version, PERT (Program Evaluation and Review Technique). Both methods were initially developed and are still being expanded by [6,7,8,9,10]. However, the determinate logical structure of such networks, enabling only the modelling of one scenario of the carrying out of a planned project, is not suitable for the planning and assessment of the results of the projects being discussed in the article—the restoration of buildings—the planning of which should take into consideration alternative scenarios of carrying them out. Experience has shown that using traditional networks with a determinate logical structure to model these highly specific construction projects is a planning error, which means that these projects are often overestimated or underestimated in relation to their actual costs and completion times [11].
Networks with a non-determinate logical structure are the appropriate tool for planning such projects because their structure makes it possible to take into consideration variations in the tasks being performed during the carrying out of a project. If the variants of a planned project are carried out randomly, then the network describing such a process will be called a stochastic network. If, however, the carrying out of the aforementioned variants of the planned project is a result of the decision-maker’s preferences, the network describing such a process will be called a decision network. In the following sections, the authors of this article have provided a brief characteristic of alternative-stochastic and alternative-decision networks, in order to later propose an innovative approach integrating the capabilities of both networks for planning such highly specific projects like the restoration of buildings.

1.1. Stochastic Networks—Literature Review

Eisner [12] first proposed the concept of the network planning of projects with a non-determinate, random structure, by developing the GAN convention (Generalized Activity Network) with a vertex topology which enabled the generation of variant dependencies in the structure of a network. Pritsker [13] developed the GERT (Graphical Evaluation and Review Technique) method that was later further developed by Whitehouse [14], along with its simulation variant, GERTS (Graphical Evaluation and Review Technique Simulation). Both approaches have become the basic methods of analysing stochastic networks with deterministic or probabilistic parameters. It is worth mentioning that the analysis of stochastic networks is still being developed mainly in the context of introducing fuzzy data into the model [11,15,16,17,18,19], based on fuzzy logic presented by Zadeh [20].
In subject literature, we can find examples of using stochastic networks to manage supply chains [21] for business process modelling [22], for planning aircraft production processes [23] and for the analysis of parallel processes of creating new products [24].
In the field of construction projects, Kosecki [25] provided examples of the use of stochastic networks to plan the refurbishment of historical buildings, Hougui [26] carried out an analysis of the process of building a hydroelectric power plant, Pena-Mora and Li [27] applied a stochastic network to the dynamic planning and control of the design and construction of building structures, Gao et al. [28] used them to develop a risk management plan for preparatory stages of large construction projects while Wang et al. [29] used such an approach for quality management in the construction of a concrete dam. Radziszewszka-Zielina et al. [11] used a fuzzy stochastic network (the time, cost and task completion probability parameters are type-2 fuzzy sets) for planning refurbishment works on road surfaces and the reconstruction of a historical retaining wall.

1.2. Decision Networks—Literature Review

Ignasiak [30], who first developed decision networks, introduced a definition of the structure of such a network that allowed the modelling of variants of a planned project and the selection (in an algorhythmic manner based on discrete programming) of the optimal variant within the adopted criterion of minimising the costs of the carrying out of said project. Śladowski [31] extended the structure of the above-mentioned network through additional logical forms of vertices, which enabled a more flexible approach to modelling the network dependencies of the planned project. In addition, the abovementioned work presents a practical example of the use of these networks in the analysis of technological and organisational variants of the construction of reinforced concrete foundations of a building.
The DCPM (Decision Critical Path Method), which was developed independently of the methods mentioned above, extended the basic method of network analysis, namely CPM, and enabled time and cost analysis by reducing networks with a non-determinate structure through the addition of so-called decision vertices. The DCPM method is still being developed by Zhang et al. [32] and Zhang et al. [33]. Recently, Ibadov [34], Ibadov and Kulejewski [35], proposed a network model with a fuzzy decision node for planning construction projects that feature the analysis of uncertain parameters.

1.3. Research Aims

The networks described above enable the modelling of variants of a planned project, which is generated in either a random or decision-based manner. However, it should be highlighted that the implementation of the considered scenarios of the carrying out of projects like the restoration of buildings can have a character that is both random and decision-based. Therefore, the use of stochastic networks to model such projects, in which alternative tasks in a network are treated only as random events, proves to be a rather limited approach. In subject literature one can find proposals (Więckowski [36]) of a generalized NNM (Numerical Network Modelling) network model of construction projects in which, in addition to variants of tasks carried out in a random manner, the author introduces vertices to the network, which he called decision vertices. However, this concept is associated with the defining of additional constraints in the structure of the network, which, as a consequence, has nothing to do with the decision-based nature of the implementation of the modelled variants of the carrying out of planned construction projects. Therefore, what is needed is a tool that will combine the stochastic and decision-based nature of such projects in order to properly model and optimise their plan in terms of the expected costs needed for carrying them out.
The purpose of this article is to develop:
  • An innovative approach to planning the restoration of buildings, allowing for the consideration of various completion scenarios, the occurrence of which can be both random and decision-based. The following will be required for this goal to be achieved:
    • Defining the stochastic-decision structure of the network model containing an appropriate topology of vertices with deterministic, stochastic and decision emitters (as a directed, non-cyclical graph, with one initial vertex and numerous final end vertices).
    • Developing a nonlinear one-and multi-criteria binary programming model for the purpose of optimising (in the time-cost aspect) various scenarios of the carrying out of the project that is being modelled by the network.
    • As a result, the decision-maker, by specifying their preferences as to the planned result of a project and their risk aversion, will receive an optimal (in terms of expected time and costs) scenario of carrying out their project. In the case of a multi-criteria analysis (time and cost), the decision-maker will also be able to specify different values of weights for the expected time and cost of the planned project in the goal function. As a part of the results, the decision-maker will also obtain information on the type of technical solutions or the manner of carrying out the work that should be included in the plan of the optimal scenario of carrying out the project.
  • Developing a digital application of the approach and performing a calculation experiment within which the effectiveness of the stochastic decision network will be demonstrated in relation to the traditional approach.

2. Method

A verbal description of the process that is a building’s restoration project can be transformed into a description made by using a stochastic decision network, the structure of which will enable the modelling and analysis of various scenarios of the planned project.

2.1. Definition of the Structure of a Stochastic Decision Network

The given graph G = [ Y , U , P ] is directed, where: Y is any finite set of elements, U is a non-empty two-unit relationship U Y × Y , | Y | 2 specifies the cardinality of set Y and P is a definite function on set U that takes on values 0 < p i j 1 . Elements y Y will be called vertices while y i , y j U where i j will be called ordered pairs (the arcs of the graph). The graph G fulfills the following conditions: it is consistent, acyclic and there is exactly one starting vertex and at least one endpoint vertex in the graph. Vertex y Y in this network represents an event and, on the one hand, determines the achievement of a certain state or a goal achieved by specific subsets of actions symbolised by arcs y i , y j U , while on the other it conditions completion for other definite subsets of arcs. Based on the above definition, vertices are divided into two groups:
  • Receivers, defining the conditions for achieving a given state (receiver activation);
  • Emitters, specifying the conditions for the carrying out of specific arcs that originate from it (Table 1).
The non-determinate logical structure of the considered stochastic decision network contains certain possible structures (possible sub-networks) that represent the scenarios of the carrying out of the process that is being modelled. A possible structure (possible sub-network) in a stochastic decision network is a sub-network based on a directed graph G = [ Y , U , P ] , where, Y Y ,   U U are non-empty, and must meet the following conditions: it is consistent and acyclic. The starting point of the graph G = [ Y , U , P ] of a stochastic decision network is also the starting point of the graph G = [ Y , U , P ] , Graph G = [ Y , U , P ] , contains at least one endpoint belonging to the G = [ Y , U , P ] graph of the stochastic decision network. If a node with a deterministic or stochastic emitter in the G = [ Y , U , P ] graph of a stochastic decision network belongs to graph G = [ Y , U , P ] , then all of the direct successors of this vertex belong to it as well. If the vertex with the decision emitter in graph G = [ Y , U , P ] of the stochastic decision network belongs to graph G = [ Y , U , P ] , then one and only one of the direct successors of each of these vertices belongs to it as well. Therefore, any possible structure (possible sub-network) of a stochastic decision network can be determined by means of a vector characterized in the following manner:
{ λ i j } ,   where   λ i j = { 0   d l a   y i , y j U 1   d l a   y i , y j U

2.2. Optimisation Model

The possible structures defined above (possible sub-networks) constitute a set of possible scenarios of the carrying out of the project that is being modelled by the network.
In order to choose the best variant of carrying out the project in terms of time and cost, the authors proposed binary programming optimisation models making it possible to determine:
  • The shortest expected completion time of the scenario of the planned project;
  • The lowest expected cost of the carrying out of the scenario of the planned project;
  • The shortest completion time and lowest cost of the carrying out of the scenario of the planned project.
Based on the obtained results, the decision-maker, based on their risk aversion, may select decisions that specify the final choice of the possible structure of the planned project. In the case of multi-criteria (time and cost) analysis, in addition to risk aversion, the decision-maker may determine weights for the expected time and costs of the completion of the planned project.
Below is a mathematical presentation of the abovementioned optimisation models.
Symbols concerning network structure:
  • s —starting vertex, s Y
  • k —end vertex, s Y
  • r —any other vertex, r Y
  • D —set of permissible solutions
  • Γ r —set of direct successors r
  • Γ r —collection of direct predecessors of r
  • π + r —out-degree (number of actions (arcs) exiting a vertex r)
  • π r —in-degree (number of actions (arcs) entering a vertex r )
  • λ i j —binary decision variable determining the existence of the i-j action
Symbols concerning network parameters:
  • p i j —probability of i-j action
  • α i j —accumulated probability of the occurrence of i-j action (taking into account the probability of the occurrence of preceding tasks)
  • δ r —probability of the occurrence of vertex r
  • c i j —the cost of action i-j
  • d i r —duration of action i-j w t , w c —weights for the criteria of time and cost, respectively
  • δ k _ r e q —required probability of occurrence of the final node k
  • T r —expected completion time of vertex r
  • C r —expected cost of completing vertex r
GOAL FUNCTION—EXPECTED TIME
F d = T k m i n
Goal Function—Expected Cost
F c = C k m i n
TWO-CRITERIA GOAL FUNCTION (meta-criterion function)
F c d = w t T k max { λ i j } D ( T k ) + w c C k max { λ i j } D ( C k ) m i n
w t , w c 0   and   w t + w c = 1
CONSTRAINT CONDITIONS CONCERNING POSSIBLE STRUCTURES
λ i j = B I N
δ 1 = 1
α i j = λ i j · δ i · p i j
δ j = Γ j α i j ,   for   receiver   or
δ j = Γ j α i j ,   for   receiver   and
δ k δ k _ r e q
δ k _ r e q changed in the range from 0 to 1 with a step, e.g., 0.1. for s Y (“deterministic” emitter) start node [30]
r Γ s λ s r = π + s
for r Y (“and” receiver, “deterministic” emitter) [31]
π + r λ i r j Γ r λ r j = 0   w h e r e   i Γ r
for r Y (“and” receiver, “ decision” emitter) [31]
i Γ r λ i r j Γ r π r λ r j = 0
for r Y (“or” receiver, “deterministic” emitter)
π + r λ i r j Γ r λ r j 0   d l a   i Γ r
j Γ r α r j i Γ r π + r   α i r 0
for r Y (“or” receiver, “decision” emitter)
j Γ r α r j i Γ r π + r α i r 0
i Γ r λ ir j Γ r π r λ rj 0
j Γ r λ rj 1
CONSTRAINT CONDITIONS CONCERNING TIME ANALYSES
T 1 = 0
for r Y (“and” receiver)
T r ( T i + t i r ) λ i r
for r Y (“or” receiver)
T r · i Γ r α i r = i Γ r ( T i + t i r ) α i r
CONSTRAINT CONDITIONS CONCERNING COST ANALYSES
C 1 = 0
for r Y (“and” receiver)
C r = i Γ r ( C i π + i c + c i r ) λ i r
π + i c = { π + i   f o r   d e t e r m i n i s t i c   e m i t t e r 1   f o r   n o n d e t e r m i n i s t i c   e m i t t e r
for r Y („or” receiver)
C r · i Γ r α i r = i Γ r ( C i + c i r ) α i r

3. Calculation Experiment

In order to perform the operational verification of the mathematical optimisation model defined in Section 3.2, the authors used an example from literature on the planning the renovation of the foundations of a building using an exemplary stochastic network [25]. The example selected by the authors is relatively simple (academic) which is meant to further simplify the presentation of how the optimisation model works.

3.1. Construction of a Stochastic Decision Network Model

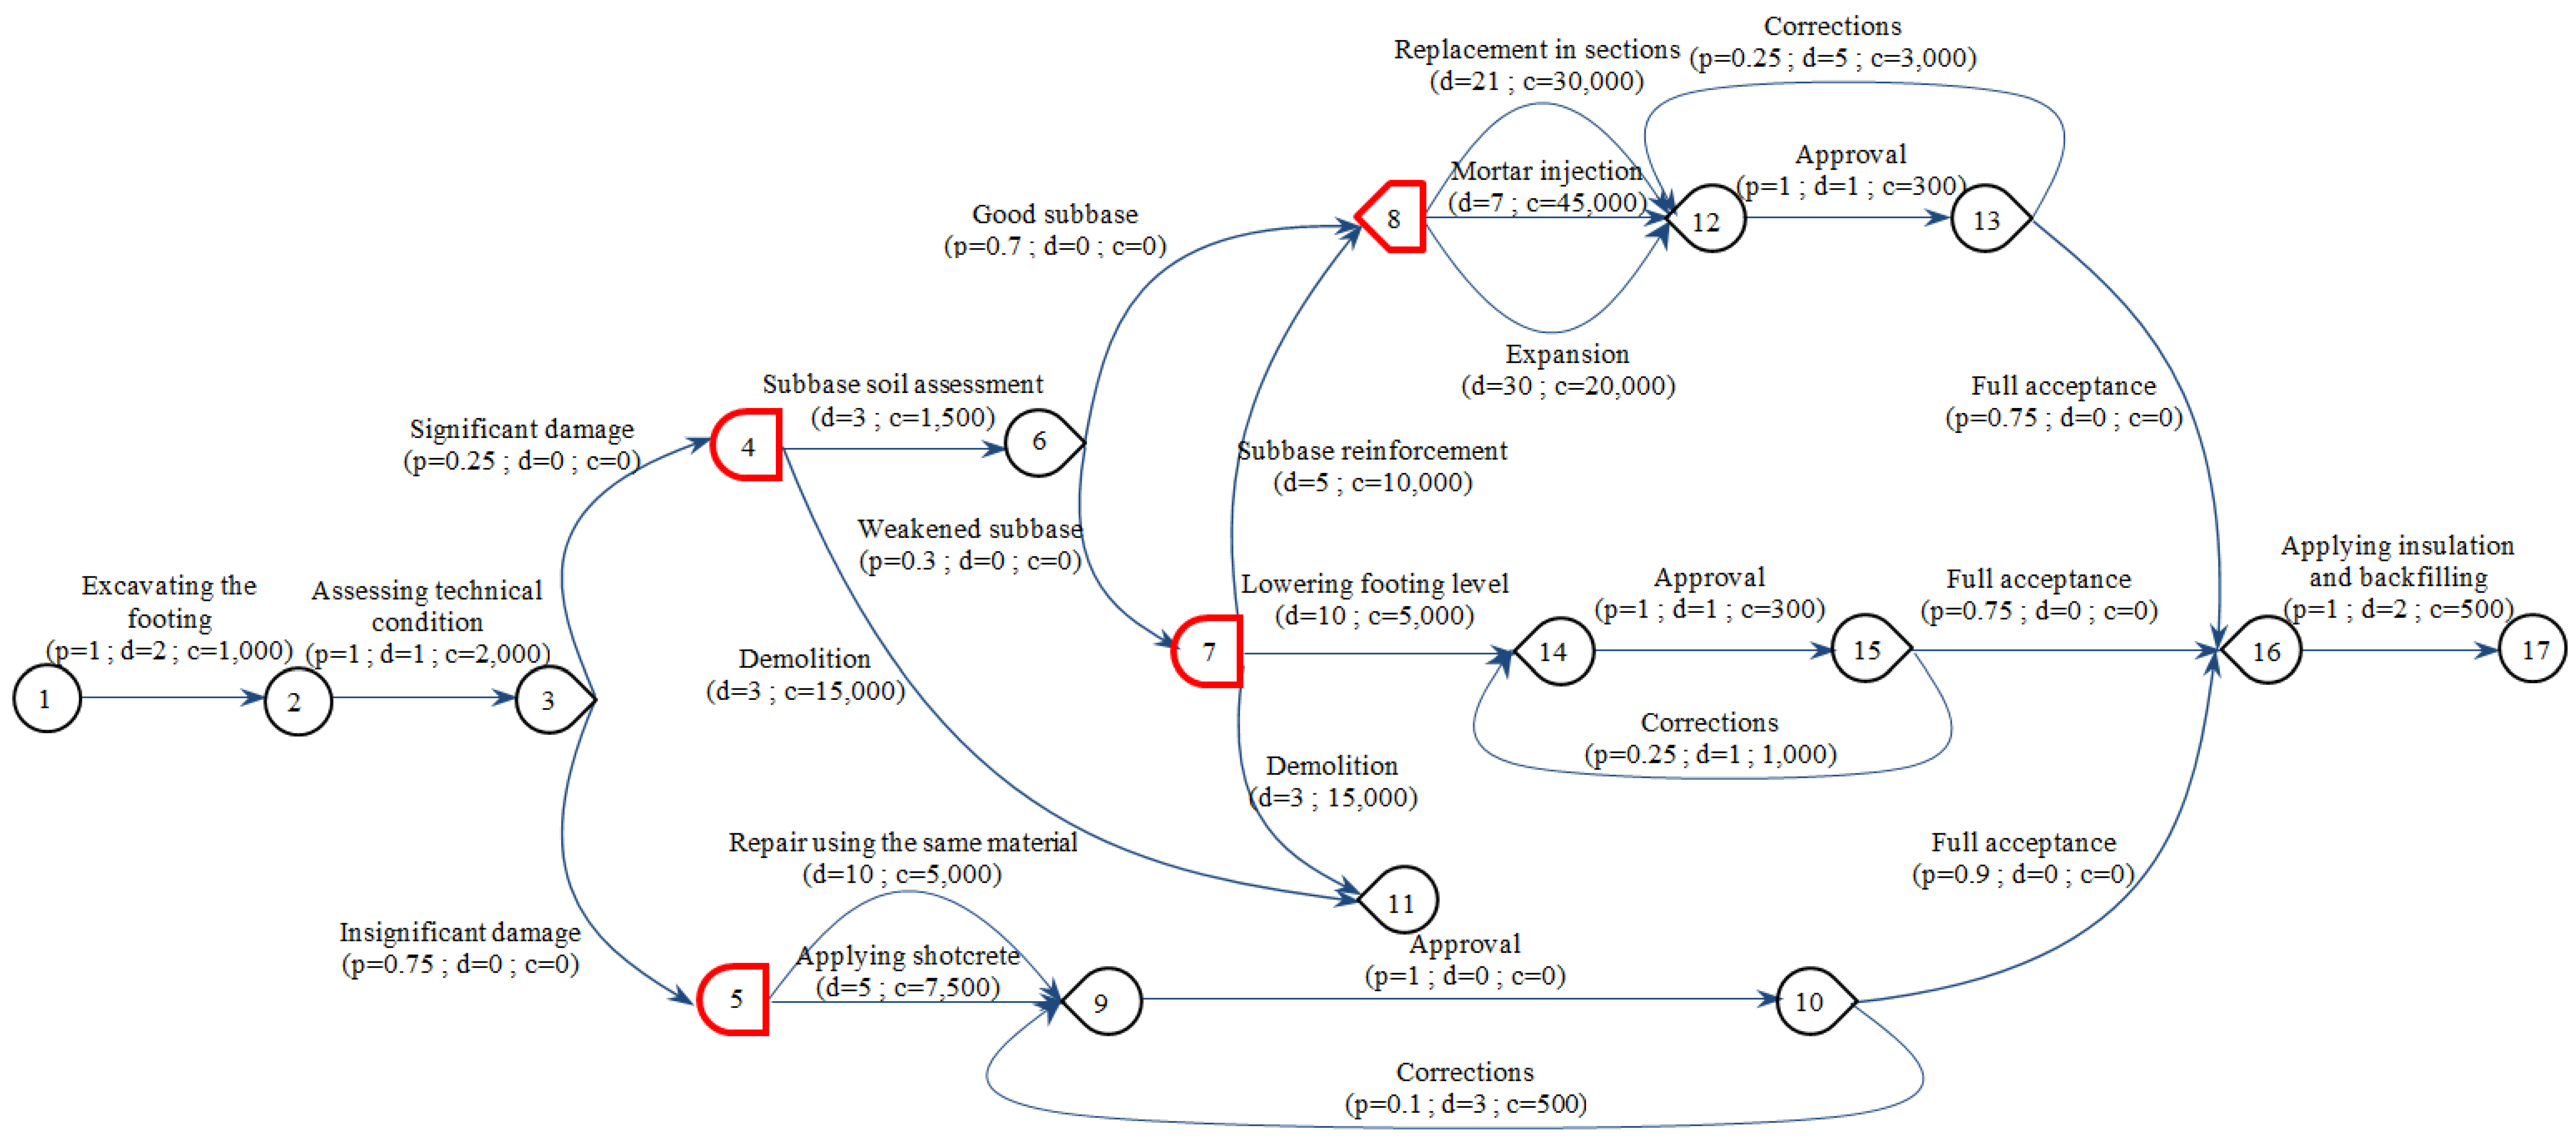
The structure of the network model proposed in [25] takes into account various variants of the course of the renovation of a building’s foundations, generated in a random manner based on statistical data collected by the author (Figure 1). For the presented network model to supplement it, the authors of this article introduced estimated values of completion time and costs of individual tasks.
The stochastic nature of the network model causes tasks that are, for example, the effect of assessing the technical condition of the foundations after their excavation, referred to as “serious damage” (action 3,4) and as “minor damage” (action 3–5), to have a random character.
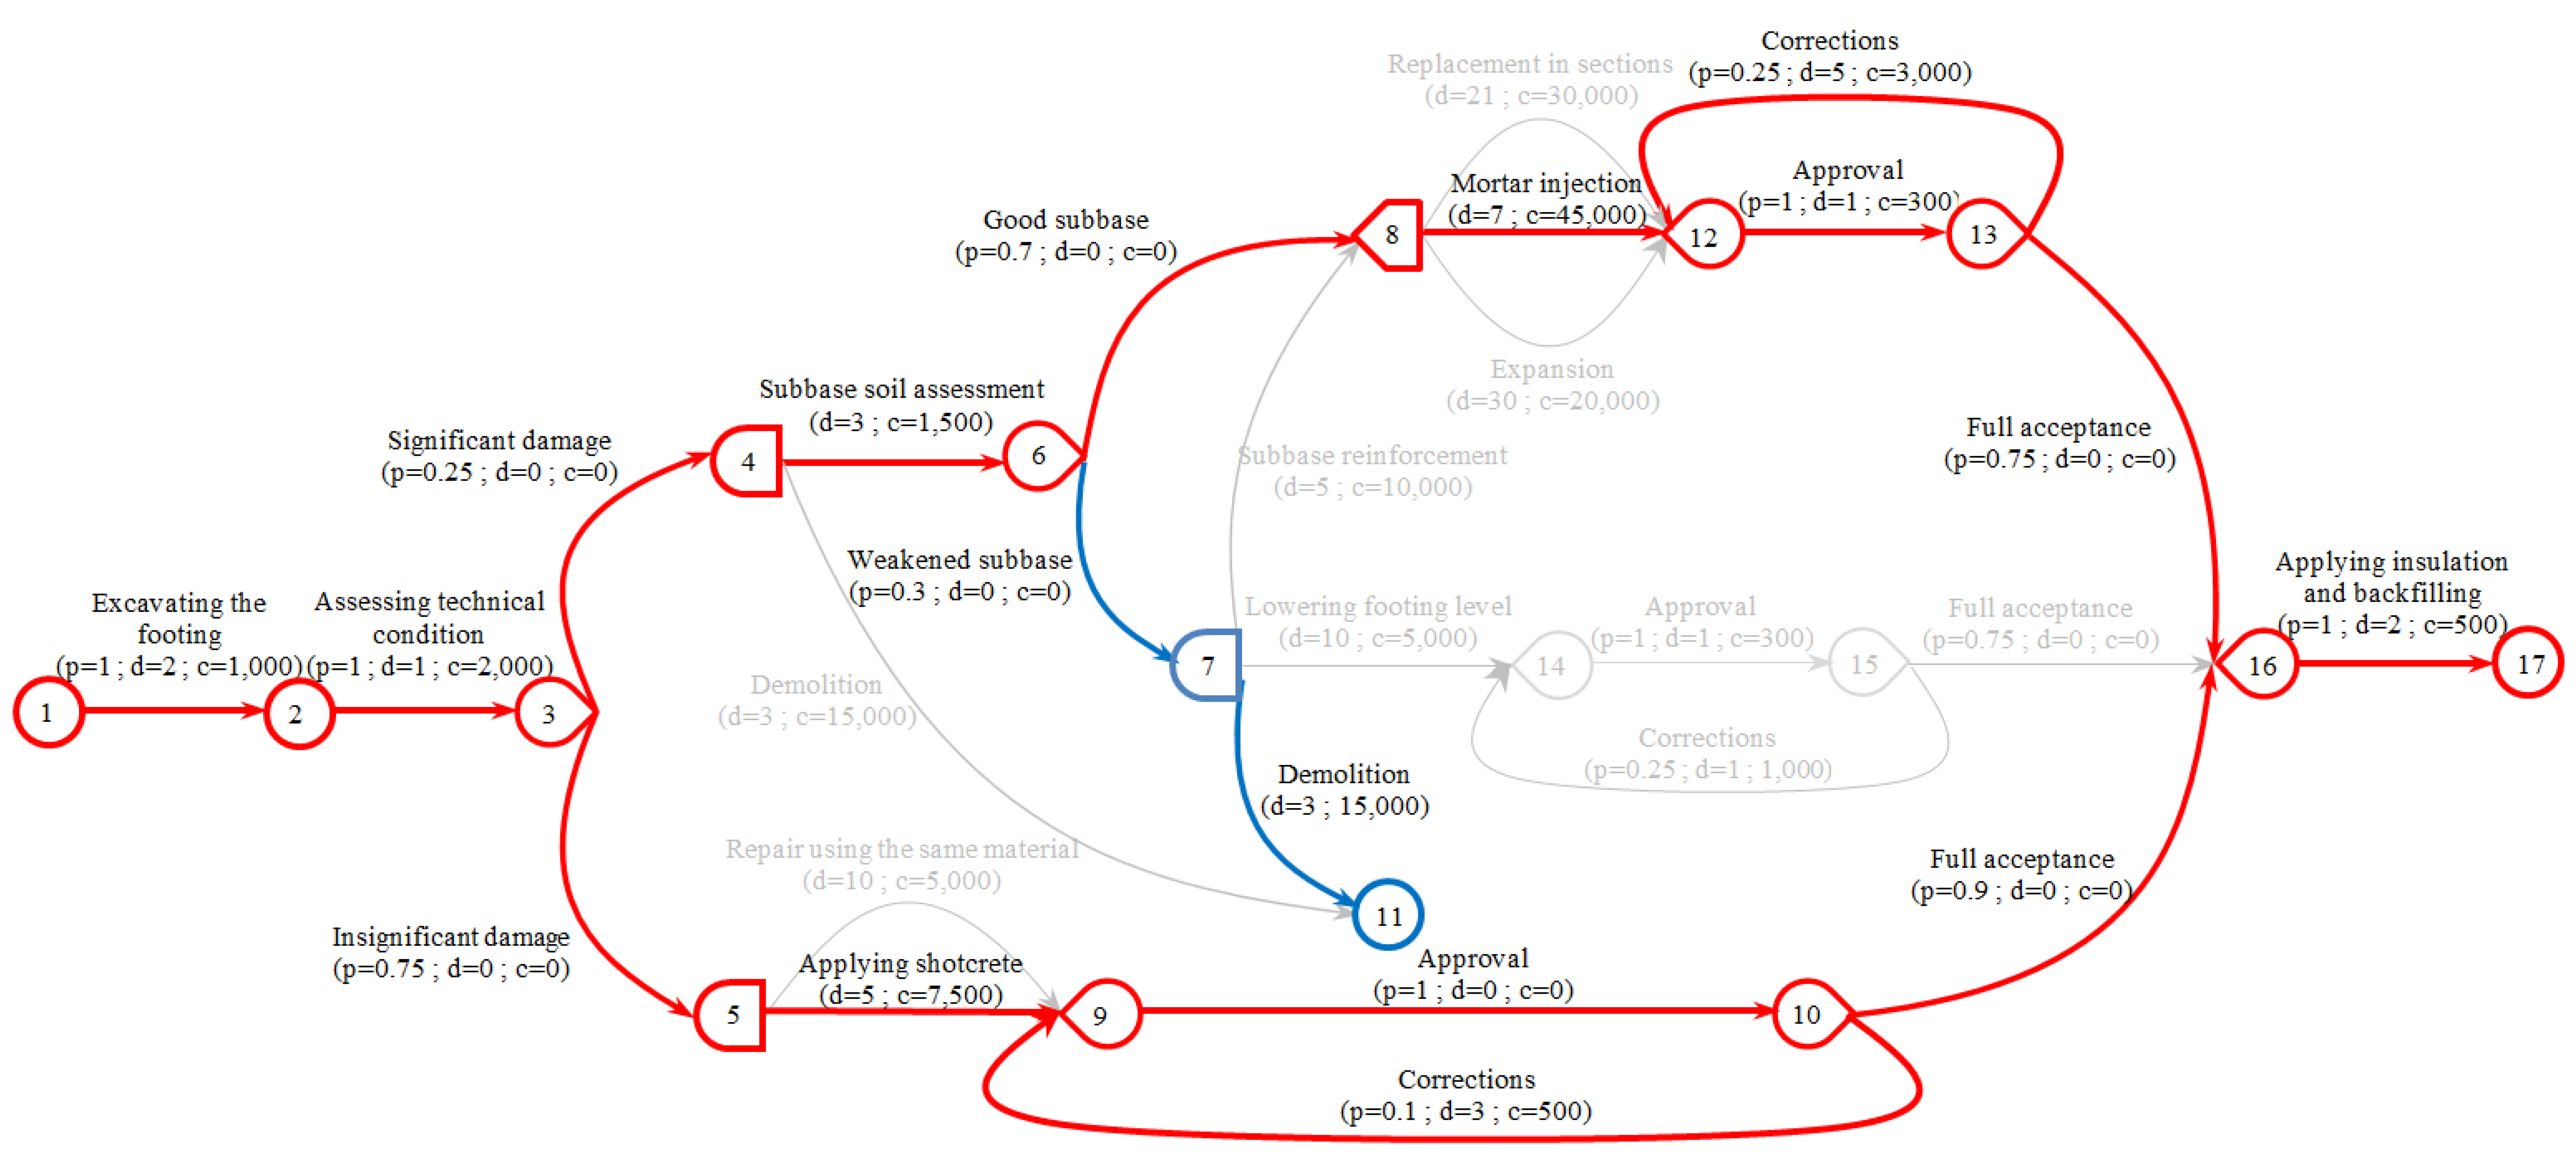
However, in this model it is also possible to distinguish actions related to, for example, the choice of a procedure in the case of a weak subbase in the repair of damaged foundations (actions: 7,8, 7–11, 7–14), which should not be generated randomly because their nature is clearly decision-based.
Therefore, in order to solve the problem specified above, the authors of this article proposed replacing specific stochastic emitters of the network with decision emitters (Figure 2) which undoubtedly makes the network model a better representation of reality and introduces a wider range of possible analysis results. The choice, for example, of how to address a weak subbase in foundation repair will depend on the decision-maker and their risk aversion in the context of the probability of reaching the final vertex (successful refurbishment of the foundations—vertex 17—or abandoning the renovation and dismantlement—vertex 11). Because there are several decision emitters in the model presented in the example, the result will contain not one optimal decision, but a sequence of decisions to be taken by the decision-maker in the context of the preferences they expect.

3.2. Analysis of the Network Model

The input data related to the structure of the stochastic decision network of the project being modelled, as well as the values of parameters related to it (the probability of the occurrence of tasks, and the time and cost of performing them) were introduced using a computer application developed by the authors. The application was written in the Python programming language. The user can easily enter data in the form of a vertex matrix (along with determining the types of the vertices) and arcs matrix (along with defining parameters, such as time, cost, probability) into the program.
The application, based on a user-defined structure of the stochastic decision network of the modelled project, consisting of the vertices and arcs of the graph together with their loads (parameters), automatically generates a mathematical optimisation model. In order to simplify the calculations, the introduction of input data was preceded by a reduction of cycles in the considered stochastic decision network, using the well-known method of graph reduction for this purpose. The analysis of the mathematical model of the defined stochastic decision network of a building’s foundations was carried out separately for the aspects of: completion time minimisation, cost minimisation and (two-criteria) minimisation of both completion time and costs of the project with the sample values set by the authors, with scales equal to 0.5. The following methods were used for the purpose of the abovementioned analysis:
  • Brute force;
  • APOPT solver (for Advanced Process OPTIMIZER) is a software package for solving large-scale optimisation problems (http://apopt.com/). The program is used to solve linear problems (LP), square (QP), non-linear (NLP) and mixed problems (MIP, MILP, MINLP). The APOPT solver was used with the APMonitor service [37].
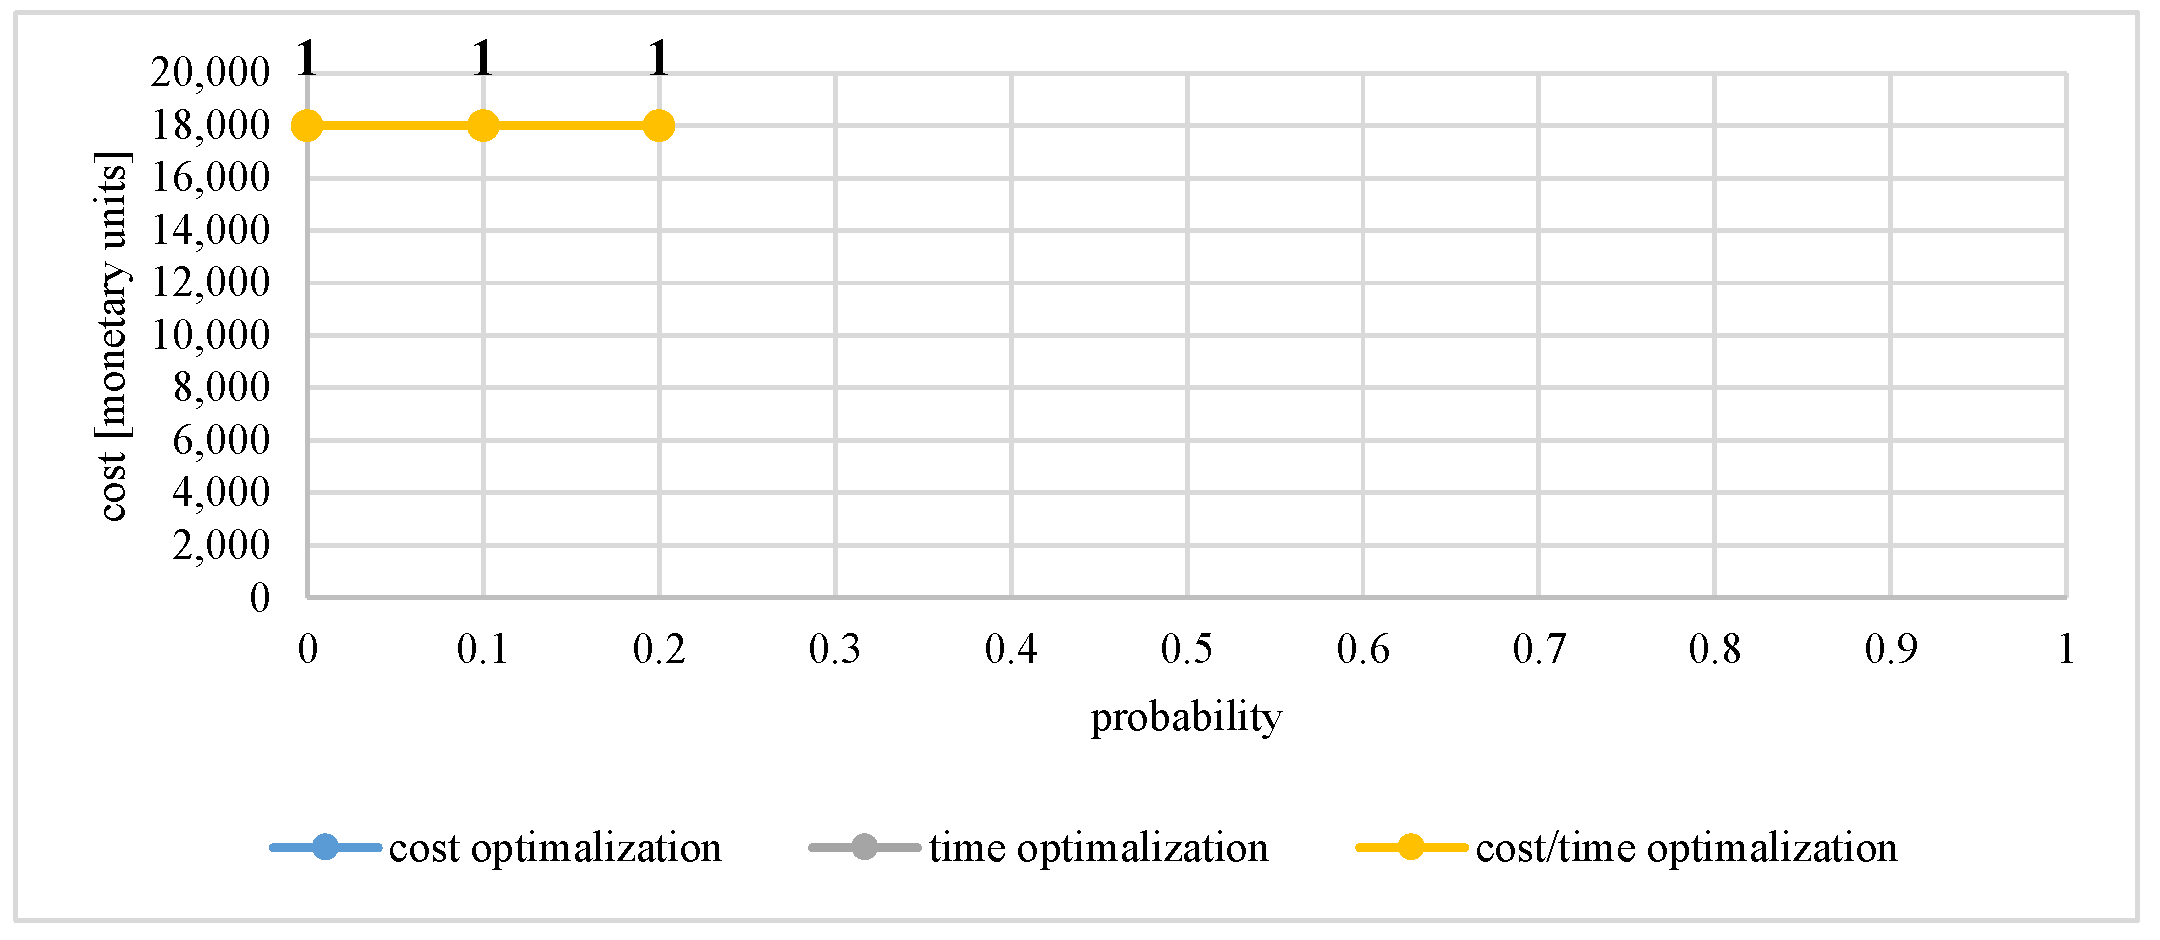
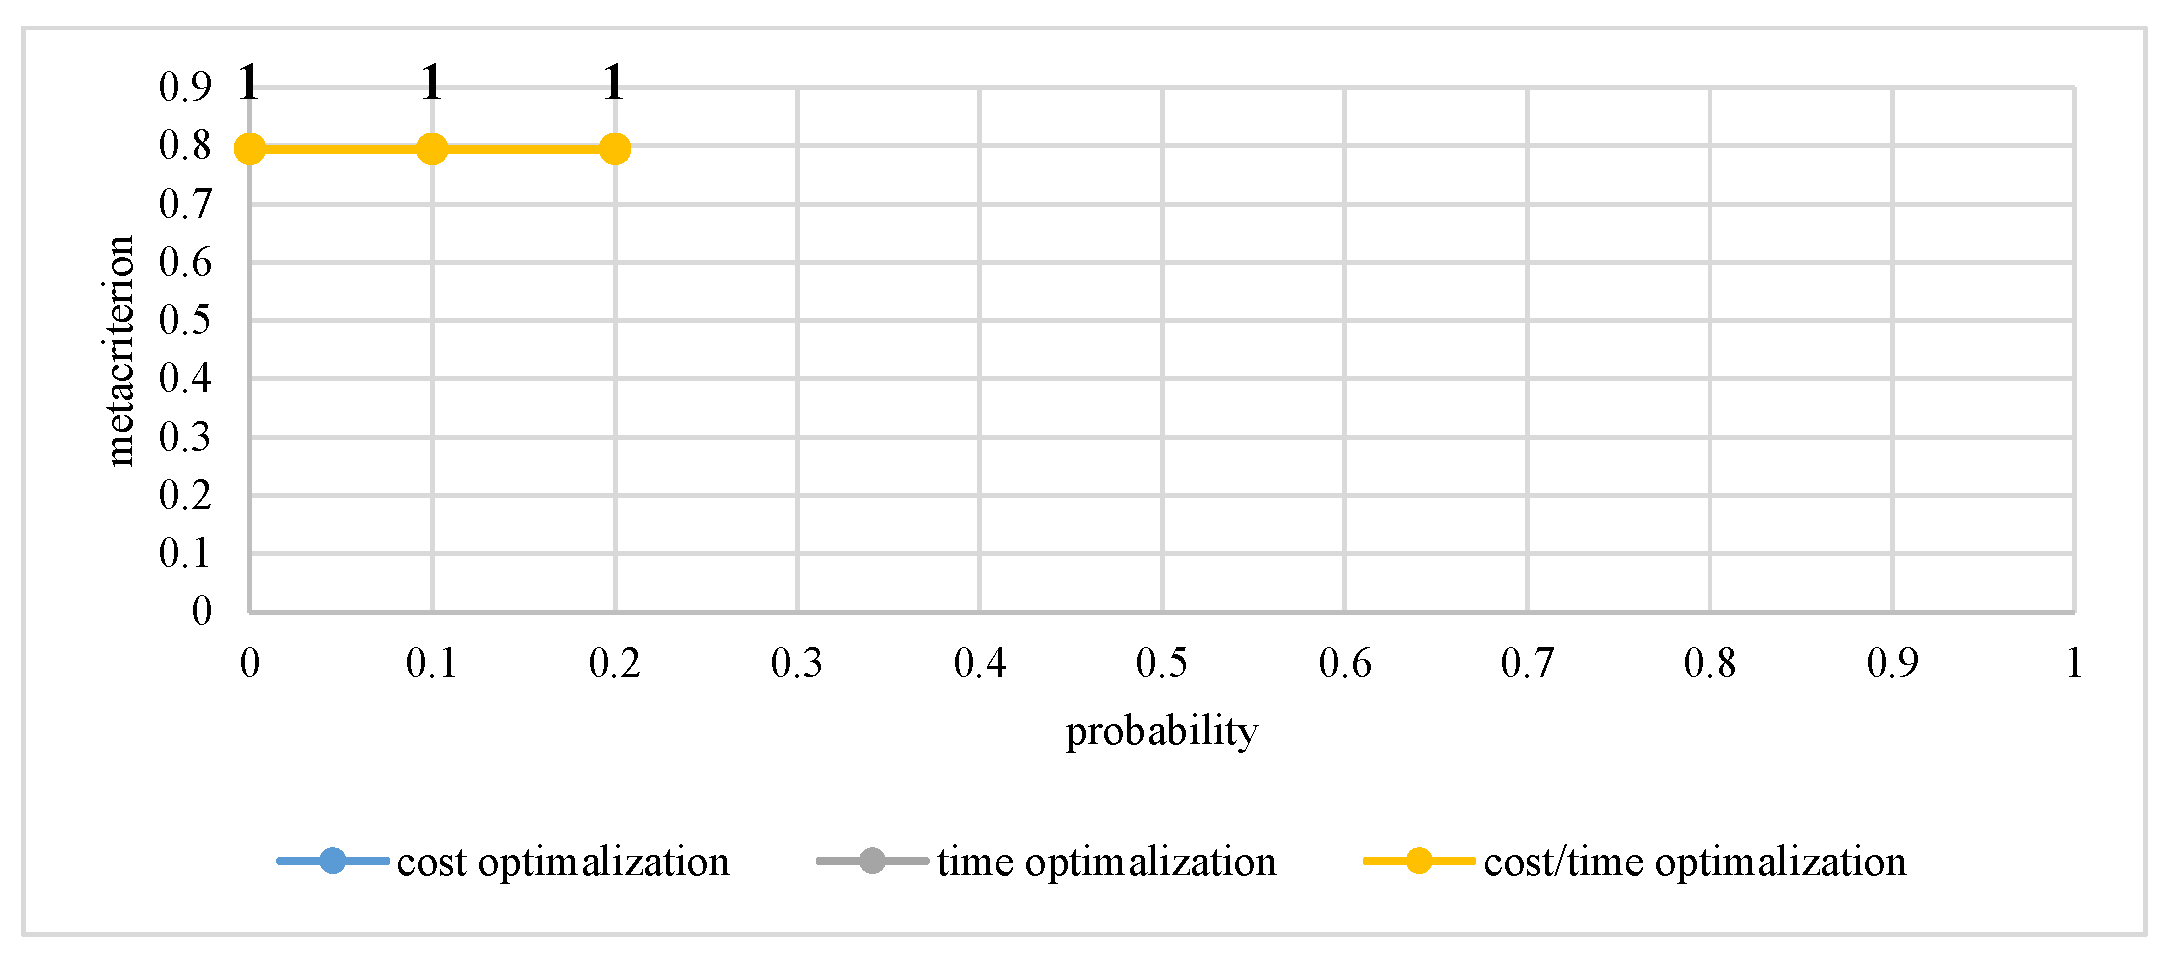
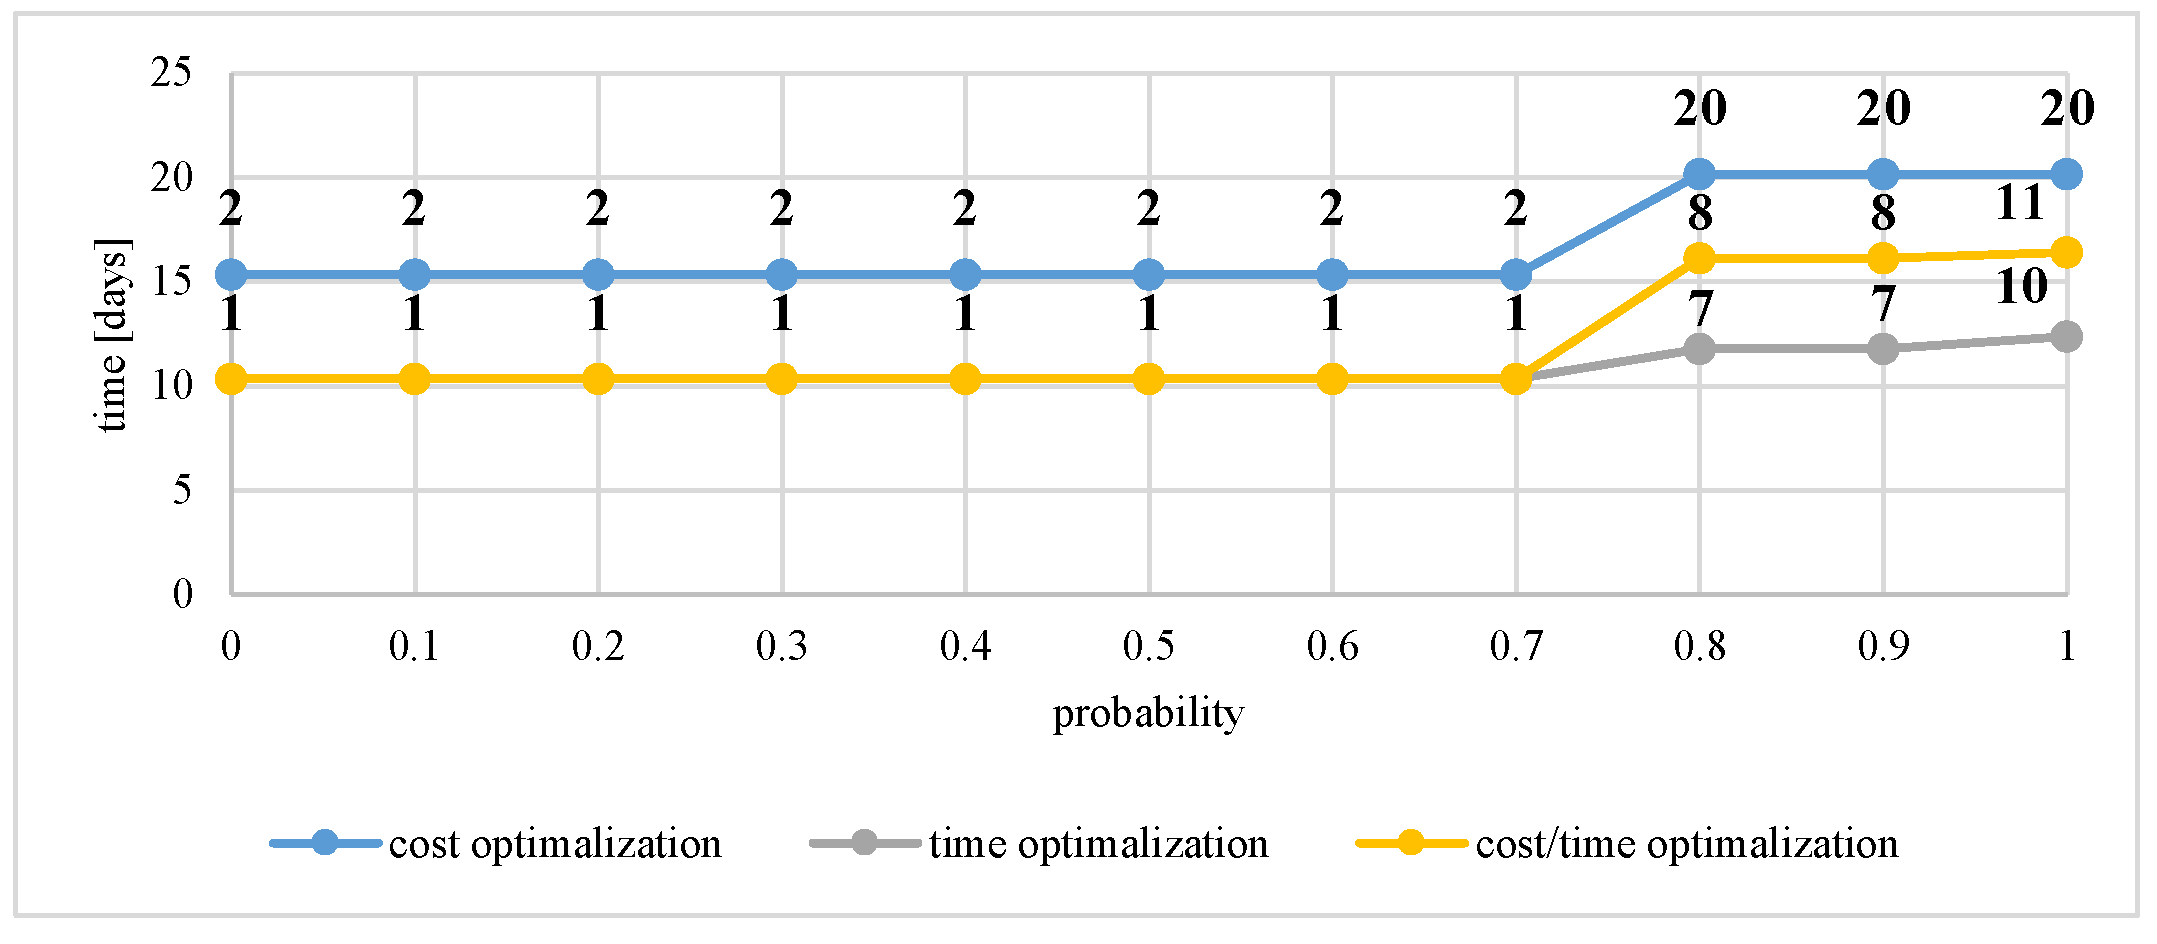
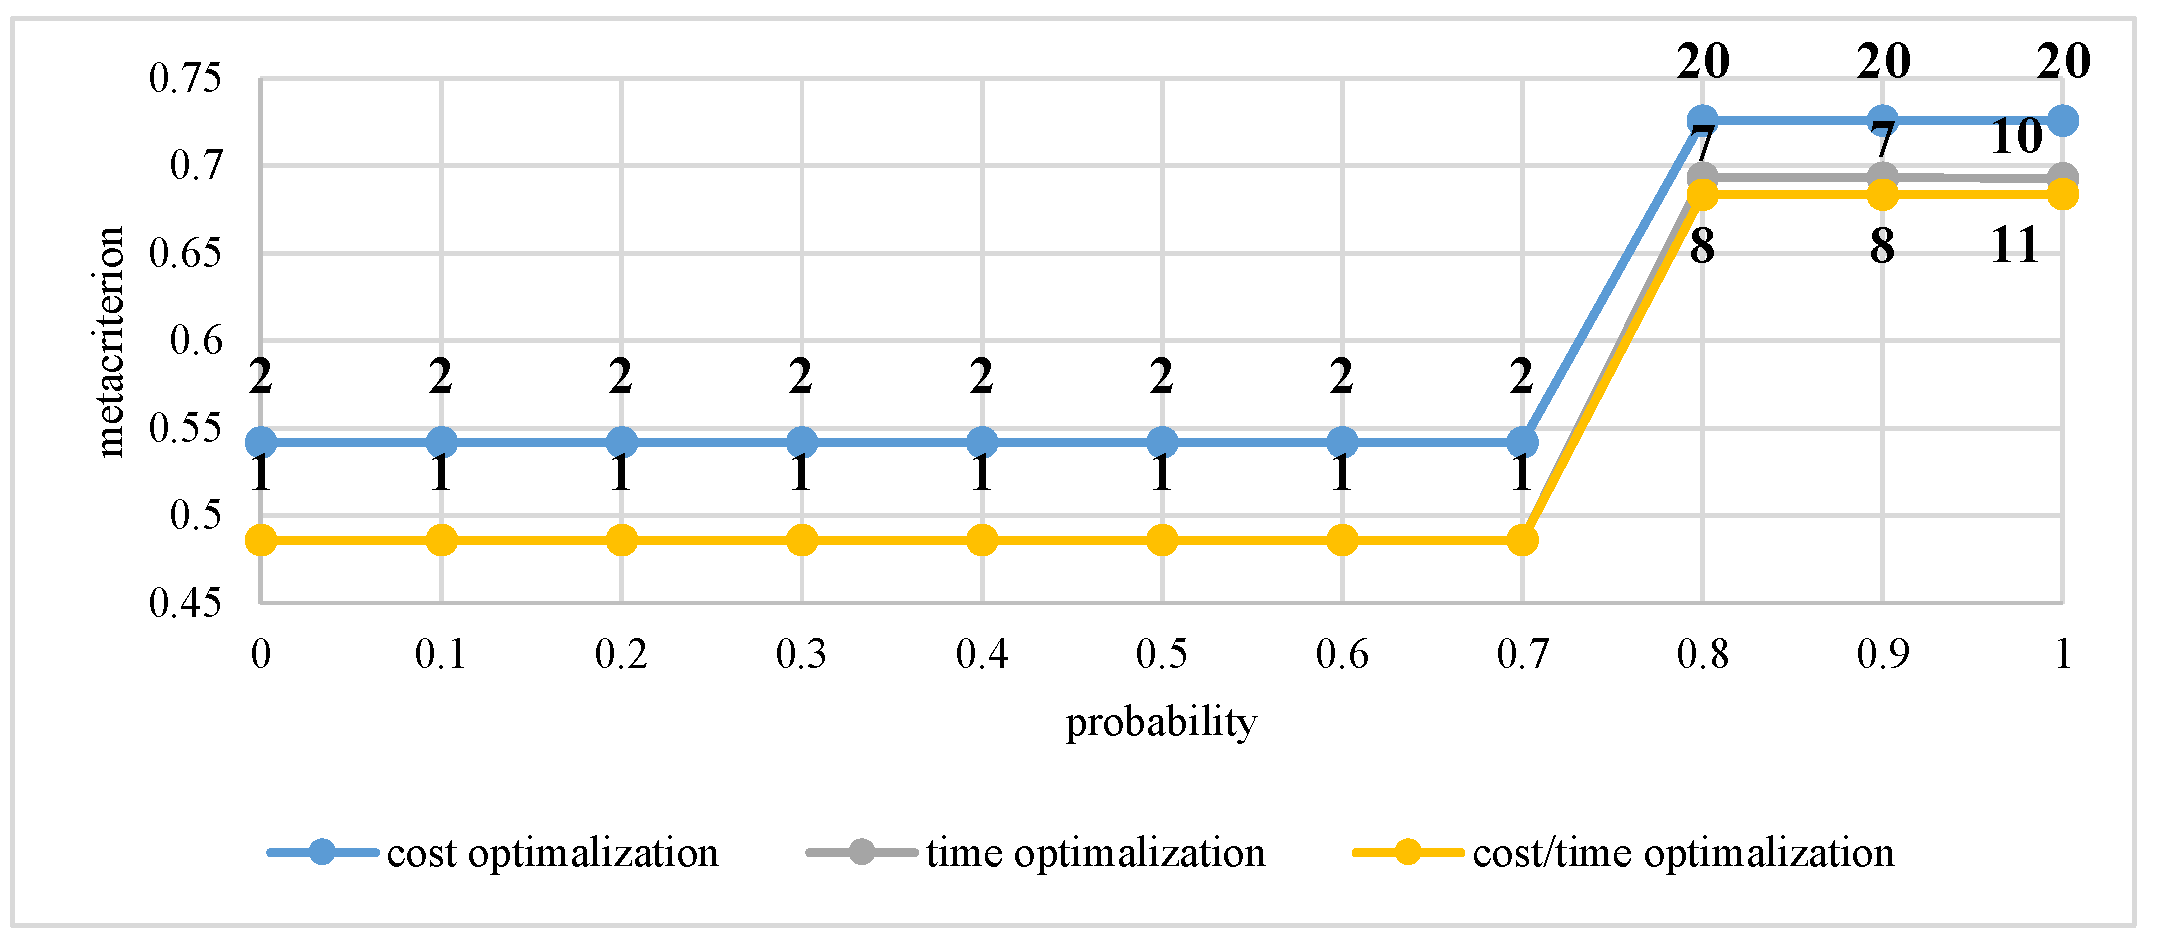
Table 3 presents a set of solutions that are possible for the analysed project. Figure 3, Figure 4, Figure 5, Figure 6, Figure 7 and Figure 8 present the results of optimisation obtained by means of a brute force analysis at different levels of risk aversion of the decision-maker. The numbers of possible solutions constituting the solutions obtained have been marked on the charts. Figure 9 and Figure 10 also present the results of two-criteria optimisation for different combinations of criteria weights.
In Table 4, the authors compared the results obtained with the brute force method with the results obtained using the APOPT solver for different levels of probability of reaching end vertices No. 11 and No. 17. The problem of finding a solution using the APOPT solver was noted for several probability values. However, in these cases, the program returned a result if the probability value given by the authors was slightly greater than its threshold value (e.g., instead of 0.3, the value was set to 0.3001). The proposed APOPT solver uses an active-set algorithm. Initially, this algorithm searches for a permissible solution. A small change in task parameter values can cause a permissible solution to either be found or not. This problem results from the fact that the optimisation under consideration is from the Mixed Integer Nonlinear Programming (MINLP) class. So far, no methods capable of effectively solving this class of problems for large-sized tasks have been developed. However, despite what has been stated above, the computer application in question is very practical because it makes it possible to obtain results faster than through the use of the brute force method. In Table 4, solutions obtained using the APOPT solver that differed from solutions obtained using the brute force method (or for which APOPT did not find a solution) were highlighted in colour

4. Analysis of Results

When analysing the results, it can be observed that in the case of the 11th vertex, regardless of the type of optimisation used, the optimal solution is a possible solution { λ i j } 1 (the graphs overlap). It is also impossible to achieve this with a probability of 0.3 or higher. As for vertex 17, the same results are obtained in the case of time and cost optimisation for a probability value of up to 0.7 (also a possible solution { λ i j } 1 ). However, in the case of probabilities higher than 0.7, one could observe discrepancies in the solutions that can be seen when using different types of optimisation.
The decision-maker acquires information about decisions from the obtained results (represented by graph arcs originating at decision emitters) and that should be included in the project’s final plan, taking into account the personal risk aversion and preferences as to the significance of expected times and costs of the final results of the planned project. These decisions define/determine the optimal plan of the carrying out of the project under consideration, in terms of the expected value of time and costs, i.e., the optimal possible sub-network. For example, let the decision-maker’s risk aversion correspond to a minimum probability of to reach vertex No. 17 being 0.8. Let their preference regarding the validity of the expected costs be 0.3 and the expected time—0.7. Therefore, with the assumptions above, the carrying out of the renovation of foundations (vertex No. 17) within an optimal time and at an optimal cost is determined by the possible solution { λ i j } 7 , for which the optimal metacriterion function value is 0.629 (expected cost = PLN 18688.29 and expected time = 11.78 days, with a probability = 0.925).
Therefore, the decision-maker receives information that, at the planning stage of the project, he or she should plan the analysis of the subbase’s soil (action: 4–6) and choose solutions for repairing foundations like applying shotcrete (action: 5–9) and traditional repair (action: 8–12), activities that are optimal in the context of minimising the time and costs of the renovation of foundations. However, the decision-maker should take into account the fact that for such a plan, there is a relatively small, 0.075 probability of reaching vertex no. 11 (instead of vertex no. 17). This can take place in the event of serious damage to the foundations (action 3–4) and weakened soil (action 6,7), which will result in the decision to commence with dismantlement (action 7–11). The value of the metacriteria function for the 11th vertex will then be 1.0 (expected cost = 19,500 PLN and expected time = 9 days) (Figure 11).
Finally, as mentioned in Section 3.1, the use of decision emitters in the structure of the considered stochastic network (Figure 1) is justified due to the decision character of alternatives emerging from vertices 4, 5, 7 and 8. Consequently, this approach allows one to generate an optimal (in terms of time and cost) possible sub-network, whose expected values of the time and cost of carrying out each vertex are smaller than the corresponding values in the case of a classical stochastic network (Table 5). The resulting values for the stochastic network were obtained by using the graph reduction method. Graph reduction methods are still being intensively developed [38].

5. Conclusions and Discussion

The restoration of a historical building is a chance to extend its life-cycle, which, according to the concept of sustainable development, will make it possible to preserve its substance and cultural values for future generations.
Determining the estimated completion time and cost of the restoration work to be done on a historical structure is a highly distinct and difficult process, as it requires that various scenarios of completing such projects are taken into account.
The planning of construction projects with a non-determinate course, such as the renovation of buildings and structures, requires the use of appropriate tools that enable the effective modelling of the scenarios being considered, as well as the estimation of the time and costs of carrying them out. Analysis of individual alternatives of the carrying out the project can be expanded to include experiments conducted in order to design various solutions. For instance, in the article [39] it was demonstrated that an experimental propagation of errors can affect the prediction of pedestrian suspended bridge fluttering, which is associated with the cost of their construction. In subject literature, there are many proposals of the use of stochastic networks for this purpose, which are based on the assumption that variant scenarios for the carrying out of such projects are generated in a random manner. However, in practice, the carrying out of the considered scenarios of such projects, such as the restoration of historical structures, may also have a decision-based character. The choice of the type of technical solution or the way of carrying out the work should not be treated as a random event, but as a decision option for the decision-maker to consider. The network planning and analysis methods proposed in literature do not allow for the modelling of construction projects with a non-determinate course, including both a random and decision-based character of carrying them out.
In the work, the authors proposed an innovative approach in the form of a stochastic decision network, enabling the integration of both the random and decision-based character of the planned project. The authors defined the structure of the network model by introducing an appropriate vertex topology and defined conditions for possible structures (possible sub-networks) generated by vertices with decision emitters. For the purpose of optimisation (in terms of time and cost) of the project plan being modelled by the stochastic decision network, the authors developed non-linear models of one and multi-criteria binary programming. The authors also developed a computer application written in the Python programming language, which allows for the easy and quick input of data about the structure and parameters of stochastic networks in order to generate an optimisation model for the user. To analyse the model, the authors used two methods: brute force and APOPT solver and then compared the obtained results. The authors are aware of the limitations and imperfections of the APOPT solver. In the future, it is planned to use metaheuristic methods to optimise the network in question, such as simulated annealing, genetic algorithms or Monte Carlo tree search.
As a result, the approach developed by the authors enables the decision-maker—by specifying their preferences as to the outcome of the planned project (reaching the selected final vertex in the network) and risk aversion—to obtain the optimal (in terms of expected time and costs) solution (sub-network). In the case of a multi-criteria analysis (of time and cost), the decision-maker may also define different values of weights for the expected time and costs of the planned project in the goal function. As a part of the results, the decision-maker will get information on the type of technical solutions or the manner of carrying out the work that should be included in the plan of the optimal scenario of carrying out the project.
In order to confirm the effectiveness of the aforementioned approach, the authors, based on the conducted calculation experiment, demonstrated the advantage of the stochastic decision network over the classical stochastic network in the case of projects whose implementation structure has both a random and decision-based character.
In practice, the developed approach can be useful at the stage of developing a project’s feasibility study and can be used to analyse various scenarios of carrying it out in terms of probability and the assessment of its cost and completion time. It should be noted that the optimisation of alternative technical solutions can also be useful during the stage of the design of a new building or planning construction and renovation work.
The example presented in the article features a small number of calculations as it was used to demonstrate how the method works. In the future, the method should be tested on more complicated construction project network models. Furthermore, as part of further research, the potential of stochastic decision networks should be expanded by developing a functional time-cost relation at the level of individual activities in the network. In addition, the time, cost or the amount of resources needed to carry out a given task does not necessarily have to be a deterministic value. For many projects, e.g., the renovations of buildings, these values may be random variables of a given probability distribution or, in the absence of empirical data, may take on fuzzy values, for instance.
In addition, the proposed structure of the stochastic and decision network can, in the future, become a basis for the use of random growing mechanisms, based on the illustrative problems [40,41,42].

Author Contributions

Conceptualization: G.Ś.; methodology: G.Ś., B.S. (Bartłomiej Szewczyk), B.S. (Bartłomiej Sroka); software: B.S. (Bartłomiej Sroka); validation: B.S. (Bartłomiej Szewczyk); formal analysis: G.Ś., B.S. (Bartłomiej Szewczyk), B.S. (Bartłomiej Sroka); investigation, resources, data curation, writing—original draft preparation, writing—review and editing, visualization, supervision, project administration, G.Ś., B.S. (Bartłomiej Szewczyk), B.S. (Bartłomiej Sroka), E.R.-Z.; funding acquisition: E.R.-Z.

Funding

This research received no external funding.

Conflicts of Interest

The authors declare no conflict of interest.

References

  1. Zavadskas, E.K.; Antucheviciene, J. Development of an indicator model and ranking of sustainable revitalization alternatives of derelict property: A Lithuanian case study. Sustain. Dev. 2006, 14, 287–299. [Google Scholar] [CrossRef]
  2. Zavadskas, E.K.; Antucheviciene, J. Multiple criteria evaluation of rural building’s regeneration alternatives. Build. Environ. 2007, 42, 436–451. [Google Scholar] [CrossRef]
  3. European Union Treaty of Lisbon Amending the Treaty on European Union and the Treaty establishing the European Community. 2007. Available online: http://data.europa.eu/eli/treaty/lis/sign (accessed on 28 January 2019).
  4. Śladowski, G.; Radziszewska-Zielina, E. Description of technological and organisational problems in construction works using the example of restoration of the outer courtyard on Wawel Hill. Tech. Trans. 2015, 2, 117–125. [Google Scholar]
  5. Radziszewska-Zielina, E.; Kutut, V.; Mesároš, P.; Sroka, B.; Szewczyk, B.; Śladowski, G. Problems of assessing the duration and cost of restoration projects on the example of Poland, Slovakia and Lithuania. Sci. Rev. Eng. Environ. Sci. 2018, 27, 3–8. [Google Scholar] [CrossRef] [Green Version]
  6. Lootsma, F.A. Theory and Methodology stochastic and fuzzy PERT. Eur. J. Oper. Res. 1989, 143, 174–183. [Google Scholar] [CrossRef]
  7. Chanas, S.; Zieliński, P. Critical path analysis in the network with fuzzy activity times. Fuzzy Sets Syst. 2001, 122, 195–204. [Google Scholar] [CrossRef]
  8. Lin, F.T.; Yao, J.S. Fuzzy critical path method based on signed-distance ranking and statistical confidence-interval estimates. J. Supercomput. 2003, 24, 305–325. [Google Scholar] [CrossRef]
  9. Chen, C.-T.; Huang, S.-F. Applying fuzzy method for measuring criticality in project network. Inf. Sci. 2007, 177, 2448–2458. [Google Scholar] [CrossRef]
  10. Hajdu, M. Effects of the application of activity calendars on the distribution of project duration in PERT networks. Autom. Constr. 2013, 35, 397–404. [Google Scholar] [CrossRef]
  11. Radziszewska-Zielina, E.; Śladowski, G.; Sibielak, M. Planning the reconstruction of a historical building by using a fuzzy stochastic network. Autom. Constr. 2017, 84, 242–257. [Google Scholar] [CrossRef]
  12. Eisner, H. A Generalized Network Approach to the Planning and Scheduling of a Research Project. Oper. Res. 1962, 10, 115–125. [Google Scholar] [CrossRef]
  13. Pritsker, A.A.B. GERT: Graphical Evaluation and Review Technique; Rand Corporation: Santa Monica, CA, USA, 1966. [Google Scholar]
  14. Whitehouse, G.E. Systems Analysis and Design Using Network Techniques; Prentice-Hall: Englewood Cliffs, NJ, USA, 1973. [Google Scholar]
  15. Cheng, C.-H. Fuzzy consecutive-k-out-of-n:F system reliability. Microelectron. Reliab. 1994, 34, 1909–1922. [Google Scholar] [CrossRef]
  16. Cheng, C.-H. Fuzzy repairable reliability based on fuzzy gert. Microelectron. Reliab. 1996, 36, 1557–1563. [Google Scholar] [CrossRef]
  17. Gavareshki, M.K. New fuzzy GERT method for research projects scheduling. In Proceedings of the 2004 IEEE International Engineering Management Conference, Singapore, 18–21 October 2004; Volume 2, pp. 820–824. [Google Scholar]
  18. Hashemin, S.S. Fuzzy completion time for alternative stochastic networks. J. Ind. Eng. Int. 2010, 6, 17–22. [Google Scholar]
  19. Norouzi, G.; Heydari, M.; Noori, S.; Bagherpour, M. Developing a mathematical model for scheduling and determining success probability of research projects considering complex-fuzzy networks. J. Appl. Math. 2015. [Google Scholar] [CrossRef]
  20. Zadeh, L.A. Fuzzy sets. Inf. Control 1965, 8, 338–354. [Google Scholar] [CrossRef]
  21. Zanddizari, M. Set confidence interval for customer order cycle time in supply chain using GERT method. In Proceedings of the 17th IASTED international Conference on Modelling and Simulation, Montreal, QC, Canada, 24–26 May 2006; pp. 213–218. [Google Scholar]
  22. Aytulun, S.K.; Guneri, A.F. Business process modelling with stochastic networks. Int. J. Prod. Res. 2008, 46, 2743–2764. [Google Scholar] [CrossRef]
  23. Zhang, Z.; Ye, W.; Xia, Z. Research on A GERT Based Risk Transfer Model in Complex Product Development Process. J. Grey Syst. 2015, 27, 99–111. [Google Scholar]
  24. Nelson, R.G.; Azaron, A.; Aref, S. The use of a GERT based method to model concurrent product development processes. Eur. J. Oper. Res. 2016, 250, 566–578. [Google Scholar] [CrossRef]
  25. Kosecki, A. Use of stochastic network models in managing the renovation and rehabilitation projects. In Integrated Approaches to the Design and Management of Buildings Reconstruction: International University Textbook; EuroScientia: Wambeek, Belgium, 2014; pp. 52–60. [Google Scholar]
  26. Hougui, Z. Study on stochastic model for the construction of concrete longitudinal cofferdam in the Three Gorges Project. J. Hydraul. Eng. 1997, 8, 57–60. [Google Scholar]
  27. Pena-Mora, F.; Li, M. Dynamic planning and control methodology for design/build fast-track construction projects. J. Constr. Eng. Manag. 2001, 127, 1–17. [Google Scholar] [CrossRef]
  28. Gao, X.; Shen, Y.; Lin, J. Schedule risk management at early stages of large construction projects based on the GERT model. In Proceedings of the IEEE Conference Anthology, Shenyang, China, 7–9 November 2014; pp. 1–4. [Google Scholar]
  29. Wang, B.; Li, Z.; Gao, J.; Vaso, H. Critical Quality Source Diagnosis for Dam Concrete Construction Based on Quality Gain-loss Function. J. Eng. Sci. Technol. Rev. 2014, 7, 137–151. [Google Scholar] [CrossRef]
  30. Ignasiak, E. Optymalne struktury projektów w sieciach alternatywno-decyzyjnych (Optimal project structures in alternative-decision networks). Prz. Stat. (Stat. Rev.) 1975, 22, 323–333. [Google Scholar]
  31. Śladowski, G. Modeling technological and organizational variants of building projects. Tech. Trans. 2014, 5, 261–269. [Google Scholar]
  32. Zhang, L.H.; Liu, X.; Zhong, G. Bound Duration Theorem and DCPM Network Reduction. In Proceedings of the 2009 International Conference on Electronic Commerce and Business Intelligence, Beijing, China, 6–7 June 2009; pp. 230–233. [Google Scholar]
  33. Zhang, L.; Meng, X.; Cui, L. New Method for DCPM by Substituting Critical Path. In Proceedings of the 2011 International Conference on Management and Service Science, Wuhan, China, 12–14 August 2011; pp. 1–4. [Google Scholar]
  34. Ibadov, N. The Alternative Net Model with the Fuzzy Decision Node for the Construction Projects Planning. Arch. Civ. Eng. 2018, 64, 3–20. [Google Scholar] [CrossRef]
  35. Ibadov, N.; Kulejewski, J. Construction projects planning using network model with the fuzzy decision node. Int. J. Environ. Sci. Technol. 2019, 1–8. [Google Scholar] [CrossRef]
  36. Więckowski, A. Principles of the NNM method applied in the analysis of process realisation. Autom. Constr. 2002, 11, 409–420. [Google Scholar] [CrossRef]
  37. Hedengren, J.D.; Shishavan, R.A.; Powell, K.M.; Edgar, T.F. Nonlinear modeling, estimation and predictive control in APMonitor. Comput. Chem. Eng. 2014, 70, 133–148. [Google Scholar] [CrossRef]
  38. Shang, Y. Subgraph Robustness of Complex Networks Under Attacks. IEEE Trans. Syst. Man Cybern. Syst. 2017, 99, 1–12. [Google Scholar] [CrossRef]
  39. Rizzo, F.; Caracoglia, L.; Montelpare, S. Predicting the flutter speed of a pedestrian suspension bridge through examination of laboratory experimental errors. Eng. Struct. 2018, 172, 589–613. [Google Scholar] [CrossRef]
  40. Shang, Y. Distinct Clusterings and Characteristic Path Lengths in Dynamic Small-World Networks with Identical Limit Degree Distribution. J. Stat. Phys. 2012, 149, 505–518. [Google Scholar] [CrossRef]
  41. Shang, Y. Geometric Assortative Growth Model for Small-World Networks. Sci. World J. 2014, 2014, 1–8. [Google Scholar] [CrossRef] [PubMed]
  42. Shang, Y. On the likelihood of forests. Phys. A Stat. Mech. Its Appl. 2016, 456, 157–166. [Google Scholar] [CrossRef]
Figure 1. A stochastic network model for the renovation of a building’s foundations. Values in brackets signify: “p” probability of occurrence of activities, “d” duration and “c” cost of their implementation, source: based on [25].
Symmetry 11 00398 g001
Figure 2. Stochastic decision network model for the renovation of a building’s foundations with introduced vertices with decision emitters. The values in brackets signify, respectively: “p” probability of occurrence of activities, “d” duration and “c” cost of carrying them out.
Symmetry 11 00398 g002
Figure 3. The expected cost of carrying out the 11th vertex at different probability levels for different types of optimisation.
Symmetry 11 00398 g003
Figure 4. The expected completion time of the 11th vertex at different probability levels for different types of optimisation.
Symmetry 11 00398 g004
Figure 5. Value of the meta-criterion of carrying out vertex 11 at different probability levels for different types of optimisation.
Symmetry 11 00398 g005
Figure 6. The expected cost of the carrying out of vertex 17 at different probability levels for different types of optimisation.
Symmetry 11 00398 g006
Figure 7. The expected completion time of vertex 17 at different probability levels for different types of optimisation.
Symmetry 11 00398 g007
Figure 8. Value of the meta-criterion for the carrying out of vertex 17 at different probability levels for different types of optimisation.
Symmetry 11 00398 g008
Figure 9. Two-criteria optimisation results for the completion of vertex 11 at different probability levels and different combinations of criterion weights.
Symmetry 11 00398 g009
Figure 10. Two-criteria optimisation results for the completion of vertex 17 at different probability levels and different combinations of criteria weights.
Symmetry 11 00398 g010
Figure 11. The sub-network { λ ij } 7 , that defines/determines the plan of carrying out the renovation of foundations (reaching vertex no. 17) with a probability equal to min. 0.8 with the minimum expected time and cost for the weighted preferences of the decision-maker at a level of 0.3 for the expected costs and 0.7 for the expected project completion time.
Symmetry 11 00398 g011
Table 1. Graphical representation of the logical forms of receivers and emitters, as well as their reception and emission conditions in the stochastic decision network.
The Name of the Receiver/EmitterGraphical Representation of the Form of Logical Reception and Emission of Activities (Arches)Conditions for the Reception and Emission of Activities (arcs) within the Structure of the Network
Receiver “AND” Symmetry 11 00398 i001The “AND” receiver of vertex y will be activated if and only if all the actions of u 1 u n entering it will be completed.
Receiver “inclusive-or IOR” Symmetry 11 00398 i002The receiver “or” of vertex y will be activated if and only if at least one of the actions u 1 u n entering it will be completed.
Emitter “deterministic” Symmetry 11 00398 i003The deterministic emitter of vertex y enables the carrying out of all actions u 1 u n from it, provided that the vertex has been activated.
Emitter “stochastic” Symmetry 11 00398 i004The stochastic emitter of vertex y allows the performance of only one of the actions u 1 u n from it with a certain probability, provided that the node has been activated. At the same time, the condition
j Γ i   p i j = 1
must be met where: Γ i is a set of direct successors.
Emitter “decision” Symmetry 11 00398 i005The y-vertex decision emitter only allows one of the actions u 1 u n that are outbound from it, provided that the vertex has been activated. The decision maker determines which task/action will be carried out.
Nodes in the model are created by connecting a receptor with an emitter. Connecting different emitter types of receptors defined in Table 1 makes it possible to obtain six different types of vertices, which are presented in Table 2.
Table 2. The six possible two-element network combinations.
ReceiverANDInclusive-Or IOR
Emitter
deterministic Symmetry 11 00398 i006 Symmetry 11 00398 i007
stochastic Symmetry 11 00398 i008 Symmetry 11 00398 i009
decision Symmetry 11 00398 i010 Symmetry 11 00398 i011
Table 3. The D set of possible solutions for the stochastic decision network of the refurbishment of the foundations of a building.
{ λ i j } 1234567891011121314151617181920
i-j
1–211111111111111111111
2–311111111111111111111
3–411111111111111111111
3–511111111111111111111
4–600111111111111111111
4–1111000000000000000000
5–910111111111000000000
5–901000000000111111111
6–700111111111111111111
6–800111111111111111111
7–800111000000111000000
7–1100000111000000111000
7–1400000000111000000111
8–1200100100100100100100
8–1200010010010010010010
8–1200001001001001001001
9–1011111111111111111111
10–1611111111111111111111
12–1300111111111111111111
13–1600111111111111111111
14–1500000000111000000111
15–1600000000111000000111
16–1711111111111111111111
Table 4. Comparison of the results obtained using the brute force method with the results obtained with APOPT solver for different levels of probability of reaching the vertices No. 11 and No. 17. (* Solutions were found by increasing probability by a small margin).
Results of Cost Optimisation at Different Probability LevelsResults of Time Optimisation at Different Probability LevelsThe Results of Two-Criteria Optimisation at Different Probability Levels
ProbabilityAPOPTBrute ForceAPOPTBrute ForceAPOPTBrute Force
Vertex 11>018,000.0018,000.006.006.000.7948720.794872
≥0.118,000.0018,000.00solution not found6.000.7948720.794872
≥0.218,000.0018,000.006.006.000.7948720.794872
Vertex 17>08555.568555.5610.3310.330.4859790.485979
≥0.18555.568555.5610.3310.330.4859790.485979
≥0.28555.568555.5610.3310.330.4859790.485979
≥0.3solution not found *8555.5610.3310.330.4859790.485979
≥0.48555.568555.56solution not found *10.330.4859790.485979
≥0.58555.568555.5610.3310.330.4859790.485979
≥0.6solution not found *8555.5610.3310.330.4859790.485979
≥0.78555.568555.5610.3310.330.4859790.485979
≥0.8solution not found *11,841.6712.3711.780.6838980.683426
≥0.911,841.6711,841.6712.3711.780.6838980.683426
=111,841.6711,841.6712.3712.370.6838980.683898
Table 5. Comparison of the values of expected completion times and costs of carrying out the final vertices for specific probabilities of carrying them out in the case of the stochastic network model and the stochastic decision network of the planned project of renovating foundations.
Stochastic NetworkStochastic Decision Network
No. of the Final VertexProbability of Being Carried OutExpected Cost of Completion [Monetary Units]Expected Completion Time [Days]The optimal Expected Completion Cost [Monetary Units]The Optimal Expected Completion Time [Days]Metacriterion for the Weights: w t , w c = 0.5
110.15521290.329.5818,000.00 for sub-networks: { λ i j } 1 6.00 for sub-networks: { λ i j } 1 0.795 for sub-networks: { λ i j } 1
170.84511891.6214.8511,841.00 for sub-networks: { λ i j } 20 11.78 for sub-networks: { λ i j } 7 0.683 for sub-networks: { λ i j } 8