Article

Full-Scale Experimental and Numerical Investigations on the Modal Parameters of a Single-Span Steel-Frame Footbridge

by
Izabela Joanna Drygala
* and
Joanna Maria Dulinska
Faculty of Civil Engineering, Cracow University of Technology, 31-155 Kraków, Poland
*
Author to whom correspondence should be addressed.
Symmetry 2019, 11(3), 404; https://doi.org/10.3390/sym11030404
Submission received: 29 January 2019 / Revised: 14 March 2019 / Accepted: 18 March 2019 / Published: 19 March 2019

Abstract

:
In this work, an examination on the modal properties of a single-span steel-frame footbridge is presented. The footbridge is situated in Jawornik (Lesser Poland). The footbridge is symmetrical since its main structure consists of two steel frames of the same shape. The boundary conditions for both frames are the same as well. The study was completed on the basis of numerical as well as experimental investigations. For finite element (FE) analysis, a 3-D model of the single-span steel-frame footbridge was created. For the experimental study, a research scheme for in situ tests was developed. Three kinds of excitation techniques were used during the in situ tests: shock excitation, operational vibration, and slow sine sweep testing. Different functions that estimate natural frequencies, i.e., the power spectral density function (PSD) and the frequency response function (FRF), were applied. The modal assurance criterion (MAC) was used as a mathematical tool for the verification of the mode shapes of natural vibrations obtained in experimental and numerical ways. Good compatibility was recognized between the results obtained for experimental and numerical procedures in terms of both the natural frequency and the mode of vibration. The identified and verified values of the five consecutive natural frequencies of the footbridge were smaller than 5 Hz, but they were recognized as being located outside the frequency range defined as having “maximum risk of resonance”. The numerical and experimental modal analysis revealed that all modes corresponding to the natural frequencies from the 0–5 Hz range have both a symmetrical and an anti-symmetrical nature. In particular, the first vertical mode, which can play a central role from the serviceability of the footbridge point of view has a symmetrical shape. The results of the research might be applicable to the dynamic study of the structure type considered in the analysis, i.e., for the dynamic assessment of a single-span steel-frame footbridge with a relatively large mass as well as stiffness. The investigation proved that ambient vibration modal experiments are enough for the experimental investigation of the modal properties of the structure.

1. Introduction

The dynamic behavior of pedestrian bridges is a significant factor which must be studied by the creators of these structures. Even though static and serviceability requirements are significant issues, dynamic aspects of the planning of footbridges are more challenging in the vast majority of cases [1,2,3,4]. In particular, the use of advanced materials, optimization techniques, and technologies has an effect on the dynamic serviceability of modern footbridges [5,6,7,8,9]. As a consequence of their low levels of stiffness, a great number of current pedestrian bridges have their first natural frequency within the range that is typical for dynamic loading generated by users during walking or running [2,10]. Taking into consideration the primary function of the pedestrian bridges, the risk of the resonance phenomenon occurring has to be discussed for this type of structure [11,12,13,14,15,16,17,18,19,20,21,22,23,24]. In general, the estimation of the modal properties of footbridges is the main component of the general dynamic evaluation of these structures [25,26,27,28]. It must be pointed out that this part of the dynamic investigation has significant value for the design stage of construction as well as being required prior to approval of the structure for public usage, i.e., proof load testing (conduct in order to validate that a structure can carry the design loads) and acceptance tests (conducted before a bridge structure is accepted for exploitation).
A literature review proves that many researchers who carry out experimental tests on dynamic characteristics of footbridges use different sources of excitations to measure the vibrations of these structures. In particular, the experiments are based either on intentional shock excitations (i.e., a drop of heavy mass or jumping of a group of people) or operational analyses (i.e., wind excitation, traffic excitation or pedestrians walking). On the one hand, the operational analysis is performed on ambient vibrations, which are executed during the normal serviceability of the footbridge. Hence, for comfort criteria assessment this type of analysis appears to be more adequate. On the other hand, footbridges may undergo some exceptional excitation, like vandalism or demonstrations. They also can be exposed to strong kinematic excitations, like earthquakes, if located in seismic zones. In such cases, the modal analysis based on strong energy sources seems to be more reliable.
The objective of this study is to find and quantify the differences in values of natural frequencies, modes of vibrations and damping ratios, obtained on the basis of experiments in which different sources of excitations were used. Furthermore, the dynamic characteristics found on a numerical way are assessed, taking into consideration the results of the in situ experiments.
In particular, the investigation of the dynamic characteristics (natural frequencies, mode shapes of natural vibrations, and logarithmic decrements of damping) of a single-span steel-frame footbridge is presented in this paper. The pedestrian bridge located above the national road in Jawornik (Lesser Poland) was chosen for the study [18]. The footbridge is symmetrical since its main structure consists of two steel frames of the same shape. The boundary conditions for both frames are the same as well. Three experimental modal models and one numerical modal model were constructed. For the experimental modal models, different types of loading were used. These were shock excitation, operational vibration of the studied footbridge, and slow sine sweep testing. In the case of the numerical modal model, finite element analysis with the ABAQUS/Standard software program was performed [29]. The Modal Assurance Criterion ( MAC ) was used for the verification of the numerical and experimental modal models. For a given set of modal modes, the MAC matrix is symmetrical. From a mathematical point of view, the analysis of the “level of symmetry” that could be recognized in MAC matrixes was used to provide feedback about the compatibility of the numerical as well as experimental modal models. It should be pointed out that this approach made it possible to verify the numerical results as well as to validate the finite element (FE) model of the footbridge. The numerical and experimental modal analysis revealed that all modes corresponding to the natural frequencies from the 0–5 Hz range have both a symmetrical and an anti-symmetrical nature. In particular, the first vertical mode, which can play a central role from the serviceability of the footbridge point of view, has a symmetrical shape.
This paper is systematized as follows: Section 2 provides the literature review. Section 3 introduces the terminology and the main assumptions of the adopted methodology as well as providing essential information about the structural layout of the footbridge and experimental setup. Section 4 and Section 5 combine the results from the experimental and numerical modal assessments. Finally, Section 6 presents the main conclusions from the research.

2. Related Works

Previous studies that considered the dynamic aspects of pedestrian bridges were prepared for a variety of purposes. It is worth noting that investigations of these structures have been conducted by both commercial organizations and academic researchers. The main group of research interests was focused on the dynamic response of footbridges to usage-generated loading. A literature review that summarizes the most important issues regarding the usage-generated excitation of footbridges was presented in this work [10]. However, other dynamic influences were also discussed. In the work presented in [25], the authors delivered the results of the aerodynamic response of the footbridge. A seismic assessment of the cable-stayed footbridge was presented in [30].
A correlation of finite element method (FEM) solutions with measured dynamic properties as well as the structural health monitoring (SHM) of footbridges are other significant aspects of this type of structure. In paper [27], an experimental modal model was used for the validation of an FE model of the investigated structure. This approach made it possible to predict the reliable influence of the tuned mass dampers for the dynamic serviceability of the footbridge under pedestrian excitation, which was the main purpose of the analysis [27]. Vibration-based monitoring is also an efficient tool which is used for SHM procedures. However, this technique requires a suitable number of accelerometers as well as the application of effective ways to interpret collected data. In paper [28], the authors delivered an analysis of the vibration serviceability of an in-service footbridge. Firstly, ambient vibration tests were conducted. On the basis of registered data, an operational modal analysis was prepared. The footbridge dynamic response under pedestrian excitation was then completed since the comfort criteria assessment was the main purpose of the research [28].
In general, the methodology and technology of modal testing have become extensively developed and practiced since the 1980s. The major requirements of modal testing were addressed as follows: the theoretical basis of vibration, accurate measurement of vibration, and carrying out realistic and detailed data analysis. In the book presented in [30], the primary assumption as well as proposals for application in terms of planning, execution, application, and interpretation of the results of modal tests are discussed. In particular, the approach for the modal experiments with slow sine sweep excitation is described. The shock response spectrum is considered in work [31]. The advantages, disadvantages, and limitations are widely described. Finally, the mathematical tools for the analysis and interpretation of collected data during a mechanical shock are provided. The essential information and theoretical background for operation modal analysis (OMA) are delivered in work [32]. The procedures and methodology for experiments involving ambient vibration are summarized in [32].
In work [20], numerical and experimental evaluations of the modal properties of a cable-stayed footbridge are presented. The investigation was carried out on a slender, cable-stayed footbridge whose primary purpose is to transport pedestrians above the river. In the study, different types of dynamic excitation were used. Hence, the appropriate mathematical tools were applied in order to estimate modal properties. Finally, six eigenpairs with eigenvalues within the 0–5 Hz frequency range were successfully identified. Strong agreement was found between the experimental methods in terms of mode shapes, natural frequencies, and damping ratios. In this study, a similar methodology was used for the modal property assessment of another structure—the single-span steel-frame footbridge.

3. Materials and Methods

3.1. Concepts and Methods of the Investigation

In bridge engineering, the application of modal testing has significant importance. Especially, for pedestrian bridges, dynamic properties estimation is an important stage of structure assessment. The studied footbridge, whose primary structural system consists of two steel frames, is not typical. The total mass of the relatively small footbridge is unusually substantial since it equals about 400 t. On the other hand, the structure is very stiff in relation to typical (usually suspended) footbridges—steel frames have rigid nodes, they are fixed at foundations, and some parts of the frames are permanently combined with the deck forming a steel-concrete composite. Hence, the strategy of experimental investigation needed to take strong excitations into consideration. Otherwise, errors could appear in the obtained results of the modal analysis.
In Figure 1, the general concept with the main stages of research is presented. The modal properties of the footbridge were assessed on the basis of data taken from experimental as well as FEM studies.
The numerical modal model was assembled using the ABAQUS/Standard software program. The modal properties of the footbridge, i.e., the natural frequencies and modes of vibration, were extracted using a linear numerical procedure with the Lanczos algorithm [29]. However, the geometric nonlinearity, produced by the gravity load stiffness effects, was also taken into consideration.
The main purpose of the experimental part of the work was to assess the natural frequencies, modes of vibration, and logarithmic decrements of damping of the footbridge. Three experimental modal models were compiled during in situ tests (see Figure 1). The modal properties of the structure were estimated on the basis of data collected during the vibration of the structure generated by three types of loading: shock excitation (loading generated through the dropping of a pallet with paving stones of 1500 kg weight), ambient vibration (dynamic excitation under normal operating conditions of the footbridge without loading generated by pedestrians), and slow sine sweep testing (loading produced through the use of the THOMAS vibroseis apparatus).
In the three studies mentioned above, standard techniques were adopted for modal identification. The most common and least expensive excitation technique is the one in which ambient vibrations are used. However, the studied structure is very stiff in comparison with other typical footbridges. To execute strong enough output signals for the modal analysis, a strong source of vibration was needed. Hence, the authors decided to use shock vibration as well as the Thomas apparatus (see Figure 2) for modal identification. Additionally, the advantage of the shock excitation is that signals registered as the dynamic responses of a structure can easily be used for the evaluation of damping properties. Next, the advantage of using the THOMAS apparatus is that a shaker is the mechanism of excitation, the frequency, and force of which can be steered and controlled. So, experiments with shakers, unlike operational analysis, are repeatable. Hence, potential errors in particular tests can be ruled out. The primary dimensions of the THOMAS apparatus are shown in Figure 2. The total mass of the apparatus is equal to 32,000 kg, and the range of excitation frequencies is 2–250 Hz.

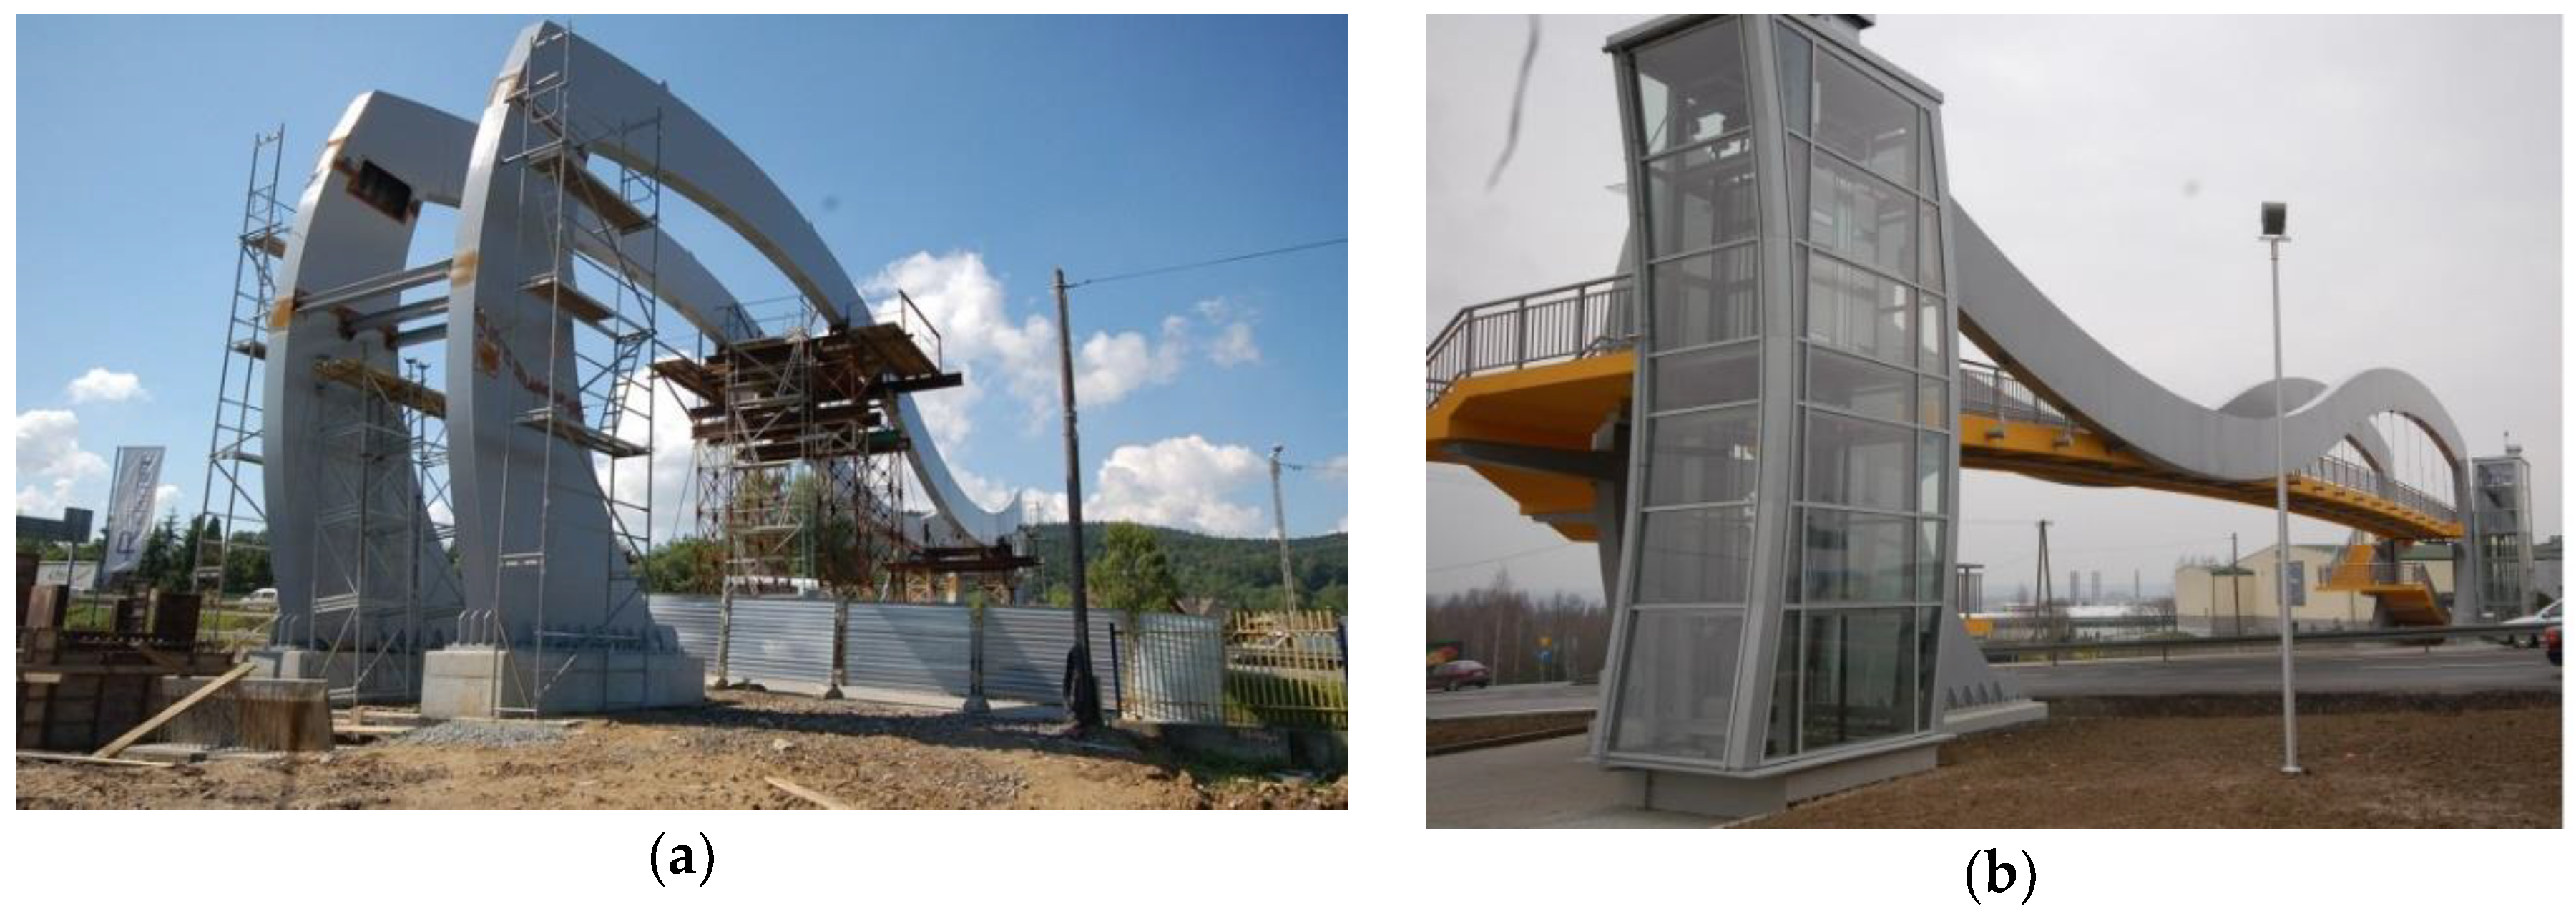
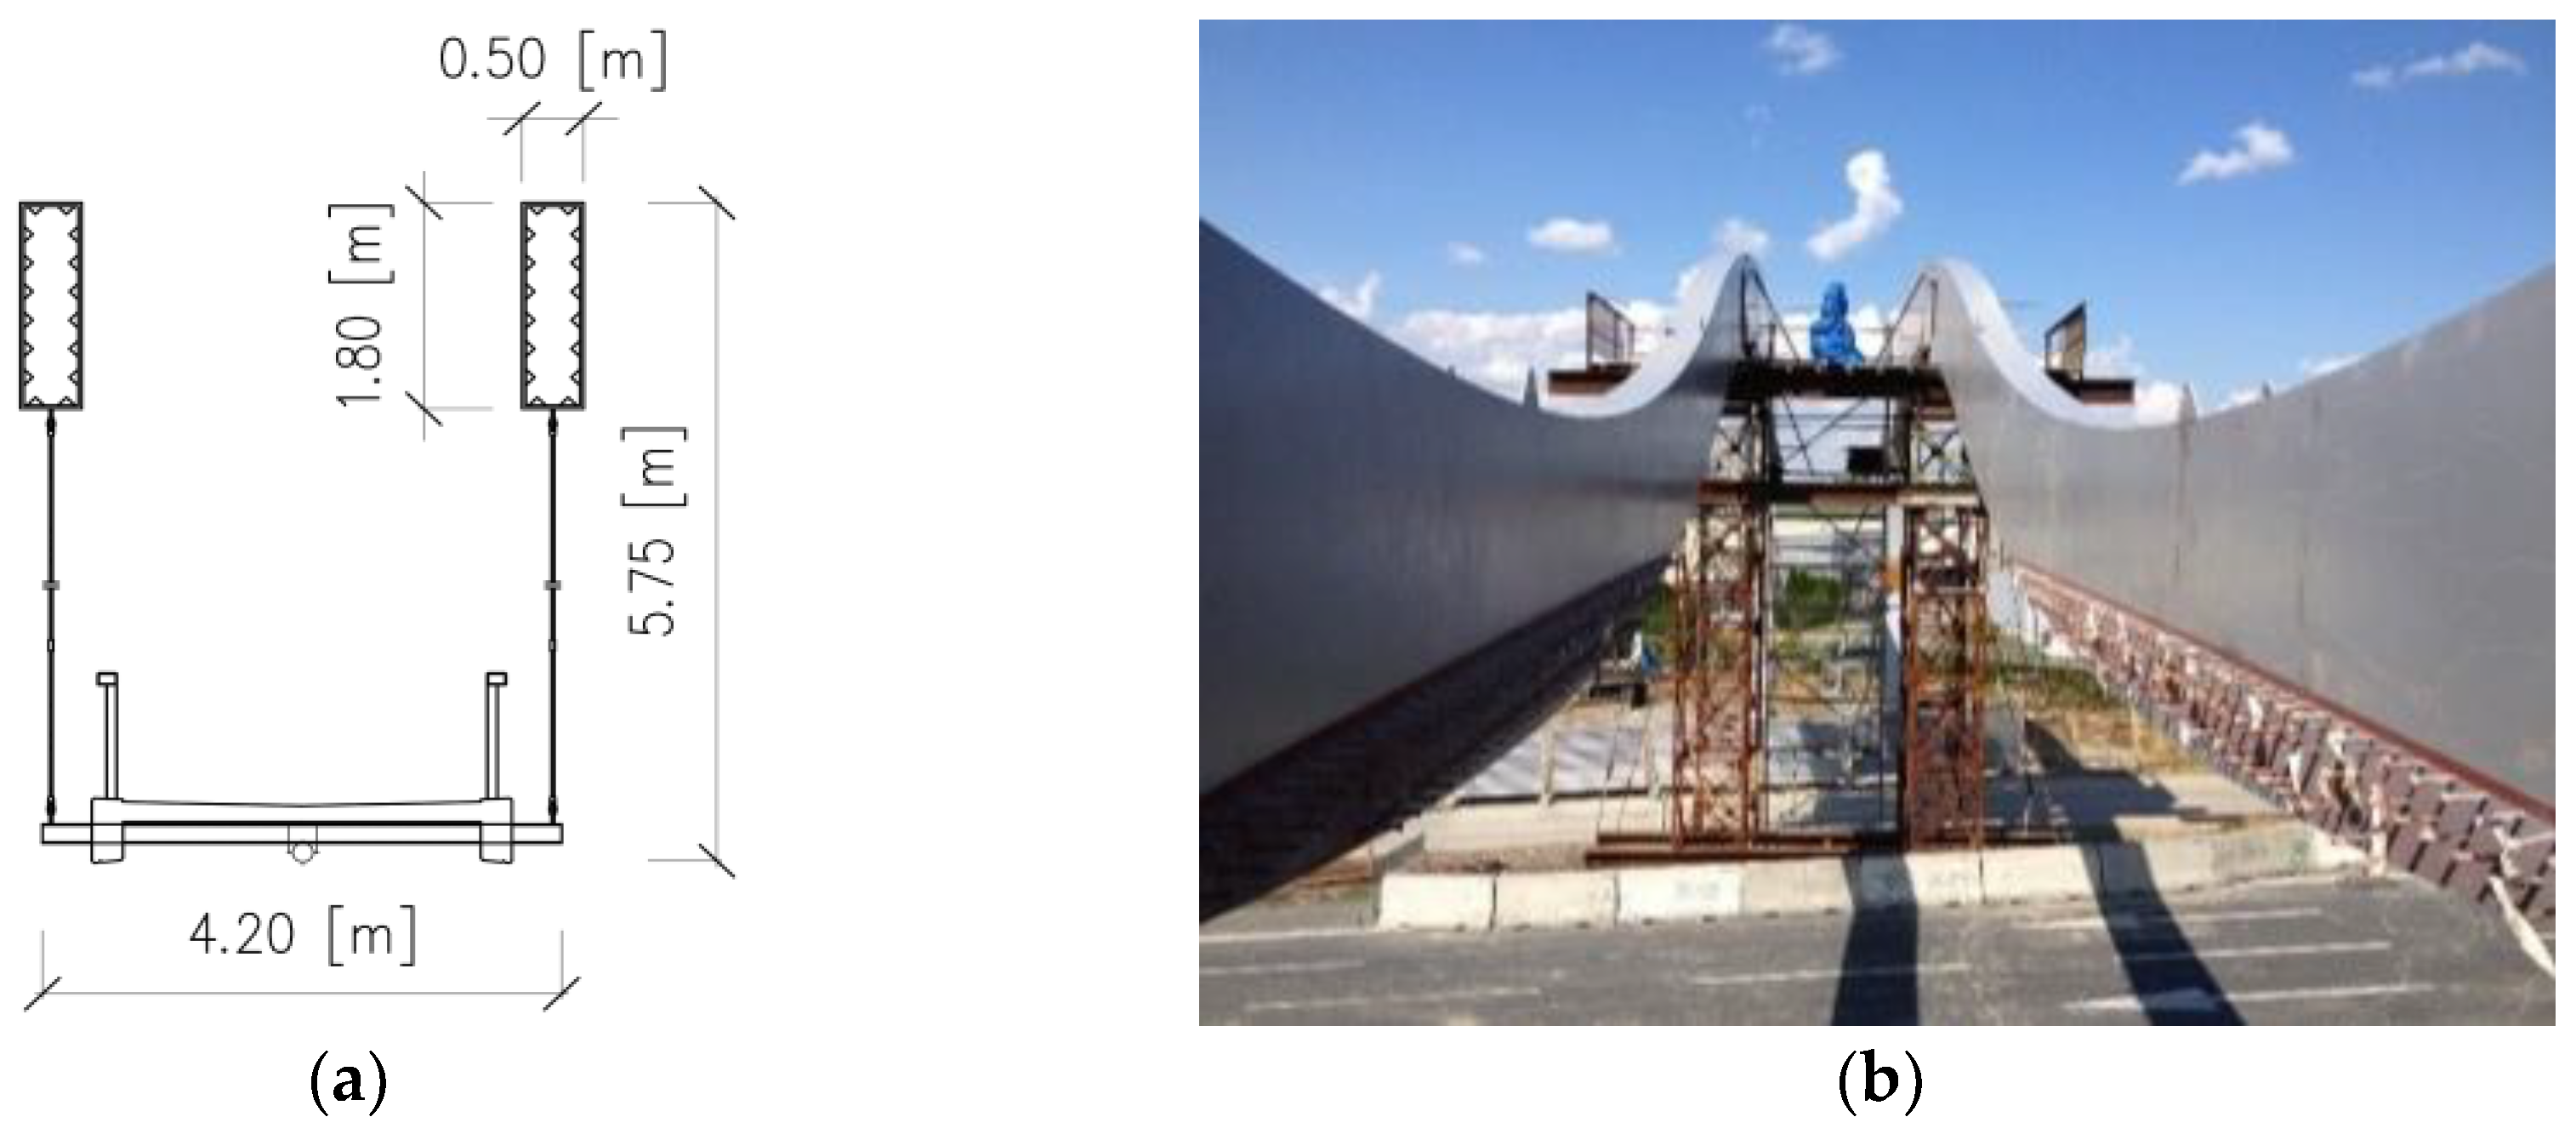
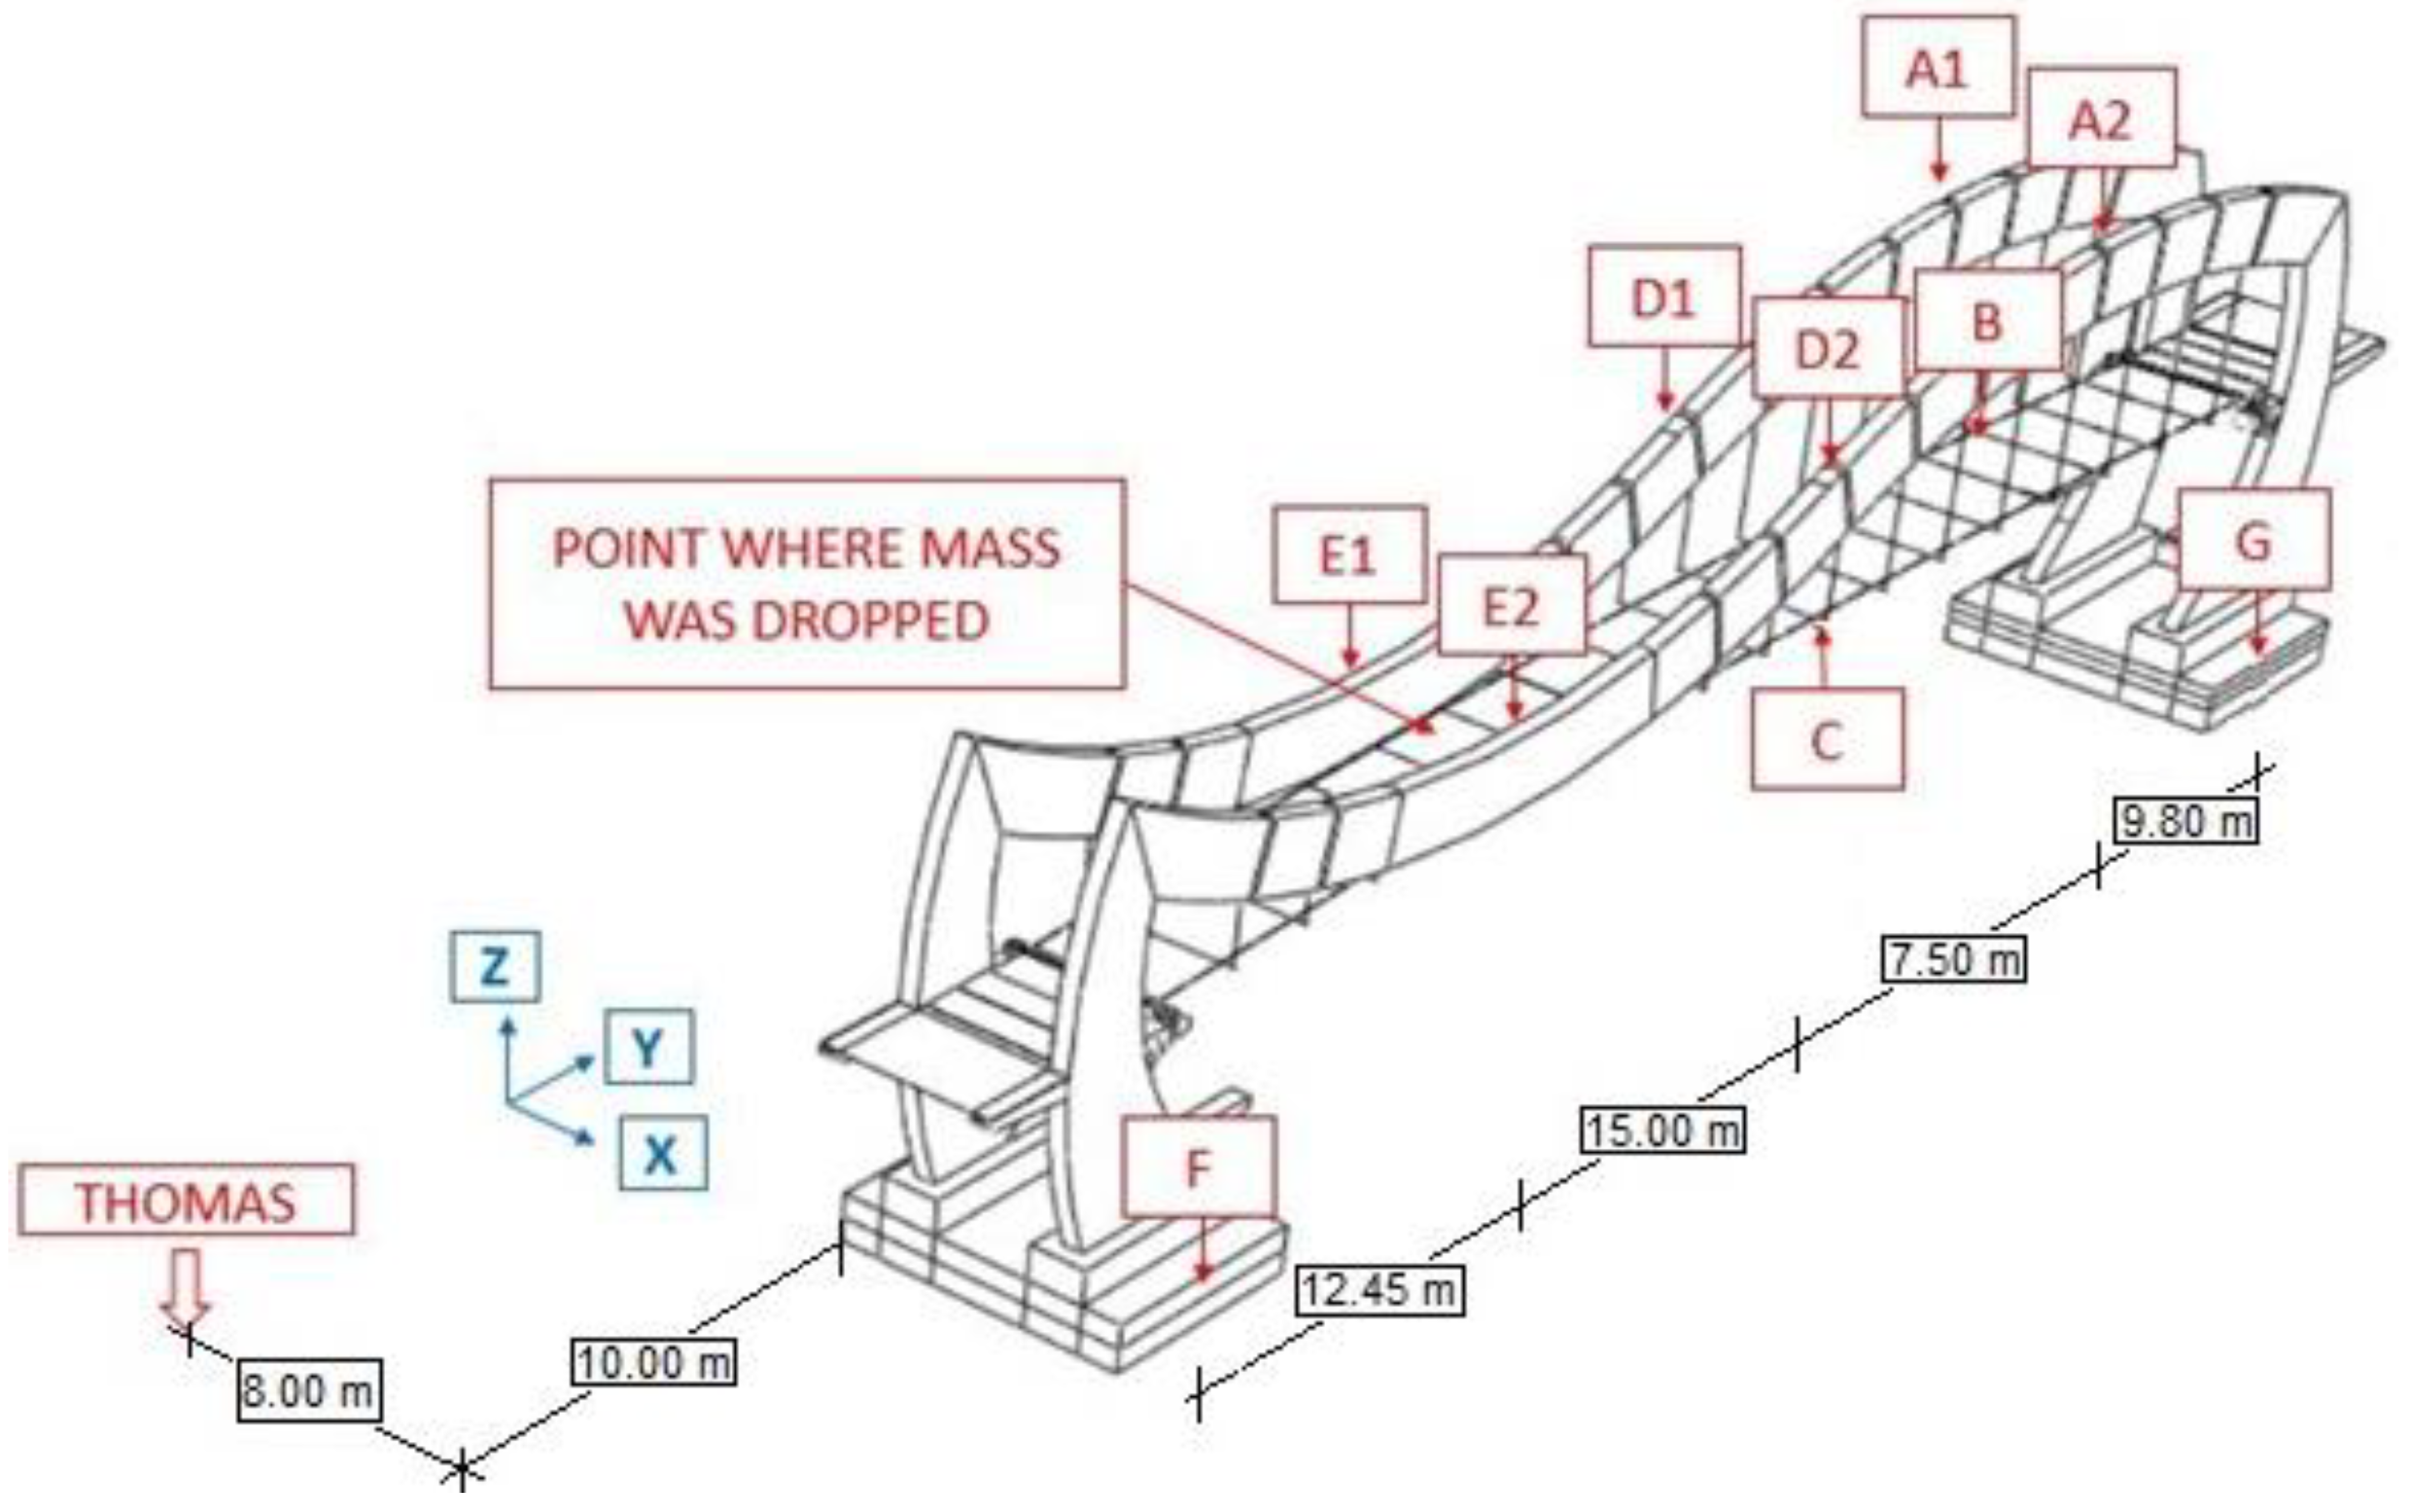
3.2. Structural Layout of the Footbridge and Experimental Setup

A single-span steel-frame pedestrian bridge was chosen to achieve the aims of the present study. The footbridge is shown in Figure 3. The structure is located in Lesser Poland and it transports people above the S7 national expressway. The structure was erected in 2014, and it was designed according to Polish national standards [18].
The structural layout of the footbridge is presented in Figure 4 and Figure 5. The primary structural system is mainly composed of two symmetrical steel (S355) frames. The steel frames are constant box sections (see Figure 5a) with 30.00 mm wall thickness. The footbridge deck (16.00 cm thickness) is a steel-reinforced concrete slab (C30/37) supported by steel-reinforced concrete girders (C30/37) and steel cross bars (S355). The deck is attached to the steel frames with elastomeric bearings and steel hangers (Macalloy M30) as linking elements. The steel hangers have a spacing of 2.50 m. Parts of the frames are also permanently combined with the footbridge deck, forming a steel-concrete composite. The total length of the steel frames (a distance between the extreme right point and the extreme left point located on the right and left columns, respectively) is 50.50 m, and they are fully fixed in the steel-reinforced concrete pile cups. The structure is founded on steel-reinforced concrete piles (1.20 m diameter). The analyzed structure is relatively stiff in comparison with other typical footbridges. The displacements obtained in the acceptance test were significantly smaller than those received for other typical suspended footbridges erected over the same motorway in the last decade. The static load that was applied during the acceptance test was realized by a set of pallets with paving stones. The total load that was completed in this way was equal to 86.00% of the design static load (a crowd of people, i.e., 4.00 kN/m2). The maximum value of displacement was 8.64 mm, and this was achieved in the middle span of the footbridge.
The locations of the measurement points, the THOMAS vibroseis apparatus, and the point where the mass was dropped are shown in Figure 6. The measurement points were assembled from three piezoelectric high sensitivity accelerometers (393B12 PCB Piezotronics, 10,000 mV/g) since the signals were registered in the X ,   Y (horizontal) and Z (vertical) directions. All accelerometers were wire-connected. The frequency range was from 0.15 to 1 kHz. The Z direction represented the axis vertical to the deck of the footbridge, the Y direction represented the axis located along the deck of the footbridge, and the X direction represented the axis perpendicular to the longitudinal axis of the footbridge. At every control point, the values of vibrations in three directions were recorded. Data sampling of the signal showed a frequency of 1024 Hz. The B and C measurements points were located directly on the footbridge deck. The measurements points A 1 , A 2 , B , C , D 1 , D 2 , E 1 and E 2 were located on the steel frames. However, the points E 1 and E 2 were placed on the parts of the frames that are permanently combined with the footbridge deck. Measurement points G and F were located on the foundations of the structure.

3.3. Preliminaries

A set of mathematical tools and functions was applied for the analysis of the obtained signals [20]. For the first modal model (see Figure 1), the theory of random vibrations was used [30,31]. In this part of the experiment, power spectral density function ( P S D ) was calculated for all collected signals. The power spectral density function ( P S D ) was prepared for all output measurement points ( A 1 , A 2 , B , C , D 1 , D 2 , E 1 , E 2 ). The P S D function is provided by the equation below:
S x x ( f ) = R x x ( τ ) e j 2 π f t d t ,
where R x x is the autocorrelation for the x ( t ) signal registered in one of the output measurement points.
For the second modal model case (data collected during ambient vibration loading), the natural frequencies of the footbridge were obtained on the basis of the estimator, which was obtained as the summation of all combinations of auto- and cross-spectral density functions between all output data registered in measurement points ( A 1 , A 2 , B , C , D 1 , D 2 , E 1 , E 2 ) [32]. The cross-spectral density function ( CSD ) is defined as follows:
S x y ( f ) = R x y ( τ ) e j 2 π f t d t ,
where R x y is the cross-correlation for x ( t ) and y ( t ) signals registered in one of the output measurement points.
The third experimental modal model is based on dynamic loading generated by the THOMAS vibroseis apparatus shown in Figure 2. The THOMAS apparatus can generate vibrations of the ground by a movable plate striking the ground. These vibrations are transmitted to the foundations of a structure. The apparatus can generate vibrations of constant frequency (from 2 to 250 Hz). It also may execute sweeps, i.e., vibrations of frequency that linearly or exponentially fluctuate in the time domain. Before the in situ experiments, the apparatus was tested on programming sweeps with maximum amplitudes of vibration for the lowest frequencies. The characteristics of the linear and exponential sweeps generated by THOMAS apparatus are shown in Figure 7a,b, respectively. The main parameters of the sweeps were the time–frequency dependence and the short-time Fourier transform ( STFT ). They illustrate the intensity of the obtained signals and the time period of low frequencies registered at the footbridge support (F, see Figure 7). It is clearly visible in Figure 7 that better time–frequency characteristics (in terms of generating low frequencies with higher amplitudes) were obtained from the exponential sweep.
For the data produced during this experiment, the frequency response function ( FRF ) was extracted as a sum of the transfer functions of every combination of output- and input-registered signals for the Y (horizontal direction) and Z (vertical direction) [30]. The transfer function H ( f ) is delivered by
H ( f ) = S x y ( f ) S x x ( f ) ,
where S x y is the cross-spectral density for x ( t ) and y ( t ) signals; S x x is the power spectral density for x ( t ) , the input signal; and y ( t ) is the output signal.
The peak picking method was used as the method for the estimation of natural frequency values. The principal assumption of the peak picking method is that, for resonance, the value of the function, which is obtained as an estimator of the natural frequencies for the system, has a maximum value. The frequencies for which extreme values of the estimator appeared were identified as being the eigenfrequencies of the structure. Then, for estimated eigenvalues, the mode shapes, as well as the logarithmic decrements of damping, were obtained. At this stage of the study, the band-pass filter was applied [20].
The modal assurance criterion ( MAC ) was used as a mathematical tool for the verification of the obtained mode shapes from all modal models [30,33,34,35]. The M A C values for the i and j eigenvectors were extracted on the basis of the following equation:
M A C ( i , j ) = ( { Ψ i } T { Ψ j } ) 2 ( { Ψ i } T { Ψ i } ) ( { Ψ j } T { Ψ j } ) ,
where Ψ i , Ψ j are modal vectors. For duplicate mode shapes, the M A C ( i , j ) index has a value equal to 1; for different eigenvectors, the M A C ( i , j ) index has a value equal to 0. In practice, the boundaries of the M A C ( i , j ) values, which verify modal model positively, were quoted as being greater than 0.8 and less than 0.2 [30]. Firstly, the M A C ( i , j ) was used to check whether the locations of the measurement points and the selection of degrees of freedom ( DOF ) of experimental models were sufficient. At this stage of the study, the experimental sets of mode shape vectors were correlated with themselves. This version of the M A C ( i , j ) is commonly known as A u t o M A C [30]. Secondly, the MAC theory was used for the verification of the experimental modal models and for the comparison of each modal model. Finally, the M A C ( i , j ) was used to validate the numerical model of the footbridge (see. Figure 1).

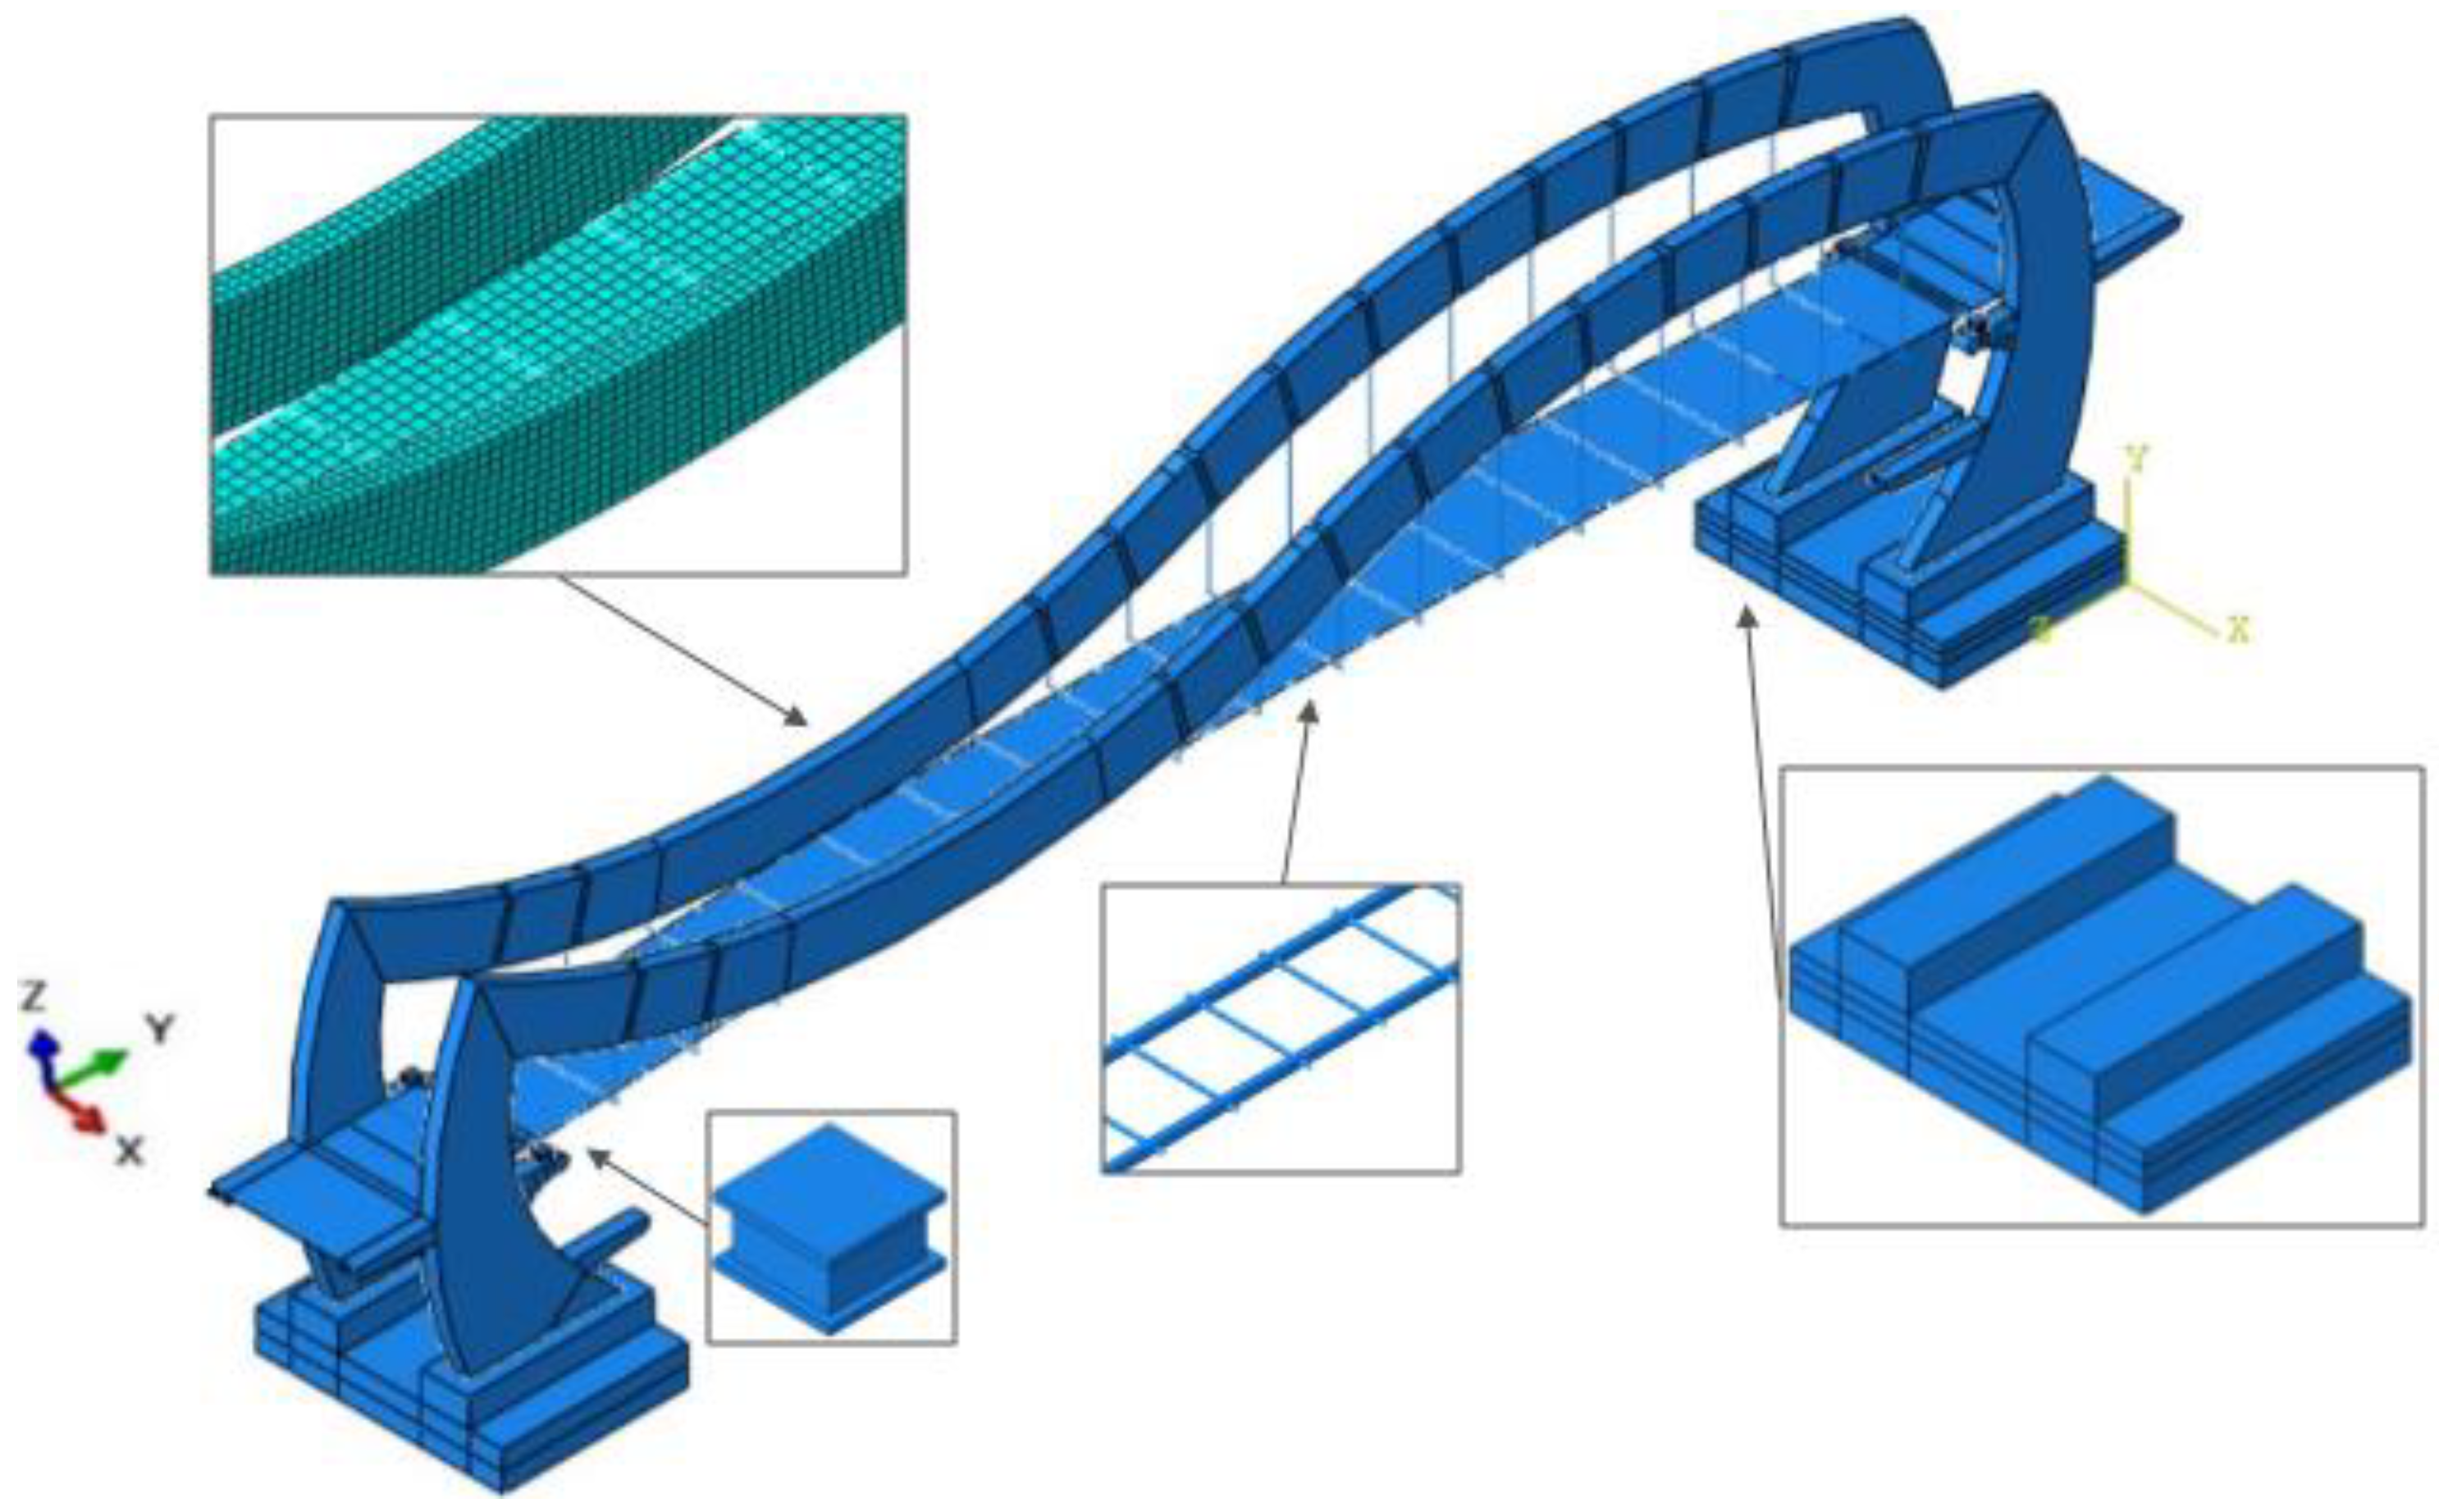
3.4. Finite Element (FE) Model of the Footbridge

For the numerical part of the study, a 3-D finite element (FE) model of the structure was assembled with the ABAQUS software program. In the FE model, the structural parts of the footbridge were represented as follows: the steel-reinforced concrete deck and the steel frames by shell elements, the steel-reinforced concrete girders and the steel crossbars by beam elements, the steel-reinforced concrete pile cups and the steel-reinforced elastomeric bearings by solid elements, and the steel hangers (Macalloy M30) by truss elements. In the FE model of the pedestrian bridge, suitable constraints were applied, including the differences in the number of degrees of freedom at the nodes of the solids, beams, and shells. Fixed boundary conditions, suitable for the high rigidity of the foundations, were applied at the end of the steel-reinforced concrete pile cups of the structure. For the steel frames and a steel-reinforced concrete deck of the footbridge, type S4R linear quadrilateral elements were applied. In the foundations and bearing cases, type C3D20R quadratic hexahedral elements were used. The linear line elements of type B31 were used for the girders and crossbars. The total size of the FE model was 83,085 nodes and 39,233 elements. The FE model with some details of the structure (i.e., frame foundation, elastomeric bearing, the steel grid of the deck, and the fragment of the mesh) is presented in Figure 8.
Elastic truss elements with no compressive stiffness were applied for the steel hangers to ensure that compressive stresses would not be produced during numerical dynamic analysis [29]. However, when this “no compression” option is used, the instability of the FE model is usually recognized. This numerical procedure error was repaired by overlaying each truss element with the “no compression” option with another beam element with low compression stiffness. This method enables a stiffness level greater than zero to be obtained, which has the effect of stabilizing the FE procedures. In the FE model, all hangers were modeled as trusses (T3D2) with the “no compression” option. For the FE model, stabilization beam elements (B31) were introduced. A level of 5% was selected for the hanger stiffness to stabilize the calculations. ‘Tie’ constraints were used to ensure identical kinematic behavior of the beam and the truss elements. For the hangers, a modulus of elasticity of 205 GPa was adopted. A Poisson’s ratio of 0.29 was used.
The steel-reinforced concrete deck was equipped with elastomeric bearings, which are one of the linking elements between the girders and the steel frames. Usually, the Mooney–Rivlin theory is used as a nonlinear constitutive model for hyper-elastic elastomeric material. However, for the numerical linear procedure, some simplifications can be assumed. Hence, the parameters of the Mooney–Rivlin material model (C10 and C01) were represented by the equivalent elasticity modulus: E = 6 (C10 + C01) [36]. In the FE model of the investigated footbridge, these parameters (adopted as C10 = 0.292 MPa and C01 = 0.177 MPa [36]) represented the equivalent elasticity modulus (2.814 MPa). It must be pointed out that the parameters of the material of elastomeric bearing were assumed strictly on the basis of the real dimensions of bearings, which were installed in the structure. The Poisson’s ratio of the elastomeric material was assumed to be 0.49.

4. Results

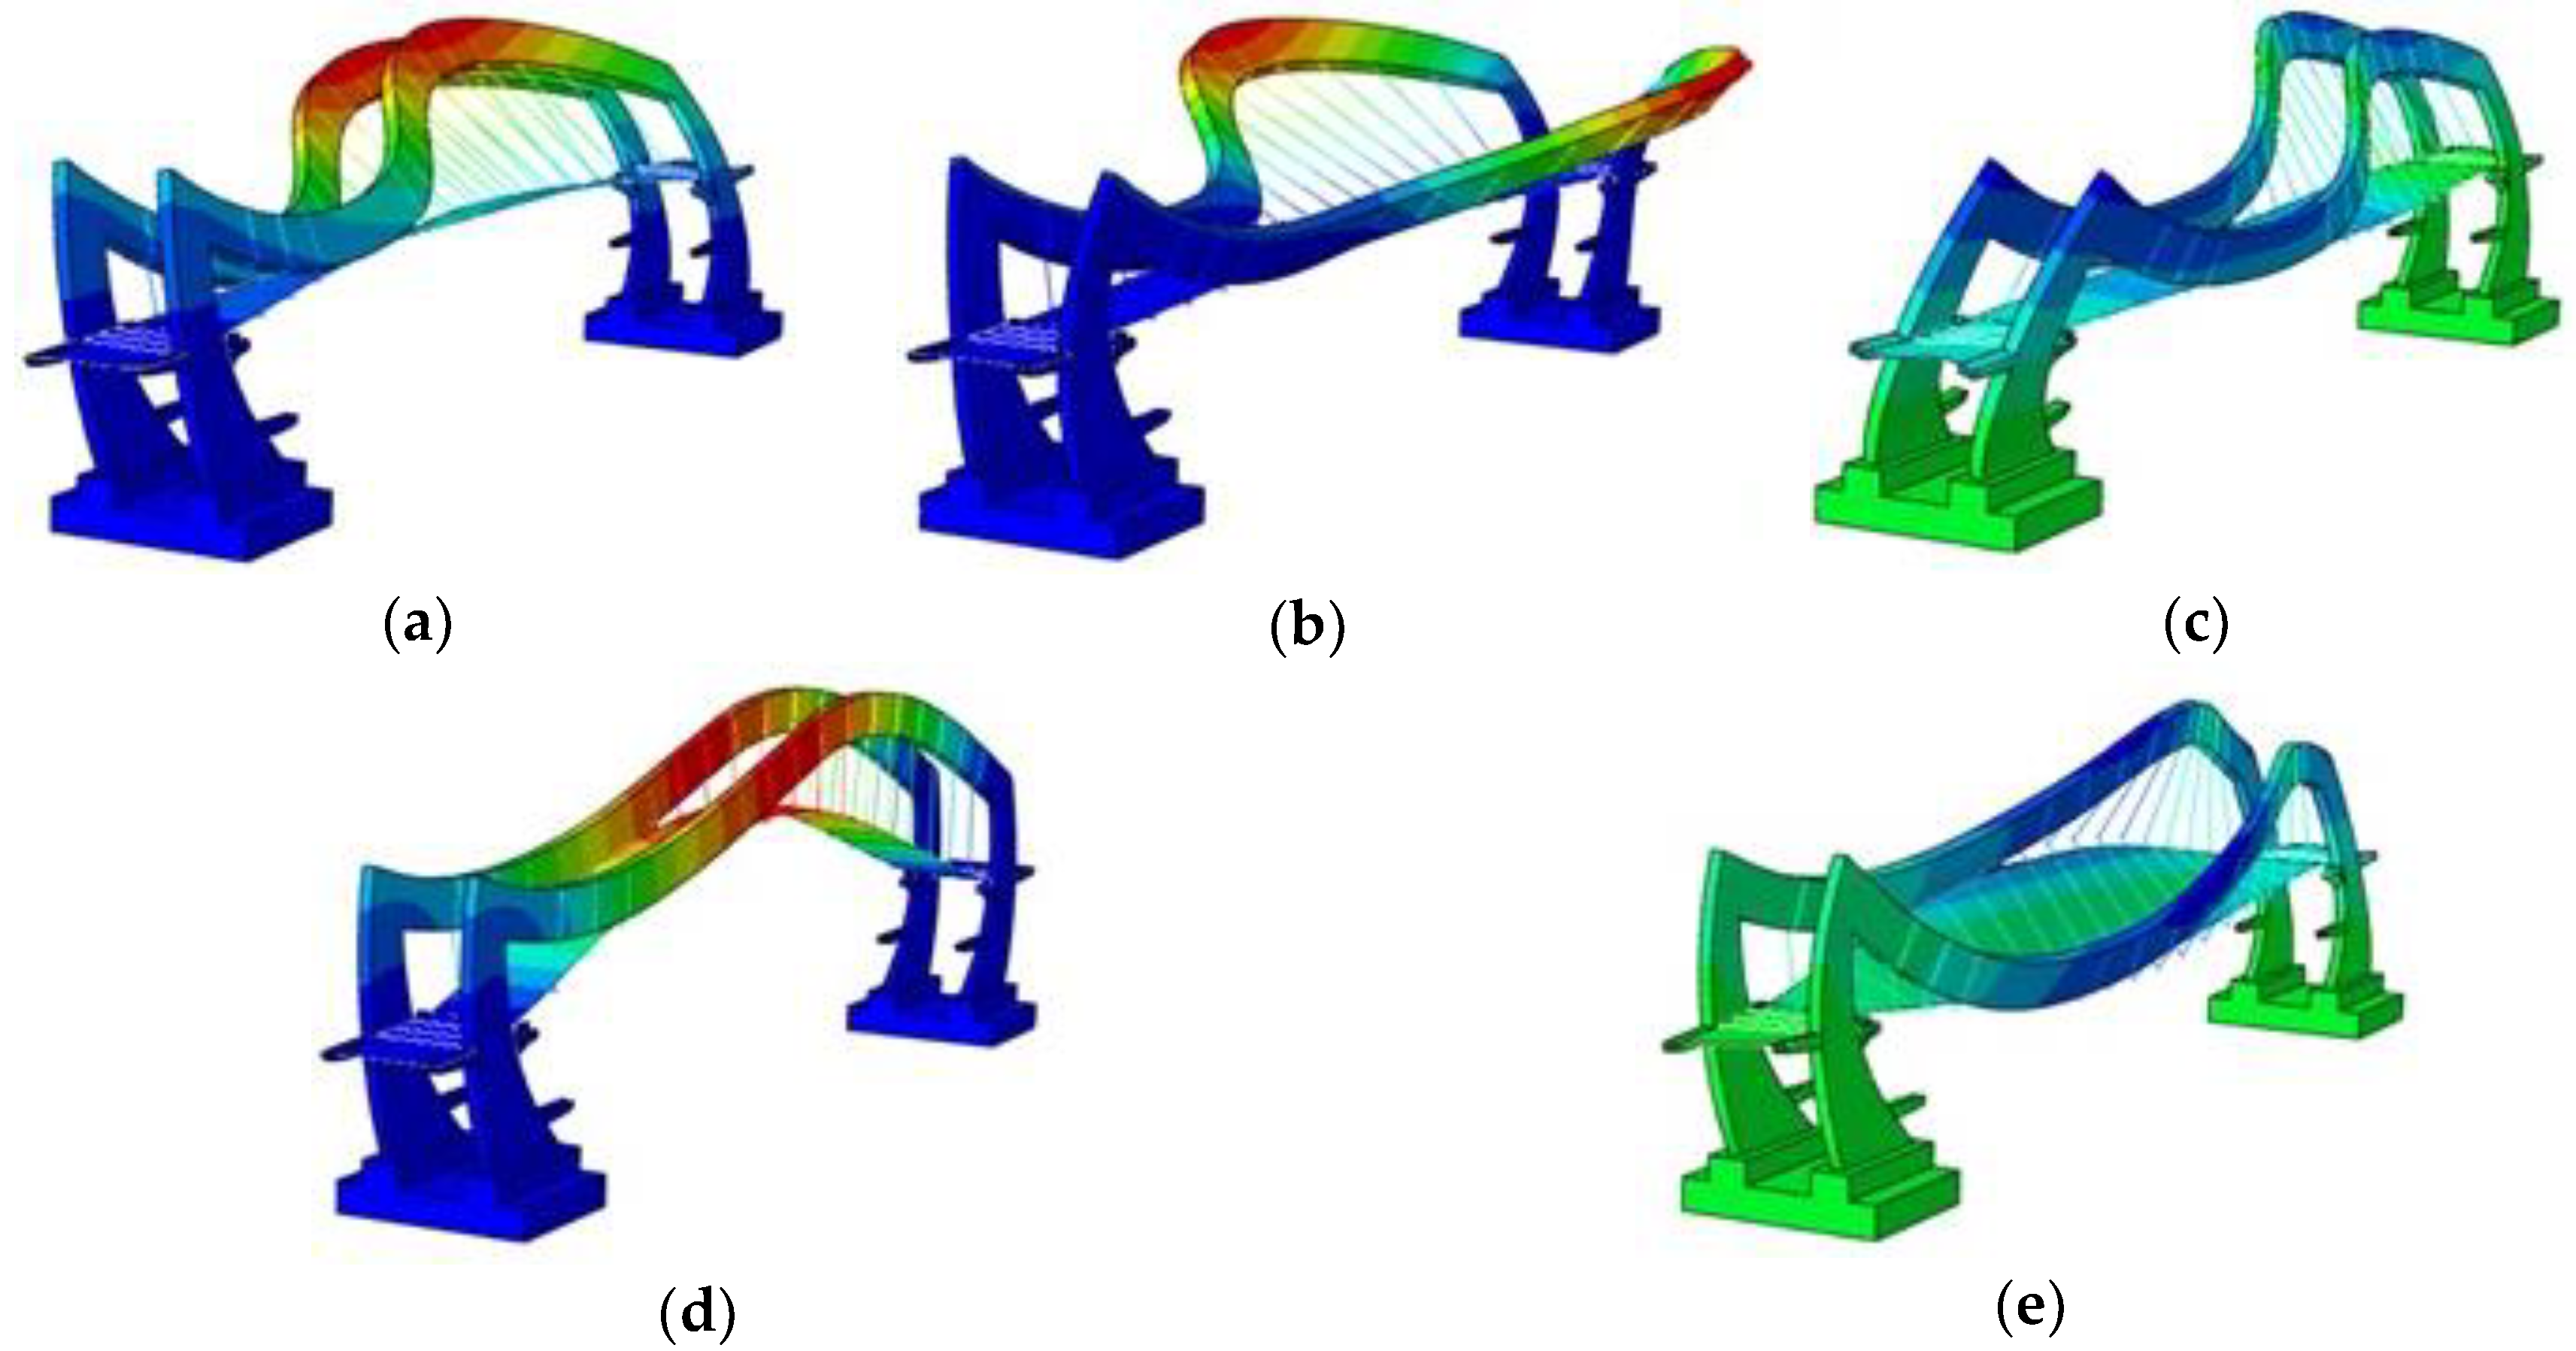
4.1. Numerical Calculation of Natural Frequencies and Modes of Vibration of the Footbridge

As the result of the study, the set of natural frequencies, mode shapes of natural vibrations, and damping ratios were estimated. The dynamic properties were assessed on the basis of the experimental as well as theoretical modal models (see Figure 1). It must be pointed out that only the frequencies between 0 and 5 Hz were taken into consideration since this range is noted in the literature and current regulations as critical being for footbridges [13]. In this range, five mode shapes were verified. The natural frequencies estimated through the numerical investigation are summarized in Table 1.
In Figure 9, the recognized modal shapes are presented as the results of the numerical investigation. The first, second, and third natural modes represented transverse vibrations of the steel frame, whereas the fourth and fifth modes were connected with the deck vibration—vertical and torsional, respectively. The numerical modal analysis revealed that all modes corresponding to the natural frequencies from the 0–5 Hz range have both a symmetrical and an anti-symmetrical nature. In particular, the first vertical mode, which can play a central role from the serviceability of the footbridge point of view, has a symmetrical shape.
The values of the first, second, and third natural frequencies were located outside the frequency range defined as a “maximum risk of resonance” for horizontal direction (i.e., 0.5–1.1 Hz) according to the SÉTRA document [13]. The frequency corresponding to the first vertical mode shape, which equaled 3.41 Hz, was also placed outside the resonant frequency range for the vertical direction (i.e., 1.3–2.5 Hz); hence, the “low risk of resonance for standard loading situations” [13] appeared. However, the value of this frequency can correspond with the vertical loading generated during very fast running or jumping [2,10,13]. It must be pointed out that this type of loading is not typical for standard usage of pedestrian bridges, especially for footbridges located above the highway in sparsely populated areas.

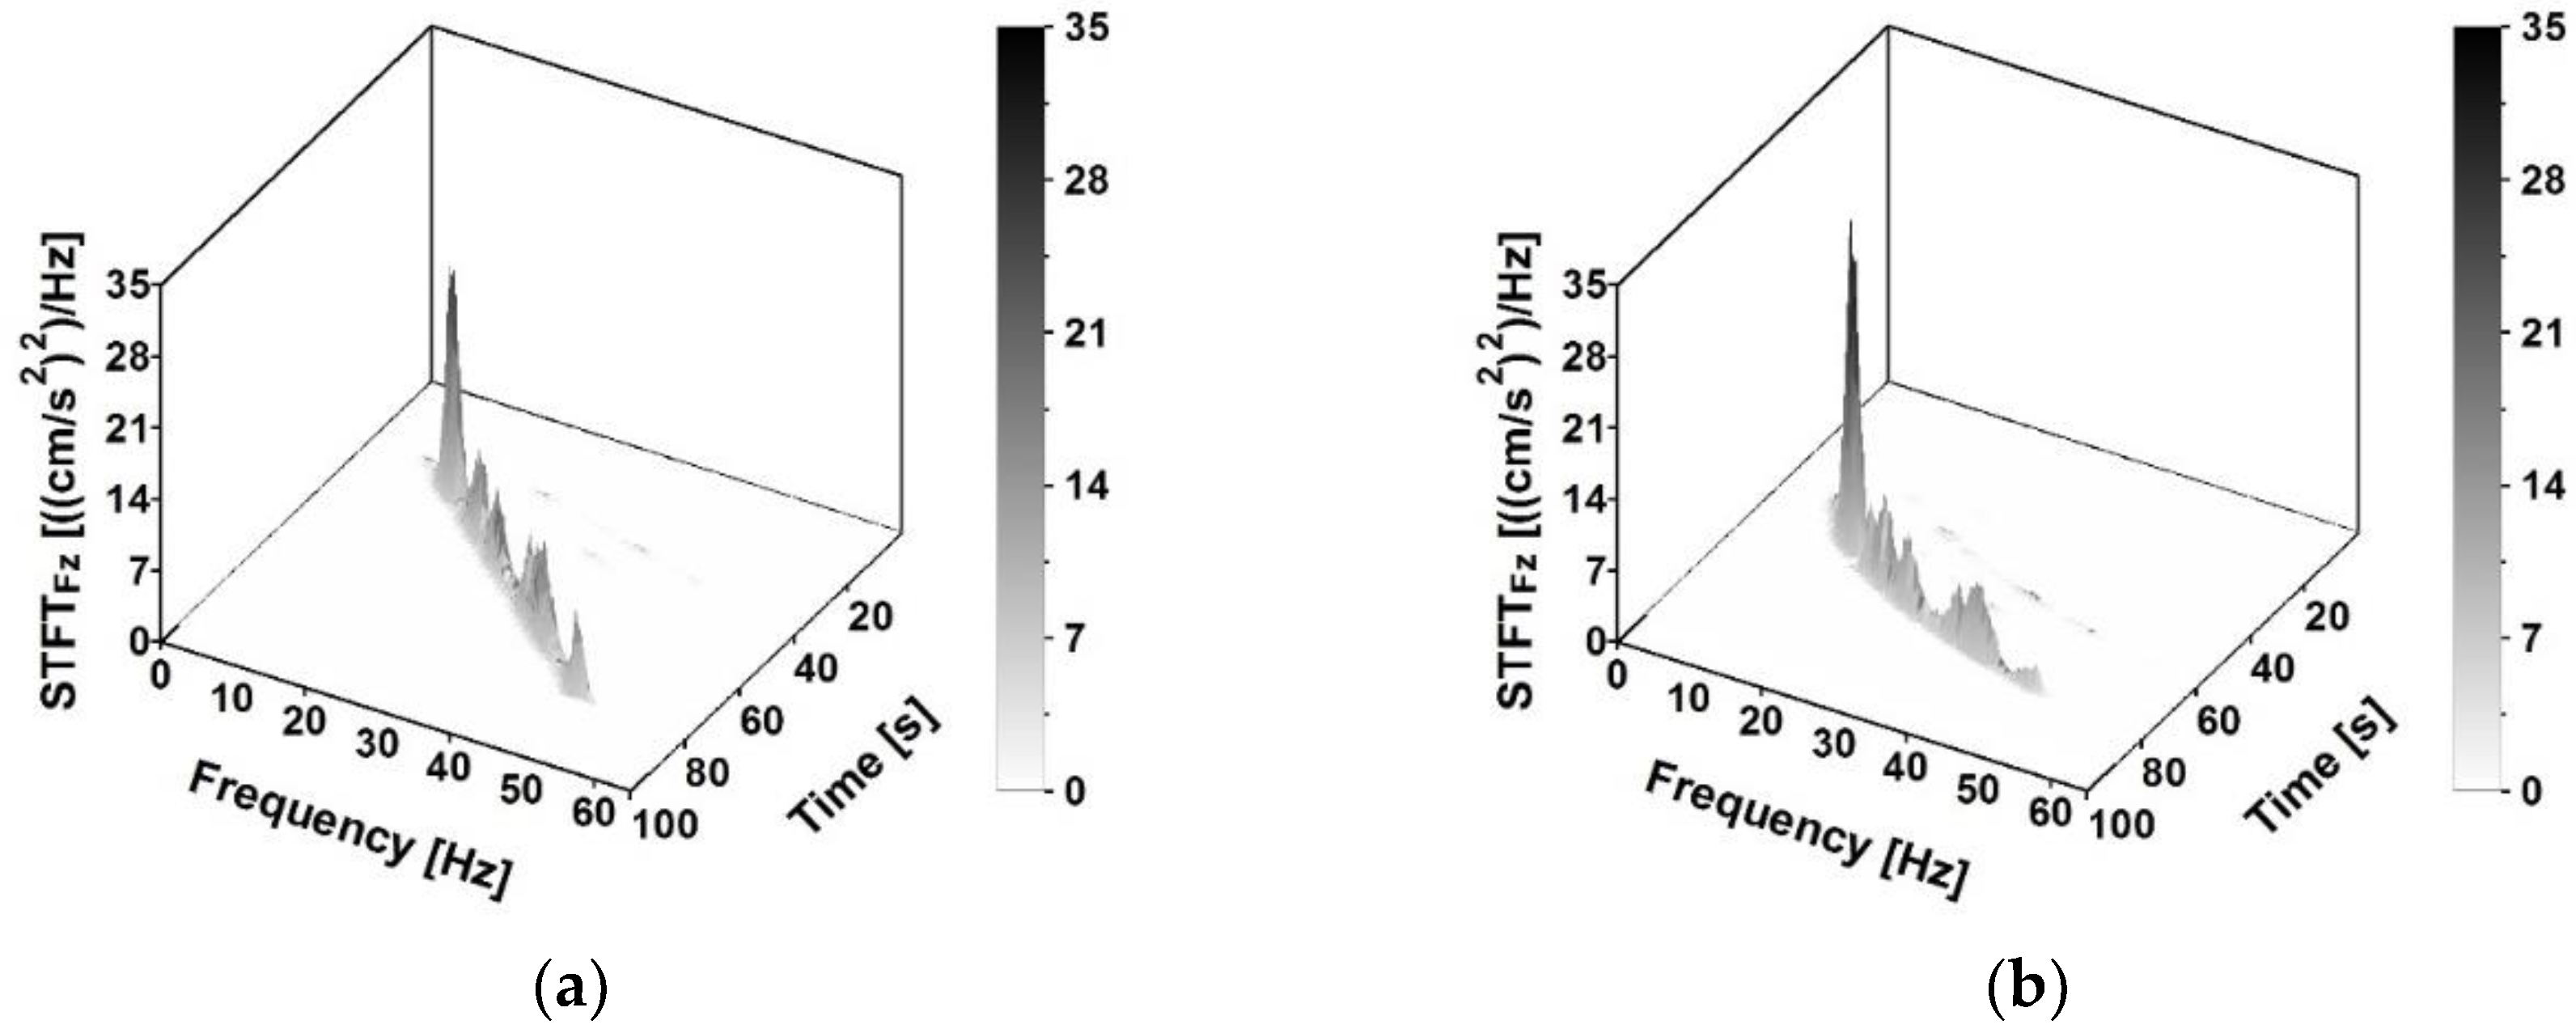
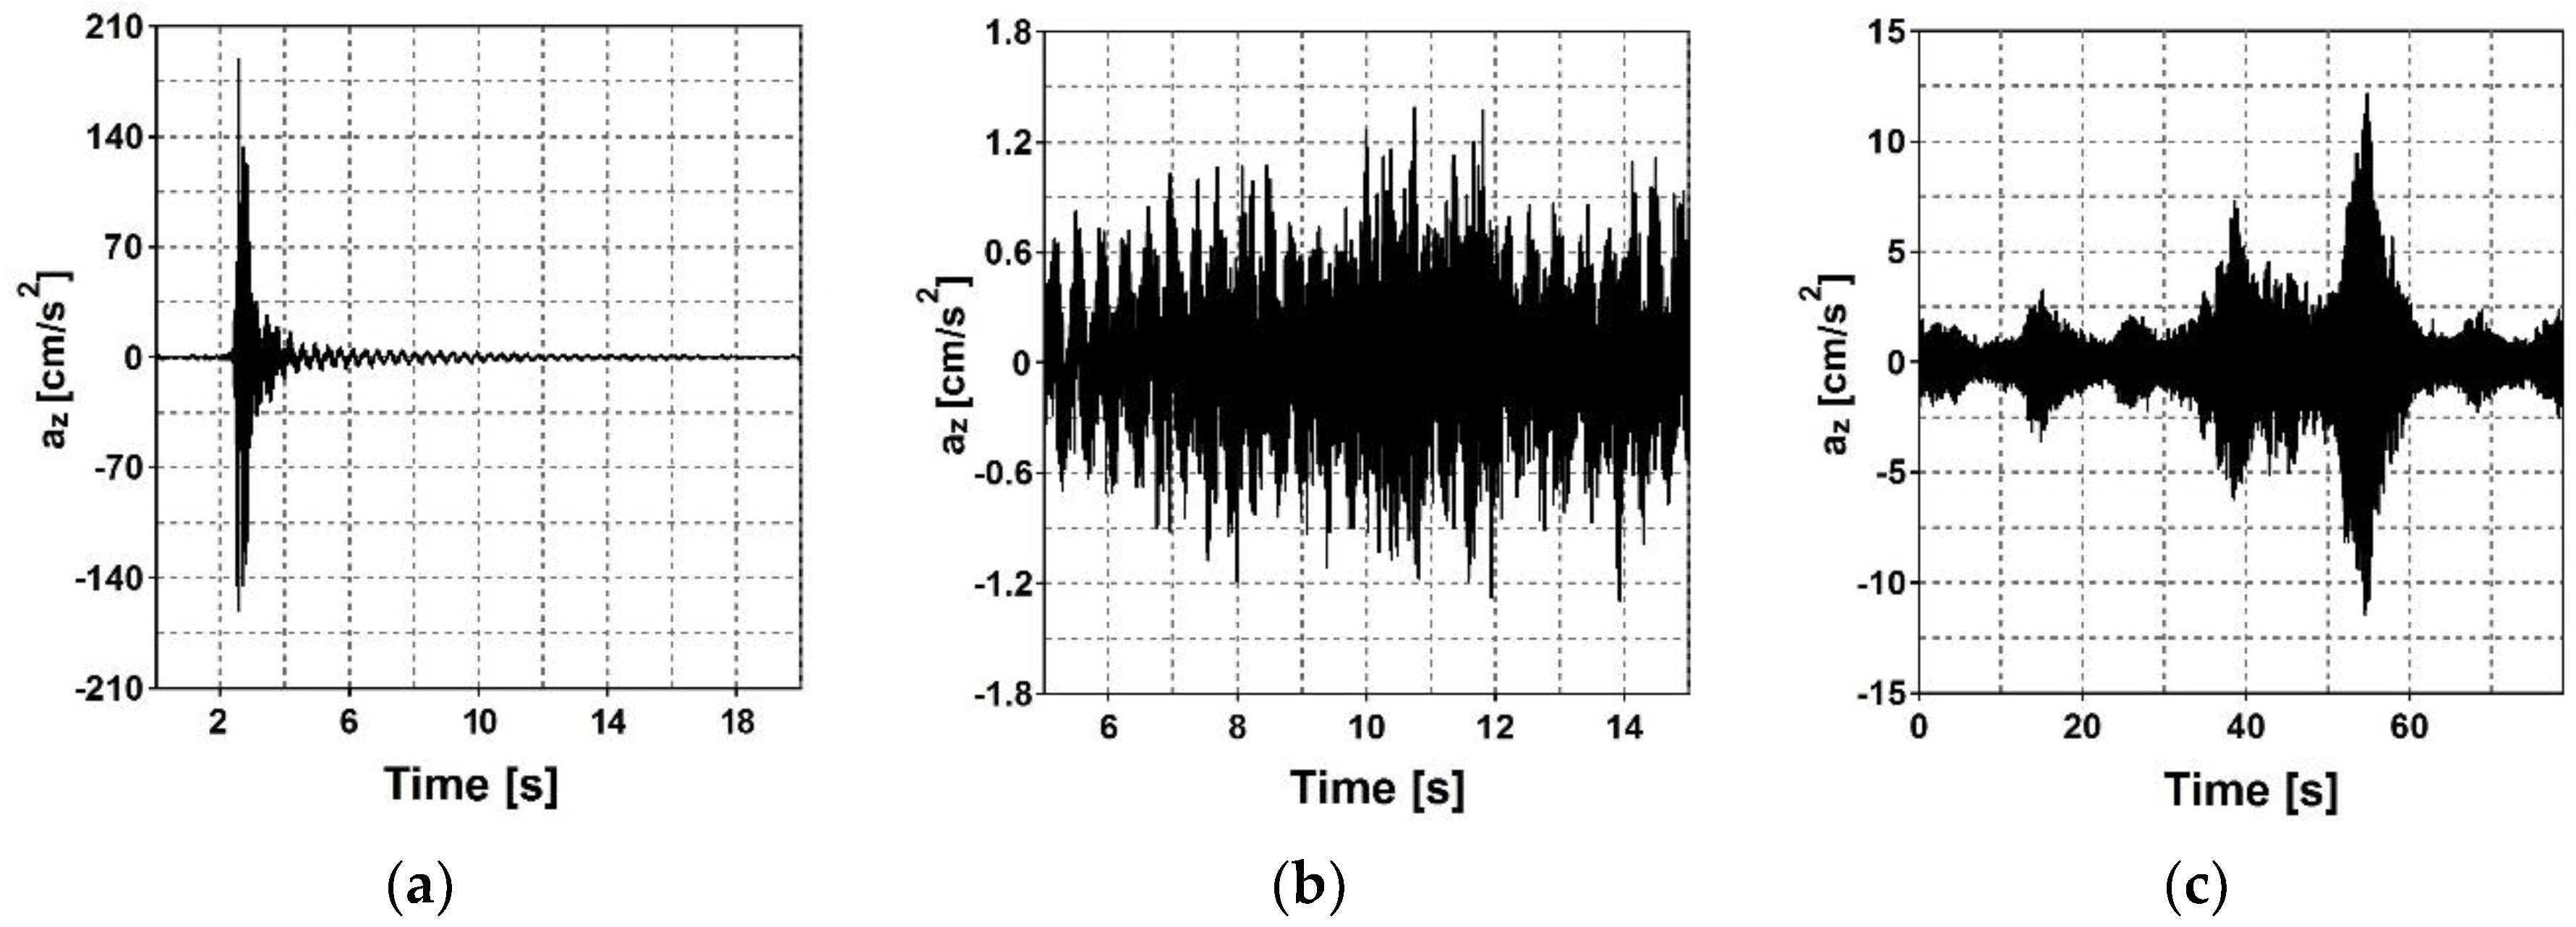
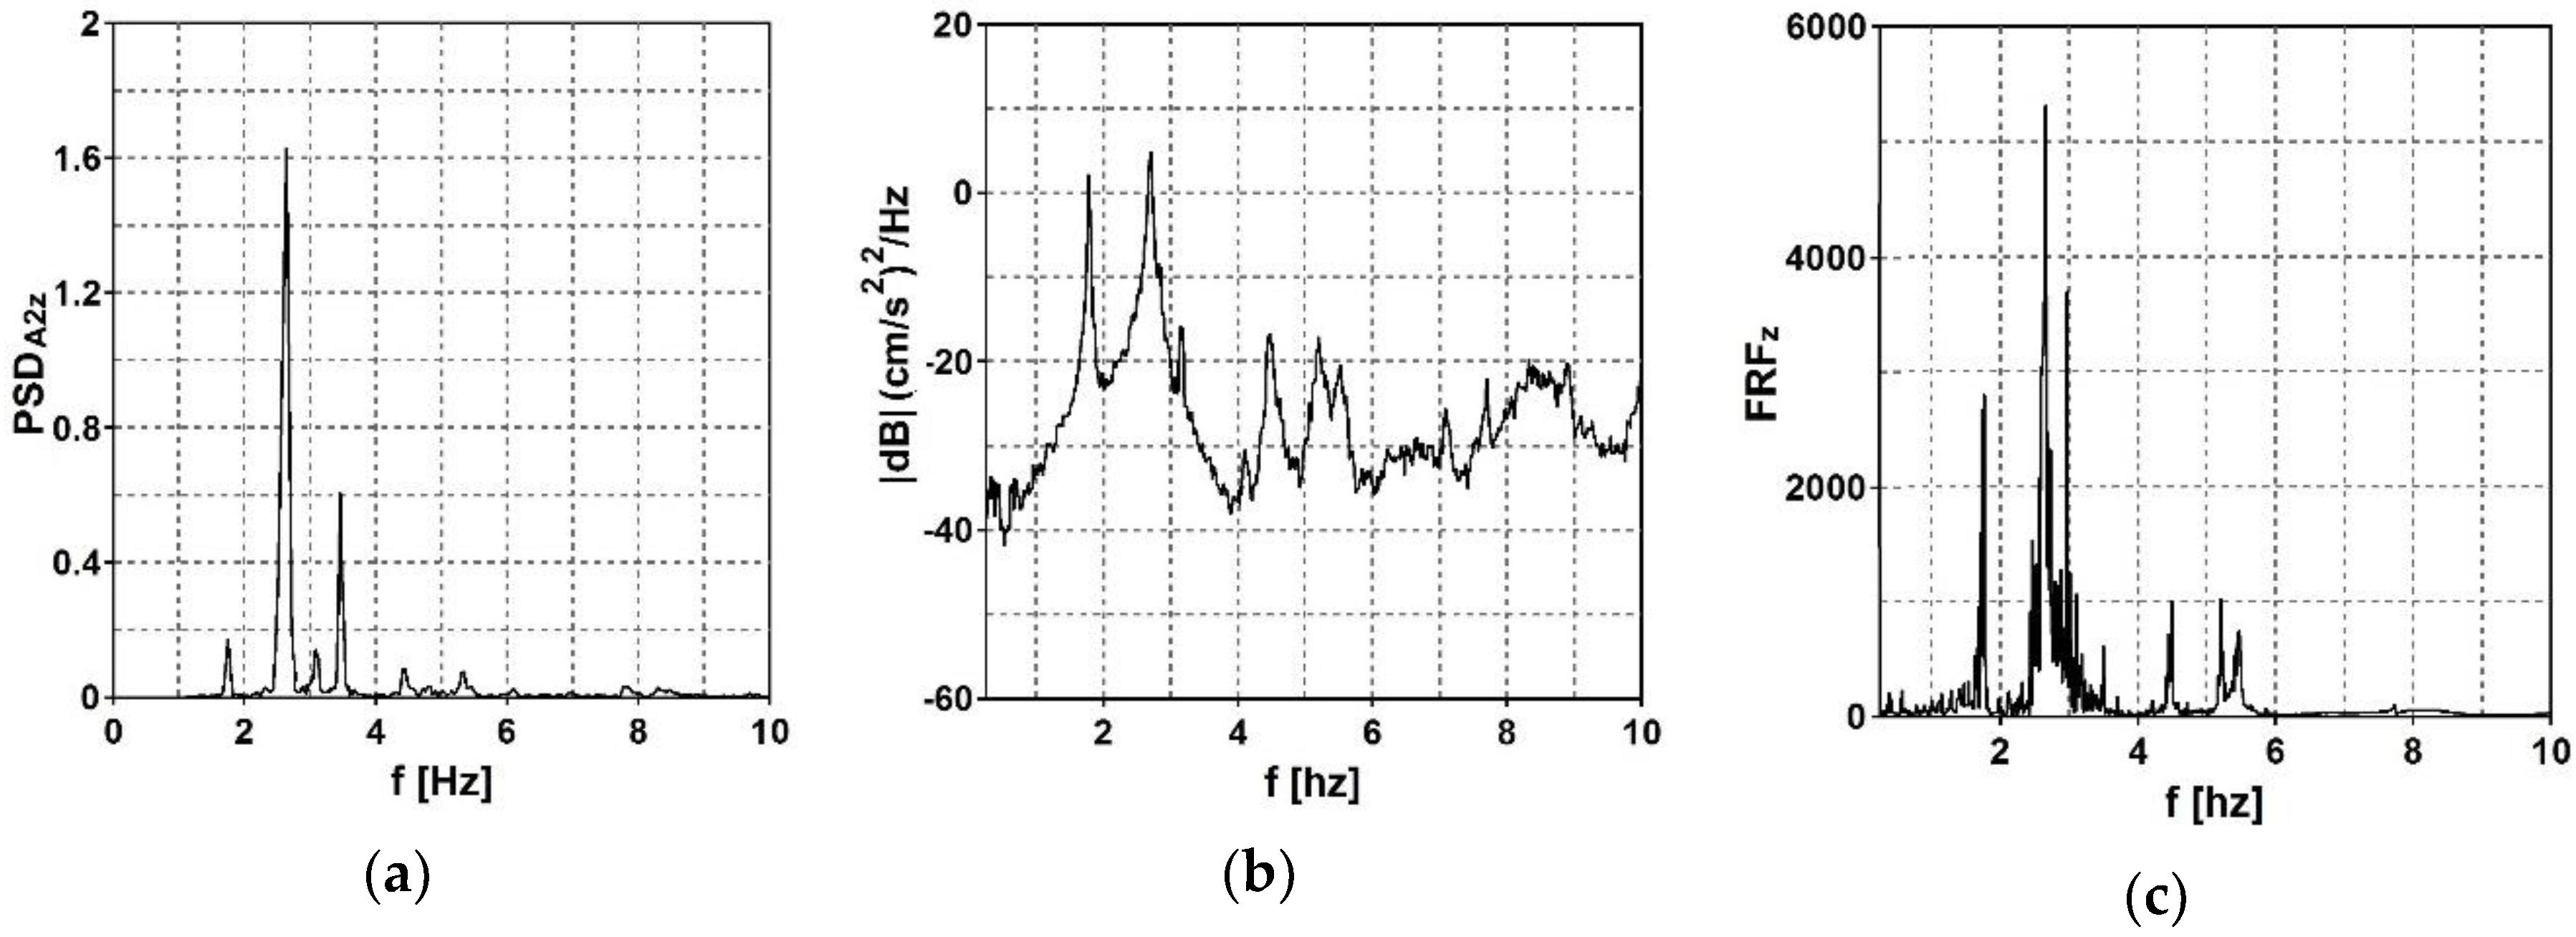
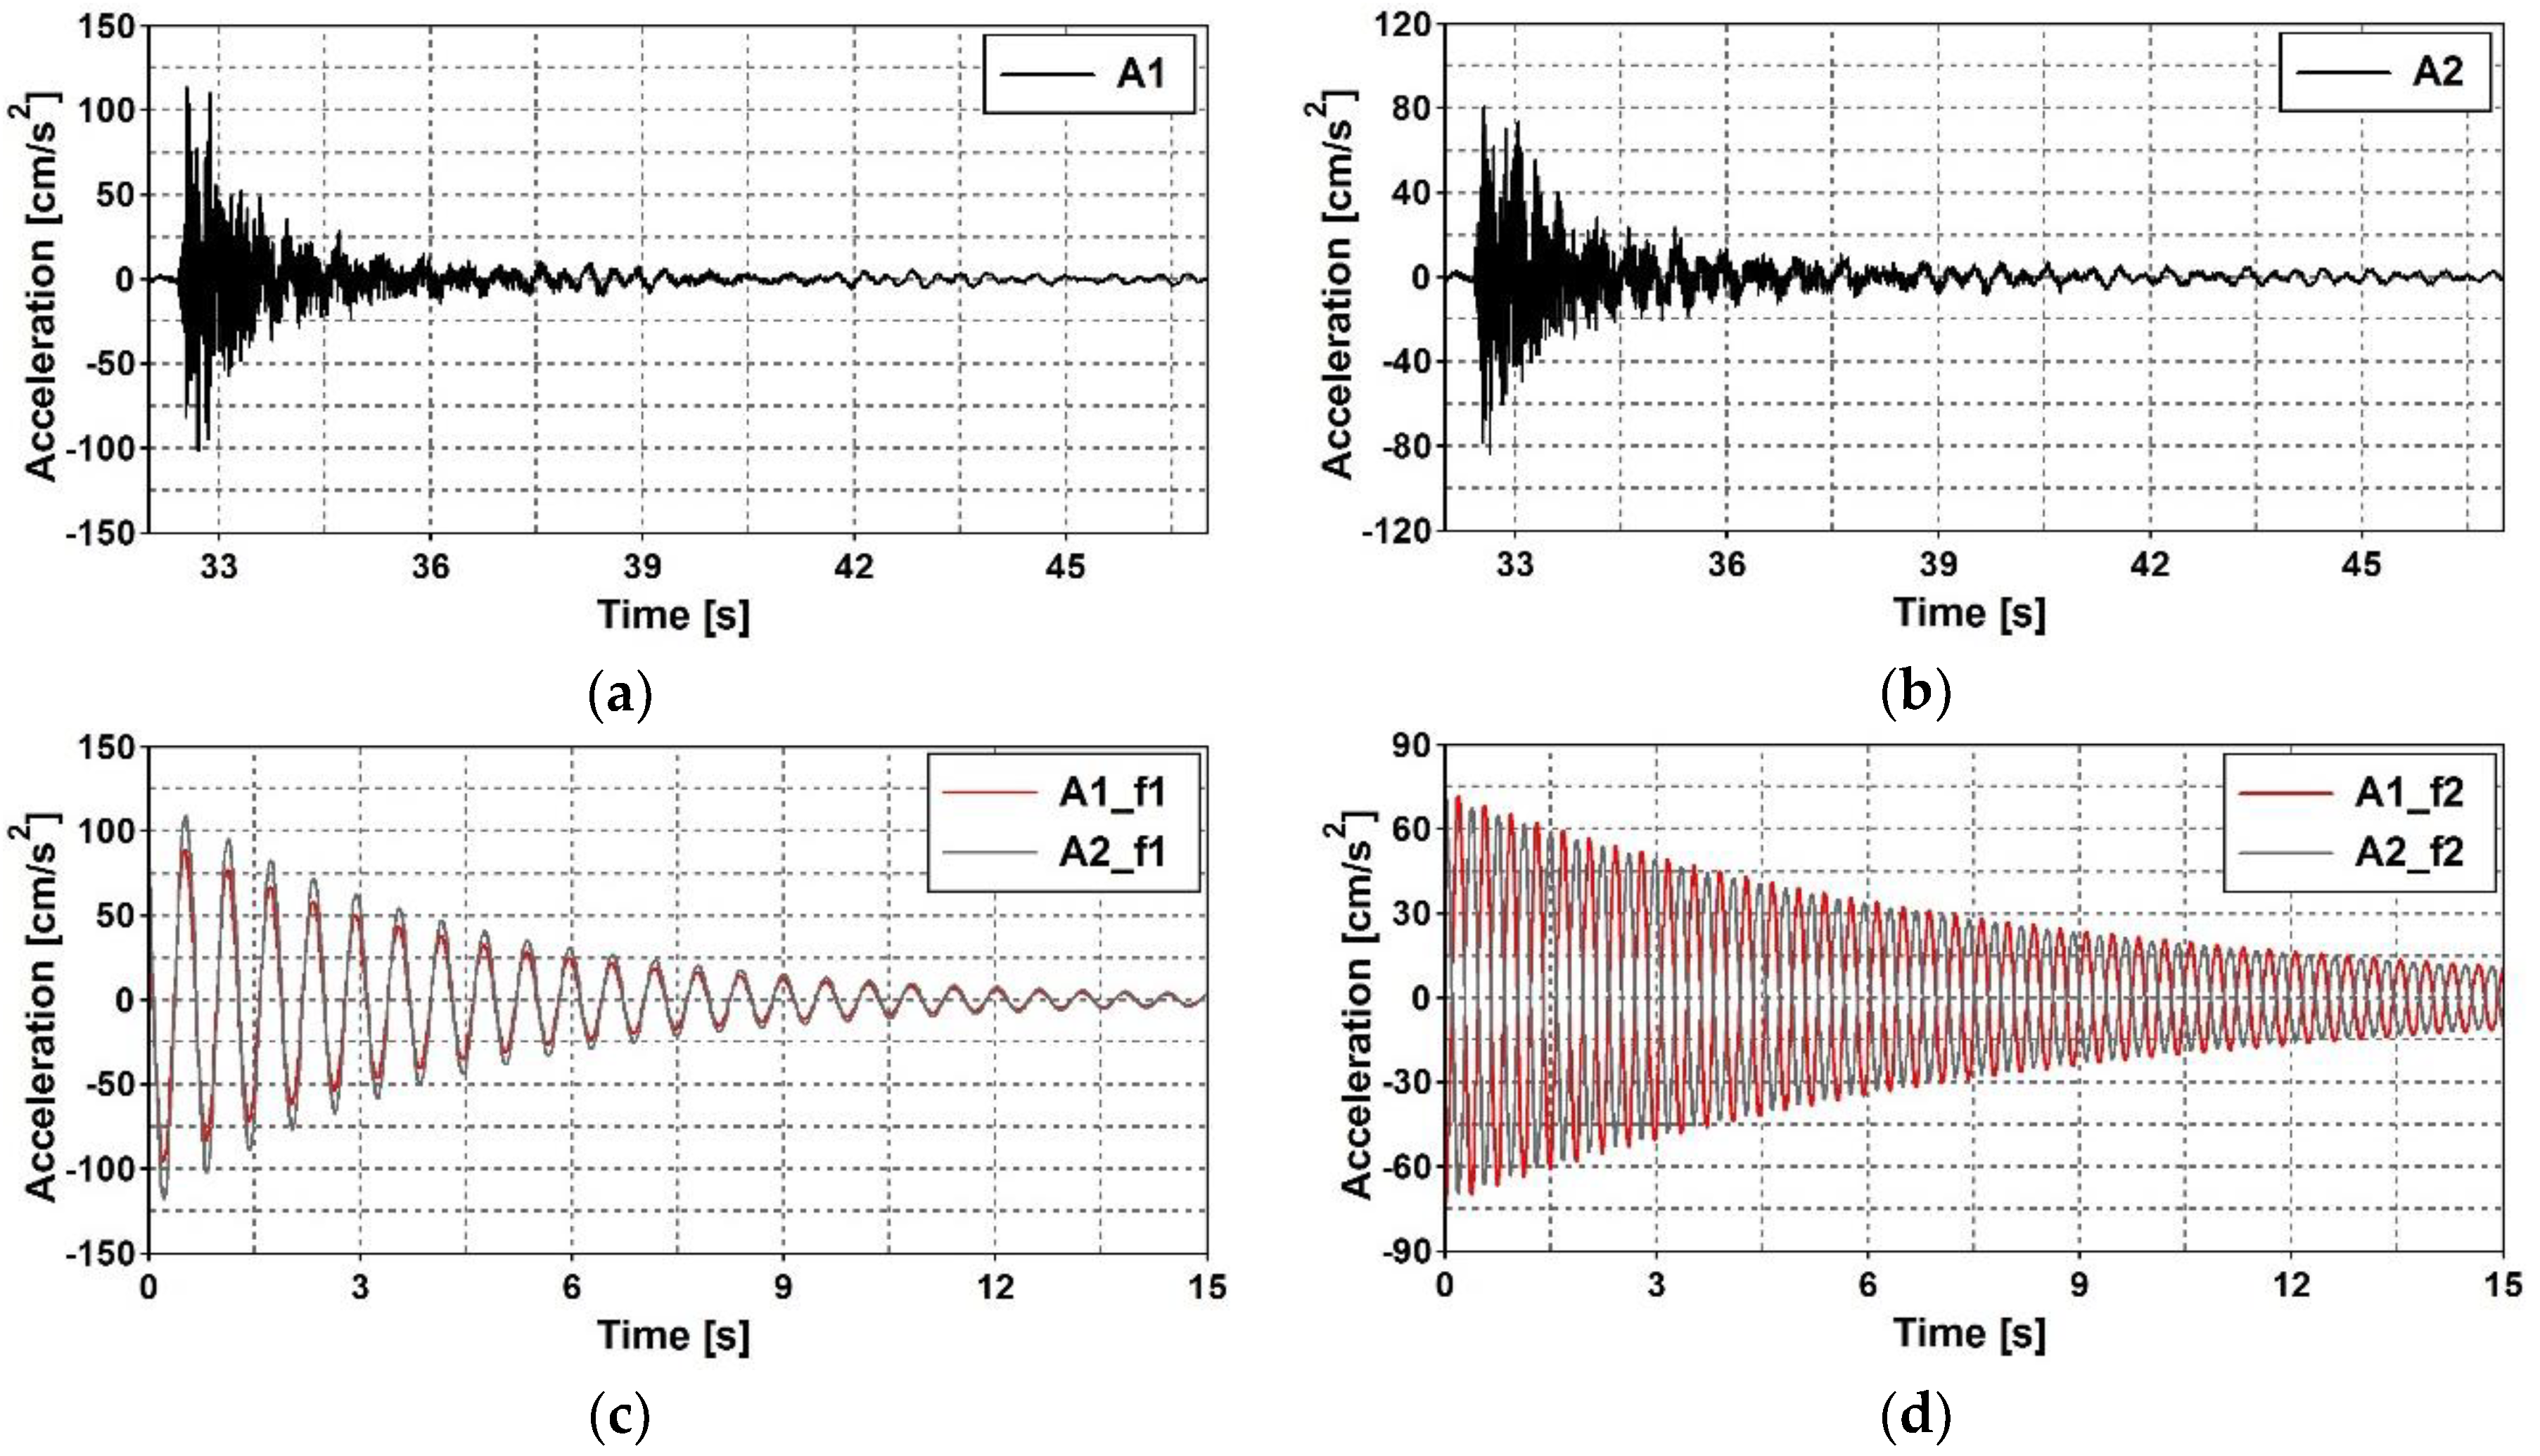
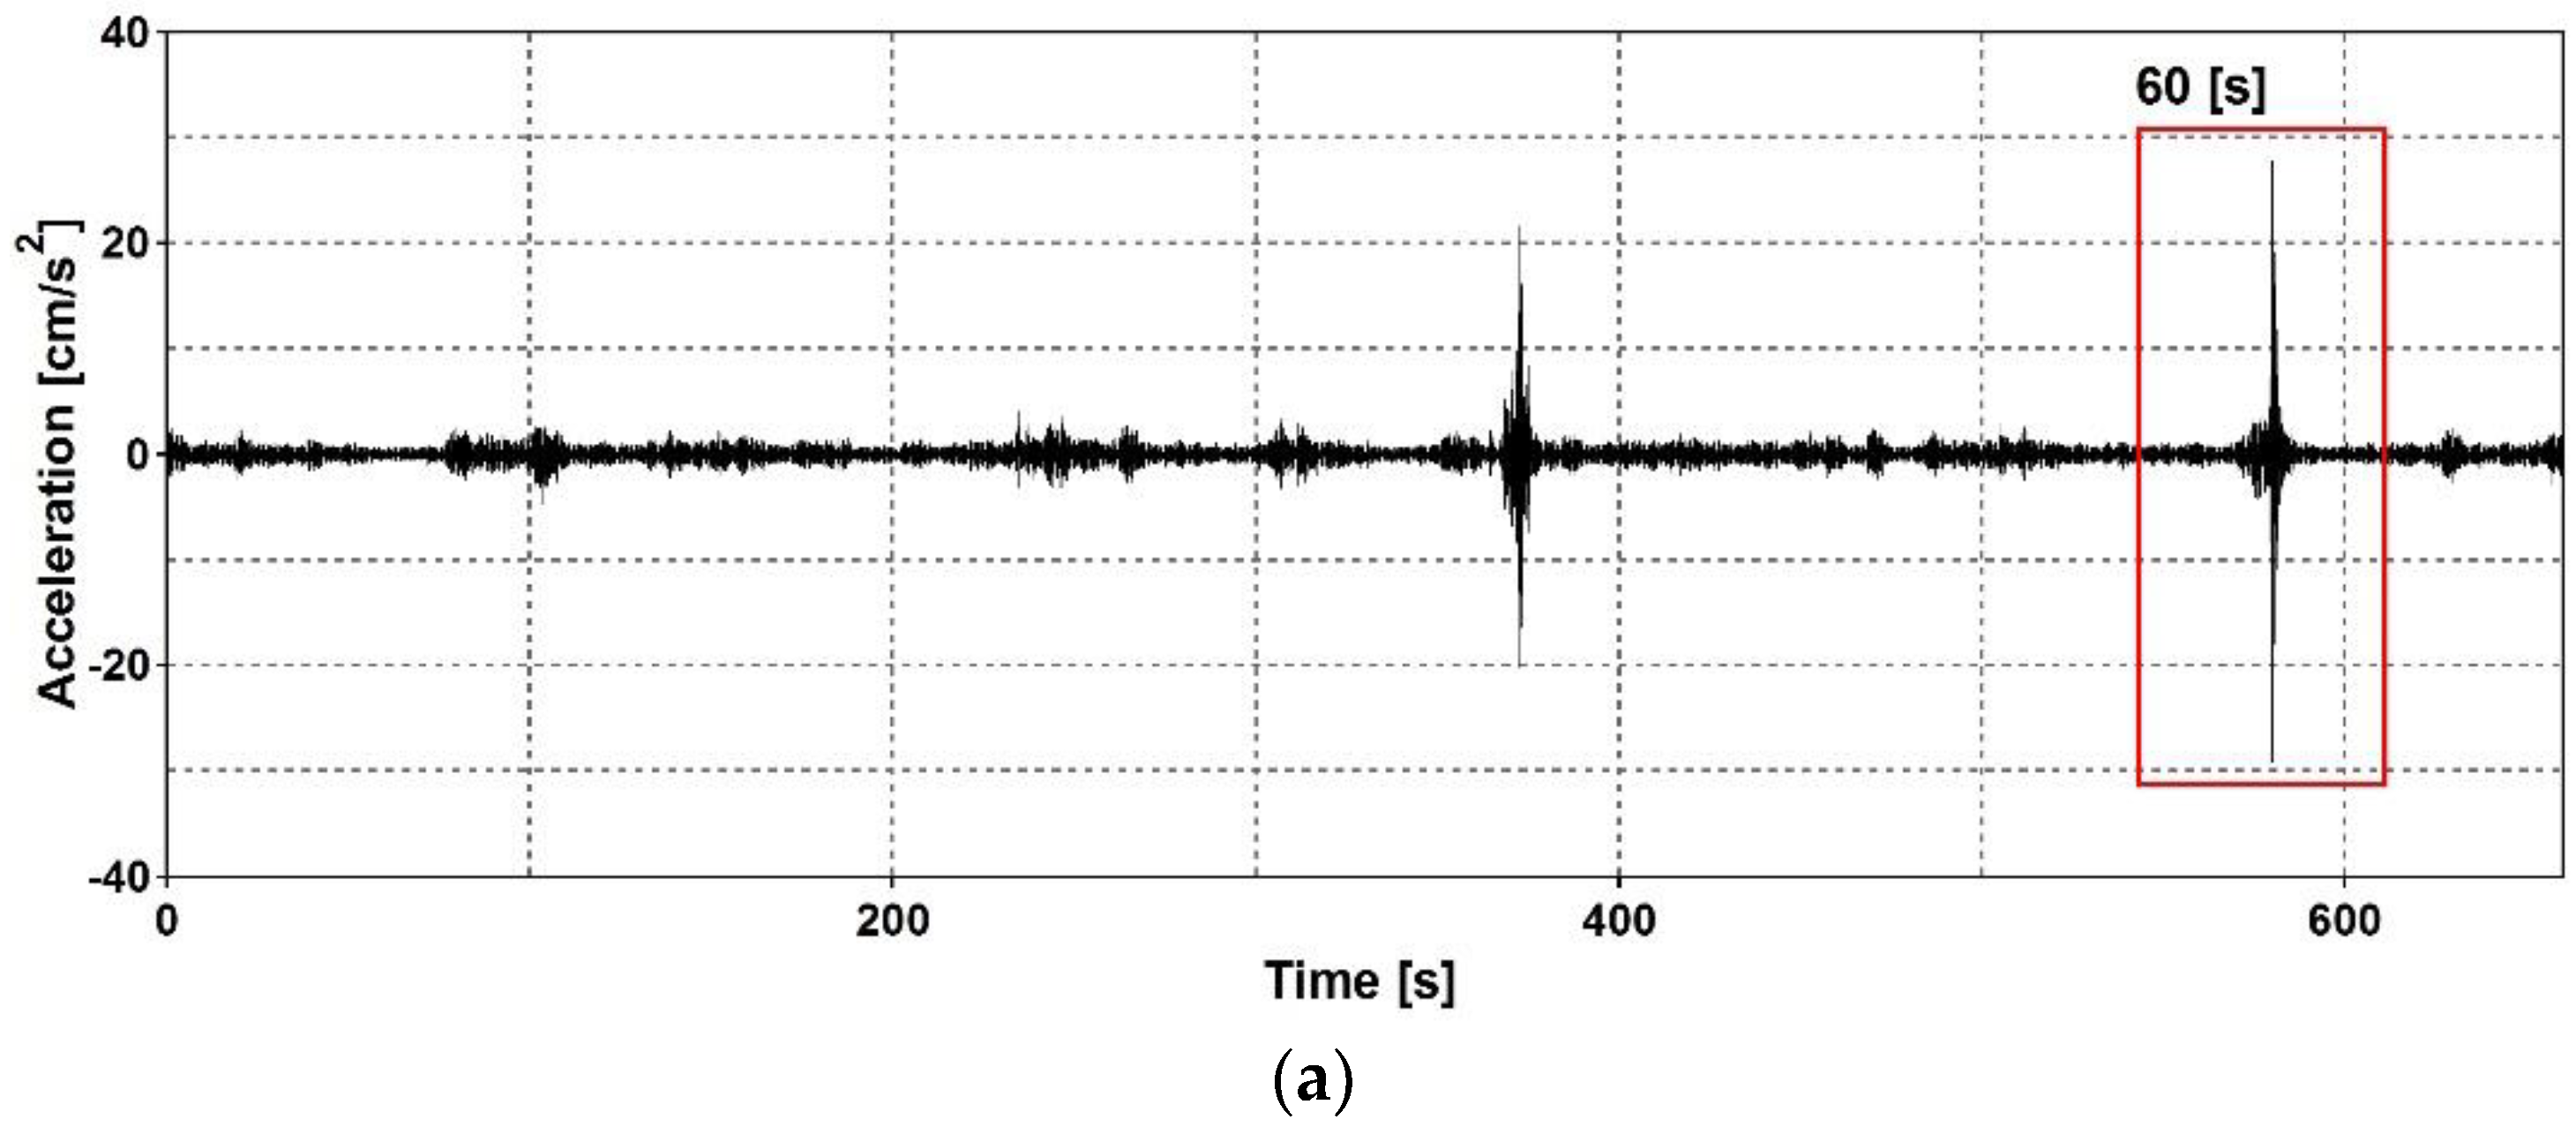
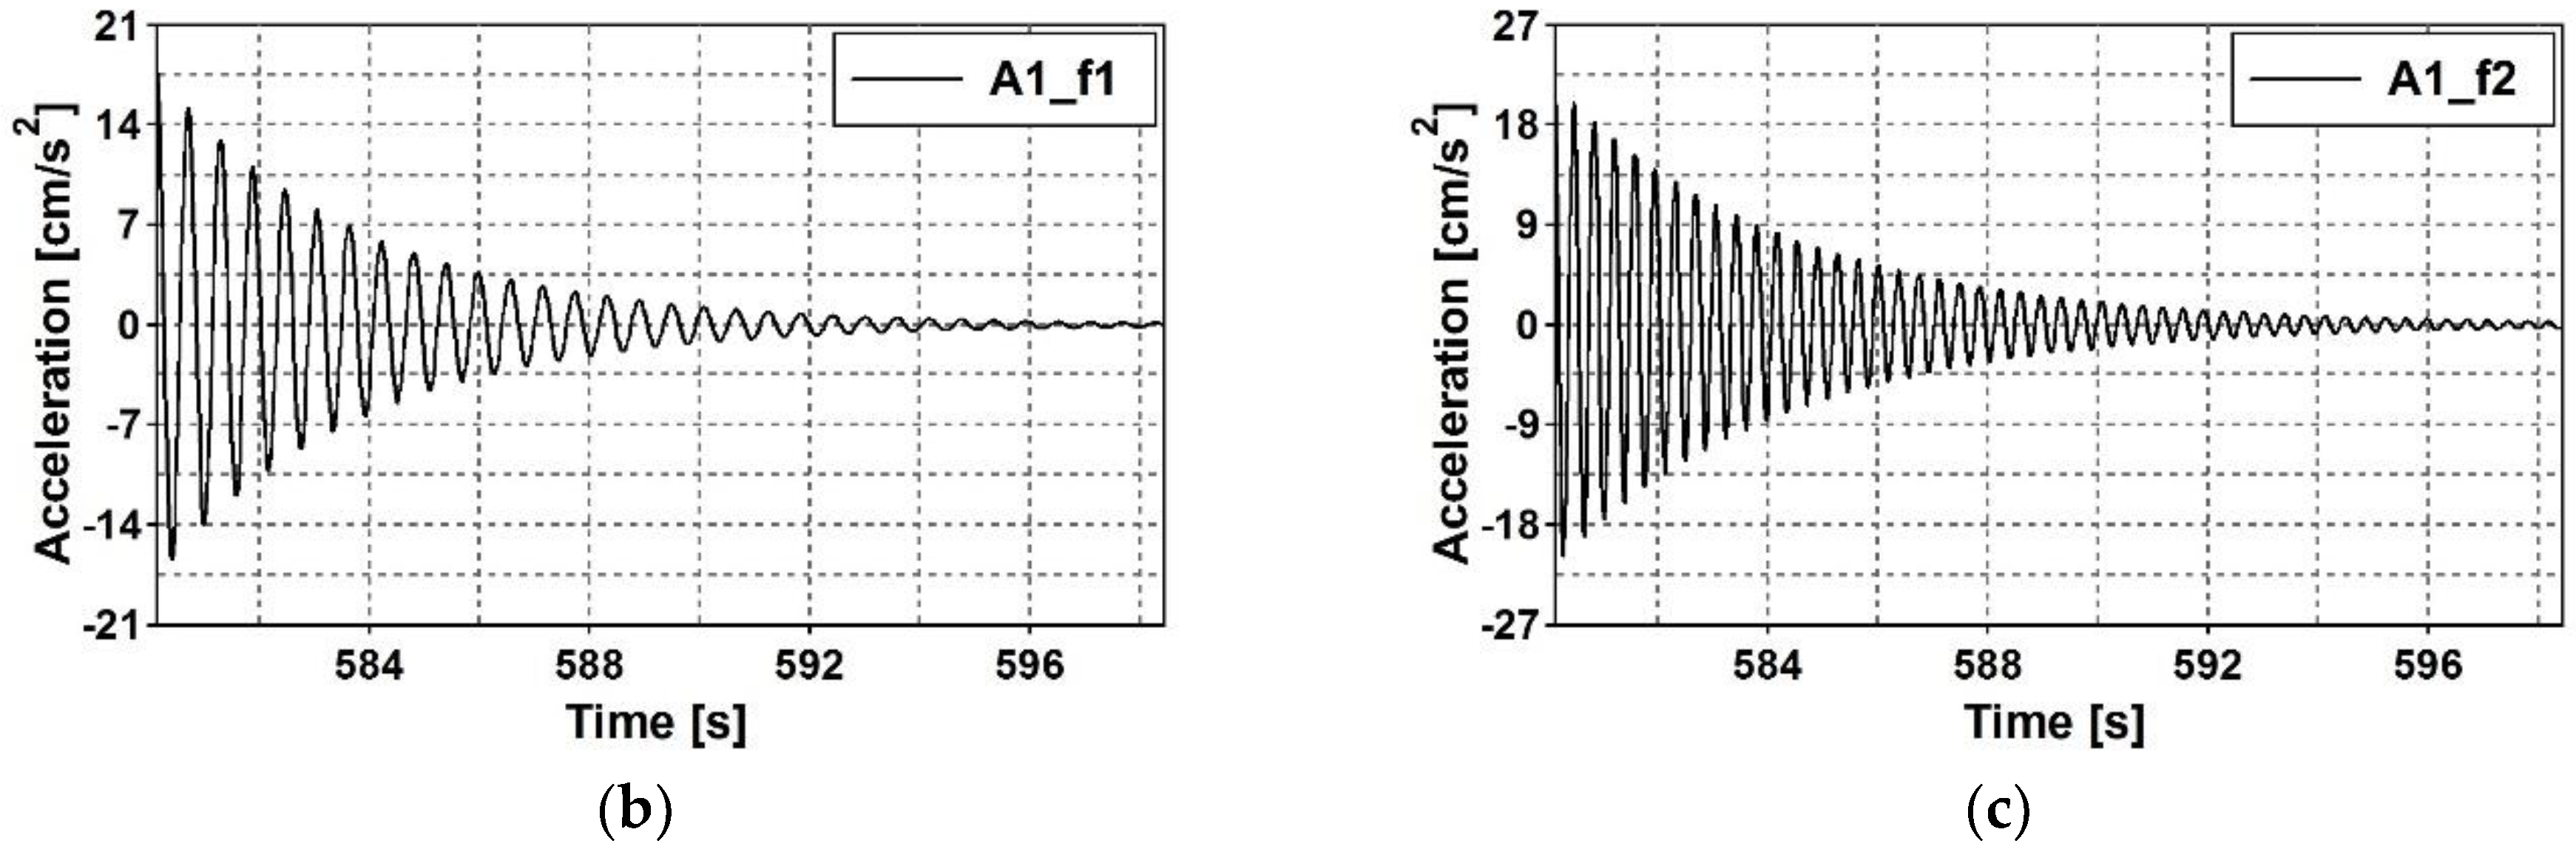
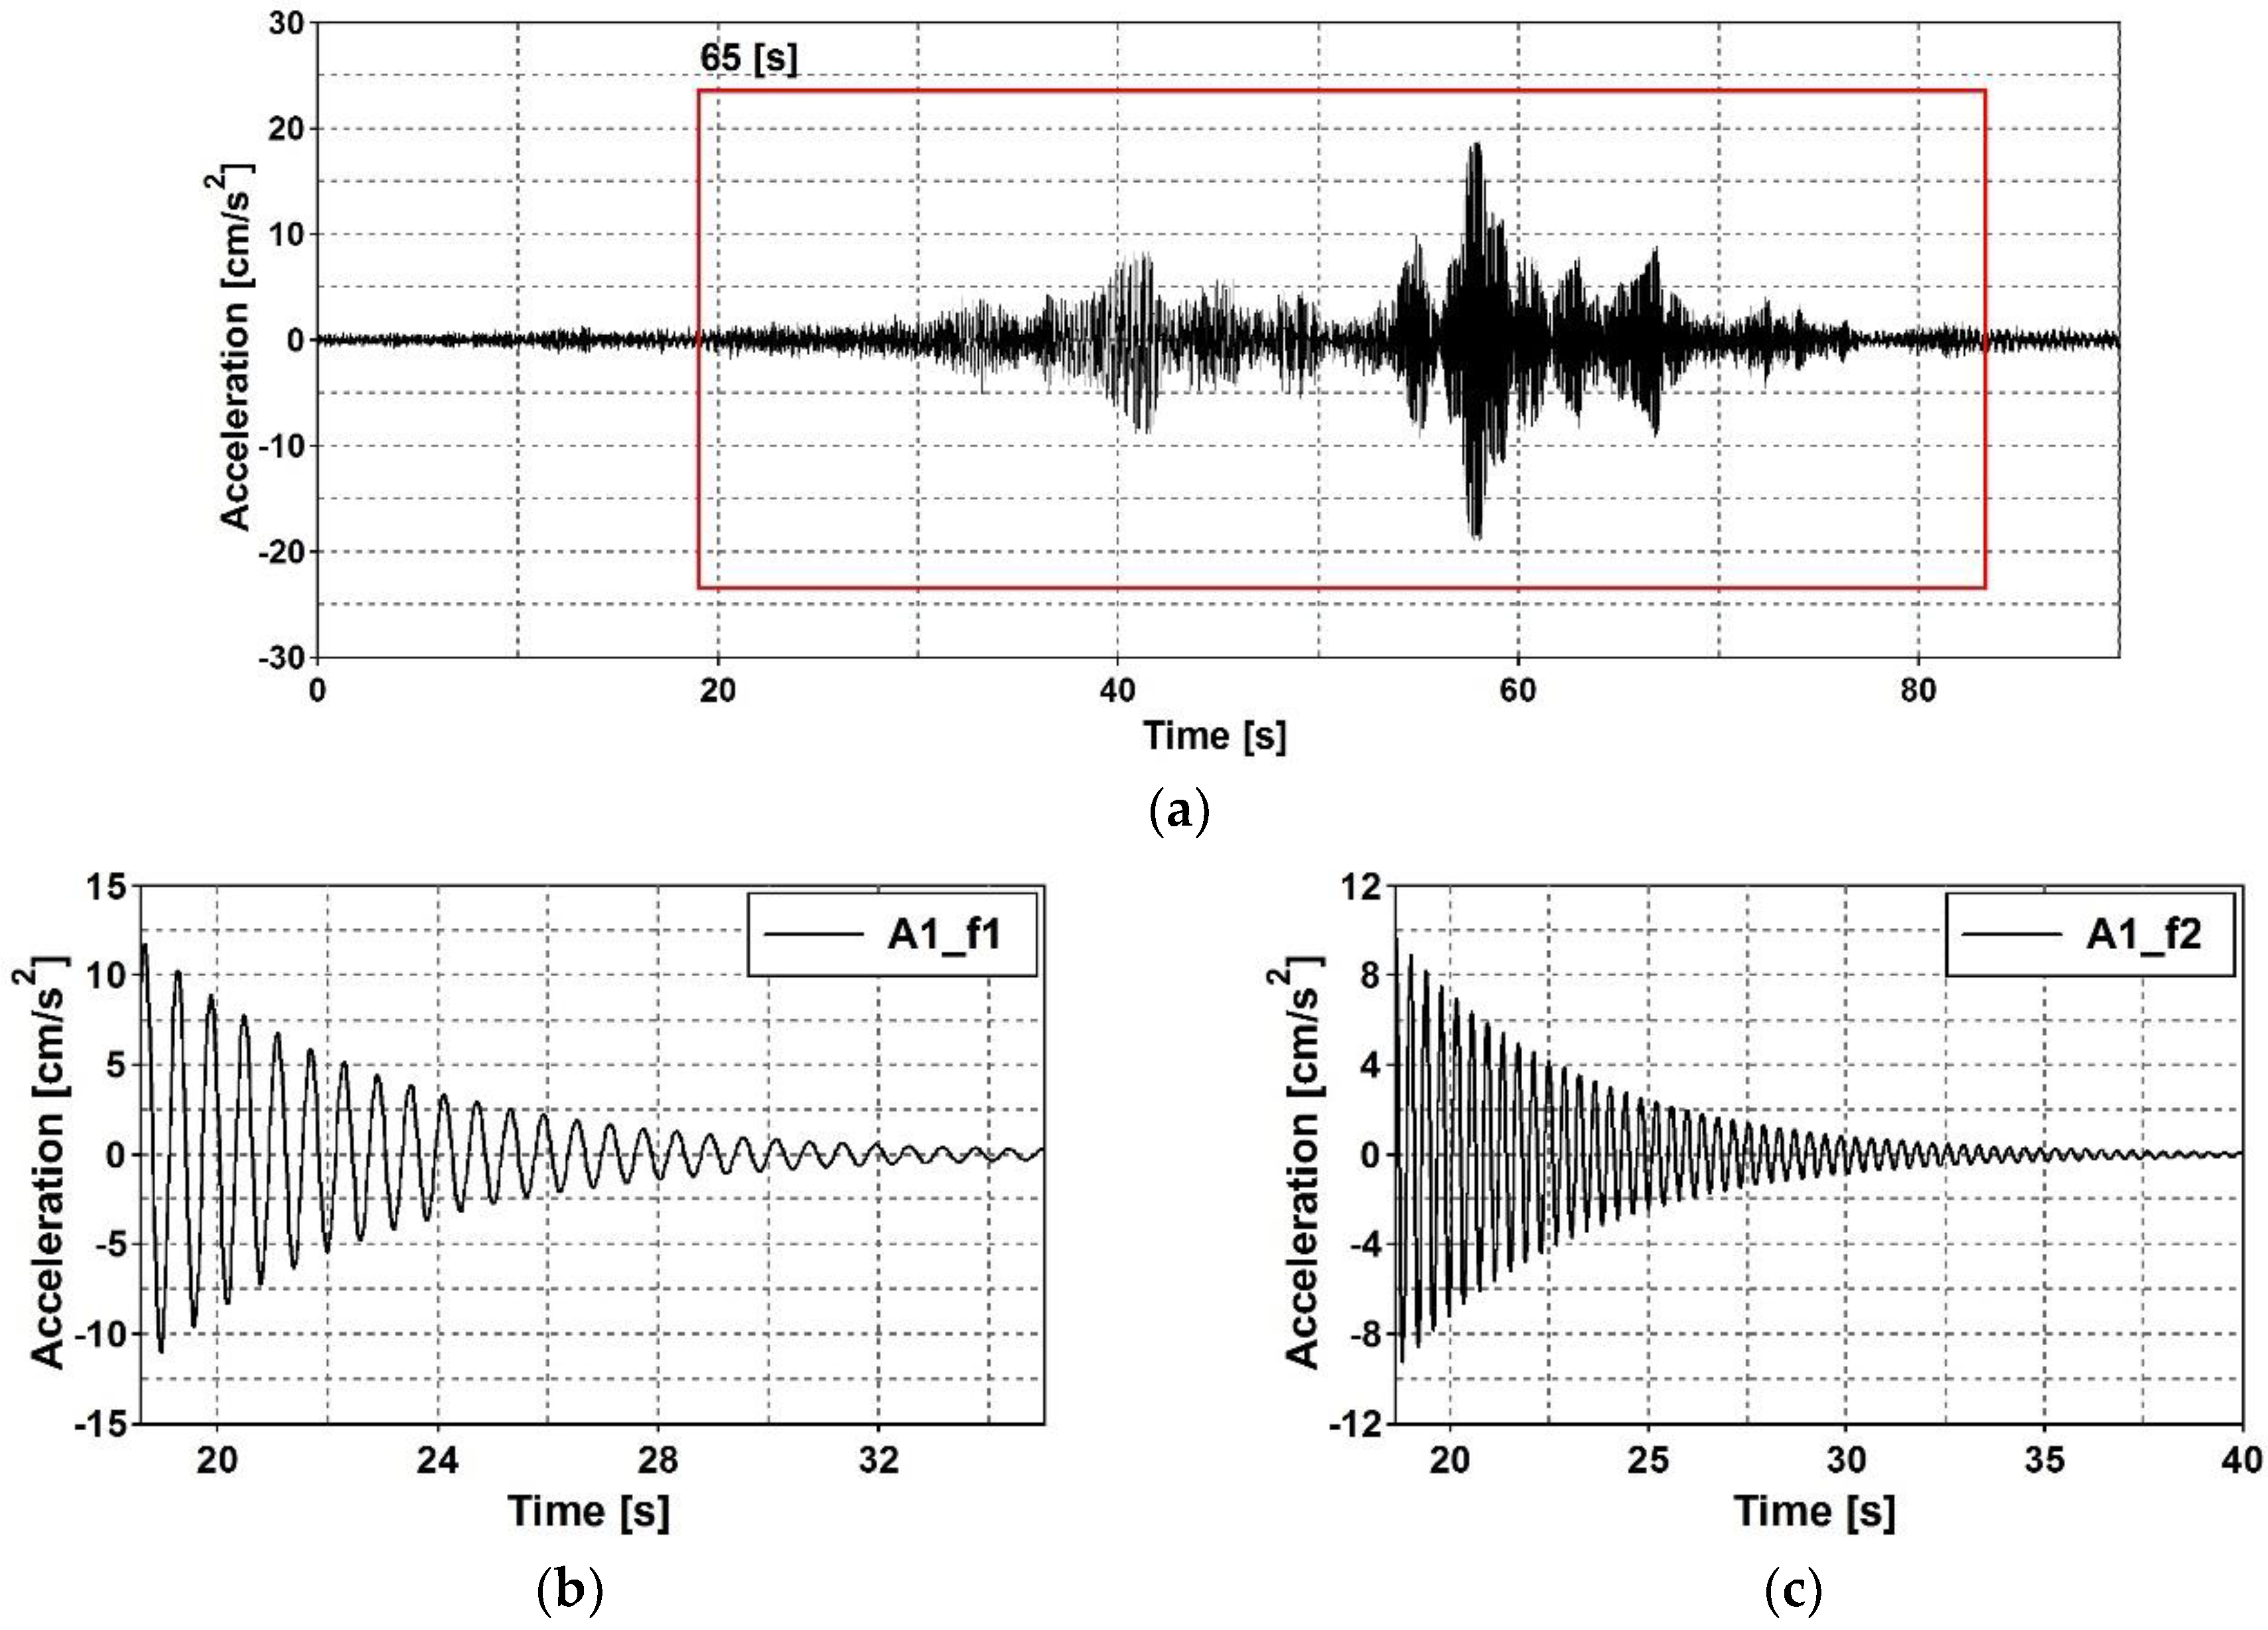
4.2. Experimental Evaluation of Dynamic Properties of the Footbridge

To validate the developed numerical modal model, the experimental research program was prepared. The experimental modal models took three types of dynamic loading into consideration, i.e., shock excitation, ambient vibration, and slow sine sweep testing. The shock excitation was generated through the dropping of a mass of 1500 kg (a stack of paving blocks) from a height of 4 cm. The dropping of the mass was performed four times. The ambient vibrations were generated by wind and road traffic since the footbridge is located over a motorway. Finally, slow sine sweep testing was executed using the THOMAS vibroseis apparatus. The durations of the tests with the Thomas apparatus were 30, 60, and 65 s long (see figure below) depending on the frequency range and the character of the sweep: 30 seconds for linear tests starting from 2 to 20 Hz, 60 seconds for linear tests starting from 2 to 50 Hz, and 65 seconds for exponential tests starting from 2 to 50 Hz. The total number of tests with the THOMAS apparatus was 48 (the power of the vibroseis was also varied).
In all three experiments, accelerations at all measurement points in three directions were registered. The recorded lengths of the signals used for the purpose of the study were as follows: 15 s for shock excitation, 60 s for ambient vibration, and 65 s for slow sine sweep testing. The time histories of accelerations registered at measurement point A2 (see Figure 10) in the vertical direction as a result of particular types of dynamic loading, i.e., shock excitation, ambient vibration, and slow sine sweep testing, are presented in Figure 10a‒c, respectively.
Next, different types of mathematical functions, according to Equations (2)–(4), were used to estimate the dynamic properties of the footbridge, depending on the source of excitation. In Figure 11, the modal estimators of the investigated experimental modal models are presented (see Figure 1). The power spectral density function of the accelerations resulting from shock excitation and registered at measurement point A 2 in the vertical direction ( PSD A 2 z ) is presented in Figure 11a. The summation of all combinations of auto- and cross-spectral density functions ( PSD and CSD ) between all output data registered at measurement points is illustrated in Figure 11b. Finally, the frequency response function ( FRF ) of the vertical accelerations generated as a result of ambient vibration and slow sine sweep testing is shown in Figure 11c.
The local maxima of the calculated functions represent the natural frequencies of the footbridge. The natural frequencies estimated through the experimental investigation are summarized in Table 2. Very good agreement of the values of natural frequencies obtained from three different experiments can be clearly noticed. The second method (ambient vibrations) indicated the largest errors (up to 20% for the fourth eigenfrequency). This could have been caused by the relatively small number of sensors—the smaller the number of sensors used in the operational analysis, the more limited and less reliable the method is [32].
As the next stage of the experimental investigations on the dynamic properties of the footbridge, the modal shapes were obtained for each estimated eigenvalue. In Figure 12, time histories of horizontal accelerations in the X direction registered after the shock excitation at different measurement points ( A 1 and A 2 ) are presented. The unfiltered time histories at points A 1 and A 2 are shown in Figure 12a,b, respectively. Next, the time histories at points A 1 and A 2 , filtered around the first natural frequency of 1.72 Hz, are presented in Figure 12c. Finally, the time histories of selected points, filtered around the second natural frequency of 2.61 Hz are illustrated in Figure 12d. Third order Butterworth band-pass filters with a width of 0.04 Hz were used in both cases. The analysis on the differences in responses among sensors placed at different points proved that the accelerations of points A 1 and A 2 accompanying the first natural frequency were in-phase whereas the displacements corresponding to the second natural frequency were 1800 out-of-phase. The amplitudes were similar in both cases. The presented time histories show characters that are adequate for the first and second mode shapes. On the basis of similar analyses, all experimental modal shapes were obtained.
As a final stage of the experimental investigations, the logarithmic decrements of damping were obtained for every estimated eigenvalue. In the ambient tests, the dynamic response of the footbridge was generated by wind and traffic under the structure. The registered signals included the dynamic response of the bridge to heavy truck passage. The response executed by this type of excitation was incomparably greater than the responses to weak wind and other vehicle passages. The time history of vertical acceleration registered at point A 1 is shown in Figure 13a. The time histories of all control points were filtered around the estimated natural frequencies. The free decay plots were obtained at every measurement point in all three directions. The signals filtered around the first eigenfrequency (1.71 Hz) and the second eigenfrequency (2.61 Hz) are shown in Figure 13b,c, respectively. All obtained free decay plots enabled the estimation of average logarithmic decrements for all eigenfrequencies.
In sine sweep tests, the dynamic response of the footbridge was generated by the THOMAS apparatus. During the exponential sweep, which lasted 65 seconds, the excitation frequency increased continuously from 2 to 50 Hz. Hence, in both signals—the excitation and the dynamic response of the structure—the value of each eigenfrequency appeared only once. By filtering accelerations registered at control points around the eigenfrequencies, free decay plots of acceleration were obtained. For the time history of vertical acceleration registered at point A 1 resulting from the 65 s exponential sweep, the signal filtered around the first eigenfrequency, 1.72 Hz, and the signal filtered around the second frequency, 2.61 Hz, are presented in Figure 14.
The values of logarithmic decrement, which were obtained for every natural frequency as a result of using three different sources of vibrations, are summarized in Table 3. The obtained values of logarithmic decrement enabled the assessment of damping ratios for particular modes of vibration. The analyzed damping ratios for the first, second, and third natural modes decreased from 2.3% to 1%, whereas the damping ratios for the fourth and fifth modes did not exceed 0.7%.
The logarithmic decrements of the investigated footbridge corresponding to the first, second, and third mode shapes were relatively large in comparison with typical footbridge logarithmic decrements. However, it must be emphasized that these modes represent transverse vibrations of the stiff steel frame. The values of logarithmic decrement obtained for the higher modes, which represent vertical and torsional vibrations of the deck, showed good agreement with the damping properties of footbridges presented by other authors [2,17].

5. Discussion

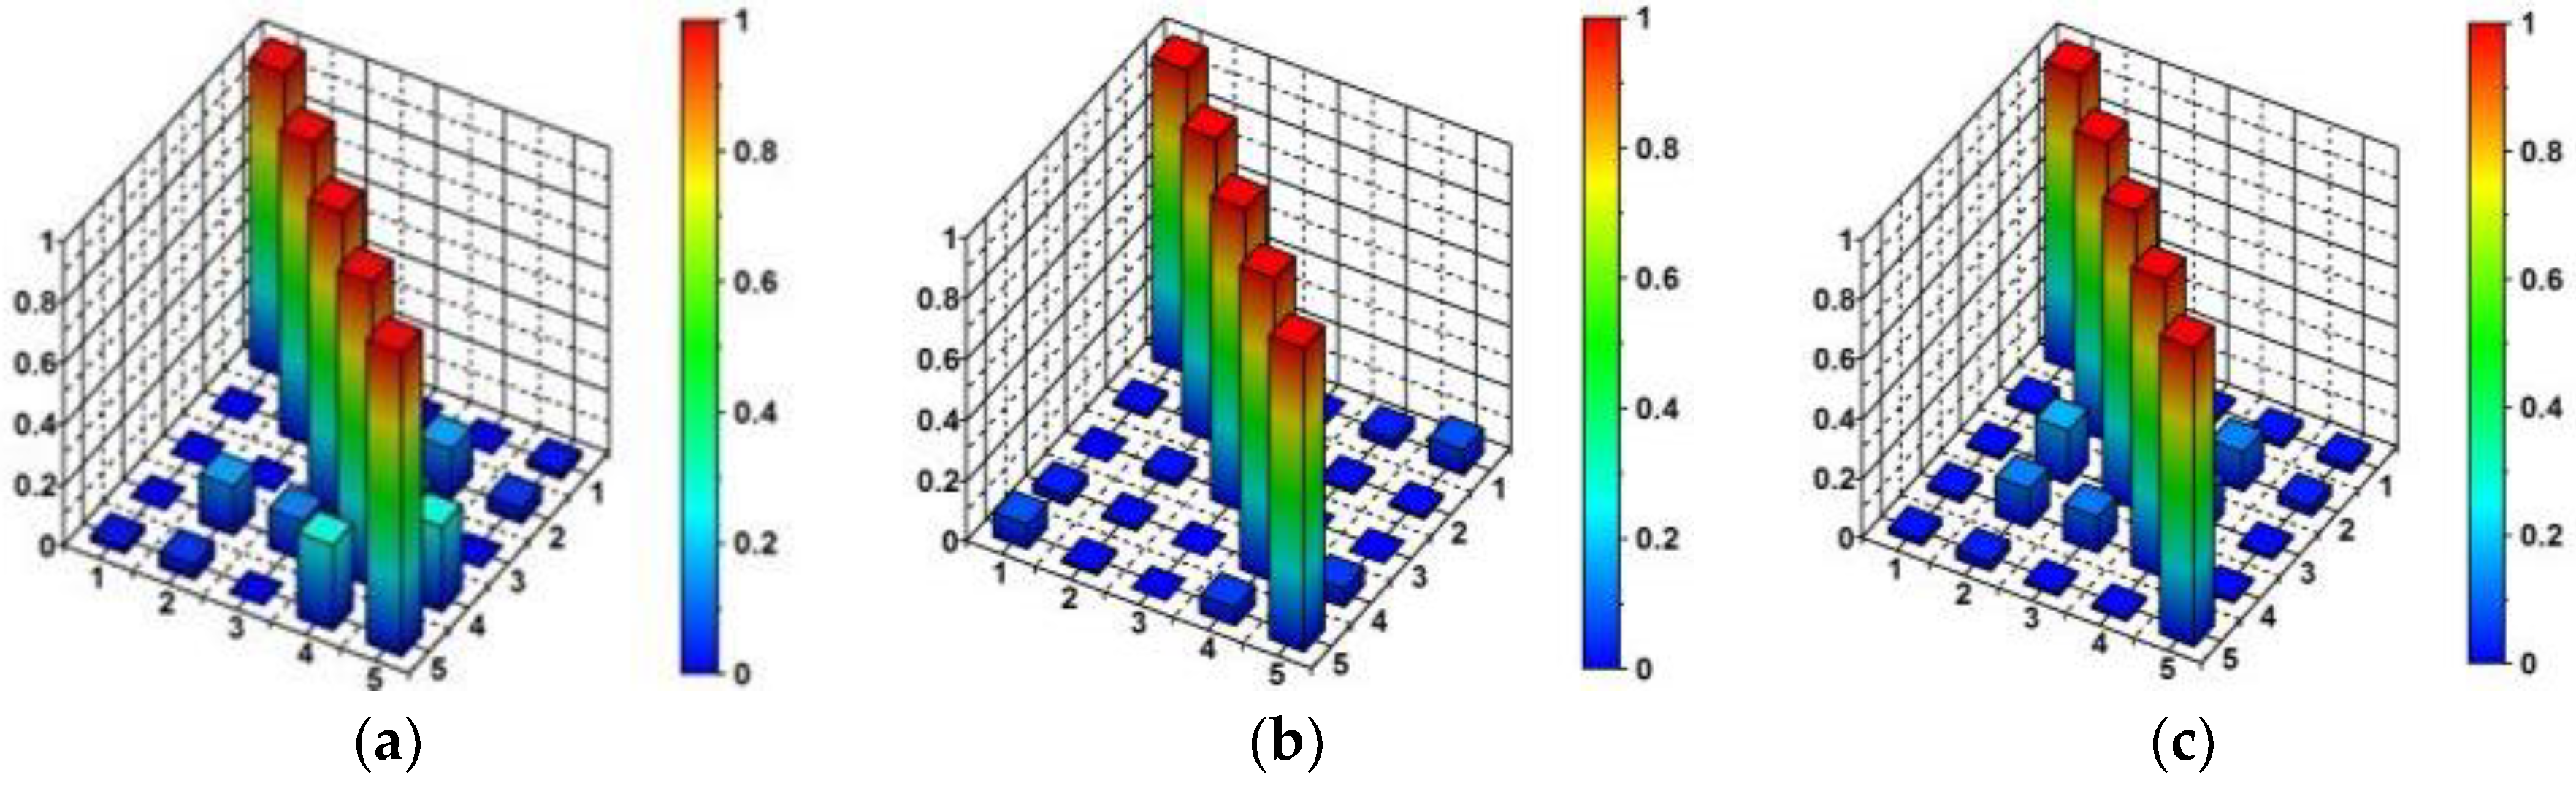
5.1. Investigation of Self-Correlation of the Experimental Mode Shapes

After the local maxima of the calculated estimator functions had been identified as consecutive natural frequencies and the modes of natural vibrations had been assigned to each natural frequency, validation of the experimentally-obtained dynamic properties was carried out by means of the AutoMAC tool. Using this tool, expressed by Equation (4), it was possible to verify the locations of measurement points and, consequently, to select the degrees of freedom of the experimental modal models. AutoMAC values were calculated as a self-correlation of the experimental sets of mode shape vectors. The AutoMAC values (in 3-D graphic as well as matrix presentations), which were used for modal shape validation, are shown in Figure 15 for the three experimental modal models. On the basis of the presented AutoMAC values (less than 0.2 out of the diagonal), a correlation between mode shape vectors was ruled out.

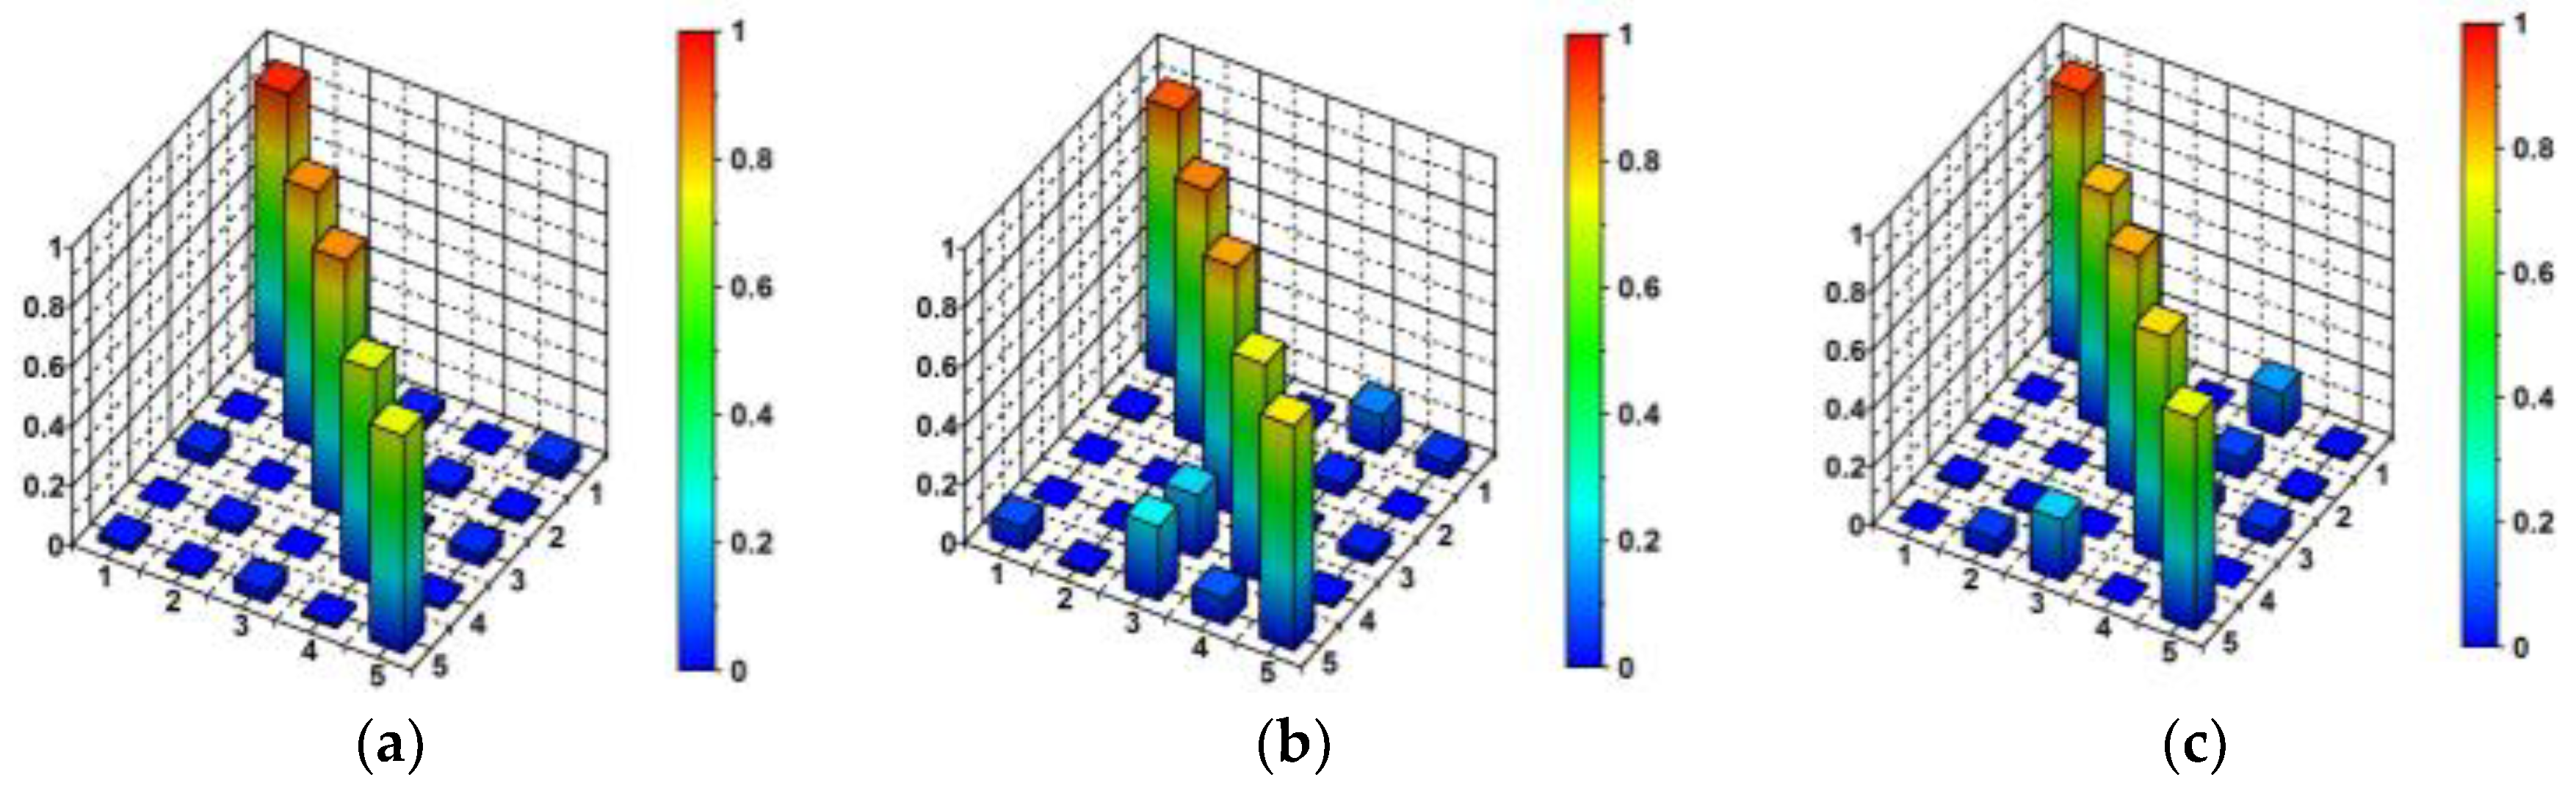
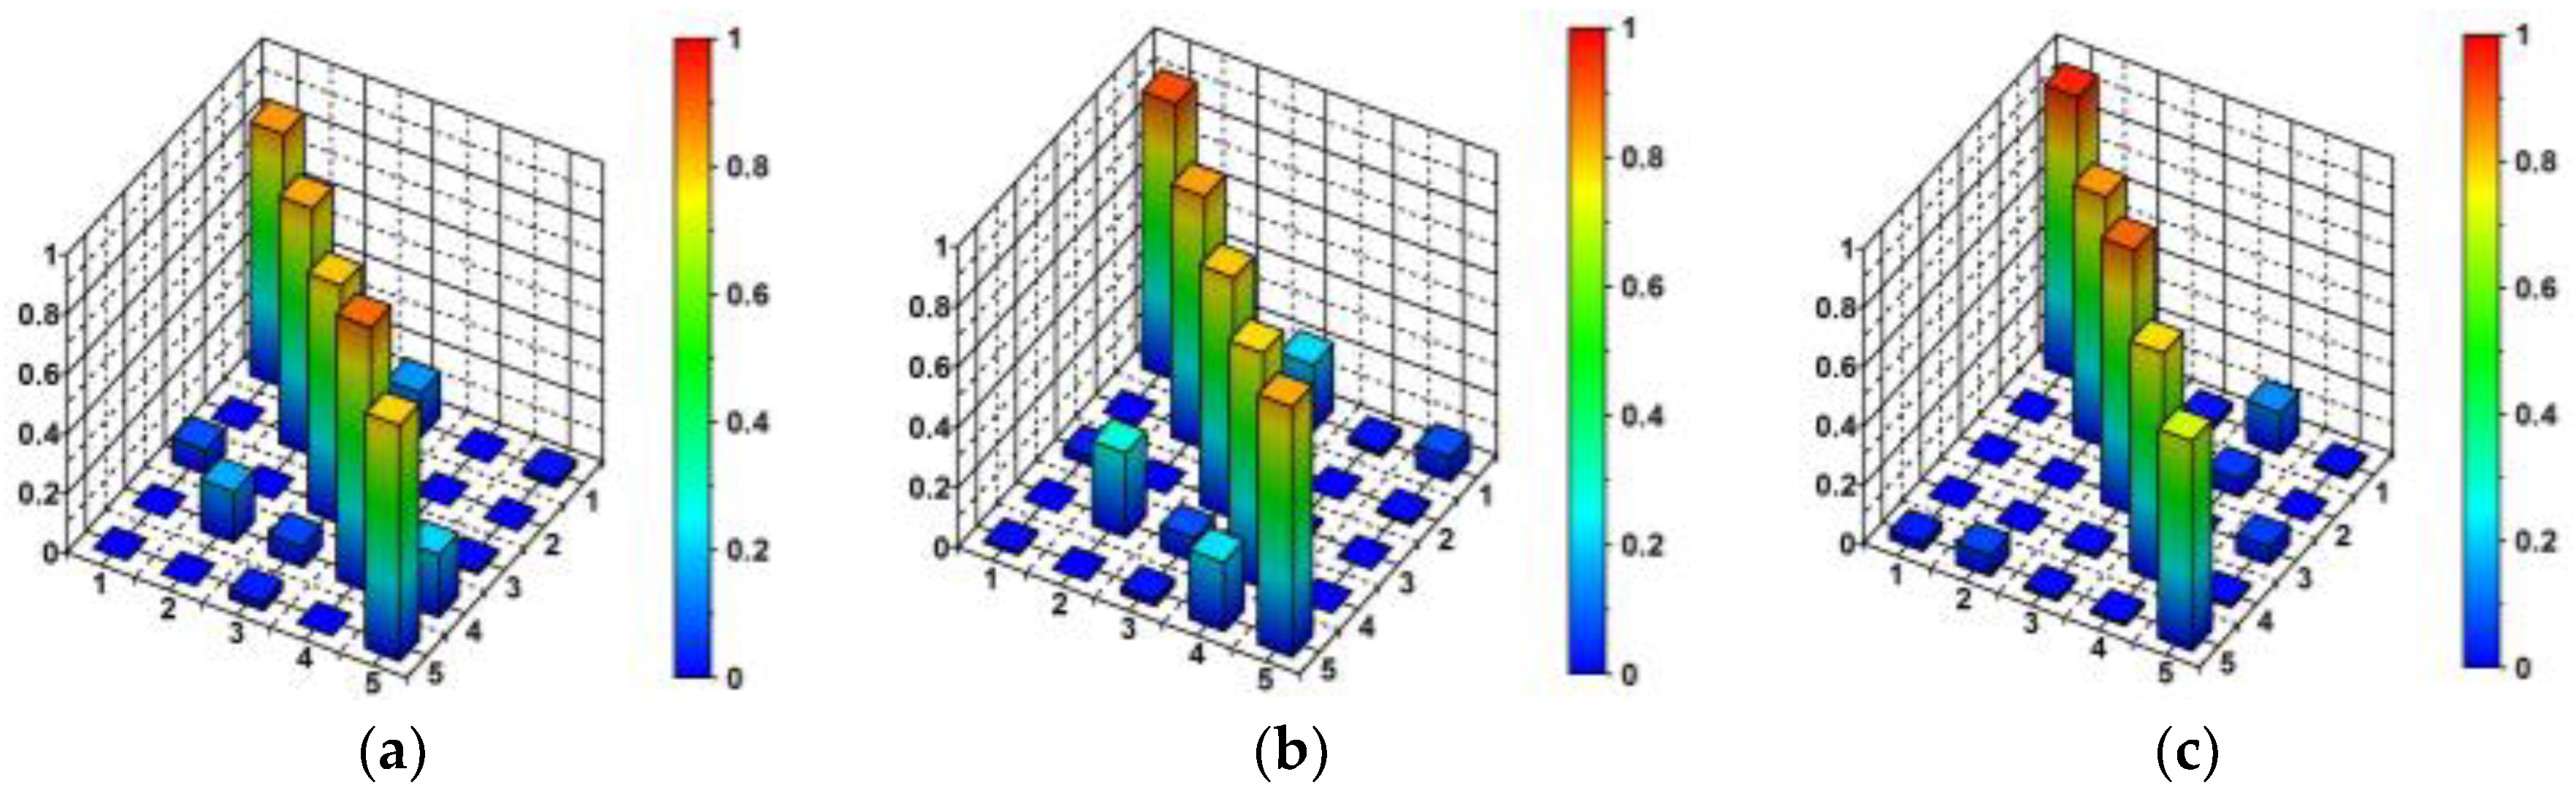
5.2. Experimental and Numerical Modal Models Validation

Taking into consideration the A u t o M A C positive validation of dynamic properties of the footbridge in terms of the non-correlation of the mode shapes obtained in three experimental ways, further validation of the experimental and numerical modal models was performed. Firstly, as shown in Table 4, the values of natural frequencies obtained for the different modal models were compared. As a measure of the similarity of natural frequencies, the errors between numerical and experimental results were analyzed.
Secondly, the MAC tool, which is expressed by Equation (4), was used to validate the mode shapes. This criterion was used to check the similarities between three experimental sets of mode shape vectors (see Figure 16) as well as to verify the numerical modes with respect to each experiment result (see Figure 17). It is clearly visible from Figure 16 and Figure 17 that the M A C indices related to different modes are not always equal to zero and that the M A C indices related to the same modes are not always equal to one. This inaccuracy could be explained by the limited number of measurement points used in the in situ tests (see Figure 6). However, still, more than 90% of the obtained M A C values fulfilled the criteria of being greater than 0.8 on the matrix diagonals and being less than 0.2 on the diagonals.
Five natural frequencies located within the range 0–5 Hz were recognized. Strong agreement was found between the results taken from the numerical and experimental methods (Table 4). The mean error value reached 5%, and the maximal error value did not exceed 19%. The identified values of the natural frequencies were located outside the frequency range defined as having the “maximum risk of resonance” by the SETRA document [13] for both the vertical and horizontal directions. However, the value of the fourth natural frequency, associated with vertical vibrations of the footbridge deck, corresponded with loading generated during very fast running or jumping [2].
The results of the three experimental investigations indicated a strong resemblance. In particular, the results of the experiment with shock excitation and slow sine sweep testing were very similar; the differences did not exceed 4%. The values of natural frequencies obtained from the ambient vibration analysis showed greater values (up to 20% for the fourth eigenfrequency) in comparison with the results of the shock excitation experiment. The verified sets of experimental mode shapes (i.e., taken from shock excitation, ambient vibration, and slow sine sweep testing experiments) indicated non-correlations of particular modes and showed strong similarity as far as the values of the M A C indices were concerned. The experimentally-obtained mode shape vectors provided data for validation of the FE model of the footbridge. Taking into consideration the satisfactory level of agreement between the obtained numerical and experimental results, the FE model was not updated. Procedures that were provided in the study allowed calibration of the FE model. First of all, the sets of verified eigenpairs were extracted. Then, it was possible to calibrate the FE model. For better compliance of the numerical modal model with experimental results, some modifications of the FE model properties are possible. Firstly, the material properties should be verified. The numerical solutions for the different connectors (e.g., the hangers’ connections with the deck and frame) in the structure could be modified as well. Finally, the boundary conditions of the footbridge could also be modified.

6. Conclusions

In the presented research, an investigation of the dynamic properties of a single-span steel-frame footbridge was performed. The structure that was chosen as an experimental setup is not a typical example of a footbridge, because its mass and stiffness are both relatively large. Hence, verification of the different types of excitation that could be applied for the modal analysis of this type of structure was possible. The modal models of the footbridge were obtained on the basis of numerical and experimental assessments. The authors positively validated the obtained results; the modal assurance criterion ( MAC ) was used for this purpose.
The sets of mathematical tools that were used in the study were also verified. For the experiment with shock excitation (dropping of a large mass) the power spectrum density (PSD) function was used as an estimator of eigenfrequencies. This simple Fourier analysis tool was very effective for the strong shock excitation resulting in free decay plots. For the experiment with the THOMAS apparatus, the frequency response function (FRF) was adopted. This estimator used input and output data. In the case of the shaker located near the structure, the input (sensors in points F, G) and output data (sensors in points A–E) could easily be collected. Simpler tools operating on output signals only (like FFT or PSD) were practically useless and could fail in this case, because the dynamic response of a structure depends not only on its dynamic properties but also on the frequency–amplitude characteristics of the source of excitation (input signal) as well. For ambient vibration analysis, the summation of all combinations of auto- and cross-spectral density functions between all output data registered at measurement points A1, A2, B, C, D1, D2, E1, and E2 was used. Since input signals were unknown, the FRF estimator could not be used.
The results of the research might be applicable to the dynamic study of the structure type considered in the analysis, i.e., for the dynamic assessment of single-span steel-frame footbridges with relatively large mass as well as stiffness. The elaborated methodology could be also useful for other types of footbridge structure. In general, on the basis of the results, the use of experimental modal tests with different types of excitation increases the reliability and accuracy of the overall assessment of a structure. The results of the three experimental investigations indicated a strong resemblance. In particular, the results of the experiments with two strong sources, i.e., shock excitation and slow sine sweep testing, were almost identical. For unique structures, it is important to self-verify experimental modal models. The investigation has also proved that ambient vibration modal experiments are sufficient for the footbridge. Consequently, this type of dynamic excitation could be used for the proof load testing and acceptance modal tests of similar footbridges.

Author Contributions

Conceptualization, I.J.D. and J.M.D.; data curation, I.J.D.; formal analysis, J.M.D.; investigation, I.J.D. and J.M.D.; methodology, I.J.D. and J.M.D.; supervision, J.M.D.; validation, I.J.D.; visualization, I.J.D.; Writing—Original Draft, I.J.D.; Writing—Review & Editing, J.M.D.

Funding

This research received no external funding.

Acknowledgments

The authors would like to acknowledge the Laboratory for Deformation and Vibration of Structures (CUT, http://www.drganiabudowli.pl/).

Conflicts of Interest

The authors declare no conflict of interest.

References

  1. Bachmann, H. ‘Lively’ footbridges—Real challenge. In Proceedings of the International Conference on the Design and Dynamic Behaviour of Footbridges, Footbridge 2002, Paris, France, 20–22 November 2002. [Google Scholar]
  2. Flaga, A. Footbridges; WKŁ: Warsaw, Poland, 2011. (In Polish) [Google Scholar]
  3. Caetano, E.; Cunha, A. Dynamic Design of Slender Footbridges. Structures and Architecture: Concepts, Applications and Challenges. In Proceedings of the 2nd International Conference on Structures and Architecture (ICSA 2013), Guimarães, Portugal, 24–26 July 2013. [Google Scholar]
  4. Oviedo-Trespalacios, O.; Scott-Parker, B. Footbridge usage in high-traffic flow highways: The intersection of safety and security in pedestrian decision-making. Transp. Res. Part F Traffic Psychol. Behav. 2017, 49, 177–187. [Google Scholar] [CrossRef]
  5. Drygala, I.J.; Polak, M.A.; Dulinska, J.M. The dynamic evaluation of composite materials footbridges. In Proceedings of the 39th IABSE Symposium, Vancouver, IABSE c/o ETH Hönggerberg, Zürich, Switzerland, 21–23 September 2017; pp. 2285–2292. [Google Scholar]
  6. Russell, J.; Wei, X.; Živanović, S.; Kruger, C. Dynamic Response of an FRP Footbridge due to Pedestrians and Train Buffeting. Procedia Eng. 2017, 199, 3059–3064. [Google Scholar] [CrossRef]
  7. Dallard, P.; Fitzpatrick, A.J.; Flint, A.; Le Bourva, S.; Low, A.; Ridsdill Smith, R.M.; Willford, M. The London Millennium Footbridge. Struct. Eng. 2001, 79, 17–33. [Google Scholar]
  8. Piccardo, G.; Tubino, F. Equivalent spectral model and maximum dynamic response for the serviceability analysis of footbridges. Eng. Struct. 2012, 40, 445–456. [Google Scholar] [CrossRef]
  9. Ali, N.B.H.; Rhode-Barbarigos, L.; Albi, A.A.P.; Smith, I.F.C. Design optimization and dynamic analysis of a tensegrity-based footbridge. Eng. Struct. 2010, 32, 3650–3659. [Google Scholar] [CrossRef]
  10. Živanović, S.; Pavic, A.; Reynolds, P. Vibration serviceability of footbridges under human-induced excitation: A literature review. J. Sound Vib. 2005, 279, 1–74. [Google Scholar] [CrossRef]
  11. Matsumoto, Y.; Nishioka, T.; Shiojiri, H.; Matsuzaki, K. Dynamic design of footbridges. IABSE Proc. 1978, 17, 1–15. [Google Scholar]
  12. Van Nimmen, K.; Lombaert, G.; De Roeck, G.; Van den Broeck, P. Vibration serviceability of footbridges: Evaluation of the current codes of practice. Eng. Struct. 2014, 59, 448–461. [Google Scholar] [CrossRef]
  13. Association Française de Génie Civil (AFGC). SÉTRA 2006: Assessment of Vibrational Behaviour of Footbridges under Pedestrian Loading; Technical Guide; Technical Department for Transport, Roads and Bridges Engineering and Road Safety: Paris, France, 2006. [Google Scholar]
  14. EN 1990:2002/Al (2005) Eurocode—Basis of Structural Design; CEN: Brussels, Belgium, 2005.
  15. Pańtak, M. Elaboration of the vibration comfort criteria for footbridges during vibrations induced by pedestrians. In Bridge Maintenance, Safety, Management, Resilience and Sustainability, Proceedings of the Sixth International Conference on Bridge Maintenance, Safety and Management, Lake Maggiore, Italy, 8–12 July 2012; CRC Press: Boca Raton, FL, USA, 2012; pp. 2334–2339. [Google Scholar]
  16. Živanović, S.; Pavic, A.; Reynolds, P. Finite element modelling and updating of a lively footbridge: The complete process. J. Sound Vib. 2007, 301, 126–145. [Google Scholar] [CrossRef]
  17. Lai, E.; Gentile, C.; Mulas, M.G. Experimental and numerical serviceability assessment of a steel suspension footbridge. J. Constr. Steel Res. 2017, 132, 16–28. [Google Scholar] [CrossRef]
  18. Murzyn, I.J. Dynamic Response Analysis of Footbridges under Seismic and Paraseismic Loading. Ph.D. Thesis, Cracow University of Technology (CUT), Kraków, Poland, 2016. (In Polish). [Google Scholar]
  19. Tubino, F. Probabilistic assessment of the dynamic interaction between multiple pedestrians and vertical vibrations of footbridges. J. Sound Vib. 2018, 417, 80–96. [Google Scholar] [CrossRef]
  20. Drygala, I.J.; Dulinska, J.M. A theoretical and experimental evaluation of the modal properties of a cable-stayed footbridge. Procedia Eng. 2017, 199, 2937–2942. [Google Scholar] [CrossRef]
  21. Marecik, K.; Pańtak, M. A comparative analysis of selected models of pedestrian-generated dynamic loads on footbridges-vertical loads. MATEC Web Conf. 2018, 222. [Google Scholar] [CrossRef]
  22. Wootton, A.J.; Butcher, J.B.; Kyriacou, T.; Day, C.R.; Haycock, P.W. Structural health monitoring of a footbridge using Echo State Networks and NARMAX. Engineering Applications of Artificial Intelligence. Eng. Appl. Artif. Intell. 2017, 64, 152–163. [Google Scholar] [CrossRef]
  23. Occhiuzzi, A.; Spizzuoco, M.; Ricciardelli, F. Loading models and response control of footbridges excited by running pedestrians. Struct. Control Health Monit. 2008, 15, 349–368. [Google Scholar] [CrossRef]
  24. Salgado, R.; Brancob, J.M.; Cruz, P.J.S.; Ayala, G. Serviceability assessment of the Góis footbridge using vibration monitoring. Case Stud. Nondestruct. Test. Eval. 2014, 2, 71–76. [Google Scholar] [CrossRef]
  25. Taylor, I.J.; Vezza, M. A numerical investigation into the aerodynamic characteristics and aeroelastic stability of a footbridge. J. Fluid Struct. 2009, 25, 155–177. [Google Scholar] [CrossRef]
  26. Drygala, I.J.; Dulinska, J.M.; Wazowski, M. Seismic performance of a cable-stayed footbridge using a concrete damage plasticity model. Procedia Eng. 2017, 193, 525–532. [Google Scholar] [CrossRef]
  27. Wang, D.; Wu, C.; Zhang, Y.; Li, S. Study on vertical vibration control of long-span steel footbridge with tuned mass dampers under pedestrian excitation. J. Constr. Steel Res. 2019, 154, 84–98. [Google Scholar] [CrossRef]
  28. Gheitasi, A.; Ozbulut, O.E.; Usmani, S.; Alipour, M.; Harris, D.K. Experimental and analytical vibration serviceability assessment of an in-service footbridge. Case Stud. Nondestruct. Test. Eval. 2016, 6, 79–88. [Google Scholar] [CrossRef]
  29. Simulia Corp. ABAQUS Users’ Manual v. 6.13; Dassault Systemes Simulia Corp.: Providence, RI, USA, 2013. [Google Scholar]
  30. Ewins, D.J. Modal Testing: Theory, Practise and Application, 2nd ed.; Research Studies Press Ltd.: Philadelphia, PA, USA, 2000. [Google Scholar]
  31. Lalanne, C. Mechanical Vibration and Shock Analysis, 2nd ed.; ISTE Ltd.: London, UK, 2009; Volume 2. [Google Scholar]
  32. Uhl, T.; Lisowski, W.; Kurowski, P. In-Operation Modal Analysis and Its Application; Wydawnictwo Katedry Robotyki i Dynamiki Maszyn, University of Science and Technology: Krakow, Poland, 2001. [Google Scholar]
  33. Ting, T.; Chen, T.L.C.; Twomey, W. Correlating mode shapes based on the modal assurance criterion. Finite Elem. Anal. Des. 1993, 14, 353–360. [Google Scholar] [CrossRef]
  34. Guo, N.; Yang, Z.; Wang, L.; Ouyang, Y.; Zhang, X. Dynamic model updating based on strain mode shape and natural frequency using hybrid pattern search technique. J. Sound Vib. 2018, 422, 112–130. [Google Scholar] [CrossRef]
  35. Au, S.K.; Zhang, F.L. On assessing the posterior mode shape uncertainty in ambient modal identification. Probabilist Eng. Mech. 2011, 26, 427–434. [Google Scholar] [CrossRef]
  36. Buckle, I.; Nagarajaiah, S.; Ferrell, K. Stability of Elastomeric Isolation Bearings: Experimental Study. J. Struct. Eng. 2002, 128, 3–11. [Google Scholar] [CrossRef]
Figure 1. General concept of the investigation.
Symmetry 11 00404 g001
Figure 2. THOMAS vibroseis apparatus.
Symmetry 11 00404 g002
Figure 3. The footbridge structure: (a) steel frame during the montage, (b) the footbridge after assembly [18].
Symmetry 11 00404 g003
Figure 4. Side view of the pedestrian bridge over the national expressway located in Jawornik (Southern Poland) [18].
Symmetry 11 00404 g004
Figure 5. The structural layout of the pedestrian bridge over the national expressway located in Jawornik (Southern Poland) [18]: (a) cross-section, (b) steel frames of the footbridge.
Symmetry 11 00404 g005
Figure 6. Locations of measurement points during the in situ experiments.
Symmetry 11 00404 g006
Figure 7. The time-frequency characteristics of the THOMAS tests: (a) linear sweep, (b) exponential sweep.
Symmetry 11 00404 g007
Figure 8. The three-dimensional FE model of the footbridge.
Symmetry 11 00404 g008
Figure 9. The mode shapes obtained through the numerical investigation: (a) first mode, (b) second mode, (c) third mode, (d) fourth mode, (e) fifth mode.
Symmetry 11 00404 g009
Figure 10. Time histories of accelerations registered at measurement point A2 in the vertical direction resulting from (a) shock excitation, (b) ambient vibration, and (c) slow sine sweep testing.
Symmetry 11 00404 g010
Figure 11. Natural frequency estimators for different sources of vibration: (a) shock excitation (power spectral density function, PSD), (b) ambient vibration (the summation of all combinations of auto- and cross-spectral density functions (PSD and CSD) between all output data registered in measurement points, (c) slow sine sweep testing (frequency response function, FRF).
Symmetry 11 00404 g011
Figure 12. The shock excitation: (a) time history of horizontal accelerations in the X direction at point A1, (b) time history of horizontal accelerations in the X direction at point A2, (c) time histories of horizontal accelerations in the X direction at points A1 and A2 filtered around the first natural frequency, 1.72 Hz, (d) time histories of horizontal accelerations in the X direction at points A 1 and A 2 filtered around the second natural frequency, 2.61 Hz.
Symmetry 11 00404 g012
Figure 13. Time history of vertical acceleration registered at point A1: (a) due to ambient excitation including the dynamic response to heavy truck passage, (b) 60 s-long signal filtered around the first eigenfrequency, 1.72 Hz, (c) 60 s-long signal filtered around the second eigenfrequency, 2.61 Hz.
Symmetry 11 00404 g013aSymmetry 11 00404 g013b
Figure 14. Time history of vertical acceleration registered at point A1: (a) signal resulting from the 65 s-long exponential sweep with frequencies starting from 2 to 50 Hz, (b) signal filtered around the first eigenfrequency, 1.72 Hz, (c) signal filtered around the second eigenfrequency, 2.61 Hz.
Symmetry 11 00404 g014
Figure 15. Three-dimensional presentation of A u t o M A C values for validation of: (a) the 1st modal model (shock excitation), (b) the 2nd modal model (ambient vibrations), (c) 3rd modal model (sine sweep testing).
Symmetry 11 00404 g015
Figure 16. Three-dimensional presentation of M A C values for correlations between: (a) the 1st and 2nd experimental modal models (shock excitation test vs. ambient vibrations test), (b) the 1st and 3rd experimental modal models (shock excitation test vs. slow sine sweep test), (c) the 2nd and 3rd experimental modal models (ambient vibrations test vs. slow sine sweep test).
Symmetry 11 00404 g016
Figure 17. Three-dimensional presentation of M A C values for correlations between (a) the numerical and the 1st experimental modal models (numerical results vs. shock excitation test), (b) the numerical and the 2nd experimental modal models (numerical results vs. ambient vibrations test), (c) the numerical and the 3rd experimental modal models (numerical results vs. slow sine sweep test).
Symmetry 11 00404 g017
Table 1. Natural frequencies (Hz) estimated through the numerical investigation.
Modal ModelNatural Frequency (Hz) Corresponding to:
1st Mode2nd Mode3rd Mode4th Mode5th Mode
Numerical1.712.453.333.414.40
Table 2. Natural frequencies (Hz) estimated through the experimental investigation.
Experimental Modal ModelNatural Frequency (Hz) Corresponding to:
1st Mode2nd Mode3rd Mode4th Mode5th Mode
Shock excitation1.722.613.043.494.44
Ambient vibration1.762.683.154.194.47
Sine sweep testing1.772.612.933.454.44
Table 3. Logarithmic decrement [-] estimated through the experimental investigation.
Experimental Modal ModelLogarithmic Decrement [-] Corresponding to:
1st Mode2nd Mode3rd Mode4th Mode5th Mode
Shock excitation0.1450.1080.0750.0460.029
Ambient vibration0.1310.1010.0560.0350.025
Sine sweep testing0.1390.1050.0630.0420.026
Table 4. Natural frequencies (Hz) of the footbridge and the error (%) of the numerical frequencies with respect to the experimental results.
ModeNumerical Analysis [Hz]Shock ExcitationAmbient VibrationSlow Sine Sweep Testing
fi [Hz]Error [%]fi [Hz]Error [%]fi [Hz]Error [%]
11.711.720.581.762.841.773.39
22.452.616.132.688.582.616.13
33.333.049.543.155.712.9313.65
43.413.492.294.1918.623.451.16
54.404.440.904.471.574.440.90

