Article

A Multiobjective Integer Linear Programming Model for the Cross-Track Line Planning Problem in the Chinese High-Speed Railway Network

School of Traffic and Transportation, Beijing Jiaotong University, Beijing 100044, China
*
Author to whom correspondence should be addressed.
Symmetry 2019, 11(5), 670; https://doi.org/10.3390/sym11050670
Submission received: 1 April 2019 / Revised: 6 May 2019 / Accepted: 9 May 2019 / Published: 15 May 2019

Abstract

:
In China, cross-track high-speed trains (CTHSTs) play an important role in railway passenger transportation, with an increasing number of cross-track passengers sourced from the expansion of high-speed railway (HSR) network. The CTHST generally has long travel times, so running CTHSTs is not beneficial for train rescheduling work and plan’s periodicity in the periodic operation context. Thus, the main challenge in cross-track line planning is looking for a symmetry point between passenger transportation and disadvantages of running CTHSTs, which are two conflicting aspects. In this study, we developed a multiobjective integer programming model to produce a balanced cross-track line plan by combining individual-track high-speed trains (ITHSTs) into CTHSTs, which is a discrete optimization problem. This strikes a balance among four goals: the periodicity of the line plan, CTHST quantity, CTHST mileage, and CTHST stops in the context of periodic operation, while satisfying the constraints of passenger demand and the number of available ITHSTs. Numerical experiments are conducted based on a real-world network and optimal solutions were quickly obtained. We analyzed impacts of each goal and parameter on the result and influencing factors of computation. Comparisons with existing methods and real-life plans were also presented to show improvements made by proposed model.

1. Introduction

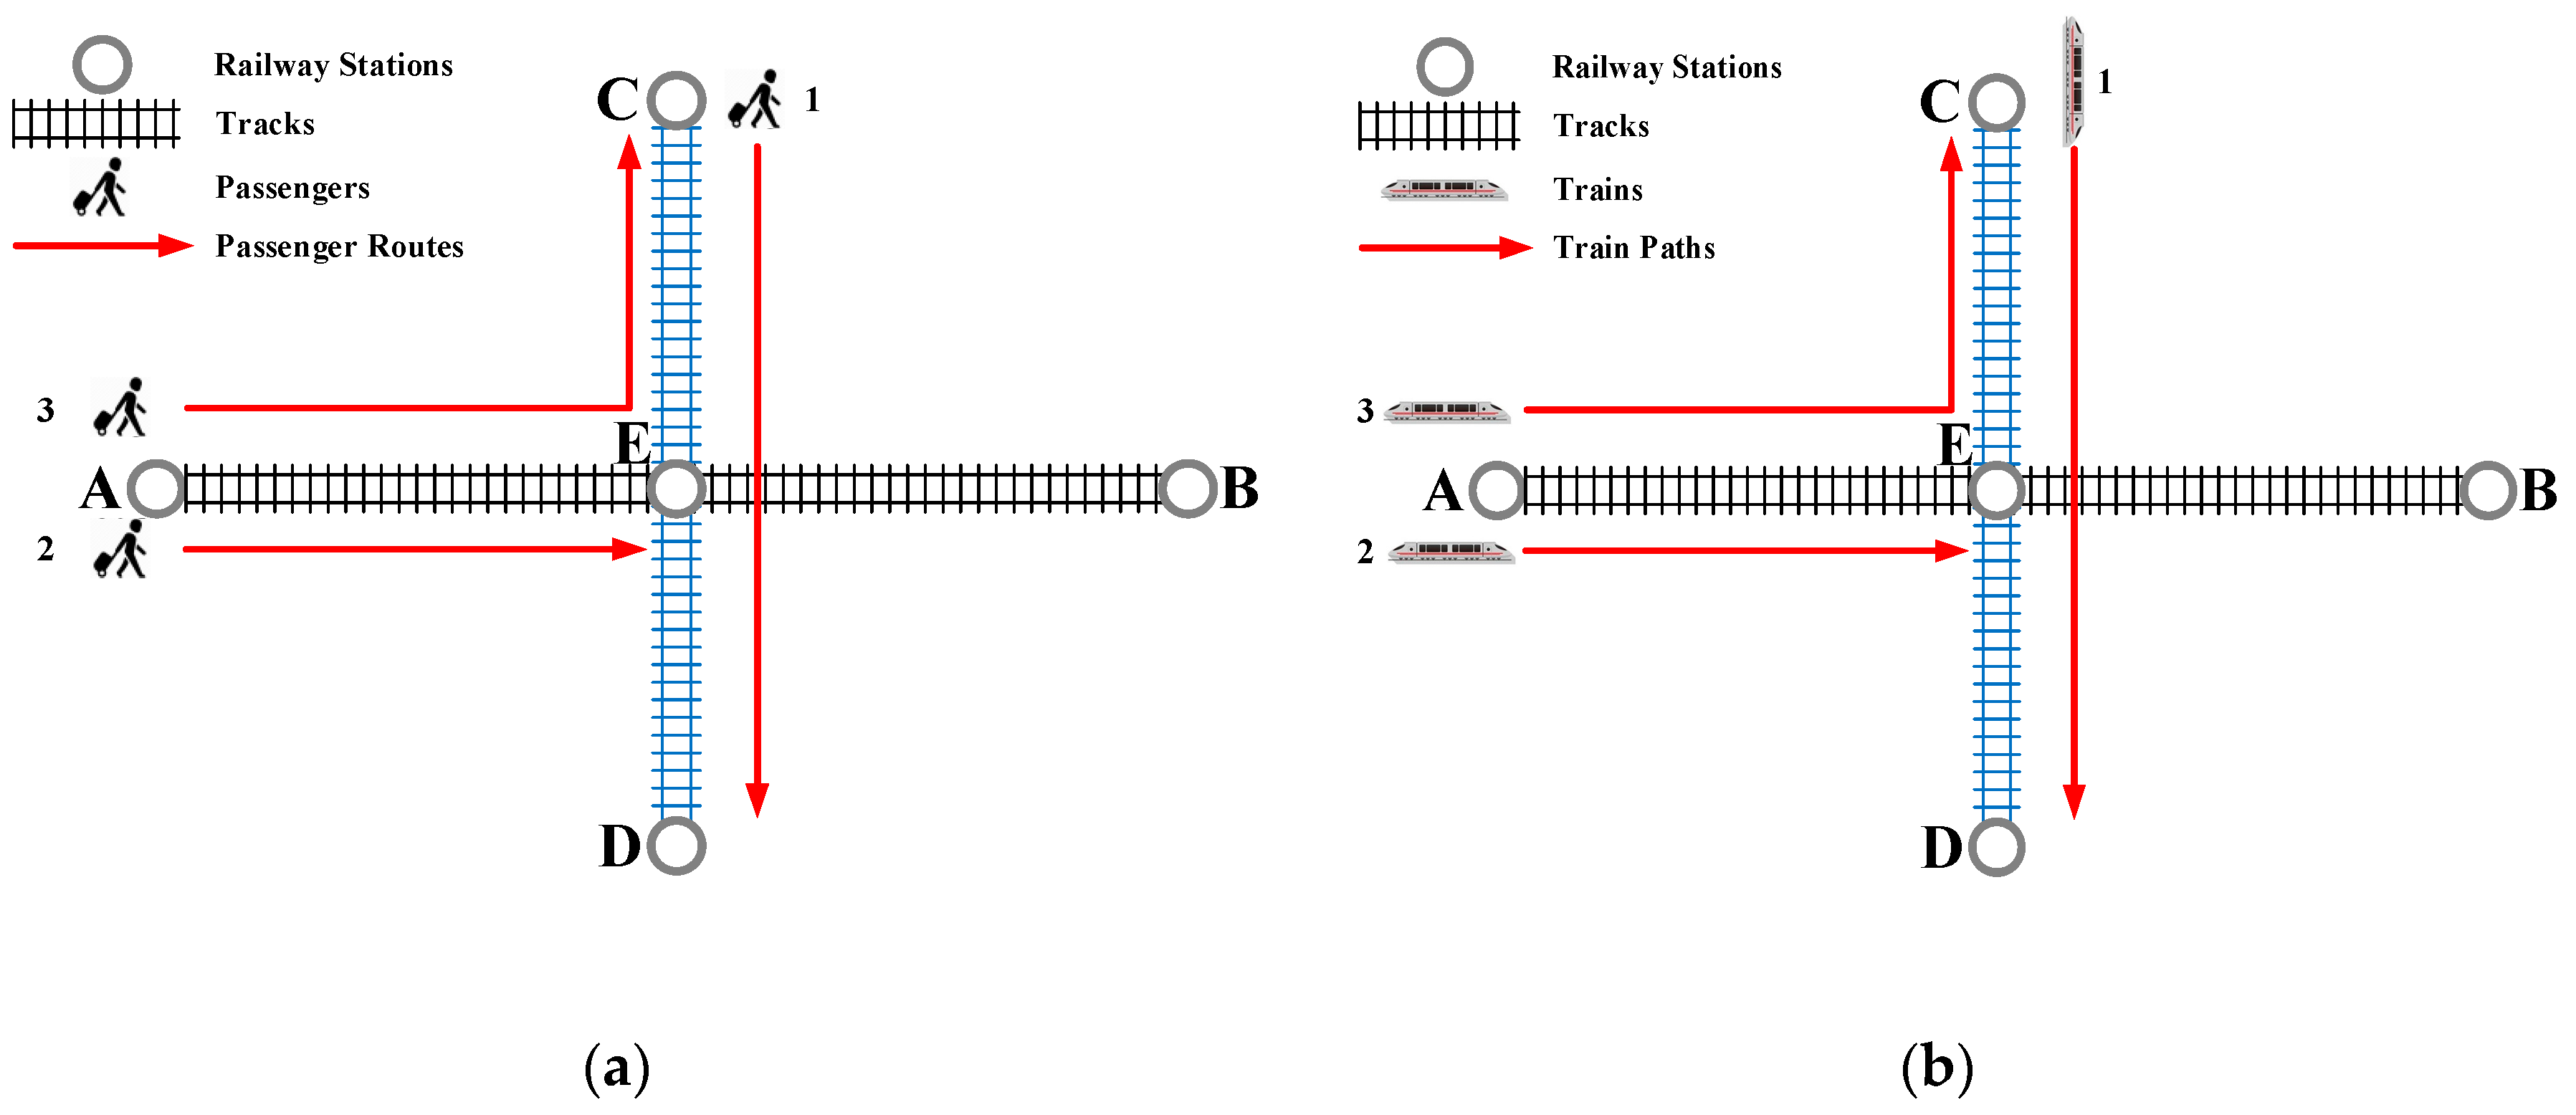
Since the late 2000s, China’s high-speed railway (HSR) has experienced large growth, and its network has expanded from a single HSR line to multiple HSR lines forming an intersected network. By the end of 2015, China completed the construction of the HSR network, which is mainly formed by Four Vertical and Four Horizontal HSR lines (FVFH-HSR, i.e., four north–south HSR lines and four east–west HSR lines), with a total mileage of 19,000 km. By 2020, this mileage will exceed 30,000 km. With the quick expansion of the HSR network, the number of cross-track passengers, who pass through more than one individual railway line along their trips (e.g., passenger 3 in Figure 1a, whose origin station is on Track A–B and destination station is on Track C–D), is rapidly increasing. In this case, determining how to rationally create a reasonable line plan (i.e., a set of train paths together with their frequencies) to serve this important group of passengers is urgently required, but this is a complex problem since there are many aspects needed to be considered in this issue: passenger demand, periodicity of the line plan, train scheduling/rescheduling work, and so on. A good cross-track line plan needs to strike a balance among all aspects.
A railway network is composed of many tracks (in other words, railway lines). Figure 2 shows a HSR network which is the main framework of China’s HSR network in the year of 2015. In the figure, there are eight tracks interlacing at intermediate stations (e.g., track BJW—SZN and track BaJS—XZE) or connecting at terminal stations (e.g., track BJS—SHHQ and track SHHQ—CSS). As for the passengers travelling in this network, there are two kinds of passengers according to the number of tracks covered by passenger’s travel: the individual-track passengers and cross-track passengers. The former one represents passengers traveling on only one track (in other words a railway line) and latter one denotes passengers traveling on two or more tracks. According to the similar classification rule, trains can be classified by individual-track train (ITT) and cross-track train (CTT). An illustrative example is given in Figure 1. There are five railway stations labeled A, B, C, D, and E. Track A–B and Track C–D are two tracks interlacing at Station E (which is named the crossing station in this paper). In this simple network, trains 1 and 2 are ITTs running on only one track, while train 3 is a CTT because it runs on both track A–B and C–D. By the way, the ITTs and CTTs running on HSR are individual-track high-speed trains (ITHSTs) and cross-track high-speed trains (CTHSTs) respectively.
Correspondingly, there are two kinds of ways to transport cross-track passengers. The first one is transfer pattern. In this way, passengers need to take more than one ITTs via transfers at crossing stations (e.g., Station B in Figure 3). And the other one is direct pattern provided by CTHSTs. By taking CTHSTs, cross-track passengers do not need to make any transfer during their trips. These two patterns are shown in Figure 3.
However, there is a difference between European countries and China to serve cross-track passengers. In Europe, transfer pattern is widely used by passengers. It is because that the railway lines in Europe are generally shorter than those of China, which makes it possible to adopt periodic timetables. In this case, the ITTs of different tracks are operated regularly, which is beneficial for passengers to make transfers between different tracks. What is more, the railway station in Europe is an open system and people can move freely inside the station, which make transfers more convenient. Unlike Europe, tracks in China are much longer, which makes it less possible to apply periodic timetables. Also, the transfer mode cannot be widely used in China given its inconvenience in China’s context. The railway station in China is a closed system. People need to go through a quick security check when entering the station. Furthermore, they cannot move from one platform to another inside the station because the passage to the platform is unidirectional. Therefore, passengers who want to transfer tracks first need to leave the station by another passage and then check in again with a security check, which is inconvenient. In the last few years, some main stations in the Chinese HSR network have installed bidirectional automatic fare gates to support transfers inside the station and this improvement may be implemented at more stations in the future. However, since the timetable is nonperiodic in China (which performs worse than periodic timetables in terms of transfer) and the railway company has also paid much attention to the directness of the transportation service, passengers in China still prefer to go to their destination by direct trains. Therefore, direct travel service is the main pattern of transporting passengers in China’s railway system, and cross-track passengers are mainly served by CTHSTs which can provide direct travel service for cross-track travels. In this context, CTHST plays an important role in China’s HSR system, and a certain proportion of CTHSTs will become a feature of China’s HSR. For example, in the current timetable of the Beijing–Shanghai HSR, CTHSTs represent 64% of the train fleet [1].
Despite the important role of CTHST in serving cross-track passengers, there are also some drawbacks in running CTHSTs. First, as CTHSTs need to pass through no less than two tracks, when a delay occurs on a CTHST, many trains on the related tracks are affected. Thus, from the dispatcher’s point of view, it is not optimal to run too many CTHSTs. Second, as the running distance of the CTHST is generally longer, some CTHSTs cannot be operated periodically. Moreover, the travel demand for many cross-track origin-destination (OD) pairs is relatively low, so it is also unnecessary for some CTHSTs to be periodic trains. Therefore, in the periodic operation pattern, running nonperiodic CTHSTs will affect the periodicity of the whole plan. Third, due to the long running distance and large number of intermediate stops, a CTHST’s travel time is generally long and the running speed is usually low. As a result, some long-distance travelers will spend more time on their journeys and may not be satisfied with the travel service. Thus, it is also necessary to minimize the running distance and the number of stops of CTHSTs. In this case, we need to strike a balance between running CTHSTs and minimizing their disadvantages.
Given the above, i.e., Chinese travel habits, railway transportation modes, and the HSR network features, the CTHST plays an important role in China’s railway transportation system. In reality, the cross-track line plan is mainly designed based on the experience of the plan-makers instead of optimal programming in China, which cannot guarantee the accuracy and optimality of the plan. On the other hand, due to the large scale of the network, different train stop patterns and the high speed of CTHSTs, situations of cross-track travel and line planning are diverse worldwide. Besides, the existing methods of line planning will make the cross-track line planning problem hard to be computed (which will be explained in Section 2) in China. Therefore, we propose a new line planning strategy and introduce a model for cross-track line planning. The model proposed in this paper generated a line plan that not only meets the cross-track passenger demand but also comprehensively optimizes the train quantity, stop quantity, running mileage, and periodicity of the line plan, thus striking a balance between passenger transportation and the negative effects of running CTHSTs. The model formulation is firstly proposed for a simple case where only two tracks are involved and was then expanded to general formulation for multiple tracks. The proposed model quickly obtains optimal solutions.
The main contributions of this paper are as follows.
(1)
Due to the important role that the CTHST plays in China’s HSR system and the lack of an efficient computer method for cross-track line planning in China, a new process to generate a cross-track line plan in periodic context is proposed. The process is formed in two stages and we can obtain the cross-track line plan based on the individual-track line plans using this process. Then, both the cross-track line plans and individual-track line plans could produce a networked line plan adapted to Chinese travel habits and management rules.
(2)
A multiobjective integer linear programming model for cross-track line planning is developed by combining individual-track lines into cross-track lines, in the context of periodic operation. There are four goals in the objective function: periodicity of the line plan, train quantity, running mileage, and stop quantity. The constraints of the model include passenger demand and the number of individual-track lines available for combination. We first introduce the model formulation for a two-track case, and then expand it to the general formulation for generating the cross-track line plan for a multiple-track case.
(3)
We test the proposed model using China’s HSR cases. Optimal solutions are quickly obtained. In particular, we generate cross-track line plans for a large-scale HSR network, which was the first to be conducted in China to the best of our knowledge. We also explore the impacts of the goals’ weights and periodicity criteria parameter on the result and influencing factors of computation. Two comparisons with the existing classic methods and real-life line plans are also presented, respectively. These experiments verify the effectiveness and efficiency of our model.
This rest of this paper is organized as follows. Section 2 reviews the related existing practical situations and academic researches. Section 3 proposes the new line planning strategy and describes the problem tackled in this article. Section 4 introduces the modeling work including the model assumptions, the model formulation for two tracks and the model formulation for multiple tracks. In Section 5, numerical experiments on a real-world network are presented. The final section presents our conclusions along with a summary of the comments and future research steps.

2. Literature Review

By now, many scholars have studied the issue of line planning and line plan optimization, and the related classical models and algorithms are described in Schobel [2] and Goerigk et al. [3]. Line planning in a periodic pattern has been reported in many studies [4,5,6,7,8,9,10]. Among them, Li [8], Xu [9] and Jin [10] studied the cyclic line plan generation method in China.
With regard to the line plan of CTHST, both practical and academic situations are different worldwide.
In Europe, the railway lines are relatively in a short distance and networks are dense. In this case, different with the practical situation of China, there is actually not an explicit classification of ITHST and CTHST in Europe. As a consequence, the existing line planning researches in Europe are basically carried out for an individual railway line or a network, and there are virtually no studies focusing on the cross-track line plan specifically. Another reason for this academic situation is that the relatively regular train stop pattern in Europe significantly reduces the size of the line pool, which makes it possible to generate a line plan for a railway network in a reasonable time.
At present, most line planning researches are based on a line pool (i.e., a set of potential lines) [2]. In this case, line planning under this approach can be regarded as the second phase of a two-step approach: lines are constructed (i.e., line generation) in the first phase and a line plan is chosen from this set in the second phase. Many existing line planning models deal with the selection of a set of lines out of a given line pool [2]. The line pool cannot be too small since in this case the line pool cannot provide flexibility to the subsequent line selection stage. On the other hand, the line pool should not be very large because the line planning problem cannot be solved efficiently in this way [11]. The size of the line pool is determined by numbers of potential departure and arrival stations, routes, vehicles types and stop plans, which are components to identify a line (i.e., a train). Since the line pool is usually given as input in most European line planning studies, only few researches exist that deal with the line pool generation problem, such as Gattermann et al. [11]. However, the rare line pool generation studies in European context do not need to deal with a complex stop planning problem. It is because that in most European countries, the train stop plan, which is an important component of the line, is in a regular all-stop pattern based on system split theory [12]. By this theory, the railway network is split into InterCity (IC) system, InterRegio (IR) system, and AggloRegio (AR) system. The IC system only contains IC stations, the IR system contains IC stations and IR stations, and the AR system contains all stations. Correspondingly, trains are also classified as IC trains, IR trains, and AR trains. A specific train usually stops at each station belonging to its corresponding system along its route. For example, an IR train usually stops at each IC or IR station along its trip (as shown in Figure 4a). Thus, in most cases, there is not so much work about stop planning in line generation stage under European context, since the line’s stop plan can be basically determined as long as the line’s departure and terminal stations, line’s route and line’s class (i.e., IC, IR, or AR) are known. As a consequence, due to the System Split Theory and all-stop pattern, the complexity of line generation work in Europe is reduced and the number of potential lines (i.e., the size of the line pool) is controlled in an acceptable range.
Contrastingly, since the railway lines are constructed one by one and lengths of them are longer, the concept of CTT has been proposed for a long time in China. As mentioned before, as a characteristic product, CTHST plays an important role in serving cross-track passengers in Chinese high-speed railway system. Despite the different practical situations, in nature, the cross-track line planning problem in China is identical to the line planning problem in Europe. However, as reviewed above, most existing line planning methods (introduced in Schobel [2] and Bussieck [12]) are based on the line pool. As for the line generation stage, which is regarded as a former phase of line selection, there is a difference between China and Europe.
Unlike Europe, determining line stops is a complicated job in China. Firstly, there is not an explicit classification (like IC, IR, and AR) of stations and trains in Chinese HSR system, so line stop planning is carried out based on the whole system instead of different subsystems (i.e., IC, IR, and AR systems). Secondly, the train stop plan in China is in a totally irregular skip–stop pattern. It is because that railway lines in China are longer and there are more stations along them. If an all-stop pattern is applied, the travel time of the train will be so long due to the long running time and much more dwell time and additional time caused by the large number of stops. In this case, trains only stop at some of stations along their routes and train stops look more discrete than those in Europe (as shown in Figure 4b). Although in Europe, the train stop plan also looks like a skip–stop plan in the whole system’s view (e.g., IC trains do not stop at IR and AR stations), but in the line generation stage, the stop plan is determined in an almost all-stop pattern based on each subsystem (i.e., IC, IR, and AR, respectively). Therefore, in China’s context, when line origin/terminal stations and route are identified, we also need to determine a reasonable set of stations along the route as stops. Due to the irregular skip–stop pattern, there will be an explosion number of possible stop combinations, which makes train stop planning a complex problem in China. Although the size of the line pool is also large in Europe due to many possible terminal stations, its size is still much smaller than that in China because for each “departure station–terminal station” pair, the number of possible stop plans in China is much larger than that in Europe. For example, we can see from Figure 4 that for a specific “departure station–terminal station” pair, a European IR train has one possible stop plan (i.e., all IC and IR stations between the departure station and terminal station, and the same is true for IC train and AR train) in most cases, but in China’s context, there is a large number of possible trains starting from this departure station and ending at this terminal station due to various possible stop plans. Moreover, in the cross-track problem, CTHSTs pass though more stations because of their longer running distances, so the number of possible stop combinations will be further increased, making the line generation work more complicated and time-consuming, and also leading to a much larger size of the line pool. Thus, when applying existing methods to deal with the cross-track line planning problem in China, the line pool should be kept in a reasonable scale or be generated in a new way, otherwise it will bring great difficulty to both line generation stage and line selection stage. To the best of our knowledge, there is no research providing a method to generate possible stop plans under irregular skip–stop context in the line generation stage.
However, in recent years, optimizing train stop plans with a skip–stop strategy has been studied by many researchers from different views, which is a similar research area. The comparison between them and stop planning in line pool generation stage is shown in Table 1. We can see that these studies are mainly carried out in the timetabling stage, dealing with the stop plan optimization problem based on a given or a practical stop plan. The objectives are mainly aimed at minimizing passenger’s travel time or maximizing the utilization of track capacity. In these studies, skip–stop is an optimization strategy to achieve the goal. As contrast, determining line’s stops is a task in line pool generation stage, which is a former phase of the line planning problem. It aims at creating a set of potential and reasonable stop plans by the given original and destination stations of lines, routes of lines and passenger demand instead of a practical train stop plan. In fact, the stop planning in line pool generation process is choosing stations to stop from an empty plan instead of choosing which stations to skip from a given or an all-stop plan. In this case, the method used for stop plan optimization with skip–stop strategy cannot be used for stop planning in line pool generation stage since these two problems are different both in motivation and planning stage.
As for other countries around the world, the practical and academic contexts of CTHST (or CTT) are also different with China.
In Japan, which is another country with dense HSR lines, the network and train stop pattern are more similar to European ones. Although IR trains in Japan adopt skip–stop pattern, the number of stop plans is limited due to the periodic timetable. However, the Chinese timetable is totally nonperiodic and it is another reason why there are various train stop plans in China.
The United States, Russia, and India all have large-scale railway networks, which are similar to China, but the situations of planning and running CTHST are still diverse. The USA has the largest railway network in the world [20], but there is only one HSR line (~362 km) in the northeast of the country and the railway lines are mainly used for freight and container transportation. For passenger transport, road and air transportation are the main methods, and the passenger kilometer contributed by the railway is only ranked 30th in the world, which is far less than China (ranked 2nd position, more than 70 times of the USA) [21]. It means that both the number and density of passenger trains are much lower in the USA, which simplifies the planning and scheduling work. Moreover, the passenger railway lines in the USA are mainly for suburban and intercity travel. The number of long-distance railway travelers is much smaller and long-distance trains are mainly sightseeing trains. In this case, in the USA, the role of railway transportation and the situation of long-distance CTT are totally different with those in China. There are few researches focusing on planning or scheduling long-distance CTTs in America because it is meaningless. The situation is similar in Canada, which owns the 5th largest railway network in the world [20].
Russia has the 3rd largest railway network [22] and 3rd largest number of passenger kilometer in the world [20]. There are four types of high-speed trains with specific running railway lines respectively, i.e., Sapsan train between Moscow and St.Petersburg (maximum speed 250 km/h), Allegro trains between Saint Petersburg and Helsinki (maximum speed 220 km/h), Lastochka trains between St. Petersburg (maximum speed 160 km/h), and Novgorod and Strizh trains between Moscow and Nizhny Novgorod [23]. Cross-track travels, which are in a relatively long distance, are implemented by ordinary passenger trains with low speed. This leads to longer travel times, so many cross-track trains in Russia are overnight trains. On the other hand, in 2017, passenger transportation volume reached 1117.9 million, while suburban railway contributed 1015.7 million passengers [22]. That is, the number of long-distance railway passengers (including those using high-speed railway) accounts for only a small proportion of the total. What is more, the Russian railway company also provides many transfer plans for people [24]. As a consequence, for each cross-track train route, there is only a few or even one CTT providing direct travel service every day (e.g., trains from St. Petersburg to Kazan and trains from St. Petersburg to Samara in Ref. [24]). In this case, there are usually many stops in the CTT of Russia because the number of CTTs for each cross-track route is very limited and each CTT needs to provide at least one direct travel choice for as many cross-track OD pairs as possible along its route. If there are more than one CTT running on a same route, these CTT stop plans can be a little different. Due to the small account of CTTs and the use of a nearly all-stopped train stop plan (which is similar to Chinese ordinary passenger trains), the research of planning and scheduling CTTs (or even CTHSTs) also lacks enough motivation and meaning in Russia; the researches in Russia mainly focus on scheduling for an individual railway line [25,26,27] or an urban rail network [28,29].
As other country with both a large railway network and a large volume of passenger kilometer [20,21], India is more similar to China due to the scale and density of the network and the large amount of passengers. However, Indian train stop plans are more similar to European ones to some extent. In India, there is also an explicit classification of trains (i.e., Shatabdi/Rajdhani/Duronto, Express/Mail Trains and Ordinary Trains). Each class of trains has a corresponding set of stopping stations. The practical train stop plans are determined by some strategies (e.g., skip–stop, segment complementation) based on the all-stop pattern, see Refs. [30,31]. In constrast, China’s train stop planning has a problem of determining which stations are chosen to stop, instead of determining which stations are skip based on the all-stop plan. Thus, India’s experience is not applicable to China. Besides, another important difference in CTHST planning (or CTT planning in India) is that for long-distance railway travel the sensitivity of travel time is much reduced in India. This is because India has no HSR. The fastest trains in India are operated at an average speed of 80 to 100 km/h [32]. What is more, ~70% of the Indian railway network consists of single-track segments, which are bottlenecks of train operation [33]. In China, the amount of single-track stretches only makes up 42% of the network, and all the HSR lines are double-track lines [34]. These factors make the travel time of CTT much longer in India. Similar with the situation in Russia, most CTTs in India are overnight trains, but their travel times are even longer than those in Russia, usually reaching two or three days [35]. Differently, the CTHSTs in China are fast and efficient, usually with a speed between 200 and 350 km/h. The maximum travel time of CTHST is 15 h, running on a route with a length of 2552 km [36]. Due to its high-speed attribute, minimizing travel time is an important objective in CTHST line planning and this objective is influenced by travel distance and the number of stops. Actually, the CTHST in China is naturally a type of long-distance high-speed train instead of the ordinary passenger train or overnight train. It is operated at a high speed between 7:00 a.m. to 12:00 a.m. Thus, it should be planned in a high-speed train standard, following China’s train stop pattern.
As for academic situation, there is nearly no research dealing with the CTT line planning problem in India. In fact, in India, the studies about railway transportation planning mainly focus on train scheduling instead of line planning, which includes scheduling for one line [37], scheduling for a small network [38,39,40], and scheduling for an urban rail network [41,42]. In practice, timetabling in India is done manually with some computer based visualization and decision support [41]. This is an iterative procedure which starts by modifying the already existing timetable based on track availability and historical demand patterns.
In China, line planning is presently done manually in practice, based on demands, historical line plans, and planners’ experience. The procedure is similar to practical timetabling in India to some extent. This approach lacks optimization that one might use when designing line plans. Compared with the problem within an individual railway line, the cross-track problem extends the scale to the network range, which makes line planning, timetabling and even catering planning (see Wu et al. [43] and Wu et al. [44]) more complicated. In this case, due to the unique characteristics of CTHST, complexity of cross-track problem and the lack of programming method, many Chinese researchers have studied cross-track line plans from different viewpoints.
Zhou [45], Lan et al. [46], and Li [47] analyzed the transportation mode of cross-track passengers and running factors of CTHSTs, and determined the factors and conditions required to operate the CTHST. Other authors [48,49] analyzed the reasonable running distance and preferred speed of a CTHST, and Xu et al. [49] additionally considered the fatigue factor of drivers. Zhang and Yan [50] calculated the feasible running time horizon of the CTHST based on the existing conclusions in low-speed tracks. In the case where the CTHST runs on the tracks at different speeds, Zhang [51] and Luo [52] studied the impact of the CTHST on each railway’s timetable and proposed a coordination mechanism between the tracks. Niu et al. [53] studied the long-distance passenger transportation mode in a network comprised of high-speed and common speed railways. The direct service mode and transfer mode were analyzed, with a particular focus on the generalized travel cost of long-distance passengers and operation benefit of railway enterprises.
Overnight passengers are a special kind of cross-track passenger. They travel throughout the entire night and their travel distance is very long. Therefore, determining how to design the operation scheme of overnight CTHSTs to transport these passengers is a specific problem in China. Zhu [54] analyzed the range of an overnight CTHST’s running distance and running time horizon, and the influence of different night maintenance modes (i.e., maintenance skylight) on overnight CTHSTs. Then, they developed a model for choosing crossing stations and solved this model using a genetic algorithm. Peng and Luo [55] analyzed the organization mode of overnight CTHSTs and the running distance under different maintenance skylights but did not provide a quantitative method for choosing the best mode. To solve this problem, in Zhang et al. [56], the organization modes of overnight CTHSTs, for example, waiting for Integrated Maintenance Time (IMT) at a HSR station, transferring from HSR to Common Speed Railway (CSR) before IMT, transferring from HSR to CSR before IMT, and from CSR to HSR after IMT, were proposed according to the adopted integrated maintenance pattern on the HSR. By solving the alternative scheme generation model, they concluded that waiting mode is preferable for long distance overnight CTHSTs, whereas the transferring pattern should be the first choice for the medium-distance trains. The nonlinear integer program optimization model for operation mode choice was built by Zhang et al. [57]. The objective function included the degree of passenger satisfaction with the departure and arrival moments, fare attraction, section capacity, difficulty of organization, and the number of CTHSTs supplied. Besides the operational limitations, the relationship between the crossing station and arrival/departure time and the station capacity were considered in the constraints. The authors further recommended that long-distance overnight CTHSTs should choose a waiting pattern with a speed of 300 km/h, whereas medium-distance trains should select a transferring pattern with a speed of 250 km/h.
With regard to designing the line plan of CTHSTs, in Peng et al. [58], a combination of qualitative analysis and quantitative calculation was used to study the transportation mode of the Wuhan–Guangzhou HSR and the line plan of the CTHST. The authors studied the various collinear operation cases of the ITHST and CTHST with different combinations of speed. Similarly, Tian [59] studied the problem of a CTHST running on parallel tracks with different speeds. Based on the analysis of the conditions and modes of CTHST and reasonable travel time and running distance, a line plan for the CTHST was established. A multiobjective programming model and the design of the virtual case verified the validity of the model and algorithm. In Yang et al. [60], with the aim of minimizing the cost of vehicles, train operation, and passenger travel time, a model for cross-track line planning was constructed for an urban railway system. Research showed that the implementation of a CTT required a certain ratio of redundancy and saved business operation costs and passenger travel costs when compared to individual-track independent operations.
In summary, the practical situations of CTT are diverse worldwide. In China, there is a large proportion of cross-track passengers. Due to direct travel habit, CTHST plays an important role in serving this part of passengers in Chinese HSR system. However, the long distance of tracks and irregular skip–stop pattern lead to a large amount of potential cross-track lines, making the computation of cross-track line planning more difficult. None of these features can be found in any other country. From the academic view, there are few researches about cross-track line planning in Europe or other countries. Also, few studies about line pool generation method (especially in an irregular skip–stop context) can be found. Thus, a new method is needed to avoid generating such a big cross-track line pool. In China, many researchers have performed research with regard to CTTs from the perspectives of the passenger transportation mode, running time horizon, and coordination of different tracks. However, only a few studies have been completed in a HSR context. Also, the studies in HSR’s context have mainly focused on the qualitative analysis with some simple calculations of train’s properties, such as reasonable running distance, running time horizon, and running speed, without considering specific passenger flows, which is one of the key factors in the line planning problem. Some studies on urban rail are related to the CTT problem, but the stop pattern in the urban rail system is similar to that of the European railway system, i.e., an all-stop pattern, which is different from the stop pattern in China’s HSR lines. For periodic line plans, the existing studies have addressed this problem from an individual-track or a network point of view. None of them have specifically considered the CTT. In short, there has been little research on generating a line plan for a CTT or CTHST considering both the cross-track passenger demand and operational factors. On the other hand, it is also unreasonable to separately generate the cross-track line plan and individual-track line plan according to cross-track demand and individual-track demand respectively because CTHSTs can also serve individual-track passengers. In this case, it is better to simultaneously consider the line plans of both CTHSTs and ITHSTs in the network.

3. Problem Statement

In the topic of line planning, a line is a train path in the public transportation network (PTN) and the line planning problem is defined as finding a set of lines together with their frequencies [2]. In order to define a line, we need to determine its start and end stations, vehicle type, running route, and stopping stations along the route, based on the passenger flow demand. For the cross-track line planning problem in China’s context, we propose a new line planning idea which is a two-stage procedure.

3.1. A Two-Stage Line Planning Procedure

As described above, China’s train stop plan is in an irregular skip–stop pattern. In this case, if we generate the line plan of CTHSTs using the same method used in individual-track line planning the size of the problem will increase exponentially due to an exorbitant number of stop combinations. Since the CTHST runs on different individual tracks, we decompose the cross-track line planning into two stages. The first stage involves splitting the cross-track demand and obtaining the line plan of each individual track. The second stage is choosing some appropriate individual-track lines to make up cross-track lines according to the cross-track passenger demand and operational constraints, considering the negative impact of running CTHSTs. Taking generating CTHSTs running on two tracks as an example, the whole process is as follows.
Step 1: Taking the crossing station as the split-point, the demand of the cross-track passengers can be transformed into two parts, which can be regarded as the demands belonging to two individual tracks. Then, the original individual-track demand and the transformed individual-track demand can be merged into the new merged individual-track demand. This step is illustrated in Figure 5. Notably, it does not mean that these cross-track passengers will be transported by the transfer pattern. Instead, this step just intends to make sure that the whole original demand (including cross-track demand and individual-track demand) is totally considered in the individual-track line planning.
Step 2: Generate the line plan of each individual-track based on the merged individual-track demand. In this step, the crossing station is also regarded as one of the terminal stations at which trains can depart and arrive.
Step 3: Select all individual-track lines ending at, or starting from, the crossing stations from individual-track line plans. Based on these lines, we enumerate all possible combinations of the two individual-track lines that belong to two individual tracks, respectively. Then, we choose the best subset of all possible combinations that meet the original cross-track demand and minimize the drawbacks of running the plan, in the context of periodic operation. Since the original cross-track passenger demand was considered by segments in the individual-track line planning process in Step 2, the cross-track passengers could be directly transported by the generated cross-track lines.
Following the same process, we can generate the line plan of CTHSTs in a network with more than two tracks that are crossed and connected. Then, we can obtain the final line plan of the network, which includes the line plan of both the ITHSTs and the CTHSTs.

3.2. Generating the Cross-Track Line Plan Based on Individual-Track Line Plans

As for the process presented above, splitting the cross-track passenger demand can be easily accomplished. Besides, the classic line planning methods have been well-studied by researchers and the scale of generating an individual-track line plan is also acceptable. Therefore, Step 1 and Step 2 can be carried out with existing methods and techniques. In this article, we mainly focus on the modeling of combining appropriate individual-track lines into cross-track lines, i.e., Step 3.
Consider a HSR network made up of N tracks which are intersected or connected (e.g., the network shown in Figure 1) at crossing stations. The individual-track line plan of track q ( q { 1 , 2 , , N } ), which is generated based on the merged individual-track demand, is denoted by J q . Given J 1 , J 2 , …, J n , …, and J q , the cross-track line planning problem in this article can be described as choosing individual-track lines from line plan J 1 to J N to form cross-track lines and then determining the best set of cross-track lines. This process is introduced in detail below, using the example shown in Figure 6.
We firstly enumerate all possible cross-track lines composed of n ( n { 2 , 3 , , N } ) individual-track lines belonging to n individual-track line plans, respectively, denoting this set as M n . It should be pointed that the individual-track lines selected for combination should end at or start from the crossing stations. An illustrative example is given to show the cross-track line generation process proposed in this research. Consider a two-track network: Track 1 and Track 2 are connected at Station B. The individual-track line plans of Track 1 and Track 2 (i.e., line 1 to line 15 and line 16 to line 23, respectively) are shown in Figure 6. From the plan of Track 1, we select the lines ending at Station B, i.e., the lines in red boxes, and from the plan of Track 2, we select the lines starting from Station B, i.e., the lines in blue boxes. Then we can generate the cross-track lines by matching the lines in red boxes with lines in blue boxes. For example, line 2 of Track 1 and line 16 of Track 2 can be combined into cross-track line 2–16 (i.e., combining two short trains into a long train). If there are more than one train types, we also need to consider train type consistency in the combination process, because in China, trains should be operated in a fixed type and marshaling status. After all possible cross-track lines are enumerated, we can obtain a cross-track line pool, i.e., M 2 M 3 M N .
Based on the cross-track line pool, the decision variables in our problem are frequencies (e.g., 0, 1, …, n, …) of cross-track lines in the pool. Since cross-track lines are generated by combining single- track lines, their frequencies are determined by the number of available individual-track lines. Firstly, only the individual-track lines that start from or end at the crossing-stations can be used for combination. Next, each available individual-track line has a value of frequency which indicates the running times of the line within one day. If an individual-track line’s frequency is three, there could not be four or more cross-track lines containing this individual-track line. We will discuss the details of this issue in the periodic operation context in Section 3.2.2 below.
In order to obtain a good cross-track line plan, the objective should take four aspects into account. Firstly, since we deal with the cross-track line planning problem in the periodic operation context, the periodicity of the cross-track lines is the first goal we need to optimize. Next, as discussed before, the CTHSTs in China generally have a long mileage, so running CTHSTs is not beneficial to rescheduling work in practice. When a delay occurs on a CTHST, many trains on the tracks may be delayed or canceled. In this case, the travelling passenger’s travel time will lengthen and overcrowding at train stations may occur [61]. Therefore, we needed to reduce the number of CTHSTs, i.e., the number of cross-track lines multiplied by their frequencies in the resulted line plan, as much as possible on the basis of meeting the passengers’ travel demands. Additionally, the mileage of the CTHST should be minimized for the same reason. What is more, the cross-track passenger’s travel time is relatively long due to the long travel distance, so we needed to particularly focus on this index to avoid travel fatigue. Since train scheduling work is carried out in the timetabling stage, one solution in the line planning stage is to minimize the number of stops of the CTHSTs. Thus, the goals of our problem can be summarized as following.
(1)
Maximize the number of periodic CTHSTs.
(2)
Minimize the number of CTHSTs
(3)
Minimize the sum of running mileage of CTHSTs.
(4)
Minimize the sum of train stops of CTHSTs.
Besides, some constraints should be taken into account during the line planning process: First, the cross-track passenger demand, including frequency requirement F d and the number of traveling passengers P d of each cross-track origin-destination (OD) pair d ( d D ), should be met. Second, the times that each individual-track line could be used for combination should be no more than the corresponding individual-track line’s frequency. For example, in Figure 6, we assume that line 2’s frequency value is 1. In this case, if the generated cross-track line plan contains line 2–16; there should be no other cross-track lines containing line 2 since line 2 could be used only once for forming cross-track lines due to its frequency value. In a periodic context, this constraint is a little more complex because the given individual-track line plan is a 1-h or 2-h plan. In this case, we need to determine how many times that an individual-track line could be used in one day. This issue will be discussed in Section 3.2.2. Third, we do not need to consider passing capacity constraint of each section in our problem. It is because that the cross-track line planning in this article is combining existing individual-track lines into cross-track lines, so there will not be extra lines added in each section. While, the passing capacity constraints have been already considered during the individual-track line planning tasks.

3.2.1. Transformed Individual-Track Line Plan

In the given individual-track line plan, the basic element is line, and each line has a value of frequency. In other words, a line can be regarded as a set of same trains. However, trains belonging to the same line could be used for different combinations. Thus, in order to model the cross-track line generation process, before enumerating the cross-track lines, a preprocessing work towards the individual-track line plan is needed. Specially, as shown in Figure 7, there is an original 2-h cyclic line plan of an individual track. It contains five types of lines and each of them has a frequency value, i.e., the number of times it operated in a 2-h cycle. In total, there are nine trains in each 2-h cycle. Thus we expanded the original line plan by each line’s frequency value and obtained a transformed line plan as shown in the figure. The transformed line plan is a presentation of all trains in the original plan and each train is regarded as an individual line although some lines are identical. We used the transformed line plan as the individual-track line plan to form the cross-track line plan because it is clear and simple for the modeling work.

3.2.2. Range of Cross-Track Line’s Frequency

In the periodic operation context, the individual-track line plan is usually given for one cycle instead of one day since the line plan of the whole day can be obtained by repeating the 1-h or 2-h cyclic plan. In this case, the line in the transformed cyclic line plan (e.g., the transformed plan shown in Figure 7) has a frequency value that is equal to the number of cycles repeated in one day.
First, we need to determine the maximum daily frequency of a cross-track line under this situation. Figure 8 shows four stations in a network: A, B, C, and D. A–B is a track and B–D is another track. They are connected at station B. Station C is an intermediate station that can depart trains along the B–D track. In order to describe the problem in a time–space network we use the term “train”, replacing the term “line”; “cross-track line” is represented by “CTHST”. In this case, in one direction (e.g., from A to D), there are two kinds of CTHSTs in this small network: one is the CTHST-AC (i.e., a train from A to C instead of two trains connected by transfer) generated by combining train a (from A to B) with train b (from B to C); the other is the CTHST-AD (i.e., a train from A to D instead of two trains connected by transfer) generated by combining train a with train c (from B to D). We assumed that the travel times of trains a, b, and c to be four hours, two hours, and four hours, respectively. Therefore, the travel time of CTHST-AC was six hours and CTHST-AD’s travel time was eight hours. Since the time horizon of the HST is generally from 6:00 a.m. to 12:00 a.m. due to simultaneous integrated maintenance time on the HSR, the feasible departure time window of CTHST-AC was 6:00 a.m.–6:00 p.m. as shown in Figure 8a, and 6:00 a.m.–4:00 p.m. for CTHST-AD to depart from station A, as shown in Figure 8b. According to CTHST-AC’s departure time window, this train could run six cycles at most in one day. In other words, this train could not be repeated more than six times each day. Similarly, CTHST-AD could be operated at most five cycles every day.
Since there were two types of CTHSTs in total (i.e., two combinations of ITHSTs) in this example; train a can be used at most six times to generate CTHSTs according to each combination’s maximum running cycles. Therefore, there are three possible running results for daily CTHSTs containing train a. The first one only runs CTHST-AC with no more than six cycles. The second one only runs CTHST-AD with no more than five cycles. The last one runs both CTHST-AC and CTHST-AD. In the last result, the total number of CTHSTs in the whole day should be not more than six and CTHST-AD should also be operated no more than five times. These three results are shown in Figure 9a–c, respectively.
What we described above is the determination of the maximum frequency of a generated cross-track line in a two-track network, which is the simplest case. Further, when we combine individual-track lines into cross-track lines in an N-track network, the upper bound of cross-track line’s frequency can also be determined by the same method.

4. Line Planning Model

This section will formulate the cross-track line planning problem as a multiobjective integer linear programming model. In order to be better understood, we will start with the model formulation of the simplest case, i.e., a two-track railway network. Then, we put forward the general formulation in an N-track case. The model is built based on the case that the individual-track line plans are given.

4.1. Assumptions

Before formulating the model, we firstly propose the following assumptions.
(1)
The line plan of each individual track is fully periodic, i.e., the model is developed under a periodic context. However, the model can also be used in a nonperiodic pattern.
(2)
The length of a cycle is two hours as a common case. Therefore, the individual-track line plan used in this study is a 2-h line plan that could be repeated multiple times to obtain the line plan of the whole day.
(3)
Whether or not a CTHST is a periodic train is determined by its corresponding cross-track line’s frequency within a day. If a CTHST runs no less than a certain number of cycles a day, which is a parameter in the model, it is a periodic train; otherwise, it is a nonperiodic train.
(4)
To simplify the problem, there are only two types of train capacity among all tracks: 500 or 1000 seats per train.
(5)
We did not consider coupling and uncoupling work in the crossing station since they are not implemented in China. Therefore, only individual-track lines with the same train type can form a cross-track line.

4.2. Model Formulation for a Two-Track Network

In a 2-track network, there is only one combination situation, i.e., two individual-track lines’ combination. The symbolic notations are listed in Table 2.
The model formulation (labeled Model Formulation A) is as follows.
max Z A 1 = i ϵ I j ϵ J k = θ K i j x i j k k
min Z A 2 = i ϵ I j ϵ J k = 1 K i j x i j k k
min Z A 3 = i ϵ I j ϵ J k = 1 K i j x i j k k l i j
min Z A 4 = i ϵ I j ϵ J k = 1 K i j x i j k k h i j
k = 1 K i j x i j k 1   i I , j J
j J k = 1 K i j k x i j k K i   i I
i I k = 1 K i j k x i j k K j   j J
i I j J k = 1 K i j k x i j k s i j d F d   d D
i I j J k = 1 K i j k x i j k t i j e c i j d D P d u d e   e E
x i j k { 0 , 1 }   i I , j J , k = 1 , 2 , , K i j
This model is a multiobjective integer linear programming model. Equations (1)–(4) are objective functions, which take four respective goals into account. Equation (1) maximizes the periodicity of the CTHSTs. Equation (2) is set for minimizing the total number of CTHSTs. Equation (3) reduces the sum of the mileage of the CTHSTs. Equation (4) is the minimization of the sum of stops among all CTHSTs. In practice, the importance of each goal is different in different scenarios. For example, some tracks aim at periodic operation, while other tracks want to run more CTHSTs. In this case, we use weighted approach to sum up four goals with weight coefficients λ 1 , λ 2 , λ 3 , and λ 4 that reflect the importance of four goals respectively. Therefore, the equivalent integrated objective function of Model A is expressed as Equation (11).
max Z A = λ 1 i ϵ I j ϵ J k = θ K i j x i j k k λ 2 i ϵ I j ϵ J k = 1 K i j x i j k k λ 3 i ϵ I j ϵ J k = 1 K i j x i j k k l i j λ 4 i ϵ I j ϵ J k = 1 K i j x i j k k h i j
The constraint in Equation (5) is the uniqueness constraint for the daily frequency of the cross-track line formed by i I and j J , since a cross-track line should have only one frequency value. The frequency value is bounded by K i j —the maximum number of 2-h cycles that a cross-track line combining i I with j J can be operated one day.
Constraints in Equations (6) and (7) are the quantity constraints that indicate the upper bound of times that each individual-track line in the transformed 2-h line plan can be used for creating a cross-track line within one day, as discussed before.
The constraint in Equation (8) is the service frequency requirement constraints of cross-track OD pairs.
The constraint in Equation (9) is the requirements for seat capacity in each section. It stipulates that the number of seats provided by CTHSTs in each section should not be less than the number of cross-track passengers passing through the corresponding section.
The constraint in Equation (10) is the value range constraint of the decision variables.

4.3. Model Formulation for an N-Track Network

Then we can propose the formulation for the N-track case based on the Model Formulation A. Notably, in a network containing N tracks, in addition to considering the N-railway track combination, it is necessary to consider other combinations of N − 1, N − 2, …, 3 and 2 tracks. For example, a four-track network contains three combination cases: four-track combination, three-track combination, and two-track combination. Correspondingly, the constraints considered in the two-track model should be extended to all combination cases in the N-track network.
First, we provide the new symbols and the new expression of the symbols used in this general case in Table 3. The symbols not mentioned here have the same meaning as above.
The model formulation in a general case (labeled Model Formulation B) is shown below.
max Z B = m = 2 N o b j m
k = 1 K j 1 j 2 j n x j 1 j 2 j n k 1   j 1 j 2 j n M n , n { 2 , 3 , , N }
n = 2 N p = 1 n j 1 j p q j n M n k = 1 K j 1 j p q j n k x j 1 j p q j n k max { K 2 j q , K 3 j q , , K n j q }   j q J q , q { 1 , 2 , , N }
n = 2 N j 1 j 2 j n M n k = 1 K j 1 j 2 j n k x j 1 j 2 j n k s j 1 j 2 j n d F d   d D
n = 2 N j 1 j 2 j n M n k = 1 K j 1 j 2 j n k x j 1 j 2 j n k t j 1 j 2 j n e c j 1 j 2 j n d D P d u d e e E
x j 1 j 2 j n k { 0 , 1 }   j 1 j 2 j n M n , n { 2 , 3 , , N } , k { 1 , 2 , , K j 1 j 2 j n }
Equation (12) is the objective function and is the sum of the N − 1 terms, each of which is the objective corresponding to the m-railway track ( m { 2 , 3 , , N } ) combination case.
The constraint in Equation (13) is the uniqueness constraint for the daily frequency of the cross-track line j 1 j 2 j n M n . It is an extension of Constraint Equation (2) in Model Formulation A. The frequency value of cross-track line j 1 j 2 j n is bounded by K j 1 j 2 j n .
The constraint in Equation (14) is the quantity constraint that indicates the upper bound of the times that each individual-track line in the transformed 2-h line plan can be used for creating a cross-track line within one day. The enumeration of all combinations in which an individual-track line j q J q could take part was more complicated than for the two-track combination since the number of tracks for the combination and the position of j q J q in the combination sequence should also be considered.
The constraint in Equation (15) is the service frequency requirement constraint of cross-track OD pairs.
The constraint in Equation (16) is the requirement for seat capacity in each section.
The constraint in Equation (17) is the value range constraint of the decision variables.

4.4. Size of the Model

The model formulation of the N-railway track case is a generalized format of cross-track line planning model. The theoretical size of this model is determined by the number of decision variables and constraints. In order to understand how they have an influence on the problem’s size, without loss of generality, we assume that each track in the network has m sections and there are n lines in the corresponding individual-track line plan. According to the symbol definition, the number of decision variables is the number of all possible CTHSTs multiplied by the number of their possible frequency values. We also assume that the upper bound of CTHST’s frequency is k . Besides, the number of constraints in Equation (13) is the number of possible CTHSTs; the number of constraints in Equation (14) is the total number of lines among all individual tracks involved; the number of constraints in Equation (15) is the number of cross-track OD pairs; and the number of constraints in Equation (16) is the number of sections among all individual tracks involved. In this case, in an N-track network, the number of decision variables and each part of the constraints are shown in Table 4.
Since k , m , and n are constants, we can see from the table that the main contribution to the problem’s size with network expansion comes from the number of decision variables, possible CTHSTs, and cross-track OD pairs. There are many power exponent terms in their expressions. Therefore, in theory, our model will suffer a size explosion when more and more tracks are involved in the cross-track line planning. We will see the performance of the proposed model under a large-scale network in the case study section.

5. Case Study and Numerical Experiments

Since the theory and technology for individual-track line planning have been fully studied, the case study in this paper is based on the given periodic line plans of individual tracks, which were generated according to the merged individual track demand; on the basis of Step 1 and Step 2 being completed. We mainly focus on testing the model proposed in Section 4.
Firstly, we tested the model with a two-track case under a certain set of weight values, i.e., λ 1 , λ 2 , λ 3 and λ 4 , and other parameters. In this case we wanted to demonstrate that our model can obtain a balanced solution (i.e., all the goals are considered approximately equally) in a quick time. Next, since different weight values may lead to different solutions, we also conducted series of experiments for the N-track network case to explore the impact of each weight on the result. And another series of tests were carried out to evaluate different solutions obtained with different values of the periodicity criteria parameter θ . Thirdly, since the solving times of two-track case and N-track case are different under the same setting, we also designed experiments to explore the influencing factors of solving time. Finally, the comparisons with existing classic approach and the real-life line plan were presented, which verified the improvement made by the proposed method.
Notably, all of the individual-track line plans are provided in one direction so the generated cross-track line plan is also unidirectional. However, the plans are not intrinsically different from the bidirectional case. All of the following experiments were performed on a computer with a 3.6 GHz Intel i3-4160 CPU and 8 GB memory.

5.1. Case Study for the Two-Track Network

In this part, we chose the Shanghai-Changsha High-Speed Railway (SCHSR) and the Changsha-Kunming High-Speed Railway (CKHSR) for cross-track line plan generation. The terminal stations of the SCHSR are Shang Hai Hong Qiao (SHHQ) Station and Chang Sha South (CSS) Station. The terminal stations of the CKHSR are Chang Sha South (CSS) Station and Kun Ming South (KMS) Station. The total length of SCHSR and CKHSR are 1083 km and 1169 km, respectively. The SCHR has 28 stations and there are 24 stations on the CKHSR. Therefore, in this situation, it is extremely difficult to generate a cross-track line plan from SHHQ to KMS by enumerating all the stop plans with some man-made rules and experiential regulations that are adopted in the individual-track line planning.

5.1.1. Input Data

The input data mainly included the cross-track passenger demand, cross-track OD pair’s service frequency requirement, and the individual-track line plans. Other input data could be obtained based on these data. The cross-track passenger demand and cross-track OD pair’s service frequency requirement are shown in Table 5, which were obtained from the railway company. Passenger demand was predicted data based on the historical passenger flow, and OD frequency requirement was the minimum number of times that the CTHSTs needed to serve this OD in one day. For this two-track case, in one direction, there were a total of 406 cross-track OD pairs and 5648 cross-track passengers in one day.
The original 2-h line plans for the SCHSR and CKHSR are shown in Figure 10a,b, respectively. These were generated based on the theory and method proposed by Fu [62] and Fu et al. [63], according to the merged individual-track demand as introduced in Step 1. These line plans are given as input.
Before testing, these original 2-h line plans needed to be extended to the transformed 2-h line plans according to each train’s frequency. Consequently, there were 21 individual-track lines in the transformed 2-h line plan for the SCHSR and eight individual-track lines in that of the CKHSR. Considering physical connectivity and train type consistency, we enumerated 38 cross-track lines in total to form the line pool. Among them, two cross-track lines were 1000-seat trains and the others were 500-seat trains. Then, we calculated the running distance and the number of stops for each of them. Based on the cross-track line’s running distance, we obtained the maximum frequency parameter K i j of each cross-track line. The maximum using times K i and K j of each individual-track line could also be obtained. In terms of the passenger flow density (i.e., the requirement for number of seats) of each section, we easily performed the calculation according to the passenger demand of OD pairs. And based on the stop plans of the cross-track lines, we generated the train-OD service matrix and the train-section coverage matrix, indicating whether a cross-track line served a cross-track OD pair and whether it passed through a section, respectively.
For the criteria parameter for the periodicity of the cross-track line, we set θ = 4 in this case, which means that if a CTHST runs no less than four cycles a day, it is regarded as a periodic train. Additionally, to compare the magnitude of the values of the goals (i.e., terms in the objective in Equation (11)), we set the weights λ 1 = 1 , λ 2 = 1 , λ 3 = 1 , and λ 4 = 0.1 . The parameter and weights can be assigned to other values, which may lead to different results. Case studies for this issue are discussed in the next part under a network with multiple tracks.
There is a balance between the number of cross-track lines provided and the number of cross-track passengers served. From this consideration, we selected different numbers of cross-track OD pairs as the input demand, and passengers from the remaining OD pairs can still complete their journeys by ITHSTs with transfers. The groups of OD pairs are presented in Table 6. We can see that the number of OD pairs reduced dramatically with the increase in the requirement for a single OD’s travel demand. However, the OD group’s total demand decreased more slowly. In other words, the main part of the demand was contributed by only a few OD pairs. These ODs were the large ODs with many travelling people. For example, there were only 24 OD pairs with more than 50 travelling passengers, but the sum of the demand accounted for more than 40% of the total demand.

5.1.2. Results and Discussion

Since the proposed model is a linear model, it can be solved with IBM ILOG Cplex 12.6 after all the input data are obtained. All cases could be quickly solved due to the small scale of the cross-track line pool. For the All-OD case, there are 114 decision variables and 576 constraints in total.
As shown in Table 7, all cases can be solved within one second. As for the indexes, the number of CTHSTs (i.e., the number of cross-track lines multiplied by their frequencies in the resulted line plan) needed was reduced, as expected, with a decrease in travel demand. There was the same trend in the number of periodic trains that were only operated in the first two groups. This proves that, in a small network, it is difficult to run periodic cross-track trains because of the low cross-track demand, especially in the case of removing a part of the small OD pairs. The total running distance of the CTHSTs, which is another factor influencing rescheduling work when disruption happens, also reflected the same law. For the average index, the average number of stops (per CTHST) was relatively large for the case where all passengers needed to be transported directly by CTHSTs, but it dropped to approximately 12 in the last group when only OD pairs with more than 50 passengers needed to be considered. In the other groups between these two extreme cases, this index fluctuated slightly around 15. The average running distance between the two neighboring stops basically increased, which means that the CTHST runs faster with the elimination of the small OD pairs’ demand. This is improves the travel experience of long-distance passengers.
In summary, when all cross-track OD pairs needed to be served, the number of CTHSTs was highest and the travel speed of the train was lowest due to the number of stops. For instance, if we only needed to meet the demand from the OD pairs with more than 20 passengers, the number of CTHSTs sharply dropped to 6 and the average stops of each CTHST was 14.67, which was nearly four fewer than 18.55. In this case, the cross-track line plan was better for both the dispatcher’s operational work and the passenger’s travel experience, with still 63.92% of the demand being met. Thus, measuring these two kinds of line plans depends on the real-life needs and what the goals of the plan makers.

5.2. Case Study for the N-Track Network

In this section, we conducted case studies for the N-track case. The network is shown in Figure 1. Eight HSR tracks are the main framework of China’s HSR network that was planned in 2008, and the information is listed in Table 8. Most of the tracks involve long distances with a large number of stations. In total, there are 227 stations and 444 sections, which is a real-life case on a much larger scale.

5.2.1. Input Data

The cross-track passenger demand and the cross-track OD pair’s service frequency requirement were obtained as in the previous case. In this networked case, there were 95,262 cross-track passengers in total, which is significantly more than in the two-track case.
The original 2-h individual-track line plan was still generated according to the merged passenger demand of each individual track, presented in Figure 11. They are also for one direction and we expanded them with lines’ frequencies before enumerating all combinations. After enumeration, we obtained 1028 possible cross-track lines formed by individual-track lines. Based on this cross-track line pool, we generated the train-OD service matrix and the train-section coverage matrix of this case. After all the input data were prepared following the method used in Section 5.1, we performed experiments using a commercial solver IBM ILOG CPLEX with version number 12.6.

5.2.2. Analysis of Weight Corresponding to Each Term in Objective Function

The case study in Section 5.1 was implemented based on specific weight values, making each part of the goal comparable in magnitude. In fact, there were many other possible values of them. Thus, we first explored the impact of each weight of the objective function on the result. In this part of the experiments, other parameters in the model were still fixed. For example, all OD pairs were considered as the input demand and the criteria of a periodic CTHST still running at least four cycles a day.
The objective included four parts: the periodicity goal, train quantity goal, mileage goal, and stop quantity goal. First, we tested four extreme cases, and each of them only considered one goal. The results are presented in Table 9. In general, all cases could be solved quickly, but it can be found that the solving time of the N-track case is obviously longer than that of the two-track case. As for the case of each goal, when we only considered the periodicity goal, the maximum number of periodic CTHSTs was 237, reaching a periodicity ratio of 87.13% (i.e., divide the number of periodic CTHSTs by the sum of CTHSTs). However, the total number of CTHSTs was extremely large in this situation. In contrast, the minimum number of CTHSTs needed to serve all cross-track passengers was 103 when only considering the train quantity goal, but the periodicity ratio was much lower. For the mileage goal, the optimal number of CTHSTs was also 103, but the total mileage of the CTHSTs was minimized in this case and the periodicity was further affected. The average mileage of the CTHSTs was low. Finally, when we only considered the goal of stops, the sum of stops was minimized with low numbers of CTHSTs and average train stops.
After obtaining a preliminary understanding of the optimal situation for each goal, we tested the impact of each goal’s weight on the result. To this end, we chose different values for the weight and fixed the values of the other weights and parameters. Similarly, in this series of experiments, all OD pairs were served and the periodicity criteria were still running at least four cycles within a day.

Periodicity Weight

We took the some values of the periodicity weight from 0.1 to 10 6 and fixed the values of other weights to those used in Section 5.1. As shown in Figure 12a, when the weight was assigned a value of 0.1, which means the weight of the periodicity was the lowest among all cases, the number of periodic CTHSTs was lowest as expected. The number of the CTHSTs was 103, which is the minimum train quantity according to the extreme cases implemented before. In this case, the periodicity ratio of CTHSTs was 42.7%, which was also the lowest level among the cases. With the increase of the weight’s value, all these three indexes were in a growth trend. Finally, when this weight tended to be infinite, the numbers of CTHSTs and periodic CTHSTs were 272 and 237, respectively, which were both in a peak value; the periodicity ratio also reached up to 87.1%.
In Figure 12b, with the increase of periodicity weight’s value, the average mileage of CTHSTs and average number of stops per CTHSTs were in a same trend. They both decreased slightly and finally stop at a stable level.
Therefore, improving the importance of periodicity will significantly increase the number of CTHSTs and periodic CTHSTs, and reduce the CTHSTs’ mileage as well as the number of CTHSTs’ stops in a relatively small range at the same time.

Train Quantity Weight

Here, we explore the trend in the experimental results as a function of train quantity weight. As shown in Figure 13a,b, when the train quantity weight increased from 0.01 to 0.9, the number of CTHSTs needed dropped from 200 to 105, close to the minimum number of CTHSTs. Then, the reduction in the number of CTHSTs would be limited. With an increase in this weight, the average train mileage and the average number of train stops also increased gradually. This occurred because when there are fewer CTHSTs, each train needs to serve more cross-track OD pairs and cross-track passengers.

Mileage Weight

Detailed results of mileage weight are presented in Figure 14a,b. From the figure, we concluded that the average train mileage dropped with an increase in the weight, whereas the average number of train stops showed the opposite trend in a slight way. As for the number of trains, mileage weight had a minor effect on the total number of CTHSTs, but the number of periodic CTHSTs would decrease dramatically if we gave this weight a high priority.

Stop Quantity Weight

In Figure 15a,b, the average number of train stops dropped with an increase in the stop quantity weight, which would improve the travel speed of the CTHSTs. The improvement in this goal was not evident after the value of the weight exceeded 0.5. Additionally, the stop quantity goal was the opposite of the periodicity goal, but there was no relevance between the stop quantity goal and other goals, such as the mileage goal and train quantity goal, according to the results.

5.2.3. Analysis of Periodicity Criteria Parameter

In the previous case studies presented in this paper, we set the criteria that a periodic CTHST runs at least four cycles a day. This is an experiential value. We conducted experiments to explore the optimal value of this parameter. In this section, all the OD pairs were considered as the input demand and we took λ 1 = 1 , λ 2 = 1 , λ 3 = 1 , and λ 4 = 0.1 .
According to the CTHST pool in this network, the maximum number of cycles that a CTHST can be operated a day is seven. However, as shown in Table 10, when the periodicity criteria were set to run at least seven cycles a day, which is a strict definition of periodicity, there was no periodic CTHST in the line plan generated. In contrast, if θ = 1 , all trains operate in a periodic pattern. Apart from these two extreme cases, we conclude from Table 10 that running no less than four or five cycles in a day is a reasonable criterion. This is because the periodicity ratio was between 55% and 60%, which is a relatively high proportion, and the sum of the CTHSTs needed was not large. However, we think that, for a train, running at least three cycles a day cannot be regarded as a periodic manner, whereas running six cycles is a little strict and leads to more CTHSTs and a lower periodicity ratio.

5.3. Influence Factors of Computation

Although both the two-track and N-track cases could be solved in a very short time, it could be found that the solving time of the complex N-track network case is obviously longer. In Section 4.4, we theoretically analyzed the change of size of the model with expansion of the network, and concluded that the number of possible cross-track lines and cross-track OD pairs were key factors that influence the model’s size. In this section, we carried out experiments under different cases to see the impacts of these two factors on the computation of the model. Notably, the weight of goals and the periodicity criteria parameter are also set to the values in Section 5.1.

5.3.1. Size of Cross-Track Line Pool

We chose different tracks from the network in Figure 1 to form different subnetworks. As shown in Table 11, cases 1–25 are different test instances we built. They have different tracks, numbers of stations and sizes of the pool. From the table, we can see that, basically, the solving time increases as the size of the network grows. However, it should be pointed that the computation time is more related to the number of possible cross-track lines instead of the number of stations or number of tracks. It is because that in some cases with large numbers of stations, e.g., case 9 and case 15, the computation times are still relatively short, while, in these cases, cross-track line pools have a small size. Conversely, case 2 and case 13 shows the opposite situation. Therefore, these experiments verify that although the numbers of stations and tracks reflect the scale of the network, they do not have a direct influence on the solving time of the model. Instead, the size of cross-track line pool is the key factor to determine the size of the problem.
As for the pool’s size, it is affected by the number of tracks to some extent, but there are still other influence factors. Firstly, the connectivity of tracks in the network will determine the number of possible cross-track routes, which decides how the individual-track lines can be formed. Secondly, the number of individual-track lines starting from or ending at crossing stations will affect the number of possible cross-track lines that can be generated.
For the indexes of the result, both the periodicity ratio and the number of CTHSTs increased with the expansion of the network. These two indexes were mainly affected by demand, which would grow up as the network being spread.
In order to further verify the conclusion proposed above, we also create virtual test instances based on the real-life network for experiments. As we can see in the Figure 11, only a limited number of individual-track lines could be used for forming cross-track lines since not all individual-track lines start from or end at crossing stations. Therefore, we adjusted original individual-track line plans given in Figure 11 by extending the unavailable individual-track lines to the crossing stations and adding new available lines under passing capacity constraints. We chose different parts of the extended lines to replace their corresponding original lines and added different parts of the new lines into original line plans. In this way we obtained the new test instances with different individual-track line plans, i.e., cases 1 to 6 in the Table 12. Consequently, these cases have different sizes of the pool.
From Table 12, we could see that in the same network, the size of the pool significantly affected the solving time of the model, which verified the conclusion drawn before.

5.3.2. Size of Cross-Track OD Pairs

Another influencing factor of model’s size mentioned in Section 4.4 was the number of cross-track OD pairs. It indicated the size of the demand. In this section, we built a series of test instances by choosing different parts of cross-track OD pairs taken into account. The results were shown in Table 13. It presented that the solving time increased as the proportion of demand considered rose up. As a factor highly relevant to the size of the demand, the number of cross-track OD pairs needed to be served is basically determined by the number of stations of individual tracks. Thus, the number of stations in the network also affect the solving time from the demand view.
Besides, we could see that with the reduction in the demand considered, the number of CTHSTs needed was reduced at the same rate, while the average mileage of the CTHSTs and the average number of stops per train also showed a downward trend, which is beneficial for scheduling and rescheduling work. The periodicity of the plan was improved when we only considered a small part of the OD pairs with high travel demand. In this case, we can look for a tradeoff between the number of passengers served and the number of CTHSTs needed in practical plan-making. For example, if we only considered OD pairs with no less than 150 passengers as the input, the demand for these OD pairs accounted for nearly 80% of the total demand and the number of CTHSTs, which, in this case, was 22 less than the number required in the All-OD case. However, the periodicity of the CTHSTs was much better. Both the average number of stops per train and the average mileage of the CTHSTs were improved. The line plan generated in this case may be better than the plan taking into account all OD demands.

5.3.3. Physical Connectivity and Management Rules

In Section 4.4 we pointed out that our model will suffer a size explosion when more and more tracks are involved in the cross-track line planning problem since there were many power exponent terms in decision variables and constraints’ expressions. However, the series of experiments for the N-railway track network in Section 5.2. showed that using our method can generate a cross-track line plan in a large network containing eight HSR lines within a very short time. It is because that the numbers of variables and parameters listed in Table 4 are theoretical numbers, i.e., upper bounds. When we turn to practical case, these numbers will decrease dramatically due to network conditions and business rules.
Firstly, there may be many impossible CTHSTs. To form a CTHST, the ITHSTs involved must be physically connected, i.e., at least one of their terminal stations should be crossing stations. What is more, they should be connected in a “head-to-tail” manner. Besides, the ITHSTs should be in the same train type because a specific train has only one train type. These two requirements will eliminate many combinations, which will reduce the numbers of possible CTHSTs and decision variables.
Secondly, it should be noted that not all combinations are reasonable in reality. For example, from the passenger’s viewpoint, the running mileage of a CTHST cannot be too long. Also, we should avoid the detour and circle when generating the routes of CTHSTs by combining ITHSTs. In addition, a CTHST cannot have too many stops.
Taking above two aspects into account, we complete the enumeration of all reasonable CTHSTs in a preprocessing procedure instead of by the proposed model. Consequently, the final number of variables and constraints in the networked case are 4850 and 5343, while the theoretical numbers are 3.1 × 10 10 and 6.56 × 10 9 , respectively. Then these alternative CTHSTs are input as the line pool. In this way the time for solving the model will be significantly shortened.

5.4. Comparison with Existing Approach

As mentioned in Section 1 and Section 2, in China’s context, if we generate the cross-track line pool as the method of generating a line pool for an individual railway line, there will be large increase in the size of the pool due to the larger number of stations involved; a big line pool has a bad influence on the computation of the model. In this section, we have made a comparison between the traditional method (i.e., solving the classic model based on a big line pool) and the new method we proposed.
Firstly, we generated a new cross-track line pool by the enumeration method with some reduction strategies which are proposed based on artificial rules. It is the most commonly used method to obtain a line pool in China’s context. Using this line pool as input, we tried to get an optimal cross-track line plan by solving the model proposed by Fu [62] and Fu et al. [63] in China’s context, which is an improved version of European classic line planning model introduced in Refs. [2,12].
The solving situations by conducting classic method are shown in Table 14. We also listed individual line planning cases which were conducted by our teammates for providing individual line plans shown in Figure 11. All the cases in this table were carried out by the existing classic method. We can see that for individual line planning problems in China’s context, the classic method is effective and efficient. However, it is unfeasible to solve the cross-track line planning problem under a big network because of the large size of the line pool. In contrast, the method proposed in this paper can obtain an optimal cross-track line plan within a short time period, which has been shown in the previous sections.
Apart from solving the model, line pool generation, which is a part of the classic line planning method, is also a time-consuming task, which has not been presented in Table 14. In China, the commonly used enumeration method for generating a line pool is an interactive process. Firstly, we should generate an initial line pool by enumeration with some simple rules (e.g., the maximum number of consecutive stations, the maximum number of stops, a few must stop stations, etc.) to reduce the size of the pool. This process can be done by computers. Then, we still need to evaluate this line pool by some indexes (e.g., the number of direct services for each OD, the number of services for each station, etc.). According to the evaluation, we will modify some settings and parameters and then generate a new line pool again. This procedure may be carried out several times until the obtained line pool performs well both in index and size. Actually, this series of work needs more time than solving the model. It takes one to five days to generate a good line pool for each HSR listed in Table 14, depending on the number of stations and demands of the HSR. As for generating the cross-track line pool, it even cannot be enumerated in one time since the large number of potential lines will lead to the memory overflow. Actually, we firstly enumerated all possible cross-track routes in the network shown in Figure 1, and then, for each route, the line pool generation procedure introduced above was carried out to obtain the set of potential lines of this route. It was an even more complicated work than line pool generation of individual track.

5.5. Comparison with the Real-Life Plan

Finally, we compared our generated cross-track line plan with the practical line plan. We selected real-life CTHSTs running along the network shown in Figure 1 from the timetable of the same time period. Given the real-life plan, the comparison of indexes was shown in Table 15. We can see that in our generated line plan, the number of CTHSTs was reduced. Also, the proportion of periodic CTHSTs in the generated cross-track line plan is 60%. In contrast, the line plan in practice is totally nonperiodic. In this case, the line plan made by our method was much better for periodic operation and rescheduling under delays. On the other hand, the average number of stops per train was much less than that of the real-life plan and the stop interval is much longer in our generated line plan. Benefit from these changes, the CTHSTs of the generated plan will run faster, which is beneficial to improve the quality of travel service.
However, the amount of cross-track demand that could be served by direct service (i.e., CTHSTs) was reduced in the experimental line plan. It was foreseeable because the experimental line plan was generated in the periodic context. In this case, there would inevitably be some cross-track passengers that needed to finish their trips via transfers, which was determined due to the features of the periodic plan. Actually, the original cross-track demand we got from the railway company was only the major part of the total cross-track demand. Since our research was about generating the line plan in the periodic pattern, some small or unimportant cross-track OD pairs were stipulated to be served by transfers by the railway company. Thus, we only needed to provide direct services for big or main cross-track OD pairs. The small cross-track OD pairs’ demands were split into individual-track demands by the railway company using the method in Step 1 of Section 3.1 in advance, and then we got them as original individual-track demands. In the N-track network case, this part of cross-track demand accounted for 32.88% of the total. The reductions of the average number of stops per CTHST and the number of CTHSTs were also caused by this reason.
In fact, the practical line plans of Chinese high-speed railway are basically nonperiodic but our research was carried out in the context of periodic operation (which is one of the assumptions). In this case, they have different goals and focuses during their generating process. For example, in China, the main task for cross-track train is serving as many OD pairs as possible. Also, because most of the line plans are operated nonperiodically, there is also no need to consider periodicity goal in line planning process, which should be taken into account in priority in the periodic operation context.

6. Conclusions

With the rapid expansion of China’s HSR network, the number of cross-track passengers will continually increase; this type of passenger flow has become an important part of the total. In China, the CTHST is the main method used to serve cross-track passengers. However, in China’s context, it is not a good choice to use the existing line planning method to solve the cross-track line planning problem because the line pool generation will be much more time-consuming due to the large amount of possible stop plans. In this paper, we proposed a new process for generating a cross-track line plan, which is a two-stage procedure that generates the individual-track line plans and then combines them. The first stage has been well studied in the existing research, so we mainly developed the model to combine the ITHSTs, which is a discrete optimization problem. In this 0-1 integer linear programming model, we not only considered the cross-track passenger demand that needed to be met, but also considered the negative impact of running CLSHTs, thus striking a balance between passenger transportation and CTHST disadvantages. We proposed the model formulations both for a two-track network and an N-track network, and then tested the models using real-life cases in China. We showed that in a certain set of weight values, we could quickly produce optimal cross-track line plans for all cases, which verified the effectiveness and efficiency of the proposed model. To the best of our knowledge, no cross-track line plan has previously been generated for a large-scale Chinese HSR network. We could also quickly address this problem using the method proposed. For the periodicity goal, train quantity goal, train mileage goal, and train stop quantity goal in the objective function, we explored the impact of each subobject on the result by adjusting the corresponding weight. Additionally, we completed experiments to study the influence factors of computation. It showed that the size of line pool and the number of cross-track OD pairs directly affected the solving time of the model. Finally, two comparisons with the existing classic methods and real-life line plans were conducted to verify the improvements made by the proposed method.
However, there are still some problems that need to be further studied. Firstly, in this paper, we generated the cross-track line by only combining individual-track lines without any modification. To make the generated cross-track line plan more flexible, we can appropriately adjust the stop plan during the combination process.
Secondly, we only considered combinations of individual-track lines with the same train type. This means that an ITHST with 500 seats cannot be combined with a 1000-seat ITHST. This is because, in China, train coupling and uncoupling work beside the platform has not yet been implemented. However, from the research perspective, we can break this rule to obtain more types of CTHSTs. In this case, rolling stock circulation and maintenance scheme optimization need to be considered additionally since vehicles have to be provided at the crossing station for coupling work and new tasks have to be assigned for the vehicles to be uncoupled. This is an interesting problem that requires further study.
Thirdly, we did not consider the effect of line plan on passenger flow, which is usually not considered in most of the individual-track line planning models. A line plan is created according to the given demand. The impact of the plan on passenger demand is another research topic that is also important because this situation likely occurs in real life.
The method and model in this paper can also be used to combine nonperiodic line plans. Similarly, if there is an individual track with a large number of intermediate stations, we can split it into segments and then use our method to generate its line plan. Aside from creating the line plan for the CTHST, this model is a good tool to support decisions since it can produce different kinds of line plans according to the different values of the goals’ weights and different proportions of the demand considered.

Author Contributions

Conceptualization, L.N. and H.F.; Methodology, P.H. and H.F.; Software, P.H.; Formal Analysis, P.H.; Data Curation, P.H., Y.G., and G.W.; Writing—Original Draft Preparation, P.H.; Writing—Review and Editing, L.N.; Supervision, L.N. and H.F.

Funding

This work was financially supported by the National Key R&D Program of China (2018YFB1201402 and 2016YFE0201700), the National Natural Science Foundation of China (No. U1434207 and No. 61703030), and the Beijing Training Programme for the Excellent Talents (No. 2017000020124G003).

Acknowledgments

The authors would like to thank the editors and the anonymous referees for their careful review and valuable suggestions that improved the quality of this paper. The authors also want to acknowledge Hong Zhang, Zijin Mao, and Jun Chen’s contribution to providing part of the input data and experiment results.

Conflicts of Interest

The authors declare no conflicts of interest.

References

  1. Chen, X. Study on Optimization of Operation Scheme of Cross-Track Train for High-Speed Railway. Master’s Thesis, Southwest Jiaotong University, Chengdu, China, May 2017. [Google Scholar]
  2. Schobel, A. Line planning in public transportation: Models and methods. OR Spectrum 2012, 34, 491–510. [Google Scholar] [CrossRef]
  3. Goerigk, M.; Schachtebeck, M.; Schobel, A. Evaluating line concepts using travel times and robustness. Public Transp. 2013, 5, 267–284. [Google Scholar] [CrossRef]
  4. Bussieck, M.R.; Winter, T.; Zimmermann, U.T. Discrete optimization in public rail transport. Math. Program. 1997, 79, 415–444. [Google Scholar] [CrossRef]
  5. Bussieck, M.R.; Kreuzer, P.; Zimmermann, U.T. Optimal lines for railway systems. Eur. J. Oper. Res. 1997, 96, 54–63. [Google Scholar] [CrossRef]
  6. Bussieck, M.R.; Lindner, T.; Lübbecke, M.E. A fast algorithm for near cost optimal line plans. Math. Methods Oper. Res. 2004, 59, 205–220. [Google Scholar] [CrossRef]
  7. Claessens, M.T.; Dijk, N.M.V.; Zwaneveld, P.J. Cost optimal allocation of rail passenger lines. Eur. J. Oper. Res. 2007, 110, 474–489. [Google Scholar] [CrossRef]
  8. Li, J.M. Research on Cyclic Train Line Planning for High-Speed Railways. Master’s Thesis, Beijing Jiaotong University, Beijing, China, March 2015. [Google Scholar]
  9. Xu, T.S. Research on the Train Operation Plan of the Inter-City Dedicated Passenger Line Based on the Periodization. Master’s Thesis, Dalian Jiaotong University, Dalian, China, June 2015. [Google Scholar]
  10. Jin, H.W. Study on Compilation Method of PDL Beat-Type Train Plan Based on Human-Computer Interaction. Master’s Thesis, Beijing Jiaotong University, Beijing, China, June 2012. [Google Scholar]
  11. Gattermann, P.; Harbering, J.; SchoBel, A. Line pool generation. Public Transp. 2017, 9, 7–32. [Google Scholar] [CrossRef]
  12. Bussieck, M.R. Optimal Lines in Public Rail Transport. Ph.D. Thesis, TU Braunschweig, Braunschweig, Germany, December 1998. [Google Scholar]
  13. Freyss, M.; Giesen, R.; Muñoz, J.C. Continuous approximation for skip-stop operation in rail transit. Proc. Soc. Behav. Sci. 2013, 80, 186–210. [Google Scholar] [CrossRef]
  14. Abdelhafiez, E.A.; Salama, M.R.; Shalaby, M.A. Minimizing passenger travel time in URT system adopting skip-stop strategy. J. Rail Trans. Plan. Manag. 2017, 7, 277–290. [Google Scholar] [CrossRef]
  15. Jiang, Z.B.; Gu, J.J.; Fan, W.; Liu, W.; Zhu, B.Q. Q-learning approach to coordinated optimization of passenger inflow control with train skip-stopping on an urban rail transit line. Comput. Ind. Eng. 2019, 127, 1131–1142. [Google Scholar] [CrossRef]
  16. Jamili, A.; Aghaee, M.P. Robust stop-skipping patterns in urban railway operations under traffic alteration situation. Transp. Res. C Emerg. Technol. 2015, 61, 63–74. [Google Scholar] [CrossRef]
  17. Jiang, F.; Cacchiani, V.; Toth, P. Train timetabling by skip-stop planning in highly congested lines. Transp. Res. B Meth. 2017, 104, 149–174. [Google Scholar] [CrossRef]
  18. Yang, L.X.; Qi, J.G.; Li, S.K.; Gao, Y. Collaborative optimization for train scheduling and train stop planning on high-speed railways. Omega 2016, 64, 57–76. [Google Scholar] [CrossRef]
  19. Yue, Y.X.; Wang, S.F.; Zhou, L.S.; Tong, L.; Saat, M.R. Optimizing train stopping patterns and schedules for high-speed passenger rail corridors. Transp. Res. C Emerg. Technol. 2016, 63, 126–146. [Google Scholar] [CrossRef]
  20. World Bank Open Data. Available online: https://data.worldbank.org/indicator/IS.RRS.TOTL.KM/ (accessed on 19 April 2019).
  21. World Bank Open Data. Available online: https://data.worldbank.org/indicator/IS.RRS.PASG.KM/ (accessed on 19 April 2019).
  22. Annual Report 2017 of Russian Railways (RZD). Available online: http://eng.rzd.ru/statice/public/en?STRUCTURE_ID=4224&layer_id=4516&refererLayerId=4518&id=381 (accessed on 20 April 2019).
  23. Russian Railways (RZD). Available online: http://pass.rzd.ru/static/public/en?STRUCTURE_ID=5154 (accessed on 20 April 2019).
  24. Russian Railways (RZD). Available online: https://pass.rzd.ru/main-pass/public/en (accessed on 20 April 2019).
  25. Davydov, B.; Dynkin, B.; Chebotarev, V. Optimal rescheduling for the mixed passenger and freight line. WIT Trans. Built Environ. 2014, 135, 649–661. [Google Scholar]
  26. Zinder, Y.; Lazarev, A.A.; Musatova, E.G.; Tarasov, I.A. Scheduling the two-way traffic on a single-track railway with a siding. Automat. Remote Contr. 2018, 79, 506–523. [Google Scholar] [CrossRef]
  27. Belousov, A.A.; Skobelev, P.O.; Stepanov, M.E. Network-centric approach to real-time train scheduling in large-scale railway systems. In Proceedings of the ECCOMAS Thematic Conference on Multibody Dynamics, Barcelona, Spain, 29 June–2 July 2015. [Google Scholar]
  28. Antonova, V.M.; Kuznetsov, N.A.; Starostenko, A.M.; Volkov, D.O. Automatic scheduling of monorail transport system. In Proceedings of the 2016 International Conference on Engineering and Telecommunication, Moscow, Russia, 29–30 November 2016; pp. 7–9. [Google Scholar]
  29. Lorens, P.; Maksimova, S.; Saveleva, E. Urban Railway within the Linear Urban Structure: The Case Study of Perm, Russia. In Proceedings of the 20th International Conference on Urban Planning, Regional Development and Information Society, Vienna, Austria, 5–7 May 2015; pp. 675–685. [Google Scholar]
  30. Indian Railways. Available online: http://indianrailways.gov.in/railwayboard/uploads/directorate/coaching/TAG_2017–18/70.pdf (accessed on 20 April 2019).
  31. Indian Railways. Available online: http://indianrailways.gov.in/railwayboard/uploads/directorate/coaching/TAG_2017–18/2.pdf (accessed on 20 April 2019).
  32. Paper. Available online: https://www.researchgate.net/publication/308785695 (accessed on 20 April 2019).
  33. Harbering, J. Planning a Public Transportation System with a View towards Passengers’ Convenience. Ph.D. Thesis, Universität Göttingen, Göttingen, Germany, February 2016. [Google Scholar]
  34. Output of China National Railways from January to December 2018. Available online: http://www.china-railway.com.cn/cpyfw/tjxx/201904/t20190410_93078.html (accessed on 21 April 2019).
  35. Indian Railways. Available online: https://enquiry.indianrail.gov.in/ntes/index.html (accessed on 18 April 2019).
  36. China Railways. Available online: https://kyfw.12306.cn/otn/leftTicket/init?linktypeid=dc (accessed on 18 April 2019).
  37. Gopalakrishnan, R.; Rangaraj, N. Capacity management on long-distance passenger trains of Indian Railways. Interfaces 2010, 40, 291–302. [Google Scholar] [CrossRef]
  38. Sahana, S.K.; Jain, A.; Mahanti, P.K. Ant colony optimization for train scheduling: An analysis. Int. J. Intell. Syst. Appl. 2014, 2, 29–36. [Google Scholar] [CrossRef]
  39. Godwin, T.; Gopalan, R.; Narendran, T.T. Freight train routing and scheduling in a passenger rail network: Computational complexity and the stepwise dispatching heuristic. Asia Pac. J. Oper. Res. 2007, 24, 499–533. [Google Scholar] [CrossRef]
  40. Dalapati, P.; Singh, A.J.; Dutta, A.; Bhattacharya, S. Multi agent based railway scheduling and optimization. In Proceedings of the 2014 IEEE Region 10 Conference, Bangkok, Thailand, 22–25 October 2014; pp. 1–6. [Google Scholar]
  41. Dutta, S.; Rangaraj, N.; Belur, M.; Dangayach, S.; Singh, K. Construction of periodic timetables on a suburban rail network-case study from Mumbai. In Proceedings of the RailLille 2017–7th International Conference on Railway Operations Modelling and Analysis, Lille, France, 4–7 April 2017. [Google Scholar]
  42. Chakroborty, P.; Deb, K.; Subrahmanyam, P.S. Optimal scheduling of urban transit systems using genetic algorithms. J. Transp. Eng. 1995, 121, 544–553. [Google Scholar] [CrossRef]
  43. Wu, X.; Nie, L.; Xu, M. Robust fuzzy quality function deployment based on the mean-end-chain concept: Service station evaluation problem for rail catering services. Eur. J. Oper. Res. 2017, 263, 974–995. [Google Scholar] [CrossRef]
  44. Wu, X.; Nie, L.; Xu, M.; Yan, F. A perishable food supply chain problem considering demand uncertainty and time deadline constraints: Modeling and application to a high-speed railway catering service. Transp. Res. E Log. 2018, 111, 186–209. [Google Scholar] [CrossRef]
  45. Zhou, X.L. Study on cross-track passenger transport organization mode of intercity railway. Railw. Transp. Econ. 2013, 35, 55–59. [Google Scholar]
  46. Lan, S.M.; Zhao, Y.L.; Tang, Q.Z. Passenger flow and its organization solution for Beijing-Shanghai high-speed railway. China Railw. Sci. 2002, 23, 124–129. [Google Scholar]
  47. Li, Z.Z. Discussion on related issues of transport organization of overpass trains on passenger dedicated lines. Transp. Ent. Manag. 2011, 26, 60–62. [Google Scholar]
  48. Ling, X.; Yang, H. Economic distance analysis of high-speed trains running on existing lines. Chin. Railw. 2006, 6, 46–48. [Google Scholar]
  49. Xu, Z.H.; Gan, J.X.; Li, C.Q. Research on reasonable operation distance of train-set. J. Lanzhou Jiaotong Univ. 2008, 27, 83–85. [Google Scholar]
  50. Zhang, Y.Z.; Yan, Y.S. Research on the method of determining reasonable departure range for off-line train. J. Lanzhou Jiaotong Univ. 2010, 29, 79–82. [Google Scholar]
  51. Zhang, Y. Impact of cross-track trains on the capacity and division of passenger dedicated lines and normal lines. Zheng Tie Technol. 2006, 1, 13–15. [Google Scholar]
  52. Luo, J. Study on Reasonable Division and Coordinative Optimization of Passenger Dedicated Line and Existing Railway. Ph.D. Thesis, Southwest Jiaotong University, Chengdu, China, March 2010. [Google Scholar]
  53. Niu, F.; Lei, D.Y.; Deng, L.B.; Wang, F. Optimization design of train plan for long-distance overline passengers. J. Chin. Railw. Soc. 2018, 40, 17–24. [Google Scholar]
  54. Zhu, W.T. Research on Transport Operation of Sunset-Departure and Sunrise-Arrival Trains on Dedicated Passenger lines. Master’s Thesis, Southwest Jiaotong University, Chengdu, China, May 2011. [Google Scholar]
  55. Peng, Q.Y.; Luo, J. Research on operation of sunset-departure and sunrise-arrival trains on dedicated passenger lines. J. Southwest Jiaotong Univ. 2006, 41, 626–630. [Google Scholar]
  56. Zhang, T.W.; Nie, L.; Lu, J. Comprehensive comparison and selection of operation modes of sunset-departure and sunrise-arrival train on high-speed railway. J. Transp. Syst. Eng. Inf. Technol. 2014, 14, 209–216. [Google Scholar]
  57. Zhang, T.W.; Nie, L.; He, Z.H. Optimization model of organization modes choice of sunset-departure and sunrise-arrival train based on simultaneous integrated maintain time on high-speed railway. J. Chin. Railw. Soc. 2015, 37, 1–9. [Google Scholar]
  58. Peng, Q.Y.; Yan, H.F.; Wei, D.Y. Research on transport operation mode of Wuhan-Guangzhou passenger special line. J. Southwest Jiaotong Univ. 2004, 39, 703–707. [Google Scholar]
  59. Tian, S.J. High-Speed Railway Cross-Track Train Working Plan Optimization Research. Master’s Thesis, Southwest Jiaotong University, Chengdu, China, May 2014. [Google Scholar]
  60. Yang, A.A.; Wang, B.; Chen, Y.Y. Plan of cross-track train in urban rail transit based on the capacity influence. J. Transp. Syst. Eng. Inf. Technol. 2017, 17, 221–227. [Google Scholar]
  61. Zhang, T.W.; Gao, G.F.; Luo, Y.P.; Nie, L. Calculation model of maximum number for gathering passenger at railway passenger station. J. Traff. Transp. Eng. 2011, 11, 79–83. [Google Scholar]
  62. Fu, H.L. Research on Theory and Methods of Line Planning for High-Speed Railway. Ph.D. Thesis, Beijing Jiaotong University, Beijing, China, December 2010. [Google Scholar]
  63. Fu, H.L.; Nie, L.; Meng, L.Y.; Sperry, B.R.; He, Z.H. A hierarchical line planning approach for a large-scale high speed rail network: The China case. Transp. Res. A Pol. 2015, 75, 61–83. [Google Scholar] [CrossRef]
Figure 1. The illustration of (a) the individual-track passenger and cross-track passenger and (b) the individual-track high-speed train (ITHST) and cross-track high-speed train (CTHST).
Symmetry 11 00670 g001
Figure 2. The high-speed railway (HSR) network for cross-track line planning among multiple tracks. The station names are presented in an abbreviated manner.
Symmetry 11 00670 g002
Figure 3. The illustration of a transfer pattern by individual-track trains (ITTs) and a direct pattern by CTHSTs.
Symmetry 11 00670 g003
Figure 4. Comparison of European train stop plan and Chinese train stop plan: (a) A sample of a European IR train’s stop plan and (b) a sample of possible Chinese trains’ stop plans of the same “departure station–terminal station” pair.
Symmetry 11 00670 g004
Figure 5. The cross-track demand split and the individual-track demand merged.
Symmetry 11 00670 g005
Figure 6. The illustration of combining individual-track lines of two individual tracks respectively into cross-track lines. The red boxes select individual-track lines of Track 1 whose destination stations are station B. The blue boxes select individual-track lines of Track 2 whose departure stations are station B.
Symmetry 11 00670 g006
Figure 7. Illustration of transforming the original individual-track line plan.
Symmetry 11 00670 g007
Figure 8. Determining the maximum frequency of a CTHST within one day for the (a) CTHST-AC case and (b) CTHST-AD case. A–D are stations and a-c are trains; line ab represents a CTHST from A to C; line ac represents a CTHST from A to D; and the numbers below time horizon represent hours on 24-h clock.
Symmetry 11 00670 g008
Figure 9. The running results of the CTHSTs containing train a: (a) only running CTHST-AC, (b) only running CTHST-AD, and (c) Running both CTHST-AC and CTHST-AD. A–D are stations and a-c are trains; line ab represents a CTHST from A to C; line ac represents a CTHST from A to D; and the numbers below time horizon represent hours on 24-h clock.
Symmetry 11 00670 g009
Figure 10. The original 2-h individual-track line plans of the two-track case: (a) SCHSR’s line plan and (b) CKHSR’s line plan. The top line without any train information is the station list. The big thick circles, big normal circles and small circles represent the big (terminal) stations, medium stations, and small stations, respectively. The number between two neighboring stations is the section distance in kilometers. The train no., frequency, and seat number are provided in front of each line.
Symmetry 11 00670 g010
Figure 11. The original 2-h line plan of each individual track in a large-scale network.
Symmetry 11 00670 g011
Figure 12. The impact that the value of periodicity weight on the results: (a) The impact on the number of CTHSTs and periodic CTHSTs and (b) the impact on the average mileage of CTHSTs and average number of stops per CTHST. The abscissa axis labels different values of periodicity weight that we took for experiments.
Symmetry 11 00670 g012
Figure 13. The impact that the value of train quantity weight on the results: (a) The impact on the number of CTHSTs and periodic CTHSTs and (b) the impact on the average mileage of CTHSTs and average number of stops per CTHST. The abscissa axis labels different values of train quantity weight that we took for experiments.
Symmetry 11 00670 g013
Figure 14. The impact that the value of mileage weight on the results: (a) The impact on the number of CTHSTs and periodic CTHSTs and (b) the impact on the average mileage of CTHSTs and average number of stops per CTHST. The abscissa axis labels different values of mileage weight that we took for experiments.
Symmetry 11 00670 g014
Figure 15. The impact that the value of stop quantity weight on the results: (a) The impact on the number of CTHSTs and periodic CTHSTs and (b) the impact on the average mileage of CTHSTs and average number of stops per CTHST. The abscissa axis labels different values of stop quantity weight that we took for experiments.
Symmetry 11 00670 g015
Table 1. The comparison between studies of train stop plan optimization and stop planning in line pool generation stage.
ResearchBackgroundObjectivePassenger FlowPlanning Stage
Freyss et al. [13]MetroMin passenger travel time; Min operation costYesTimetabling
Abdelhafiez et al. [14]Urban RailMin passenger travel timeYesTimetabling
Jiang et al. [15]Urban RailMin passenger waiting timeYesTimetabling
Jamili and Aghaee [16]Urban RailMax train speedYesTimetabling
Jiang et al. [17]High-Speed RailMax the number of scheduled trainsNoTimetabling
Yang et al. [18]High-Speed RailMin total dwelling time; Min total deviationNoTimetabling
Yue et al. [19]High-Speed RailMax profit: penalize stopsNoTimetabling
Stop planning in line pool generationHigh-Speed RailGenerate a line pool under irregular skip–stop patternYesLine pool generation
Table 2. List of notations in the model for the two-railway line network.
SetDefinition
IA transformed 2-h line plan of one individual track, i I
JA transformed 2-h line plan of the other individual track, j J
ESet of sections among two individual tracks, e E
DSet of cross-track origin-destination (OD) pairs over two individual tracks, d D
ParameterDefinition
F d Frequency requirement of the cross-track OD pair d
P d Passenger demand of the cross-track OD pair d
s i j d 0,1 parameter (1 if a cross-track line formed by i and j can serve the cross-track OD pair d and 0 otherwise)
t i j e 0,1 parameter (1 if a cross-track line formed by i and j passes through section e and 0 otherwise)
u d e 0,1 parameter (1 if a cross-track OD pair d covers the section e and 0 otherwise)
c i j Seat capacity of a cross-track line formed by i and j
θ Periodicity criteria (i.e., the minimum frequency that a line needs to be operated in one day to be a periodic line)
K i j The maximum frequency of a cross-track line formed by i and j in one day
K i The maximum times that i can be used for forming a cross-track line in one day
K j The maximum times that j can be used for forming a cross-track line in one day
L i j Running mileage of a cross-track line formed by i and j
l i j Relative running mileage of a cross-track line formed by i   and   j ,   l i j = L i j / L i j m a x , L i j m a x is the maximum value of all L i j
h i j The number of stops of a cross-track line formed by i   and   j ,   h i j = h i + h j + 1
λ 1 Weight of the periodicity objective
λ 2 Weight of the objective for the total number of CTHSTs
λ 3 Weight of the objective for the total mileage of CTHSTs
λ 4 Weight of the objective for the sum of stops among all CTHSTs
Decision VariableDefinition
x i j k 0,1 variable (1 if a cross-track line formed by i and j runs k cycles one day, i.e., its daily frequency is k, and 0 otherwise)
Table 3. List of new notations in the model for the N-railway track network.
SetDefinition
J q A transformed 2-h line plan of individual track q , q { 1 , 2 , , N } ,   N is the number of individual tracks in the network, j q J q
M n Set of all the combinations composed of n individual-track lines belonging to n individual tracks’ transformed 2-h line plans, respectively, n { 2 , 3 , , N } ; each element is denoted as j 1 j 2 j n ; the element can also be expressed in more detail as j 1 · j p q j n and   j p q means   ITHST   j q J q is in the p position of the combination
SymbolDefinition
o b j m The objective value of cross-track line plan in the case of m-railway track combination, m { 2 , 3 , , N } ; its mathematical expression can be imitated according to Equation (11)
ParameterDefinition
K j 1 j 2 j n The maximum frequency of a cross-track line formed by j 1 , j 2 , …, j n 1 and   j n in one day
K n j q The maximum frequency of cross-track lines containing j q in the n-railway track combination case, n { 2 , 3 , , N } ; K n j q = max { K j 1 j p q j n } , j 1 j p q j n M n
s j 1 j 2 j n d 0,1 parameter (1 if a cross-track line formed by j 1 , j 2 , …, j n 1 and   j n can serve the cross-track OD pair d and 0 otherwise)
t j 1 j 2 j n e 0,1 parameter (1 if a cross-track line formed by j 1 , j 2 , …, j n 1 and   j n passes through section e and 0 otherwise)
c j 1 j 2 j n seat capacity of a cross-track line formed by j 1 , j 2 , …, j n 1 and   j n
Decision VariableDefinition
x j 1 j 2 j n k 0,1 variable (1 if a cross-track line formed by j 1 , j 2 , …, j n 1 and   j n runs   k cycles one day, i.e., its daily frequency is k , and 0 otherwise)
Table 4. The number of decision variables and each part of constraints with expansion of network.
Number of TracksNumber of Decision VariablesNumber of Possible CTHSTsNumber of Lines of Individual-Track Line PlansNumber of SectionsNumber of Cross-Track OD Pairs
100 n m 0
2 k n 2 n 2 2 n 2 m m 2
3 k ( C 3 2 n 2 + C 3 3 n 3 ) C 3 2 n 2 + C 3 3 n 3 3 n 3 m C 3 2 m 2
N k ( C N 2 n 2 + + C N N n N ) C N 2 n 2 + + C N N n N N n N m C N 2 m 2
Note: CTHSTs = cross-track high-speed trains; OD = origin-destination.
Table 5. The cross-track passenger demand and the cross-track OD pair’s service frequency requirement.
OD No.Original StationDestination StationPassenger’s DemandOD Service Frequency Requirement
/person/train
1Fuzhou EastAnshun West11
2Fuzhou EastGuiding North11
3Fuzhou EastGuiyang North121
4Fuzhou EastHuaihua South71
273Shanghai Hong QiaoGuiyang North1362
274Shanghai Hong QiaoHuaihua South1702
275Shanghai Hong QiaoKaili South571
276Shanghai Hong QiaoKunming South861
403ZhujiXiangtan North51
404ZhujiXinhua South11
405ZhujiXinhuang West11
406ZhujiXupu South31
Table 6. OD group division.
OD GroupNumber of OD PairsDemand of Each OD Group
Travel Demand/PersonPercentage of the Total
All OD pairs4065648100.00%
OD ≥ 10 pas.136458281.13%
OD ≥ 20 pas.69362064.09%
OD ≥ 30 pas.41294652.16%
OD ≥ 40 pas.31260546.12%
OD ≥ 50 pas.24228640.47%
Note: pas. = passengers.
Table 7. Results for the different OD groups under a two-track network.
OD Group (pas.)Solving TimeNum of CTHSTsNumber of Periodic CTHSTsSum of SeatsSum of StopsAve No. of Train StopsSum of MilAve Train MilAve Dis bet 2 Nei Stops
kmkmkm
All ODs0.54 s114650020418.5517,0711551.979.4
OD ≥ 100.44 s94540013515.0013,3341481.692.6
OD ≥ 200.51 s6037508814.6797341622.3103.6
OD ≥ 301.08 s5032007615.2076411528.294.3
OD ≥ 400.54 s4026505914.7569671741.8110.6
OD ≥ 500.44 s4026504912.2562261556.5117.5
Note: Num = Number; Ave = Average; Mil = Mileage; Dis = Distance; bet = between; Nei = Neighboring; pas. = passengers.
Table 8. Information for each HSR line in the large-scale network.
TracksTerminal StationsMileage (km)No. of Stations
Beijing–Shanghai HSRBJSSHHQ131823
Beijng–Shenzhen HSRBJWFT240942
Hangzhou–Shenzhen HSRHZESZN148454
Qingdao–Jinan HSRQDJNW41311
Xuzhou–Lanzhou HSRXZEBaJS105022
Nanjing–Chengdu HSRNJSCDE167430
Shanghai–Changsha HSRSHHQCSS108328
Changsha–Kunming HSRCSSKMS116924
Table 9. Results of the extreme cases.
WeightSolve Time (s)Ave Train Mil (km)Ave No. of Train StopsSum of Mil (km)Sum of Stop-sSum of CTH-STsSum of Peri CTH-STsPer Ratio (%)
PerQuaMilStop
100016.771119.87.39304,580200927223787.13
010014.811325.610.51136,53310831033533.98
001013.191163.78.72119,8638981032221.36
000113.991303.47.21139,4657711073229.91
Note: Per = Periodicity; Qua = Quantity; Mil = Mileage; Ave = Average; Peri = Periodic.
Table 10. The impact of the periodicity criteria parameter on the results.
Per CriteriaSolve Time (s)Ave Mil (km)Ave No. of Train StopsSum of Mil (km)Sum of StopsSum of CTH-STsAve Dis bet Two Nei Stops (km)Per Ratio (%)
113.551273.87.59131,204782103148.3100.0
213.941295.68.13136,040854105141.975.2
315.611326.37.92139,261832105148.665.7
412.631282.97.98134,704838105142.860.0
516.001194.78.24127,828882107129.255.1
619.001197.47.58135,309857113139.547.8
714.161273.87.59131,204782103148.30.0
Note: Per = Periodicity; Ave = Average; Mil = Mileage; Dis = Distance; bet = between; Nei = Neighboring.
Table 11. The running times and running results under different networks.
Case No.Num of TracksNum of StationsSize of the PoolSolving Time (s)Num of CTHSTsPeriodicity Ratio
1233490.561136.4%
22501203.07100.0%
3263300.581330.8%
4271140.451729.4%
5281490.872030.0%
6354911.812934.5%
73601693.543737.8%
83711643.833740.5%
9390701.474438.6%
103911403.623842.1%
113122942.995339.6%
124994966.526043.3%
1341005668.215844.8%
1441011984.576647.0%
1541151174.227150.7%
1641192836.886248.4%
1751153655.467347.9%
1851186849.018751.7%
1951226127.758653.5%
2051354817.528253.7%
2151387378.789156.0%
2261456448.129552.6%
23618985310.049758.8%
2471756319.2910153.5%
25721793911.4310258.8%
Note: Num = Number.
Table 12. The running times and running results under different networks.
Case No.Num of TracksNum of StationsSize of the PoolNum of OD PairsSolving Time (s)Num of CTHSTsPeriodicity Ratio (%)
18227102889912.6310560.0
28227243489935.4110561.0
38227318589943.3210561.9
48227526689973.1110461.5
58227647189987.0310461.5
682278025899129.2510462.5
Note: Num = Number.
Table 13. The impact of the scale of demand on the results.
Case No.OD GroupProportion of DemandSolving Time (s)Ave Mil (km)Ave No. of Train StopsSum of CTH-STsAve Dis bet Two Nei Stops (km)Per Ratio (%)
1≥500 pas.56.10%7.551017.66.558135.777.6
2≥400 pas.60.00%7.611071.16.3562145.679.0
3≥300 pas.66.20%7.661073.36.1972149.275.0
4≥250 pas.69.70%8.0510766.2276148.973.7
5≥200 pas.73.80%7.751058.96.417914374.7
6≥150 pas.79.10%8.351139.66.4683152.877.1
7≥100 pas.84.30%8.951214.46.9186153.680.2
8≥50 pas.91.30%11.191156.46.5295153.969.5
9≥30 pas.94.70%12.131170.26.9299147.869.7
10≥20 pas.96.60%11.671233.27.28100148.967.0
11≥10 pas.98.30%12.251205.97.2610514661.9
12All100.00%12.631282.97.98105142.860.0
Note: pas. = passengers; Ave = Average; Mil = Mileage; Dis = Distance; bet = between; Nei = Neighboring; Per = Periodicity.
Table 14. The solving situations of cases using the classic method.
NetworkSize of the Line PoolNumber of StationsTime Range of the PlanSolving Time
Hangzhou–Shenzhen HSR2880542-h24 min 11 s
Shanghai–Changsha HSR4617282-h36 min 34 s
Changsha–Kunming HSR2720242-h18 min 41 s
Qingdao–Jinan HSR366112-h23 s
Beijing–Shenzhen HSR5910422-h1 h 27 min 3 s
Beijing–Shanghai HSR4387232-h49 min 21 s
Nanjing–Chengdu HSR3518302-h26 min 15 s
Xuzhou–Lanzhou HSR3414222-h21 min 57 s
The Whole HSR Network21,165,7432271-dayout of memory
Table 15. The comparison between the real-life line plan and generated line plan.
Line PlanDemand Served by Direct ServiceAve Milage of CTHSTs (km)Ave Num of Stops per CTHSTNum of CTHSTsAve Distance between Two Neighboring Stops (km)Periodicity Ratio
Experimental67.12%1282.907.98105142.8560%
Real-Life100%1277.6214.4112382.91
Note: Num = Number.

