Article

Beta Exponentiated Modified Weibull Distribution: Properties and Application

1
Department of Statistics, University of Gujrat, Gujrat 50700, Pakistan
2
Division of Computational Mathematics and Engineering, Institute for Computational Science, Ton Duc Thang University, Ho Chi Minh City 700000, Vietnam
3
Faculty of Mathematics and Statistics, Ton Duc Thang University, Ho Chi Minh City 700000, Vietnam
*
Author to whom correspondence should be addressed.
Symmetry 2019, 11(6), 781; https://doi.org/10.3390/sym11060781
Submission received: 19 April 2019 / Revised: 2 June 2019 / Accepted: 4 June 2019 / Published: 12 June 2019

Abstract

:
One of the most prominent statistical distributions is the Weibull distribution. The recent modifications in this distribution have enhanced its application but only in specific fields. To introduce a more generalized Weibull distribution, in this work beta exponentiated modified Weibull distribution is established. This distribution consolidate the exponential, skewed and symmetric shapes into one density. The proposed distribution also contains nineteen lifetime distributions as a special case, which shows the flexibility of the distribution. The statistical properties of the proposed model are derived and discussed, including reliability analysis and order statistics. The hazard function of the proposed distribution can have a unimodal, decreasing, bathtub, upside-down bathtub, and increasing shape that make it effective in reliability analysis. The parameters of the proposed model are evaluated by maximum likelihood and least squares estimation methods. The significance of the beta exponentiated modified Weibull distribution for modeling is illustrated by the study of real data. The numerical study indicates that the new proposed distribution gives better results than other comparable distributions.

1. Introduction

Lifetime distributions have been used to model and analyze the lifetime data of numerous applied fields such as engineering and medicine as well as biological, physical, actuarial, and even social and financial sciences. Due to the variation in datasets of every field, the selection of the statistical distribution absolutely affects the quality of modeling and analyzing the data to obtain genuine results. Because of this, many statistical methodologies have been developed to obtain new probability distributions. Most of the methodologies just improve the existing standard probability distributions by adding new parameters to make them flexible enough to model the complex data precisely. However, in this era of complexity, there are many important fields where to model the data accurately, new, or the improvement of existing, probability distributions are required. This situation attracts researchers’ attention to initiate new probability distributions for complex electronic and mechanical systems.
One of the most legendary lifetime distributions is the Weibull distribution, which was introduced by Swedish physicist Waloddi Weibull [1]. The use of the Weibull distribution has been observed in biology, chemistry, medicine, pharmacy, physics, engineering, geography, geology, meteorology, material science, quality control, insurance, and economics. For details, see [2]. Due to the extensive use of the Weibull distribution, several extensions have been proposed in this distribution over the last few decades, such as the new extended Weibull model known as the Marshal Olkin Weibull distribution that was developed by [3]. They explored some of the mathematical properties, including moments, reliability, order statistics, and Rényi entropy, of their extended model with real data application. The generalization, known as the Kumaraswamy Weibull distribution was introduced by [4] by exploring mathematical properties and providing two real datasets modeled by it. The transmuted Weibull distribution was presented by [5] and the exponentiated Weibull distribution derived by [6], with statistical properties and applications. Some other extensions and modifications are developed by [7,8,9,10,11,12] for the Weibull distribution.
The well-known standard Weibull distribution has been considerably applied in modeling numerous systems where the data exhibit decreasing, increasing, and exponential failure rates. One of its generalizations is the exponentiated Weibull (EW) distribution introduced by [13], for which the unimodal and bathtub-shaped failure rates and survival and reliability analyses were illustrated by [14]. The three-parameter modified Weibull distribution was introduced by [15] and by adding an exponent parameter to this distribution, [16] proposed the exponentiated modified Weibull distribution. Beta generalization on the Weibull distribution and modified Weibull distributions have also been discussed by many authors. The beta generalization has been applied to Weibull distributions by [7,17], who introduced the beta modified Weibull distribution, while [18] developed a beta generalized Weibull and [19] studied a beta transmuted Weibull distribution.
In this article, a new six-parameter ( α , β , γ , δ , λ , θ ) generalized distribution is introduced, namely the beta exponentiated modified Weibull (BEMW) distribution, with the belief it will serve superiorly in all areas where the Weibull distribution is applicable. Many distributions become the special case of the proposed distribution such as the exponentiated modified Weibull distribution, the EW distribution, the generalized Rayleigh distribution, the beta EW distribution, the beta Weibull distribution, the Weibull distribution, the generalized linear failure rate distribution, the exponentiated exponential distribution, the exponential distribution, the linear exponential distribution, and the Rayleigh distribution. The new proposed distribution is a flexible distribution and able to play an important role in reliability analyses as it can assume several different shapes of the hazard function.
The remainder of this article is planned as follows: Section 2 introduces a brief description of the beta generalization (Beta-G) and the proposed BEMW distribution with their various special cases. In this section, the probability density function ( p d f ) and cumulative distribution function ( c d f ) of the BEMW distribution are also sketched for various parametric values. The expansion of the c d f and p d f of the proposed density function is presented in Section 3. In Section 4, the statistical properties are derived. Section 5 is related to order statistics of the proposed BEMW distribution. A reliability analysis with some shapes of the hazard function are given in Section 6, and Section 7 explains parameter estimation by maximum likelihood estimation (MLE) and least squares estimation (LSE) methods. In Section 8, the proposed distribution is illustrated with a real dataset. Finally, the study is concluded in Section 9.

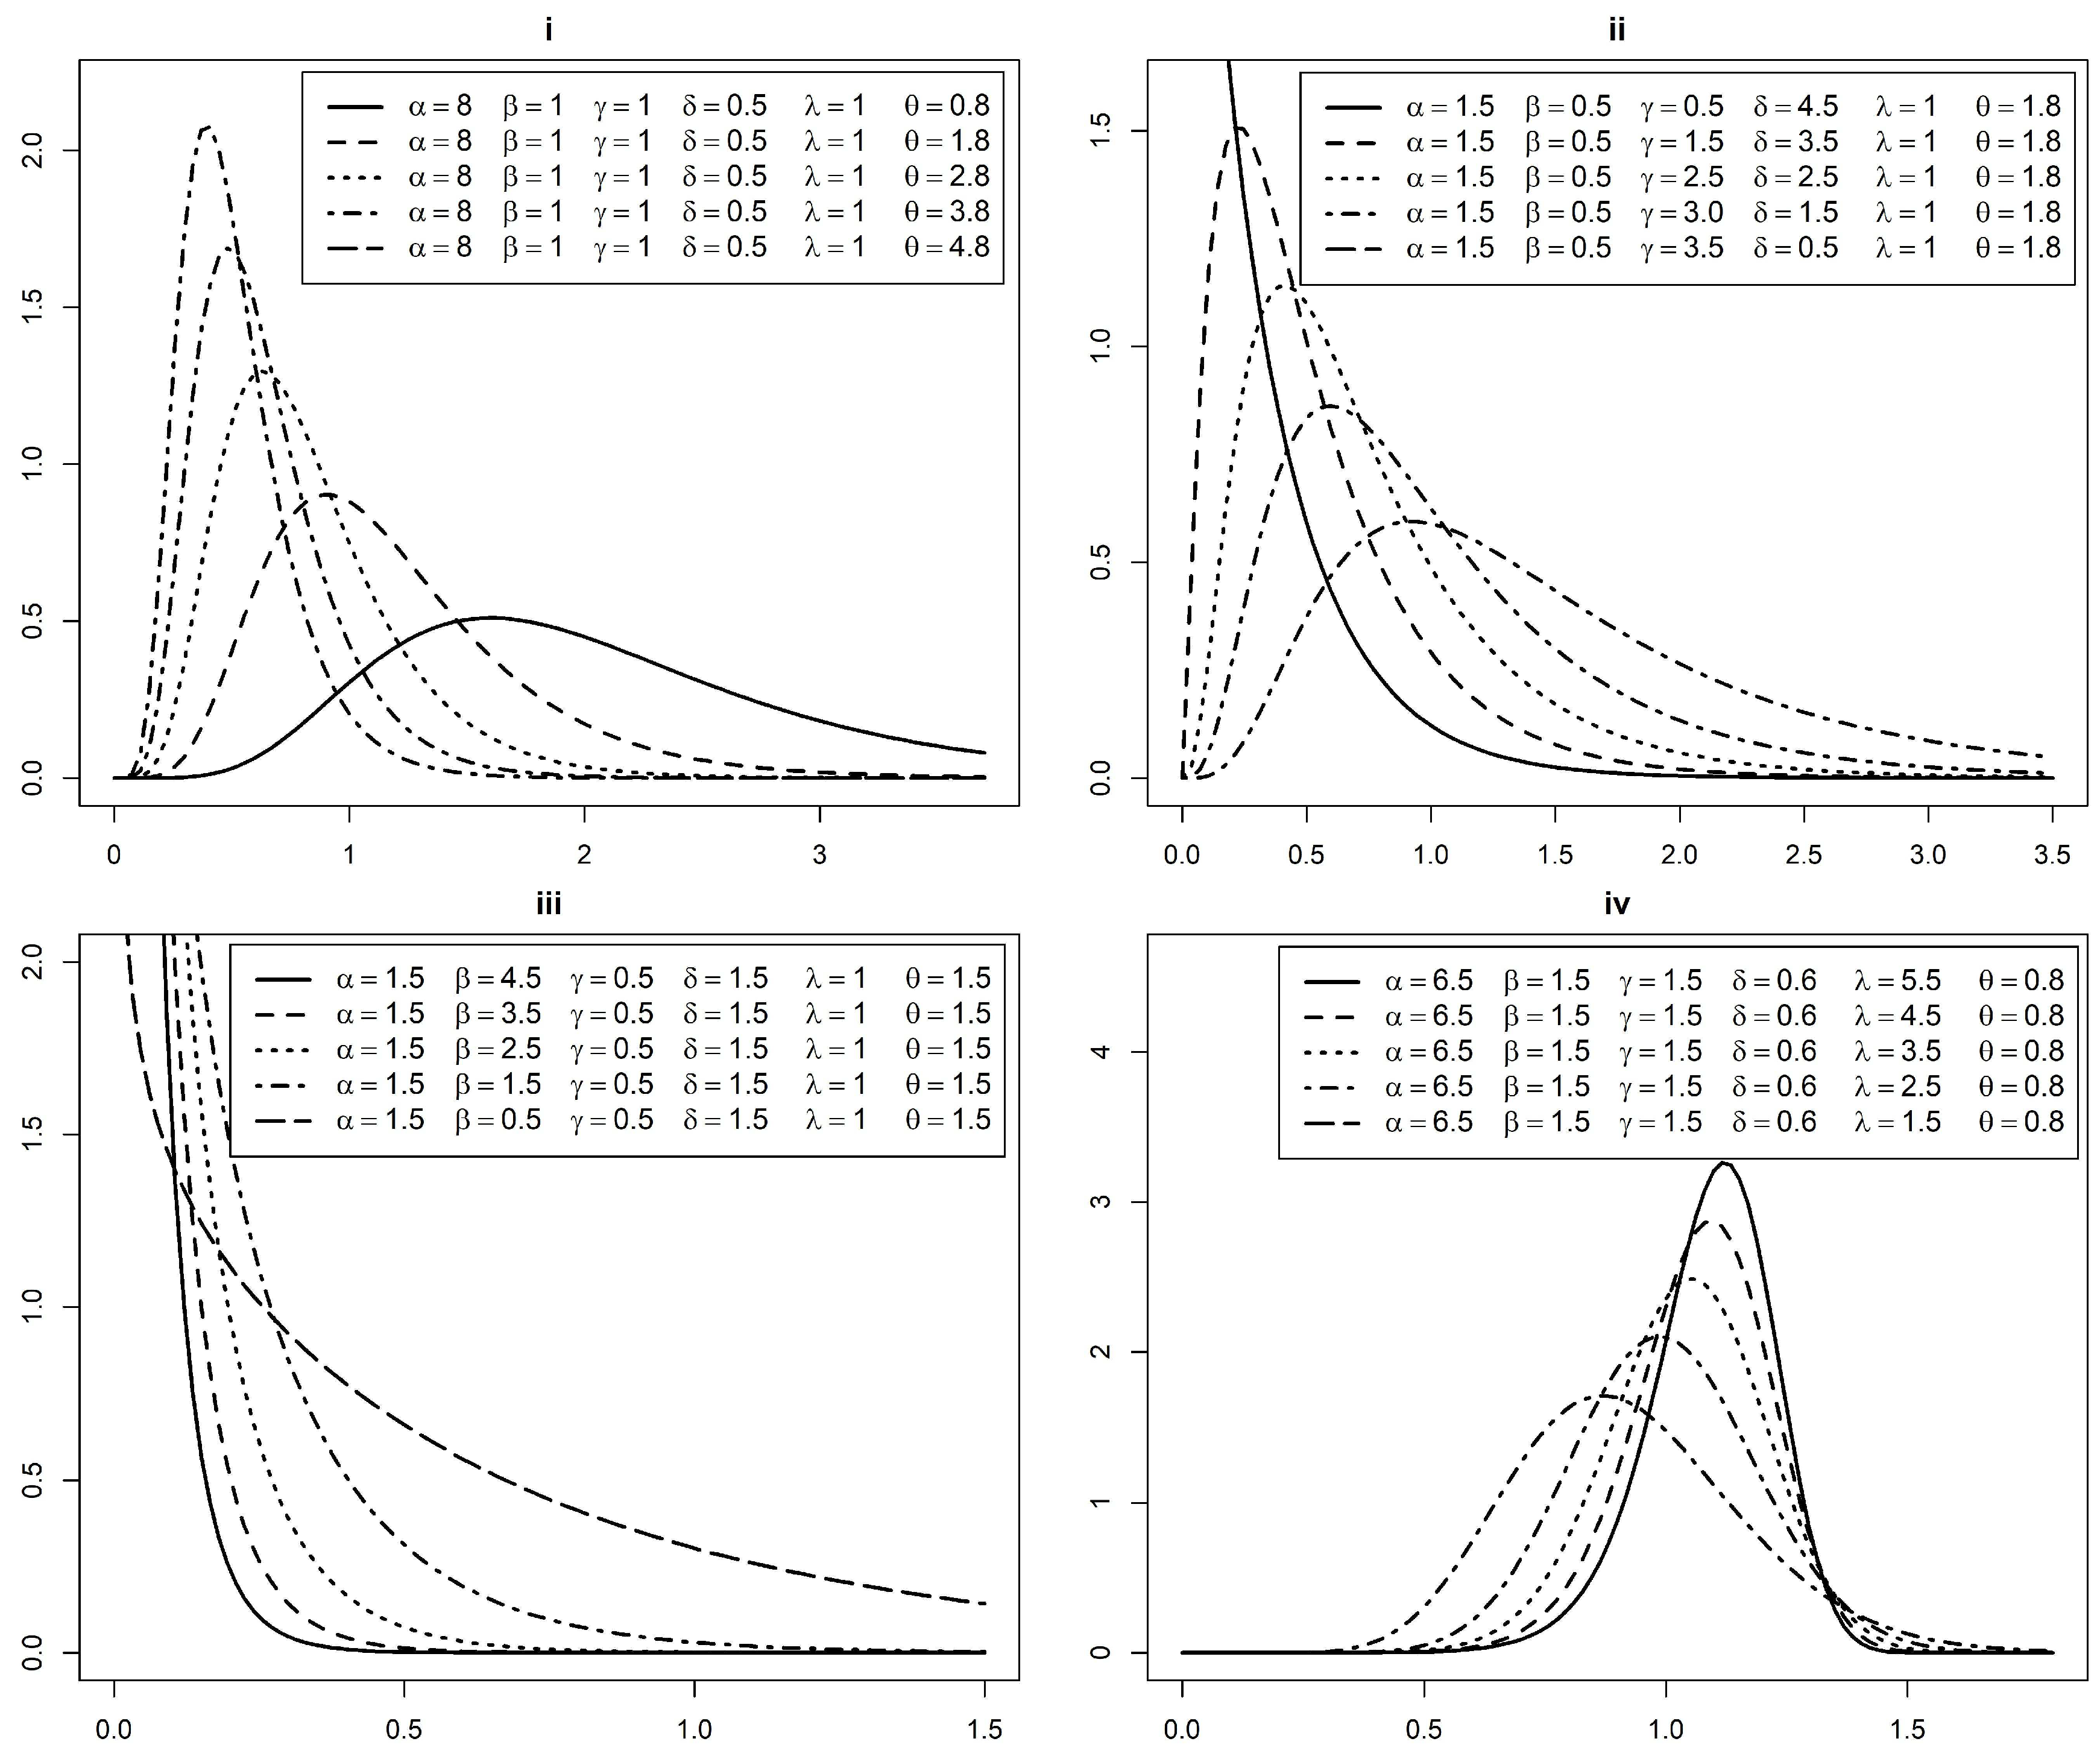
2. Beta Exponentiated Modified Weibull Distribution

The class of Beta-G distributions is introduced by [20]. The c d f of the Beta-G distribution has the following form:
F ( y ) = I D ( y ) ( α , β ) = B D ( y ) ( α , β ) B ( α , β ) ,
F ( y ) = 1 B ( α , β ) 0 D ( y ) z α 1 ( 1 z ) β 1 d z ; f o r α , β > 0 ,
where D ( y ) denotes the c d f of the parent distribution, α and β are the shape parameters, and its role is to increase skewness and tail weight. The details about these two parameters are given in Section 3. The B D ( y ) ( α , β ) and I D ( y ) ( α , β ) denote the incomplete beta function and incomplete beta ratio, respectively.
Let d ( y ) be the p d f of the parent distribution. Then the p d f of the new Beta-G distribution can be obtained as
f ( y ) = 1 B ( α , β ) [ D ( y ) ] α 1 [ 1 D ( y ) ] β 1 d ( y ) .
The class of Beta-G distributions has received considerable attention from researchers; in particular, interested readers are referred to the work of Jones [21]. In fact, on the basis of the Beta-G distribution given in (1), Paranaíba [22] proposed a beta burr XII distribution, Nadarajah and Kotz [23] introduced a new generalized form of exponential model such as the beta exponential distribution, Cordeiro and Lemonte [24] developed a beta Laplace distribution, and Eugene et al. [20] studied the beta normal distribution. Akinsete et al. [25], Nadarajah and Kotz [26], Castellares et al. [27], Alshawarbeh [28], and Condino [29] developed beta Pareto, beta-Gumbel, beta lognormal, beta Cauchy distribution, and beta-Dagum distributions, respectively. There are many other studies that have applied the methodology of the Beta-G distribution and obtained more flexible distributions than their base distribution. Here, our interest is also to introduce the BEMW distribution using the generalization given in (1) and (2), taking the exponentiated modified Weibull (EMW) distribution as a base distribution. The EMW distribution has wide usage and the current generalization will be able to deal with more complex situations. For the EMW distribution with four parameters ( γ , δ , λ , θ ) , the c d f and p d f are given in (3) and (4), respectively.
D ( y ) = 1 e ( δ y + ( θ y ) λ ) γ ,
d ( y ) = γ δ + λ θ λ y λ 1 e ( δ y + ( θ y ) λ ) 1 e ( δ y + ( θ y ) λ ) γ 1 ,
where δ and θ are scale, γ and λ are shape parameters, and y , γ , δ , λ , θ > 0 . The c d f of the BEMW distribution is obtained by taking D ( y ) given in (3) of the EMW distribution in (1), in the following form
F ( y ) = I [ 1 e ( δ y + ( θ y ) λ ) ] γ ( α , β ) ,
F ( y ) = 1 B ( α , β ) 0 1 e ( δ y + ( θ y ) λ ) γ z α 1 ( 1 z ) β 1 d z ; y , α , β , γ , δ , λ , θ > 0 .
The corresponding density function of the BEMW distribution can be obtained using (2)–(4) as
f ( y ) = γ δ + λ θ λ y λ 1 B ( α , β ) e ( δ y + ( θ y ) λ ) 1 e ( δ y + ( θ y ) λ ) α γ 1 1 1 e ( δ y + ( θ y ) λ ) γ β 1 .
Some of the possible shapes with various values of the parameters of the BEMW distribution are demonstrated in Figure 1. It is observed that the pdf of BEMW distribution assumed the exponential, skewed to symmetric shape, depending on the values of the parameters.

2.1. Special Cases of the BEMW Distribution

Some special cases of the BEMW distribution are obtained by using specific values of parameters α , β , γ , δ , λ , and θ . The special cases of BEMW distribution are described as follows.

2.1.1. Beta Exponentiated Weibull (BEW) Distribution

Retaining all the other parameters and by substituting δ = 0 in (6), the BEMW distribution reduces to the BEW distribution that was defined by Singla et al. [18] in the following form
f ( y ) = γ λ θ λ y λ 1 B ( α , β ) 1 e ( θ y ) λ α γ 1 1 ( 1 e ( θ y ) λ ) γ β 1 e ( θ y ) λ .
If α = β = 1 in addition to δ = 0 , then density in (6) reduces to an EW distribution, which is developed by Pal et al. [6], and if α = β = γ = 1 with δ = 0 , (6) transforms into a simple two-parameter Weibull distribution (WD) (Wallodi Weibull [1]).

2.1.2. Beta Generalized Rayleigh (BGR) Distribution

Taking δ = 0 and λ = 2 , then the BEMW distribution in (6) converts to a BGR distribution, which is due to Cordeiro et al. [30]. The obtained p d f in the form of the BGR distribution is given by
f ( y ) = 2 γ θ 2 y B ( α , β ) e ( θ y ) 2 1 e ( θ y ) 2 α γ 1 1 ( 1 e ( θ y ) 2 ) γ β 1 .
If α = β = 1 in addition to δ = 0 and λ = 2 , the BEMW distribution becomes the generalized Rayleigh (GR) distribution ([31]).

2.1.3. Beta Modified Weibull (BMW) Distribution

For γ = 1 , the BEMW distribution gets the following form
f ( y ) = δ + λ θ λ y λ 1 B ( α , β ) e β δ y + ( θ y ) λ 1 e ( δ y + ( θ y ) λ ) α 1 ,
which is the density of the BMW distribution that was presented by Silva et al. [7]. Additionally, for δ = 0 in the density of the BEMW distribution given in (6), reduces to beta Weibull (BW) distribution, which was given by Famoye et al. [8]. Moreover, if α = β = 1 is substituted in the BW distribution, then it approaches a classic Weibull distribution.

2.1.4. Beta Rayleigh (BR) Distribution

Replacing γ , δ , and λ by 1, 0, and 2, respectively, then the BEMW distribution reduces to
f ( y ) = 2 θ 2 y B ( α , β ) e β ( θ y ) 2 1 e ( θ y ) 2 α 1 ,
which is the density of the BR distribution discussed by Hughes and Borgman [32]. Furthermore, if α = β = 1 , it becomes a Rayleigh distribution (RD) (Lord Rayleigh, 1980).

2.1.5. Beta Exponentiated Exponential (BEE) Distribution

If δ = 0 and λ = 1 in (6), this gives a BEE distribution, which is introduced by Souza et al. [33]. Its p d f is defined as
f ( y ) = γ θ B ( α , β ) 1 e ( θ y ) α γ 1 1 ( 1 e ( θ y ) ) γ β 1 e ( θ y ) .
If α = β = 1 and γ = 1 in addition to δ = 0 and λ = 1 , it coincides with the exponentiated exponential (EE) and beta exponential (BE) distribution, respectively (Gupta and Kundu [34], Nadarajah and Kotz [23]). And if α = β = γ = λ = 1 and δ = 0 , then the form becomes a simple exponential distribution (ED).

2.1.6. Beta Generalized Linear Failure Rate (BGLFR) Distribution

For λ = 2 , the proposed distribution in (6) reduces to a BGLFR distribution in the following form:
f ( y ) = γ [ δ + 2 θ 2 y ] B ( α , β ) e δ y + ( θ y ) 2 1 e δ y + ( θ y ) 2 α γ 1 1 1 e δ y + ( θ y ) 2 γ β 1 .
If γ = 1 and α = β = 1 in addition to λ = 2 , the BEMW distribution becomes the beta linear failure rate (BLFR) and the generalized linear failure rate (GLFR) distribution, respectively (see, Jafari and Mahmoudi [35] and Sarhan and Kundu [36]). Both of these densities reduce to a linear failure rate (LFR) distribution for α = β = 1 and γ = 1 , respectively.

2.1.7. Exponentiated Modified Weibull (EMW) Distribution

Introducing α = β = 1 in (6), the density converts to the base distribution with the following p d f :
f ( y ) = γ δ + λ θ λ y λ 1 e δ y + ( θ y ) λ 1 e δ y + ( θ y ) λ γ 1 .
If γ = 1 in addition to α = β = 1 , (6) transforms into a modified Weibull (MW) distribution, which is suggested by Sarhan and Zaindin [37].
All of the nineteen special cases of the BEWM distribution are comprehensively presented in Figure 2. These special cases show that the introduced distribution has great importance in reliability engineering and failure rate analysis.

3. Expansion of the Probability Distribution and Density Function

The c d f and p d f of the BEMW distribution in (5) and (6) are in a complicated form and not readily usable for the derivation of the properties. We provide two forms of c d f of the BEMW distribution for two situations, when β > 0 is a real non–integer or integer. When we have β > 0 and a real non–integer, we have following relationship:
( 1 z ) β 1 = j = 0 ( 1 ) j Γ β Γ β j Γ j + 1 z j ,
the
ω j = ( 1 ) j Γ α + β Γ β j Γ j + 1 Γ α ( α + j )
being a simple weight. Using the above expansion (7) in the c d f of the BEMW distribution given in (5) as
F ( y ) = 1 B ( α , β ) 0 [ 1 e ( δ y + ( θ y ) λ ) ] γ z α 1 ( 1 z ) β 1 d z ,
then
F ( y ) = 1 B ( α , β ) 0 [ 1 e ( δ y + ( θ y ) λ ) ] γ z α 1 j = 0 ( 1 ) j Γ β Γ β j Γ j + 1 z j d z .
The more simple form is given by
F ( y ) = 1 B ( α , β ) j = 0 ( 1 ) j Γ β Γ β j Γ j + 1 ( α + j ) 1 e ( δ y + ( θ y ) λ ) ( α + j ) γ ,
and denoted by
F ( y ) = j = 0 ω j D ( α + j ) γ , δ , λ , θ ( y ) ,
where D ( α + j ) γ , δ , λ , θ ( y ) = [ 1 e ( δ y + ( θ y ) λ ) ] ( α + j ) γ is the c d f of the EMW distribution having shape parameters ( α + j ) γ , λ , scale parameter θ , and ω j is the weight. The corresponding p d f given in (6) is simplified in the following form
f ( y ) = γ δ + λ θ λ y λ 1 B ( α , β ) e δ y + ( θ y ) λ j = 0 ( 1 ) j Γ β Γ β j Γ j + 1 1 e δ y + ( θ y ) λ ( α + j ) γ 1 .
Then
f ( y ) = δ + λ θ λ y λ 1 e δ y + ( θ y ) λ j = 0 ( 1 ) j Γ α + β ( α + j ) γ Γ β j Γ j + 1 Γ α ( α + j ) 1 e ( δ y + ( θ y ) λ ) ( α + j ) γ 1
and can be written in the form of the p d f of the EMW distribution as below.
f ( y ) = j = 0 ω j d ( α + j ) γ , δ , λ , θ ( y )
The p d f of the BEMW distribution can also be expressed in terms of the c d f of the EMW distribution with some weights as
f ( y ) = γ δ + λ θ λ y λ 1 B ( α , β ) e ( δ y + ( θ y ) λ ) D α γ 1 , δ , λ , θ ( y ) j = 0 ( 1 ) j Γ β Γ β j Γ j + 1 D γ j , δ , λ , θ ( y ) .
D α γ 1 , δ , λ , θ ( y ) and D γ j , δ , λ , θ ( y ) are the c d f of the EMW distribution having shape parameters α γ 1 , γ j , λ and scale parameter θ . Secondly, if β is an integer and β > 0 , then index j in (7) stops at β 1 , as a binomial expansion. Then the c d f in (9) can be written as
F ( y ) = j = 0 β 1 ω j D ( α + j ) γ , δ , λ , θ ( y ) .
Proof. 
See Cordeiro and Nadarajah [38]. □

4. Statistical Properties

In this section, some statistical properties of the proposed distribution are derived, such as rth moment, moment generating function ( m g f ) , order statistics, and reliability analysis.

Moments

In this section, the moments of the BEMW distribution are derived using the well-developed procedure.
Theorem 1.
If Y has the BEMW ( α , β , γ , δ , λ , θ ) distribution with the p d f given in (6), then the rth non-central moment, say E ( Y r ) , is obtained by
μ r = E ( Y r ) = i = 0 a γ 1 j = 0 β 1 k = 0 γ j m = 0 ω i , j , k , m δ Γ r + λ m + 1 δ ( i + k + 1 ) r + λ m + 1 + λ θ r Γ r + λ m + λ δ ( i + k + 1 ) r + λ m + λ .
Proof. 
In general, the rth non-central moment is defined as
μ r = 0 y r f ( y ) d y .
Specifically, the above equality for the BEMW distribution with the p d f (6) is given by
μ r = 0 y r γ [ δ + λ θ λ y λ 1 ] B ( α , β ) e δ y + ( θ y ) λ 1 e δ y + ( θ y ) λ α γ 1 [ 1 1 e δ y + ( θ y ) λ } γ β 1 d y .
Using the binomial expansion and simplifying the above equality obtains the following form:
μ r = γ B ( α , β ) i = 0 α γ 1 j = 0 β 1 k = 0 γ j α γ 1 i β 1 j γ j k ( 1 ) i + j + k 0 y r [ δ + λ θ λ y λ 1 ] e δ ( i + k + 1 ) y e θ λ ( i + k + 1 ) y λ d y .
The expression in (13), e θ λ ( i + k + 1 ) y λ , can be written as
e θ λ ( i + k + 1 ) y λ = m = 0 [ θ λ ( i + k + 1 ) y λ ] m m ! .
Now, the substitution of (14) in (13) yields
μ r = i = 0 α γ 1 j = 0 β 1 k = 0 γ j m = 0 ω i , j , k , m δ 0 y r + λ m e δ ( i + k + 1 ) y d y + λ θ λ 0 y r + λ m + λ 1 e δ ( i + k + 1 ) y d y ,
where
ω i , j , k , m = γ B ( α , β ) α γ 1 i β 1 j γ j k ( 1 ) i + j + k + m [ θ λ ( i + k + 1 ) ] m m ! .
Computing the integrals in (15) by Gamma function, then the rth non-central moment is obtained as given in (12), which leads to the completion of the theorem. □
Now, assuming r = 1 , 2 , 3 , 4 in (12) one can obtain the first four non-central moments, those further provide the mean, variance, skewness and kurtosis by considering the usual relationships of the moments.
Theorem 2.
If Y has the BEMW ( α , β , γ , δ , λ , θ ) distribution with the p d f given in (6), then the m g f of Y has the following form:
M Y ( t ) = i = 0 α γ 1 j = 0 β 1 k = 0 γ j m = 0 ω i , j , k , m δ Γ λ m + 1 δ ( i + k + 1 ) t λ m + 1 + λ θ λ Γ λ m + λ δ ( i + k + 1 ) t λ m + λ .
Proof. 
In general, the m g f of Y is defined as
M Y ( t ) = E ( e t Y ) = 0 e t y f ( y ) d y .
The p d f in (6) is utilized in (17) and obtains the following form:
M Y ( t ) = 0 e t y γ δ + λ θ λ y λ 1 B ( α , β ) e δ y + ( θ y ) λ 1 e δ y + ( θ y ) λ α γ 1 1 1 e δ y + ( θ y ) λ γ β 1 d y .
Considering the binomial expansion and substantial simplification, thus we obtain the above expression in the following form:
M Y ( t ) = γ B ( α , β ) i = 0 α γ 1 j = 0 β 1 k = 0 γ j α γ 1 i β 1 j γ j k ( 1 ) i + j + k × 0 [ δ + λ θ λ y λ 1 ] e ( δ ( i + k + 1 ) t ) y e θ λ ( i + k + 1 ) y λ d y .
From (14), we have (18) as given by
M Y ( t ) = i = 0 α γ 1 j = 0 β 1 k = 0 γ j m = 0 ω i , j , k , m δ 0 y λ m e δ ( i + k + 1 ) t y d y + λ θ λ 0 y λ m + λ 1 e δ ( i + k + 1 ) t y d y ,
where
ω i , j , k , m = γ B ( α , β ) α γ 1 i β 1 j γ j k ( 1 ) i + j + k + m [ θ λ ( i + k + 1 ) ] m m ! .
The proof is completed by solving the integrals in (19) by Gamma function and leads to the final expression of the m g f that is given in (16). □

5. Order Statistics of the Beta Exponentiated Modified Weibull Distribution

Order statistics is a very important statistical dimension that deals with the order data. It is defined as, if Y 1 , Y 2 , Y 3 , , Y n are the independent random variables following a BEMW distribution of size n and if we arrange these variables in ascending order as Y ( 1 ) Y ( 2 ) , . Y ( n ) , then the variables Y ( 1 ) , Y ( 2 ) , . , Y ( n ) are ordered statistics of random variables. Order statistics have many applications in survival, reliability, and failure analysis, and it is a natural way to perform a reliability analysis of a system. The density function of rth order statistics of the BEMW distribution can be found with the p d f and c d f given in (6) and (5), respectively.
f ( r ) ( y ( r ) ) = γ [ δ + λ θ λ y λ 1 ] B ( r , n r + 1 ) B ( α , β ) e δ y + ( θ y ) λ 1 e δ y + ( θ y ) λ α γ 1 × 1 1 e δ y + ( θ y ) λ γ β 1 j = 0 β 1 ω j D ( α + j ) γ , δ , λ , θ ( y ) r 1 1 j = 0 β 1 ω j D ( α + j ) γ , δ , λ , θ ( y ) n r
In terms of the c d f of the EMW distribution with some weights, the above expression gets the following form:
f ( r ) ( y ( r ) ) = γ [ δ + λ θ λ y λ 1 ] B ( r , n r + 1 ) B ( α , β ) e ( δ y + ( θ y ) λ ) i = 0 β 1 k = 0 n r β 1 i n r k ( 1 ) i + k × D ( a + i ) γ , δ , λ , θ ( y ) j = 0 β 1 ω j D ( α + j ) γ , δ , λ , θ ( y ) r + k 1 .
The density function of smallest and largest order statistics are obtained by setting r = 1 and r = n , respectively in (20). The density function of smallest order statistics of BEMW distribution can be written as
f ( 1 ) ( y ( 1 ) ) = n γ [ δ + λ θ λ y λ 1 ] B ( α , β ) e ( δ y + ( θ y ) λ ) i = 0 β 1 k = 0 n 1 β 1 i n 1 k ( 1 ) i + k × D ( α + i ) γ , δ , λ , θ ( y ) j = 0 β 1 ω j D ( α + j ) γ , δ , λ , θ ( y ) k .
The density function of the largest order statistics of the BEMW distribution can be written as
f ( n ) ( y ( n ) ) = n γ [ δ + λ θ λ y λ 1 ] B ( α , β ) e ( δ y + ( θ y ) λ ) i = 0 β 1 β 1 i ( 1 ) i D ( α + i ) γ , δ , λ , θ ( y ) j = 0 β 1 ω j D ( α + j ) γ , δ , λ , θ ( y ) n 1 .

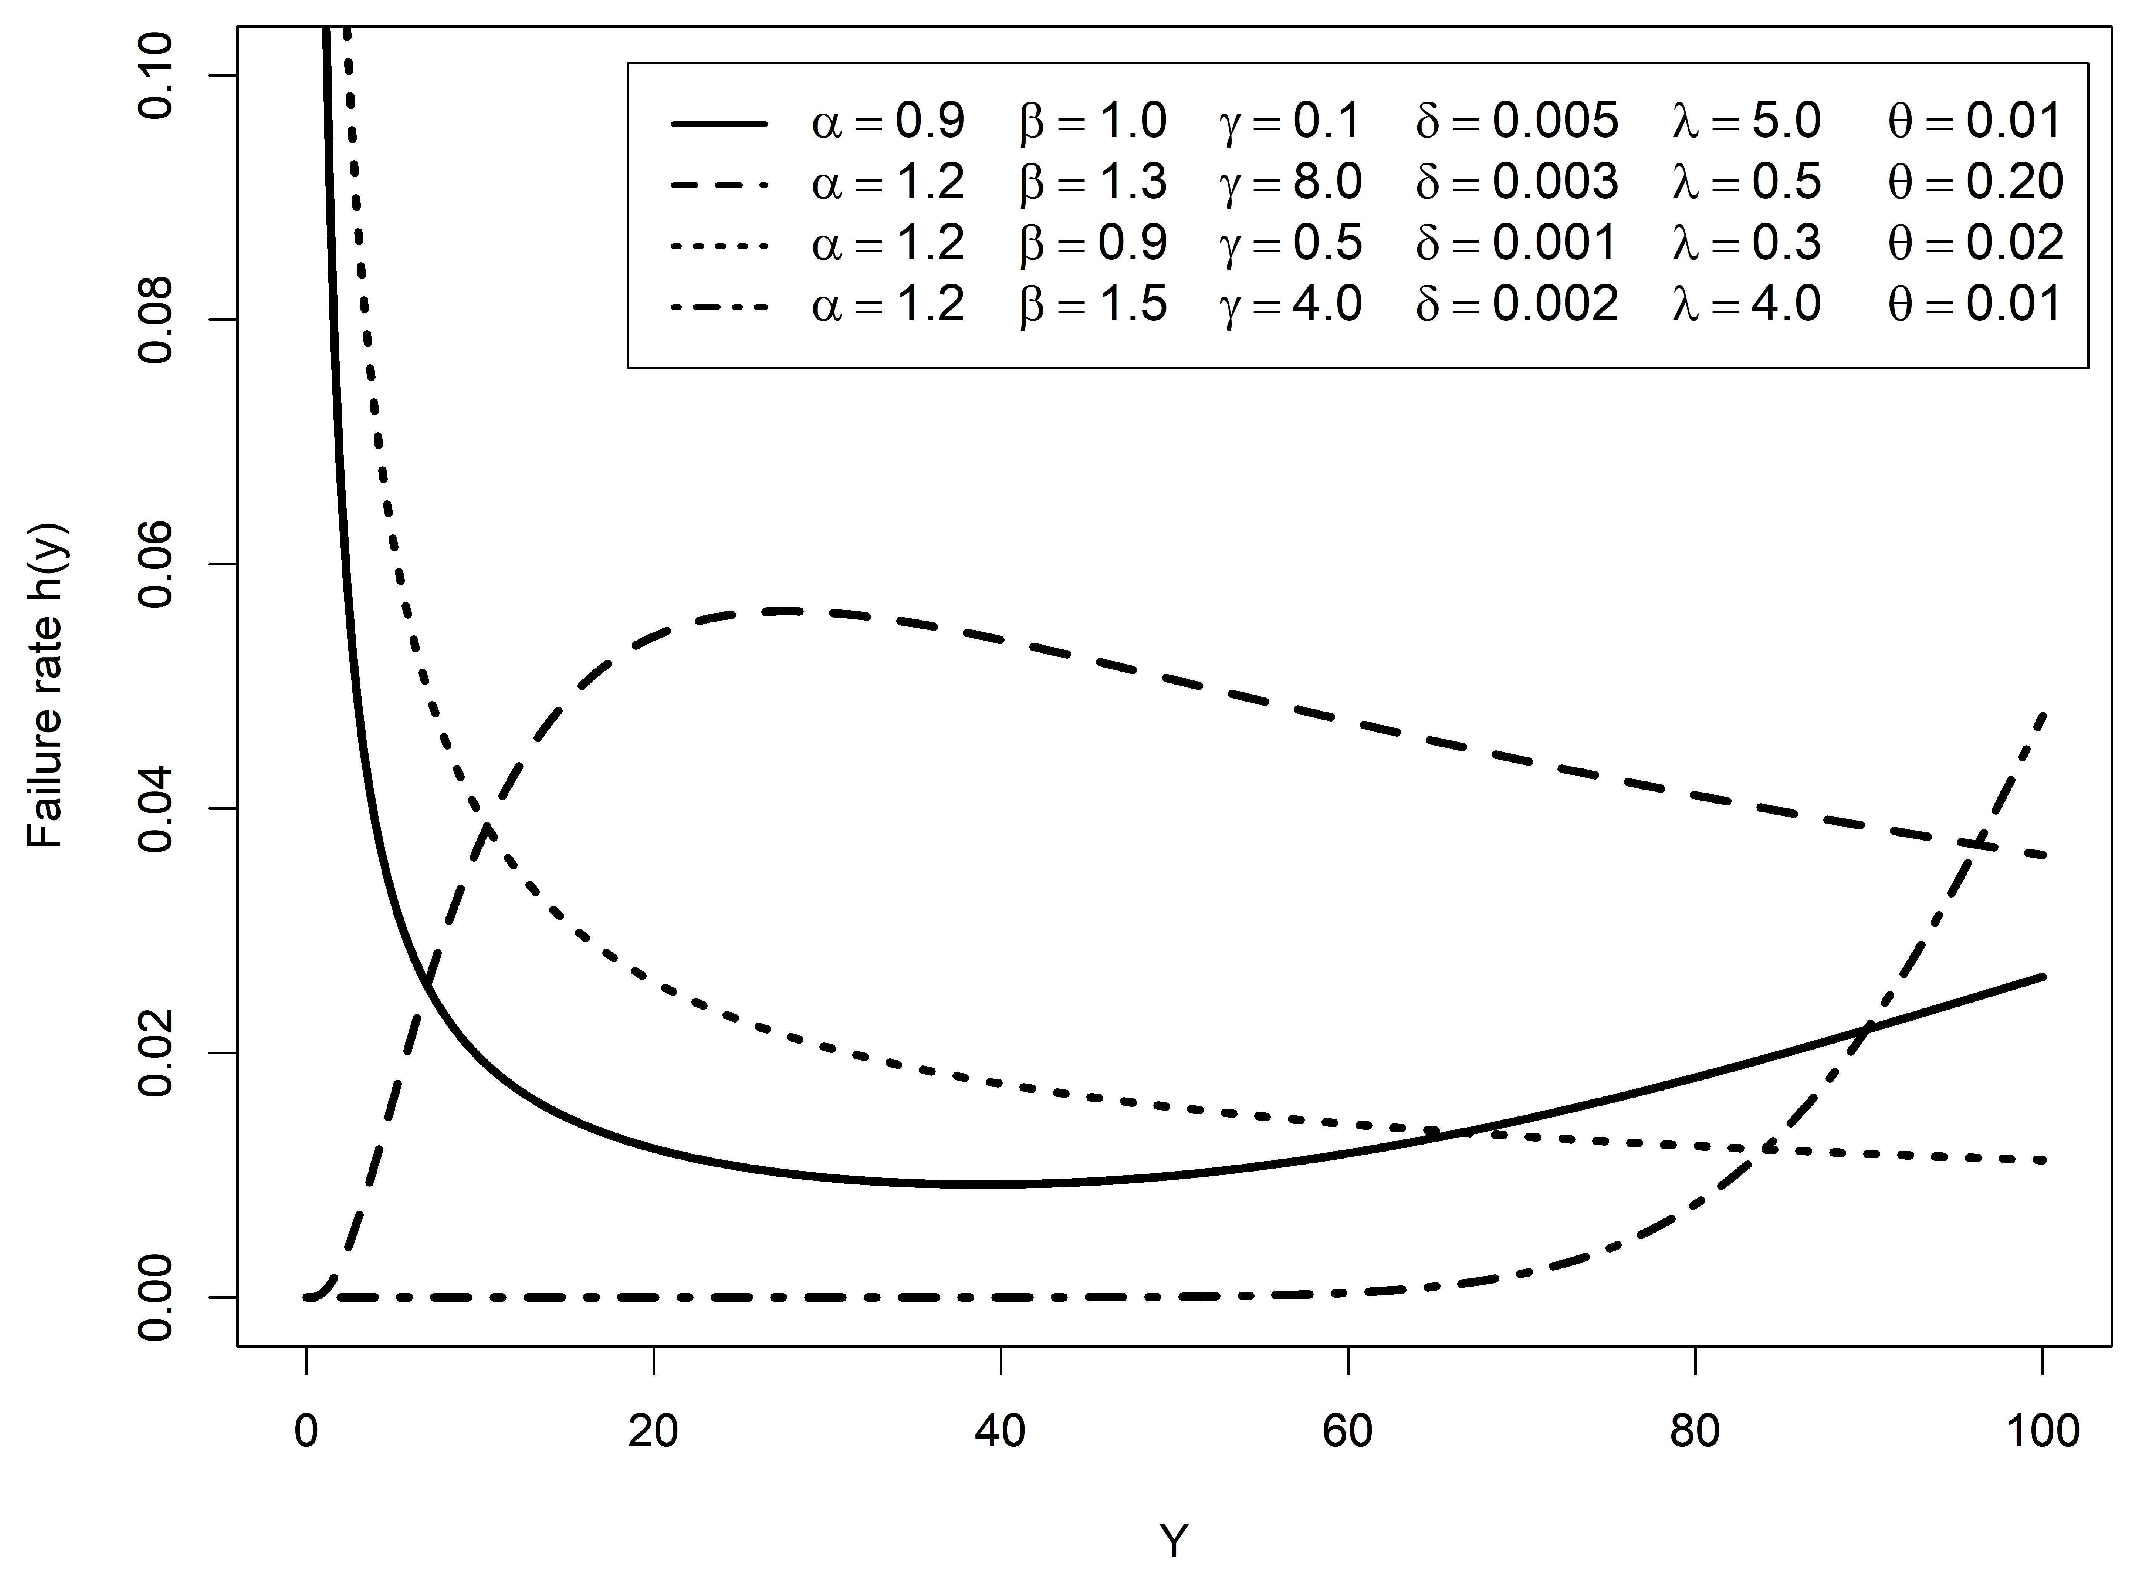
6. Reliability Analysis

Reliability analysis is a procedure to quantitatively assess the mature product at every stage of its life cycle. Almost every product in engineering requires reliability analysis to get the customers’ trust. In reliability analysis, the survival function and hazard rate function are very important and discussed in the following subsections.

6.1. Survival Function

The survival function provides the probability of a product surviving for a specific time. The survival function is derived using the usual expression as
F ¯ ( y ) = P ( Y > y ) = y f ( y ) d y = 1 F ( y ) = I [ 1 D ( y ) ] ( β , α ) .
Let the c d f of the BEMW distribution be substituted in (23) to obtain the survival function of this distribution as
F ¯ ( y ) = 1 B ( β , α ) j = 0 α 1 k = 0 β + j ( 1 ) j + k Γ ( α ) Γ ( a j ) Γ ( j + 1 ) ( β + j ) β + j k D γ k , δ , λ , θ ( y ) .

6.2. Hazard Function

The hazard function of the BEMW distribution can be obtained by using (5) and (6) in the following well-known expression and obtains the following:
h ( y ) = f ( y ) F ¯ ( y ) , h ( y ) = γ [ δ + λ θ λ y λ 1 ] B ( α , β ) I [ 1 D ( y ) ] ( β , α ) e δ y + ( θ y ) λ 1 e δ y + ( θ y ) λ α γ 1 1 1 e δ y + ( θ y ) λ γ β 1 .
In Figure 3, the possible shapes of the hazard function of the BEMW distribution are sketched for various parametric values. As the BEMW model is most flexible, it can accommodate possible forms of the hazard function such as (i) decreasing, (ii) bathtub (decreasing–stable–increasing), (iii) upside-down bathtub (increasing–decreasing), (iv) stable and increasing, and (v) unimodal.

7. Parameter Estimation

The interest in this section is to estimate the parameters of the BEMW distribution through maximum likelihood estimation and least squares estimation.

7.1. Maximum Likelihood Estimation

Let Y 1 , Y 2 , , Y n be the independent random variables following a BEMW distribution of size n with a vector of parameters δ = α , β , γ , δ , λ , θ T . Then the log likelihood function is obtained in the following form:
l ( α , β , γ , δ , λ , θ ) = l o g γ + l o g ( δ + λ θ λ y λ 1 ) δ y + ( θ y ) λ l o g B ( α , β ) + ( α γ 1 ) l o g 1 e ( δ y + ( θ y ) λ ) + ( β 1 ) l o g 1 1 e δ y + ( θ y ) λ γ .
Let the logarithmic derivative of the gamma function be the digamma function ψ ( . ) . Then, the components of the unit score vector U = l α , l β , l γ , l δ , l λ , l θ T can be written as
l α = ψ ( α + β ) ψ ( α ) + γ l o g 1 e δ y + ( θ y ) λ ,
l β = ψ ( α + β ) ψ ( β ) + l o g 1 1 e δ y + ( θ y ) λ γ ,
l γ = 1 γ + α l o g 1 e ( δ y + ( θ y ) λ ) ( β 1 ) 1 e δ y + ( θ y ) λ γ l o g 1 e ( δ y + ( θ y ) λ ) 1 1 e δ y + ( θ y ) λ γ ,
l δ = 1 δ + λ θ λ y λ 1 y + ( α γ 1 ) y e ( δ y + ( θ y ) λ ) [ 1 e ( δ y + ( θ y ) λ ) ] ( β 1 ) γ y e ( δ y + ( θ y ) λ ) 1 e ( δ y + ( θ y ) λ ) γ 1 1 1 e δ y + ( θ y ) λ γ ,
l λ = θ λ y λ 1 1 + λ l o g ( θ ) + λ l o g ( y ) [ δ + λ θ λ y λ 1 ] ( θ y ) λ l o g ( θ y ) + ( α γ 1 ) ( θ y ) λ l o g ( θ y ) e ( δ y + ( θ y ) λ ) 1 e ( δ y + ( θ y ) λ ) γ ( β 1 ) y ( θ y ) λ l o g ( θ y ) e ( δ y + ( θ y ) λ ) 1 e ( δ y + ( θ y ) λ ) γ 1 1 1 e δ y + ( θ y ) λ γ ,
and
l θ = λ 2 y λ 1 θ λ 1 δ + λ θ λ y λ 1 λ y λ θ λ 1 + ( α γ 1 ) e ( δ y + ( θ y ) λ ) λ y λ θ λ 1 1 e ( δ y + ( θ y ) λ ) γ ( β 1 ) λ y λ θ λ 1 e ( δ y + ( θ y ) λ ) 1 e ( δ y + ( θ y ) λ ) γ 1 1 1 e δ y + ( θ y ) λ γ .
The total log likelihood for n sample size is in the form of l n ( δ ) = i = 0 n l ( i ) ( δ ) , where l ( i ) is the log-likelihood for the ith observation. The total score function can also be written in the form of U n ( δ ) = i = 0 n l ( i ) ( δ ) . Then the maximum likelihood estimator for δ ^ can be derived from the above non-linear equations by setting U n = 0 . Even the closed-form estimators are not possible to obtain due to the nonlinearity in the system of equations. In this situation, the Newton Raphson numerical solution algorithm is employed to obtain the estimates of the parameters by solving the above six nonlinear equations simultaneously. The Newton Raphson approach also produces the Hessian matrix. The Hessian matrix is used to find the information matrix, and then the inverse of the information matrix produces the variance and co-variances, which are used to compute the hypothesis testing and confidence intervals.

7.2. Least Squares Estimation

Let Y 1 , Y 2 , Y 3 , Y n be the independent random variables following a BEMW distribution of size n with its c d f , F ( y ) , and suppose Y i denotes the ordered sample where i = 1 , 2 , 3 , n . For sample size n, we have ranked as
E [ F ( Y i ) ] = i n + 1 .
The least squares estimation (LSE) can be obtained by minimizing the following expression:
Q ( α , β , γ , δ , λ , θ ) = i = 0 n F ( y i ) i n + 1 2 .
Now, specifically using the c d f of the BEMW distribution, the above expression can be written as
Q ( α , β , γ , δ , λ , θ ) = i = 0 n j = 0 β 1 ω j D ( α + j ) γ , δ , λ , θ ( y ) i n + 1 2 .
To obtain the parameter estimates, the above expression may be differentiated with respect to α , β , γ , δ , λ , and θ .

8. Application

The Weibull distribution and modified Weibull distribution are popular for survival and failure data analysis, but it is necessary to establish a quite flexible distribution for the analysis of the various types of such data. Therefore, besides some such distributions, the proposed flexible (BEMW) distribution is fitted on failure data to determine a more accurate distribution among them. The failure dataset is about the time-to-failure (103 h) of the turbocharger of one type of engine, reported by [39] and containing 40 observations. The summary statistics of the dataset are given in Table 1.
Using the time-to-failure of the turbocharger of an engine dataset, we evaluated the fitting of the proposed distribution and the EMW, MW, and exponential distributions. The comparison of these distributions is assessed by using three criteria such as the Akaike information criterion (AIC),Bayesian information criterion (BIC), and the Akaike information criterion corrected (AICc). The mathematical expression of these measures is as follows:
A I C = 2 p 2 L ,
B I C = 2 L + p l o g ( n ) ,
and
A I C c = A I C + 2 p ( p + 1 ) ( n p 1 ) ,
where p is the number of parameters in any distribution, and n is the sample size. The estimates of parameters are obtained by using maximum likelihood and least squares estimation methods, and the best-fitted distributions have the smaller values of the AIC, BIC, and AICc. The results in Table 2 provide MLEs, standard errors, and goodness-of-fits of the BEMW distribution as well as other models. The results in Table 3 provide LSEs, standard errors, and goodness-of-fits of the BEMW distribution as well as other models. The results reported in Table 2 and Table 3 indicate that the BEMW distribution is better than the EMW, MW, and exponential distributions. It is observed that the results of LSE are better than the MLE according to the goodness-of-fit measures. Additionally, standard errors of estimates of the LSE are smaller than those of MLE. The results of MLE are not reliable here as in case of large numbers of parameters, the MLE become unstable and a convergence issue arises. It is heavily biased for small samples and sensitive to the choice of starting values. For more details, see [40].

9. Conclusions

This work has introduced a beta generalization of the exponentiated modified Weibull distribution. The new proposed distribution has contained nineteen special cases, such as the beta exponentiated Weibull, beta generalized Rayleigh, beta modified Weibull, beta Rayleigh, beta exponentiated exponential, beta generalized linear failure rate, and exponentiated modified Weibull distribution, among other special cases. The new generalized distribution is more flexible than its parent distribution due to the additional two parameters over the base distribution. The proposed distribution can assume a wide variety of shapes such as exponential, skewed and symmetric; this ability enhance its applicability in real-life applications. Some statistical properties of the BEMW distribution are derived. The smallest, largest, and the rth order statistics of this distribution are also discussed in this study. The estimation inference is based on likelihood and least squares methods. A real dataset was considered to illustrate the potential of the proposed distribution as compared to the other distributions. In general, the results have shown that the proposed BEMW distribution performs better and by the least squares estimation, more precise results are obtained.

Author Contributions

Conceptualization, M.N.S. and E.U.; Formal analysis, M.N.S. and E.U.; funding acquisition, A.H.; investigation, E.U. and A.H.; methodology, M.N.S. and A.H.; resources, M.N.S.; supervision, M.N.S.; writing, original draft, M.N.S. and E.U.; writing, review and editing, A.H.

Funding

This research received no external funding.

Conflicts of Interest

The authors declare no conflict of interest.

References

  1. Weibull, W.T. A statistical distribution function of wide applicability. J. Appl. Mech. 1951, 103, 293–297. [Google Scholar]
  2. Murthy, D.P.; Xie, M.; Jiang, R. Weibull Models; John Wiley and Sons: New York, NY, USA, 2004. [Google Scholar]
  3. Cordeiro, G.M.; Lemonte, A.J. On the Marshall-Olkin extended Weibull distribution. Stat. Pap. 2013, 54, 333–353. [Google Scholar] [CrossRef]
  4. Cordeiro, G.M.; Ortega, E.M.M.; Nadarajah, S. The Kumaraswamy Weibull distribution with application to failure data. J. Frankl. Inst. 2010, 347, 1399–1429. [Google Scholar] [CrossRef]
  5. Aryal, G.R.; Chris, P. Transmuted Weibull Distribution: A Generalization of the Weibull Probability Distribution. Eur. J. Pure Appl. Math. 2011, 4, 89–102. [Google Scholar]
  6. Pal, M.; Ali, M.M.; Woo, J. Exponentiated weibull distribution. Statistica 2006, 66, 139–147. [Google Scholar]
  7. Silva, G.O.; Ortega, E.M.M.; Cordeiro, G.M. The beta modified Weibull distribution. Lifetime Data Anal. 2010, 16, 409–430. [Google Scholar] [CrossRef]
  8. Lee, C.; Famoye, F.; Olumolade, O. Beta-Weibull Distribution: Some Properties and Applications to Censored Data. J. Mod. Appl. Stat. Methods 2017, 6, 173–186. [Google Scholar] [CrossRef]
  9. Saboor, A.; Pogany, T.K. Marshall-Olkin gamma-Weibull distribution with applications. Commun. Stat. Theory Methods 2016, 45, 1559–1563. [Google Scholar] [CrossRef]
  10. Pogány, T.K.; Saboor, A.; Provost, S. The Marshall–Olkin exponential Weibull distribution. Hacett. J. Math. Stat. 2015, 44, 1579–1594. [Google Scholar] [CrossRef]
  11. Cordeiro, G.M.; Ortega, E.M.; Lemonte, A.J. The exponential–Weibull lifetime distribution. J. Stat. Comput. Simul. 2014, 84, 2592–2606. [Google Scholar] [CrossRef]
  12. Leipnik, R.O.Y.B.; Pearce, C.E.M. Independent non-identical five-parameter gamma-Weibull variates and their sums. ANZIAM J. 2004, 46, 265–271. [Google Scholar] [CrossRef] [Green Version]
  13. Mudholkar, G.S.; Srivastava, D.K. Exponentiated Weibull family for analyzing bathtub failure-rate data. IEEE Trans. Reliab. 1993, 42, 299–302. [Google Scholar] [CrossRef]
  14. Mudholkar, G.S.; Srivastava, D.K.; Freimer, M. The exponentiated Weibull family: A reanalysis of the bus-motor-failure data. Technometrics 1995, 37, 436–445. [Google Scholar] [CrossRef]
  15. Lai, C.D.; Xie, M.; Murthy, D.N.P. A modified Weibull distribution. IEEE Trans. Reliab. 2003, 52, 33–37. [Google Scholar] [CrossRef]
  16. Elbatal, I. Exponentiated modified Weibull distribution. Econ. Qual. Control 2011, 26, 189–200. [Google Scholar] [CrossRef]
  17. Famoye, F.; Lee, C.; O lumolade, O. The beta-Weibull distribution. J. Stat. Theory Appl. 2005, 4, 121–136. [Google Scholar]
  18. Singla, N.; Jain, K.; Kumar Sharma, S. The Beta Generalized Weibull distribution: Properties and applications. Reliab. Eng. Syst. Saf. 2012, 102, 5–15. [Google Scholar] [CrossRef]
  19. Pal, M.; Tiensuwan, M. The Beta Transmuted Weibull Distribution. Austrian J. Stat. 2015, 43, 133. [Google Scholar] [CrossRef]
  20. Eugene, N.; Lee, C.; Famoye, F. Beta-normal distribution and its applications. Commun. Stat. Theory Methods 2002, 31, 497–512. [Google Scholar] [CrossRef]
  21. Jones, M.C. Family of distributions arising from distribution of order statistics. Test 2004, 13, 1–43. [Google Scholar] [CrossRef]
  22. Paranaíba, P.F.; Ortega, E.M.; Cordeiro, G.M.; Pescim, R.R. The beta Burr XII distribution with application to lifetime data. Comput. Stat. Data Anal. 2011, 55, 1118–1136. [Google Scholar] [CrossRef]
  23. Nadarajah, S.; Kotz, S. The beta exponential distribution. Reliab. Eng. Syst. Saf. 2006, 91, 689–697. [Google Scholar] [CrossRef]
  24. Cordeiro, G.M.; Lemonte, A.J. The beta Laplace distribution. Stat. Probab. Lett. 2011, 81, 973–982. [Google Scholar] [CrossRef]
  25. Akinsete, A.; Famoye, F.; Lee, C. The beta-Pareto distribution. Statistics 2008, 42, 547–563. [Google Scholar] [CrossRef]
  26. Nadarajah, S.; Kotz, S. The beta Gumbel distribution. Math. Probl. Eng. 2004, 4, 323–332. [Google Scholar] [CrossRef]
  27. Castellares, F.; Montenegro, L.C.; Cordeiro, G.M. The beta log-normal distribution. J. Stat. Comput. Simul. 2013, 83, 203–228. [Google Scholar] [CrossRef]
  28. Alshawarbeh, E.; Lee, C.; Famoye, F. The beta-Cauchy distribution. J. Probab. Stat. Sci. 2012, 10, 41–57. [Google Scholar]
  29. Condino, F.; Domma, F.; Lee, C. The beta-Dagum distribution. In Proceedings of the 45th Scientific Meeting of the Italian Statistical Society, Padua, Italy, 29 June–1 July 2010. [Google Scholar]
  30. Cordeiro, G.M.; Cristino, C.T.; Hashimoto, E.M.; Ortega, E.M. The beta generalized Rayleigh distribution with applications to lifetime data. Stat. Pap. 2013, 54, 133–161. [Google Scholar] [CrossRef]
  31. Kundu, D.; Raqab, M.Z. Generalized Rayleigh distribution: Different methods of estimations. Comput. Stat. Data Anal. 2005, 49, 187–200. [Google Scholar] [CrossRef]
  32. Hughes, S.A.; Borgman, L.E. Beta-Rayleigh distribution for shallow water wave heights. J. Hydrodyn. 1987, 17–31. [Google Scholar]
  33. Barreto-Souza, W.; Santos, A.H.; Cordeiro, G.M. The beta generalized exponential distribution. J. Stat. Comput. Simul. 2010, 80, 159–172. [Google Scholar] [CrossRef] [Green Version]
  34. Gupta, R.D.; Kundu, D. Exponentiated exponential family: An alternative to gamma and Weibull distributions. Biom. J. 2001, 43, 117–130. [Google Scholar] [CrossRef]
  35. Jafari, A.A.; Mahmoudi, E. Beta-linear failure rate distribution and its applications. arXiv 2012, arXiv:1212.5615. [Google Scholar]
  36. Sarhan, A.M.; Kundu, D. Generalized linear failure rate distribution. Commun. Stat. Theory Methods 2009, 38, 642–660. [Google Scholar] [CrossRef]
  37. Sarhan, A.M.; Zaindin, M. Modified Weibull distribution. APPS Appl. Sci. 2009, 11, 123–136. [Google Scholar]
  38. Cordeiro, G.M.; Nadarajah, S. Closed-form expressions for moments of a class of beta generalized distributions. Braz. J. Probab. Stat. 2011, 25, 14–33. [Google Scholar] [CrossRef]
  39. Xu, K.; Xie, M.; Tang, L.C.; Ho, S.L. Application of neural networks in forecasting engine systems reliability. Appl. Soft Comput. 2003, 2, 255–268. [Google Scholar] [CrossRef]
  40. Danielsson, J. Financial Risk Forecasting: The Theory and Practice of Forecasting Market Risk with Implementation in R and Matlab; John Wiley and Sons: New York, NY, USA, 2011. [Google Scholar]
Figure 1. Various shapes of the pdfs of the beta exponentiated modified Weibull (BEMW) distribution for the varying values of the parameters.
Symmetry 11 00781 g001
Figure 2. Special cases of the beta exponentiated modified Weibull (BEMW) distribution (In figure, D stands for the ‘distribution’).
Symmetry 11 00781 g002
Figure 3. The various shapes of the hazard function of the BEMW distribution.
Symmetry 11 00781 g003
Table 1. Summary statistics of data on the time-to-failure (103 h) of a turbocharger.
LengthAverageMinimumMaximum Q 1 Median Q 3 Standard Deviation
406.25251.69.05.0756.507.8251.95553
Table 2. Maximum likelihood estimates with standard errors and distribution selection measures for the time-to-failure of the turbocharger data.
Model α ^ β ^ γ ^ δ ^ λ ^ θ ^ AICBICAICc
BEMWD2.66290.96642.92560.27691.62310.378524.9935.1327.54
(0.5594)(2.0912)(0.5068)(7.7832)(37.7734)(23.1998)
EMWD--26.90867.6903 × 10 7 15.14060.0139928.6935.4429.83
(0.0916)(15.0308)(0.5086)(742.7817)
MWD---0.18950.28104.0529 × 10 6 34.3439.4135.01
(7.3718)(3.3962)(2775.03)
ED-----0.181730.5632.2530.66
(8.0248)
Table 3. Least squares (LS) estimates with the standard errors and distribution selection measures for the time-to-failure of the turbocharger data.
Model α ^ β ^ γ ^ δ ^ λ ^ θ ^ AICBICAICc
BEMWD1.42681.30791.5000.99991.99991.899918.3428.4720.89
(3.7841)(0.3475)(0.0003)(0.0019)(0.0119)(0.0115)
EMWD--1.51290.96891.83781.740734.3441.1035.48
(0.0006)(0.0483)(0.1911)(0.2035)
MWD---0.98931.93661.839232.3437.4133.01
(0.0179)(0.0920)(0.0925)
ED-----0.135324.5626.2524.66
(9.8036)

