Realizing the structure of a spherical polyhedron requires a system of edges between critical points that appears naturally from a map’s behavior. Serving as an archetype is the soccer ball map where the collection of edges is a forward invariant set in which the image of a single face K is a union of faces that are canonically associated with K—namely, the complement of K’s antipodal face.
7.1. Constructing Edges
What follows is a fairly elaborate description of a method that, for a 31-map
f, constructs edges between adjacent vertices (periodic critical points). Working on the sphere, adjacency is determined by triangular and pentagonal arrangements of critical points nearest to 3-fold and 5-fold axes. In every case, a common heuristic element first connects adjacent vertices by a great-circle arc. Given such a “proto-edge”
or
(depending upon whether the arc spans adjacent triangular vertices
or pentagonal vertices
, we use the image
or
to indicate a collection of edges to which an
actual edge maps. To be specific, say that we’re approximating an actual pentagonal edge
P that spans
,
—illustrated in
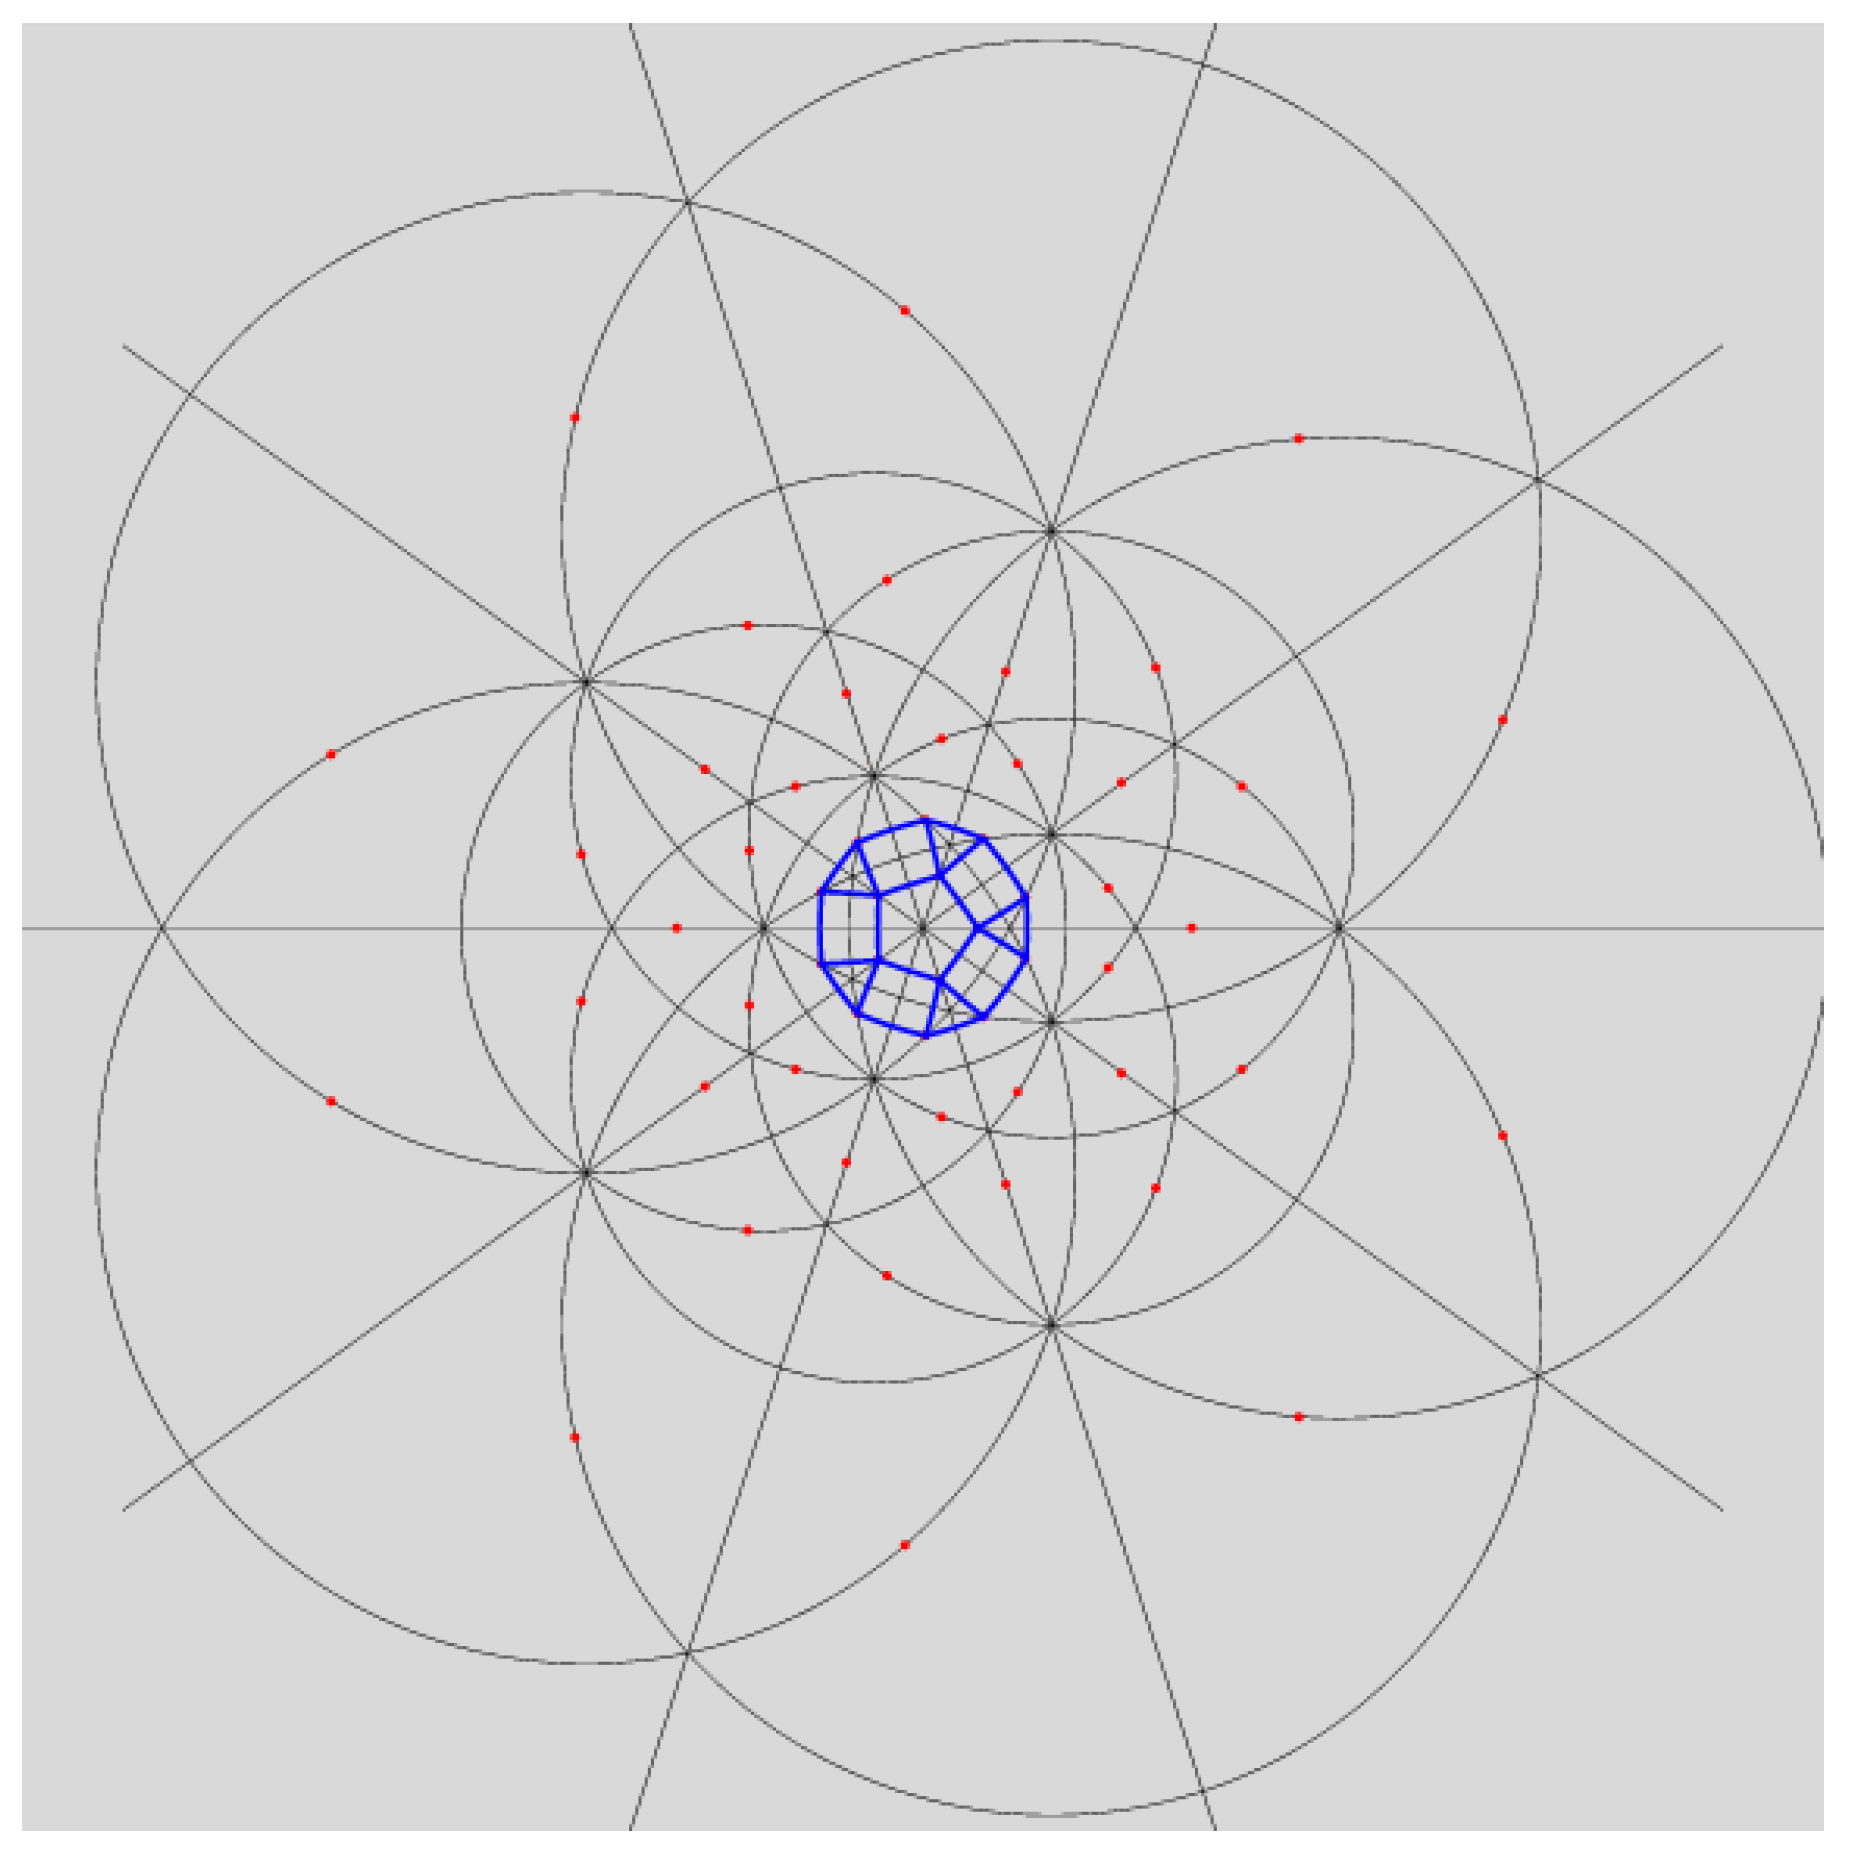
Figure 5. The procedure generates the actual edge as a result of an infinite number of iterative steps.
The first step identifies an ordered set of
vertices
through which
is to pass. Given an adjacent pair of triangular vertices
, there’s a unique element
such that either
Similarly, if
is an adjacent pair of pentagonal vertices, a unique
satisfies either
Connect by the appropriate “pushed” proto-edge , where is either or . Every in is now spanned by great circle arcs.
In order to approximate a triangular edge
T, the technique gives pushed edges
where
is the analogue of
and
is either
or
. Comparing the pushed paths
and
to the respective images
and
reveals their homotopic equivalence, as
Figure 5 illustrates in the plane.
There’s a degree of freedom in choosing the endpoints of the
and
. Here, we select endpoints so that a map’s geometric description respects “
P-caps”—a pentagonal face with its surrounding five triangles and five quadrilaterals.
Figure 6 shows a schematic
P-cap in a planar
structure.
In step two, we use suitable branches of to pull back the pushed segments to a first generation edge between . In practice, this is accomplished as follows:
Select equally-spaced points along each .
Compute the elements in for .
Extract from the inverse image points that minimize the sum of the distances to and .
Taylor expand f about for .
Obtain the desired single-valued branch
of
by inverting the Taylor series for
f at
. The choice of branch yields
Compute the “pulled” segmented paths that span
:
Notice that, in a pulled segment, different branches of the inverse map are applied to the same parametrized segment . We arrive at the appropriate pulled segment by selecting a subinterval of the parameter interval. In the triangular case, we get first-generation pulled edges .
Step three begins an iteration of the process by moving the pulled segments to the pushed locations:
and
where
and
are either
or
. Observe that the subscript of
P,
Q,
T, and
U is the generation number. The group elements
and
act on each component of the respective
or
. For example,
Applying the push transformations
to the centers of Taylor expansion
produces a fresh set of points
on the pushed segments
. Inverse images of the
then become a new set of Taylor centers
with associated branches
of
.
Next, the fourth step constructs second-generation segments at
and
by pulling back the pushed edges. For a pentagonal edge,
The second-generation approximation of
P is the collection of segments
As before, when the second-generation segments are pushed and then pulled, the group elements distribute over components, whereas the components distribute over the branches of .
Letting the number of iterations of the push–pull algorithm grow without bound, the edge
P emerges:
where
ranges over all permissible sequences. Grouping the push–pull action as
produces a set that spans the endpoints of
. A similar dynamic yields a triangular edge
T.
Evidently, for a selected
, the procedure converges due to the collection
being a normal family ([
2], Theorem 9.2.1). In more geometric terms, under
f, a proto-edge undergoes a net expansion. As exemplified in
Figure 5,
experiences roughly a three-fold stretch and
expands approximately by a factor of five. The expanding behavior occurs on the complement of a neighborhood of the superattracting periodic points. When pulled back, the pieces of the pushed proto-edges that are bounded away from the critical points undergo a net contraction reciprocal to the expansion under forward iteration. In each push–pull cycle, this contraction occurs away from points in the pre-critical set
, while the push transformation is a spherical isometry. The iterative effect of this contraction is clustering among the pulled-back points.
With P and T in hand, the icosahedral action produces a system of edges for a dynamical polyhedron: Graphical constructions of second-generation approximations for the 31-maps appear in the following section. This construction satisfies a key property of a dynamical polyhedron.
Proposition 2. The system of edges is forward invariant under f.
Proof. The push–pull construction of
P iterates the map
where, for ease of description, indices are suppressed. That is,
(Since the
maps are local inverses of
f, the limit set
A is only contained in
P.) Applying
f gives
Since
Of course, a similar result holds for a triangular edge
T. □
Worth noting here is that we can view a dynamical polyhedron as a graph on the sphere or plane that covers itself under its associated map. As such, the
geometry of a graph determined by a 31-map would appear to be non-hyperbolic [
10].
7.2. Combinatorial Classification
Here, we’ll treat the behavior of the 56 maps that result from solving the parameter equations
,
, and
. For a map
f, the computational graphics displayed in
Section 8 solves a combinatorial problem: Given a face
A of
f’s polyhedron, what collection of faces does
cover?
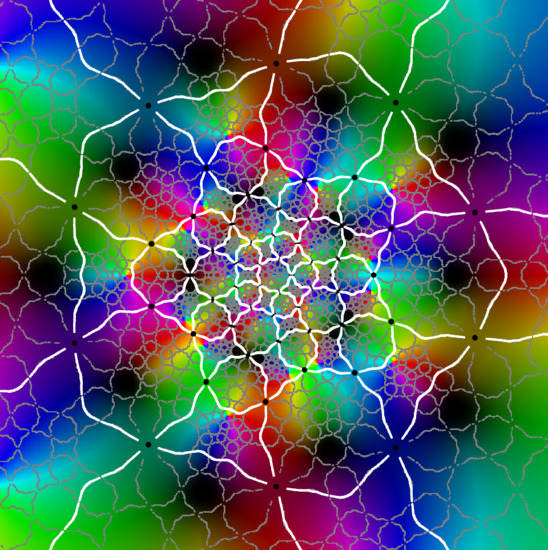
Referring to the graphical results, the second-generation system of edges appears in white. (Note the change in usage: here, refers to an approximation of the actual system of edges.) Gaps around the critical points are due to the large expansion under the pullback. Given a point on an edge, we pull back to by solving . In the plot on the left side, the gray curves correspond to the inverse image . The pulled-back edges reveal the beginnings of a fractal structure: within each face A, there is a collection of “pre-faces” that indicates what face-types covers. Note that is close to being a subset of —visual evidence that is approximately f-invariant.
Using a map-coloring procedure, we can discern which faces
covers. Given a map
on
, define color functions for hue and luminosity
where
is a branch of the argument taken modulo
. Each function takes on values in
with hue varying from blue to green and luminosity from bright to dark.
The plots on the right show
overlaid on a reference coloring for the identity map
I. On the left, we see the pulled-back faces on top of the coloring for a 31-map
f. By matching the color properties of a pre-face on the left with those of a face on the right, we can determine which face turns out to be its image. That is,
when
For instance, the point at infinity is the center of a pentagonal face . As a consequence, is large and dark pentagonal pre-faces cover .
The maps are classified according to their combinatorial and topological descriptions. Pullback structures within a class are topologically equivalent.
By way of illustrating the combinatorics and topology, we consider the map g introduced previously. Its critical set realizes an achiral configuration whereby the critical points lie on the mirrors of reflective icosahedral symmetry. As is the case for all of the 31-maps, the centers of a pentagon and triangle are fixed by g while a quadrilateral’s center is sent to its antipode.
The geometric behavior of g differs from that of the two soccer ball maps—which are not included here since their dynamical polyhedra do not have structure and they have been considered elsewhere. A face does not map to the complement of an antipodal face, as that would require the degree to be 61. Computational graphics (plots at the top of Class I) reveal that g wraps a face onto a union of P-caps that is icosahedrally associated with the face. The image of a pentagonal face P covers the cap to which it belongs as well as the five caps that intersect P’s cap. For a triangular face T, covers the three caps whose intersection includes T. Finally, the image of a quadrilateral Q covers the complement of four P-caps two of which intersect Q while the other two caps intersect the former two caps.
Using its geometric description, we can work out
g’s topological degree by counting inverse images. The relevant data are recorded in
Table 1 as the number of faces of each type that belong to the
g-image of a given face-type. For instance, the first row reports that a pentagon maps to six caps the union of which contains six pentagons, fifteen triangles, and twenty quadrilaterals.
The number of times a pentagonal face is covered equals the total number of pentagons that appear as images of faces divided by the number of pentagonal faces. Reading down the
P column,
Similar treatment of triangular and quadrilateral faces yields the number of faces in the inverse image of the respective face:
The gallery of plots places the maps into combinatorial classes, with three exceptions. Each class has a complementary class for which the topological description replaces “n P-caps about X” by “complement of n P-caps about ” and “complement of n P-caps about X” by “n P-caps about ” where is the antipode of X. Of course, a chiral map f and its heterochiral partner (not shown) belong to the same class.


