1. Introduction
Due to the increasing demand for computer networks and network technologies, the attack incidents are growing day by day, making the intrusion detection system (IDS) an essential tool to use for keeping the networks secure. It has been proven to be effective against many different attacks, such as the denial of service (DoS), structured query language (SQL) injection, and brute-force [
1,
2,
3]. Two approaches are to be considered when developing an IDS [
4]: misuse-based and anomaly-based. In the misuse-based approach, the IDS attempts to match the patterns of already known network attacks. Its database gets updated continuously by storing the patterns of known network attacks. The anomaly-based IDS, on the other hand, attempts to detect unknown network attacks by comparing them to the regular connection patterns. The anomaly-based IDSs are considered to be adaptive, and they are susceptible to generate a high number of false positives [
4,
5].
For developing an efficient IDS model, a large amount of data is required for training and testing. The quality of the data is very critical and influential, primarily on the results of the IDS model [
6]. The low-quality and irrelevant information found in data can be eliminated after gathering the statistical properties from its observable attributes and elements [
7]. However, the data could be insufficient, incomplete, imbalanced, high-dimensional, or abundant [
6]. Therefore, providing an in-depth analysis of the available datasets is crucial for IDS research.
The KDD99 [
8] and UNSW-NB15 [
9,
10] datasets are two well-known available IDS datasets. Many studies have used these datasets in their works [
11,
12,
13,
14,
15,
16,
17,
18,
19,
20,
21]. Reference [
11] introduced a new hybrid method for classification based on two algorithms, namely artificial fish swarm (AFS) and artificial bee colony (ABC). The hybrid method was tested by using the UNSW-NB15 and NSL-KDD datasets. Reference [
12] proposed a wrapper approach that uses different decision-tree classifiers and was tested by using the KDD99 and UNSW-NB15 datasets. Reference [
13] presented a hybrid C4.5 and modified K-means and evaluated it, using the KDD99. References [
14,
15] used the KDD99 to evaluate a hybrid classification method based on an extreme learning machine (ELM) and support vector machine (SVM). Reference [
16] introduced a hybrid classification method that utilized the K-means and information gain ratio (IGR) and evaluated the method, using the KDD99 dataset. Reference [
17] introduced a methodology of combining datasets (called MapReduce). In their work, they used the KDD99 and DARPA datasets to test the introduced combination method. Then, they analyzed the combined and cleaned dataset, using K2 and NaïveBayes techniques. Reference [
18] used the UNSW-NB15 dataset to evaluate an SVM with a new scaling approach. Reference [
19] gave a comprehensive study on applying the local clustering approach to solve the IDS problem. For evaluation, the KDD99 dataset was utilized. Reference [
20] employed a multi-layer SVM and tested it by using the KDD99 dataset. Different samples were selected from the dataset, which was used to evaluate the performance of their proposed method. Reference [
21] proposed a novel discrete metaheuristic algorithm, a discrete cuttlefish algorithm (D-CFA), to solve the feature selection problem. The D-CFA was tested, to reduce the features in the KDD99 dataset. The algorithm was introduced based on the color reflection and visibility mechanism of the cuttlefish. Few more variants of the algorithm were proposed in the literature [
22,
23]. However, the selected features by the D-CFA in Reference [
21] were evaluated by a decision tree (DT) classifier. The study found that the classifier achieved a 91% detection rate and a 3.9% false-positive rate with only five selected features.
Furthermore, only a few studies have tried to analyze the KDD99 and UNSW-NB15 datasets [
7,
24,
25,
26,
27,
28,
29,
30]. Reference [
24] used a clustering method and an integrated rule-based IDS to analyze the UNSW-NB15 dataset. Reference [
25] analyzed the relation between the attacks in the UNSW-NB15 and their transport layer protocols (transmission control protocol and user datagram protocol). Reference [
26] gave a case study on the KDD99 dataset. The study stated a lack of works in the IDS research that analyzes the currently available datasets. In Reference [
27], the characteristics of the features in the KDD99 and UNSW-NB15 datasets were investigated for effectiveness measurement. An association rule mining algorithm and a few other existing classifiers were used for their experiments. The study claimed that UNSW-NB15 offers more efficient features than the KDD99 in detection accuracy and the number of false alarms. Reference [
28] analyzed the KDD99 and proposed a new dataset, called NSL-KDD, an improved version of the KDD99. Reference [
7] also gave an analysis of the KDD99. Besides, they analyzed other variants, namely the NSL-KDD and GureKDDcup datasets. The analysis in Reference [
7] was aimed to improve the datasets by reducing the dimensions, completing missing values, and removing any redundant instances. The study found that KDD99 contains a high number of redundant instances. Reference [
29] used a rough-set theory (RST) to measure the relationship between the features and each class in the KDD99. In the study, a few features were classified as not relevant for any of the dataset’s classes. Reference [
30] gave an analysis of the feature relevance of the KDD99, using an information gain. The study concluded that a few features in the dataset do not contribute to the attack detection. It also concluded that the testing set of the dataset offers different characteristics than its training set.
Recently, Reference [
31] surveyed the available datasets in the IDS research and gave a comprehensive overview of the properties of each dataset. The first property discussed in the study was general information, such as the year and type of classes. The second property was the data nature, covering the formatting and information about metadata, if existing in the dataset. The third property was the size and duration of the captured packets. The fourth property included the recording environment, which indicated the type of traffic and network’s services used for the dataset generation. Lastly, the evaluation part provided for the researchers, for example, the class balance and the predefined data split. However, Reference [
31] recommended the researchers to produce a dataset that is focused on specific attack types rather than trying to cover all the possible attacks. If the dataset satisfies a specific application, then it is considered sufficient. In Reference [
31], the comprehensive dataset was described to have correctly labeled classes available for everyone, include real-world network traffic and not synthetic, contain all kinds of attacks, and be always updated. It should also contain packets header information and the data payload, which needs to be captured over a long period. Based on the number of attacks provided in the available datasets, the UNSW-NB15 was one of their general recommendations for IDS testing.
Reference [
32] reviewed a few of the IDS datasets, namely full KDD99, corrected, and ten percent variants of the KDD99, NSL-KDD, UNSW-NB15, center for applied internet data analysis dataset (CAIDA), australian defence force academy linux dataset (ADFA-LD), and university of new mexico dataset (UNM). The study in Reference [
32] gave general information for each of the datasets, with more emphasis on UNSW-NB15. For comparison, the k-nearest neighbors (k-NN) classifier was implemented to report the accuracy, precision, and recall across all the reviewed datasets. The results showed that the classifier performed better when using the NSL-KDD. They claimed that the superior results from using the NSL-KDD were achieved because the dataset contains less redundant records, which are distributed fairly. Reference [
33] analyzed the KDD99, NSL-KDD, and UNSW-NB15 datasets, using a deep neural network (DNN) on the internet of things (IoT). By applying a similar evaluation metric as in Reference [
32] and F1 measure, the results show that DNN was able to achieve an accuracy above 90% for all datasets. Further, DNN had the best performance on UNSW-NB15. Reference [
34] evaluated the features in the NSL-KDD and UNSW-NB15, using four filter-based feature-selection measures, namely correlation measure (CFS), consistency measure (CBF), information gain (IG), and distance measure (ReliefF). The selected features from those four methods were then evaluated by using four classifiers to indicate the training and testing performance, namely k-NN, random forests (RF), support vector machine (SVM), and deep belief network (DBN). The study reported the selected features for each feature selection method, in addition to the classification results, which were aimed to provide help for the researchers in the cybersecurity in designing affective IDS. Reference [
35] analyzed the UNSW-NB15 dataset by finding the relevance of the features, using a neural network. The authors categorized the features into five groups, based on their type, such as flow-based, content-based, time-based, essential, and additional features. From these groups, 31 possible combinations of features were evaluated and discussed. The highest accuracy (93%) in Reference [
35] was obtained by using 39 features from the categorized groups. Moreover, in the study, there was a combination of 23 features that were selected by using a meta estimator called SelectFromModel that selects features based on their scores. The 23 selected features resulted in higher accuracy (97%) than those 39 features mentioned above.
Reference [
36] compared the features in the UNSW-NB15 dataset with a few feature vectors that were previously proposed in the literature. They were evaluated by using a supervised machine learning to indicate the computational times and classification performance. The results of the study suggested that the current vectors can be improved by reducing their size and adapting them to deal with encrypted traffic. Reference [
37] proposed a feature-selection method based on the genetic algorithm (GA), grey wolf optimizer (GWO), particle swarm optimization (PSO), and firefly optimization (FFA). The UNSW-NB15 dataset was employed for the tests of the study. The selected features from using the proposed method were evaluated by using SVM and J48 classifiers. The study reported the classification performance of a few combinations of features from the UNSW-NB15 dataset. In Reference [
38], a hierarchical IDS that uses machine-learning and knowledge-based approaches was introduced and tested, using the KDD99 dataset. Reference [
39] proposed an ensemble model based on the J48, RF, and Reptree and evaluated it by using the KDD99 and NSL-KDD datasets. A correlation-based approach was implemented, to reduce the features from the datasets. Reference [
40] examined the reliability of a few machine learning models, such as the RF and gradient-boosting machines in real-world IoT settings. In order to do the examination, data-poisoning attacks were simulated by using a stochastic function to modify the training data of the datasets. The UNSW-NB15 and ToN_IoT datasets were employed for the experiments of the study.
It is essential to address that the KDD99 and UNSW-NB15 datasets do not contain attacks related to the cloud computing, such as the SQL injection. Reference [
41] proposed a countermeasure to detect these attacks, specifically in the cloud environment. The method in Reference [
41] can be applied to the cloud environment, without the need for an application’s source code.
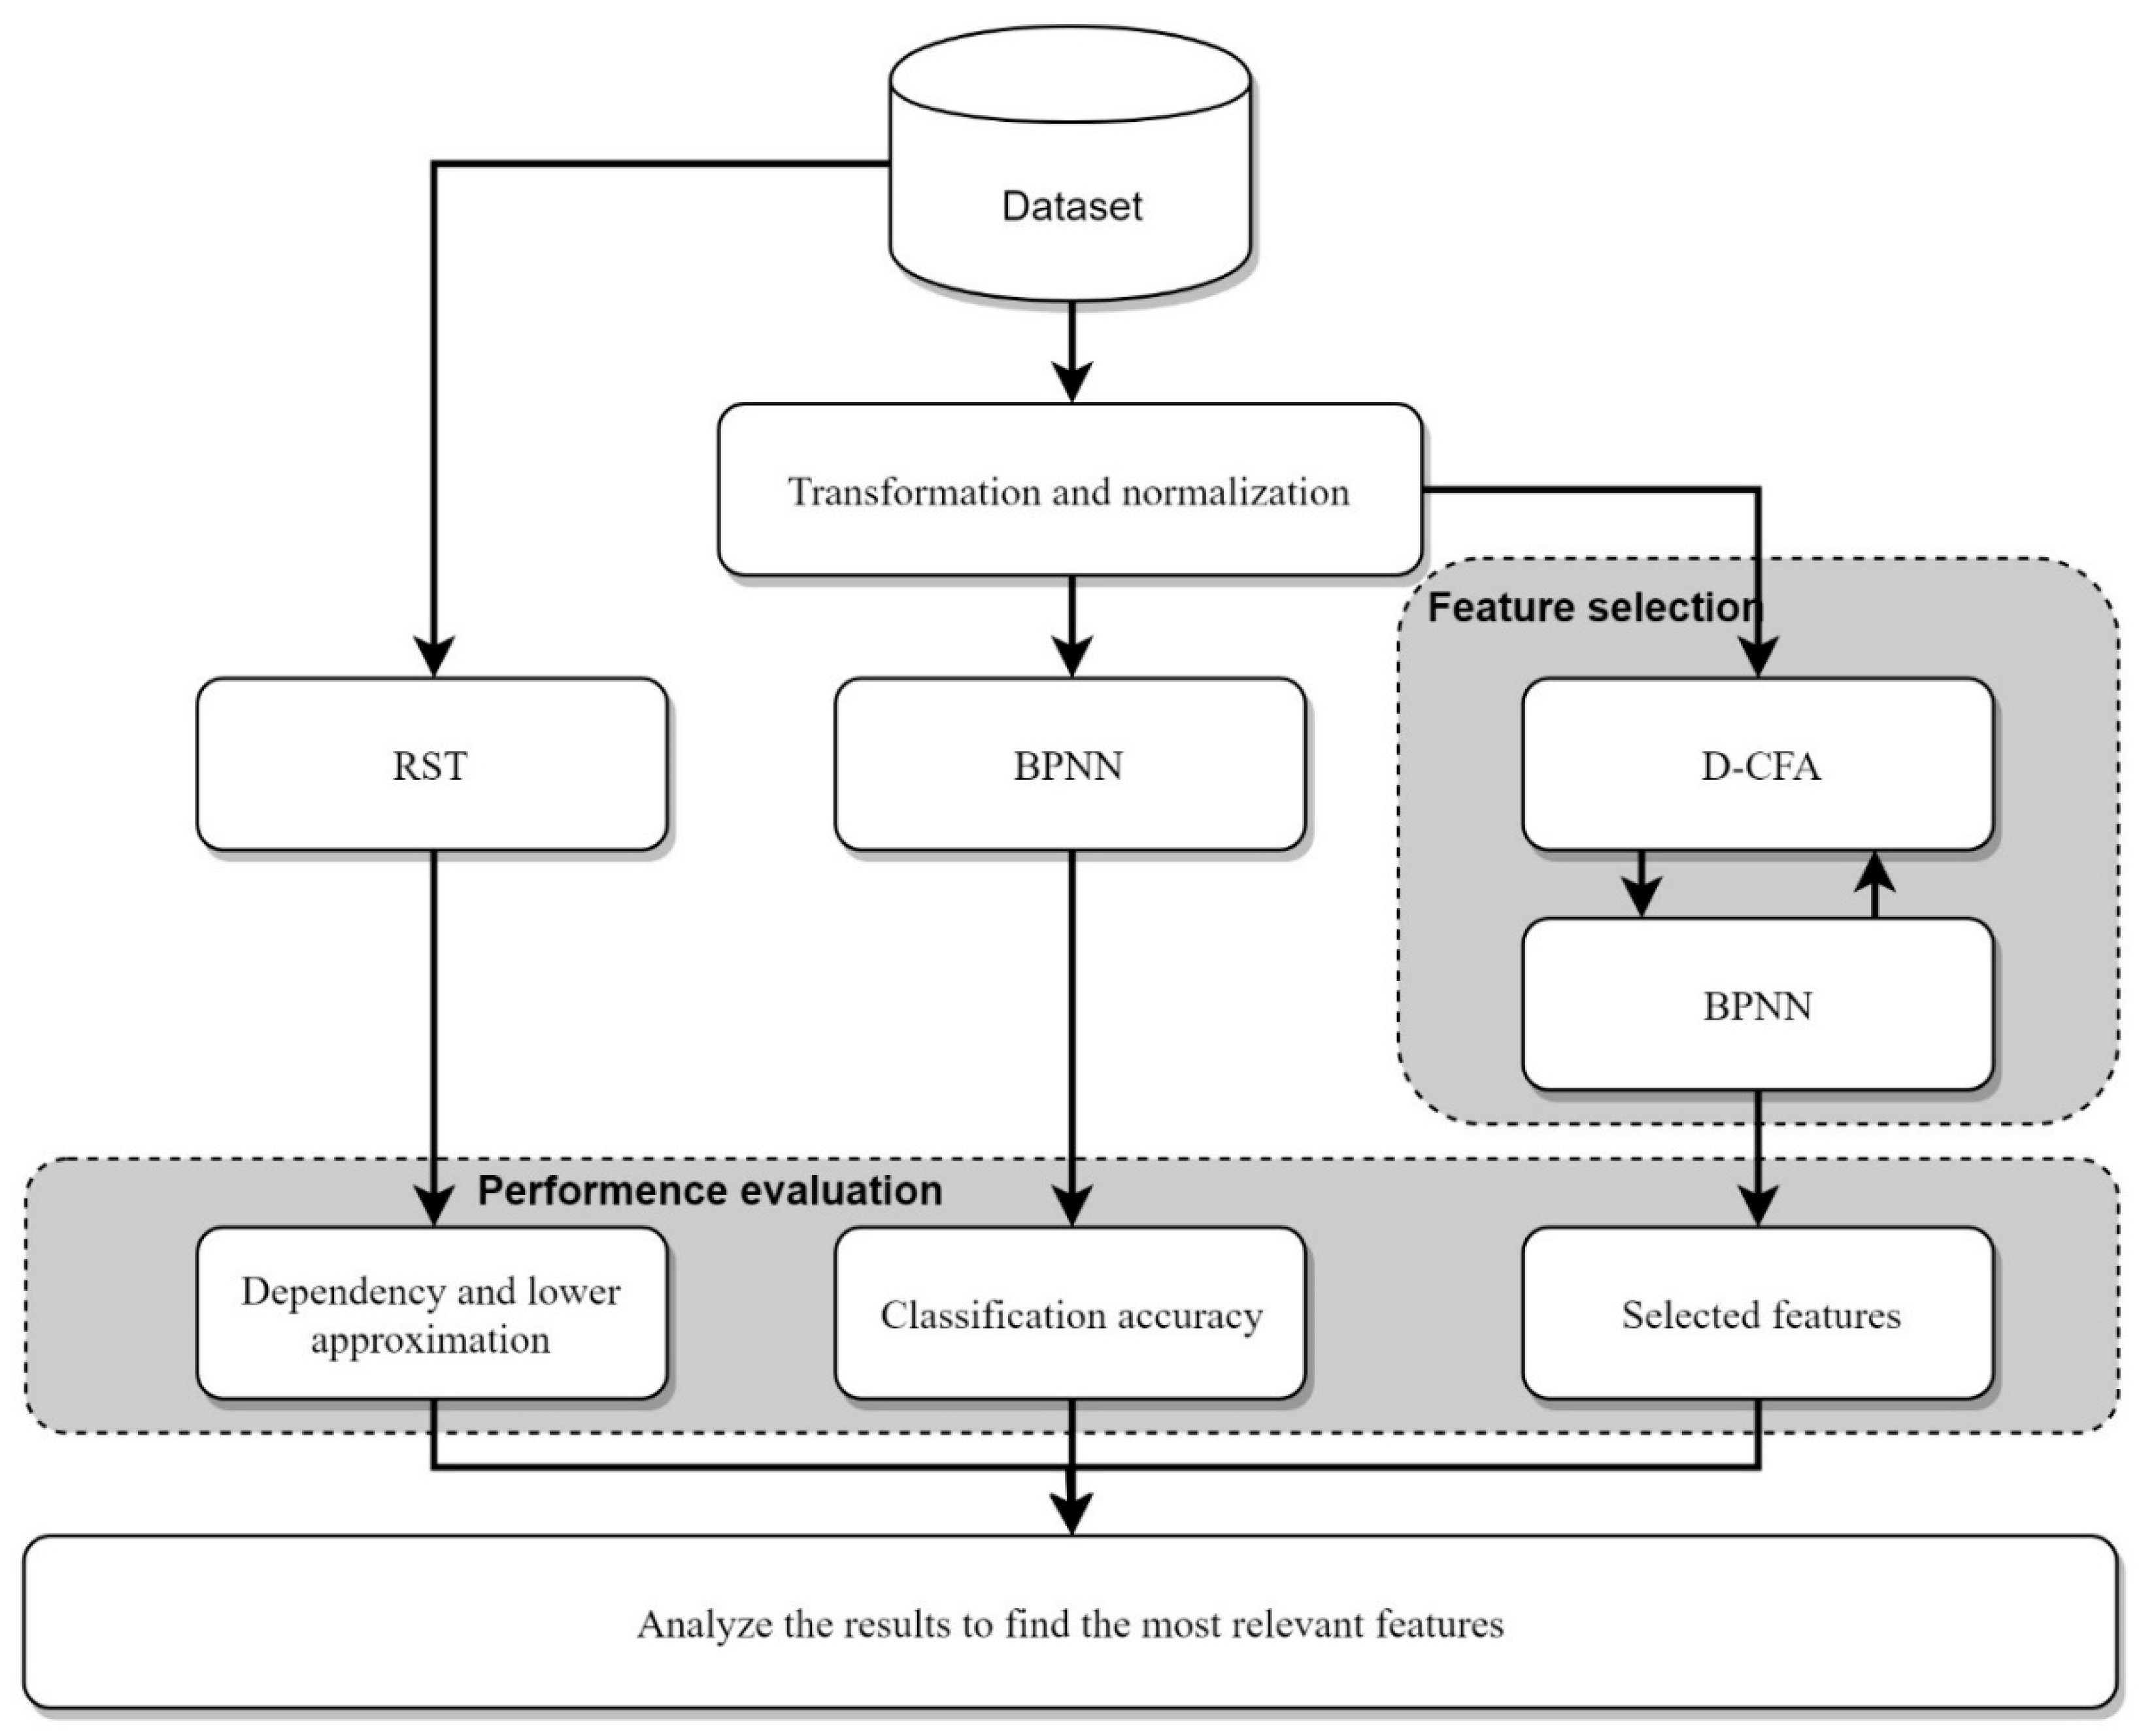
In this study, the features in the KDD99 and UNSW-NB15 datasets were analyzed by using a rough-set theory (RST), a back-propagation neural network (BPNN), and a discrete variant of the cuttlefish algorithm (D-CFA). The analysis provides an in-depth examination of the relevance of each feature to the malicious-attack classes. It also studies the symmetry of the records distribution among the classes. The results of the analysis suggest a few features and combinations that can be used for creating an accurate IDS model. This study also describes and gives the properties of the datasets mentioned above. Despite the availability of other works that have tried to analyze the two datasets, it is important to study the most common datasets in this domain continuously, not only to confirm their relevance but also to expand the findings on these datasets. However, the main contributions of this paper can be listed as follows:
Give a detailed description of the KDD99 and UNSW-NB15 datasets.
Point out the similarities between the two datasets.
Indicate if the KDD99 is still relevant for the IDS domain.
List the relevant features for increasing the classification performance.
Provide the statistical and properties of each feature concerning the classes.
Indicate the effect of the features in both datasets on the behavior of the neural networks.
This paper includes five sections. The description and properties of the KDD99 and UNSW-NB15 datasets are provided in
Section 2.
Section 3 explains the methodology and experimental setup. The results and discussions are given in
Section 4. Conclusion and future work are provided in
Section 5.
2. Datasets’ Description and Properties
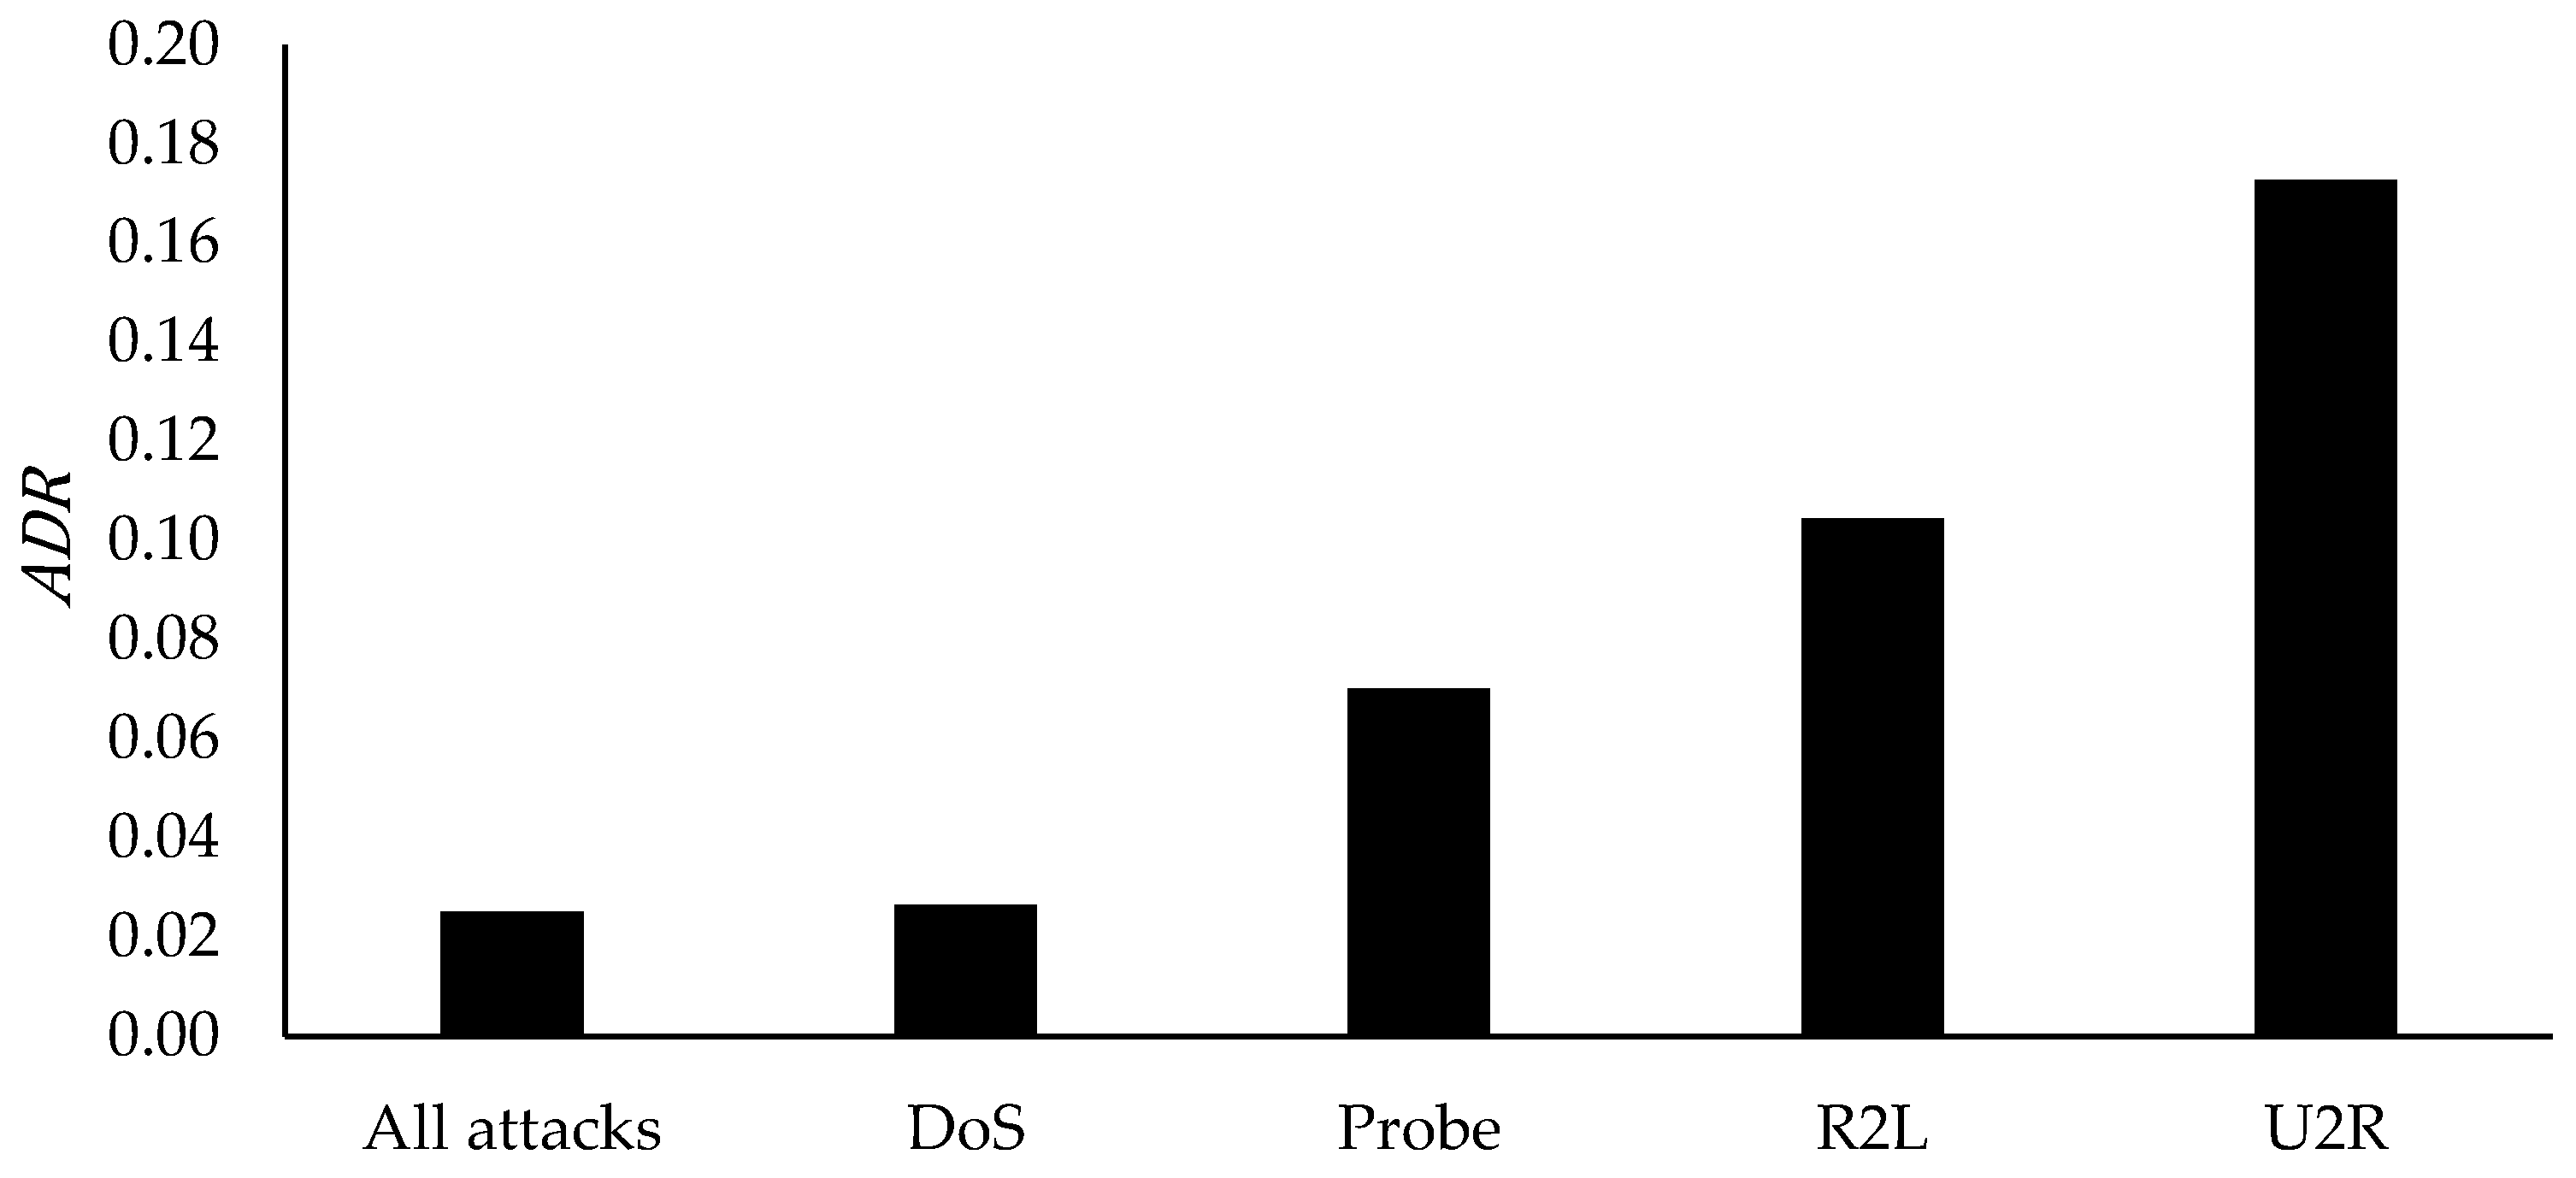
The KDD99 is very common between researchers in the IDS research. A survey by Reference [
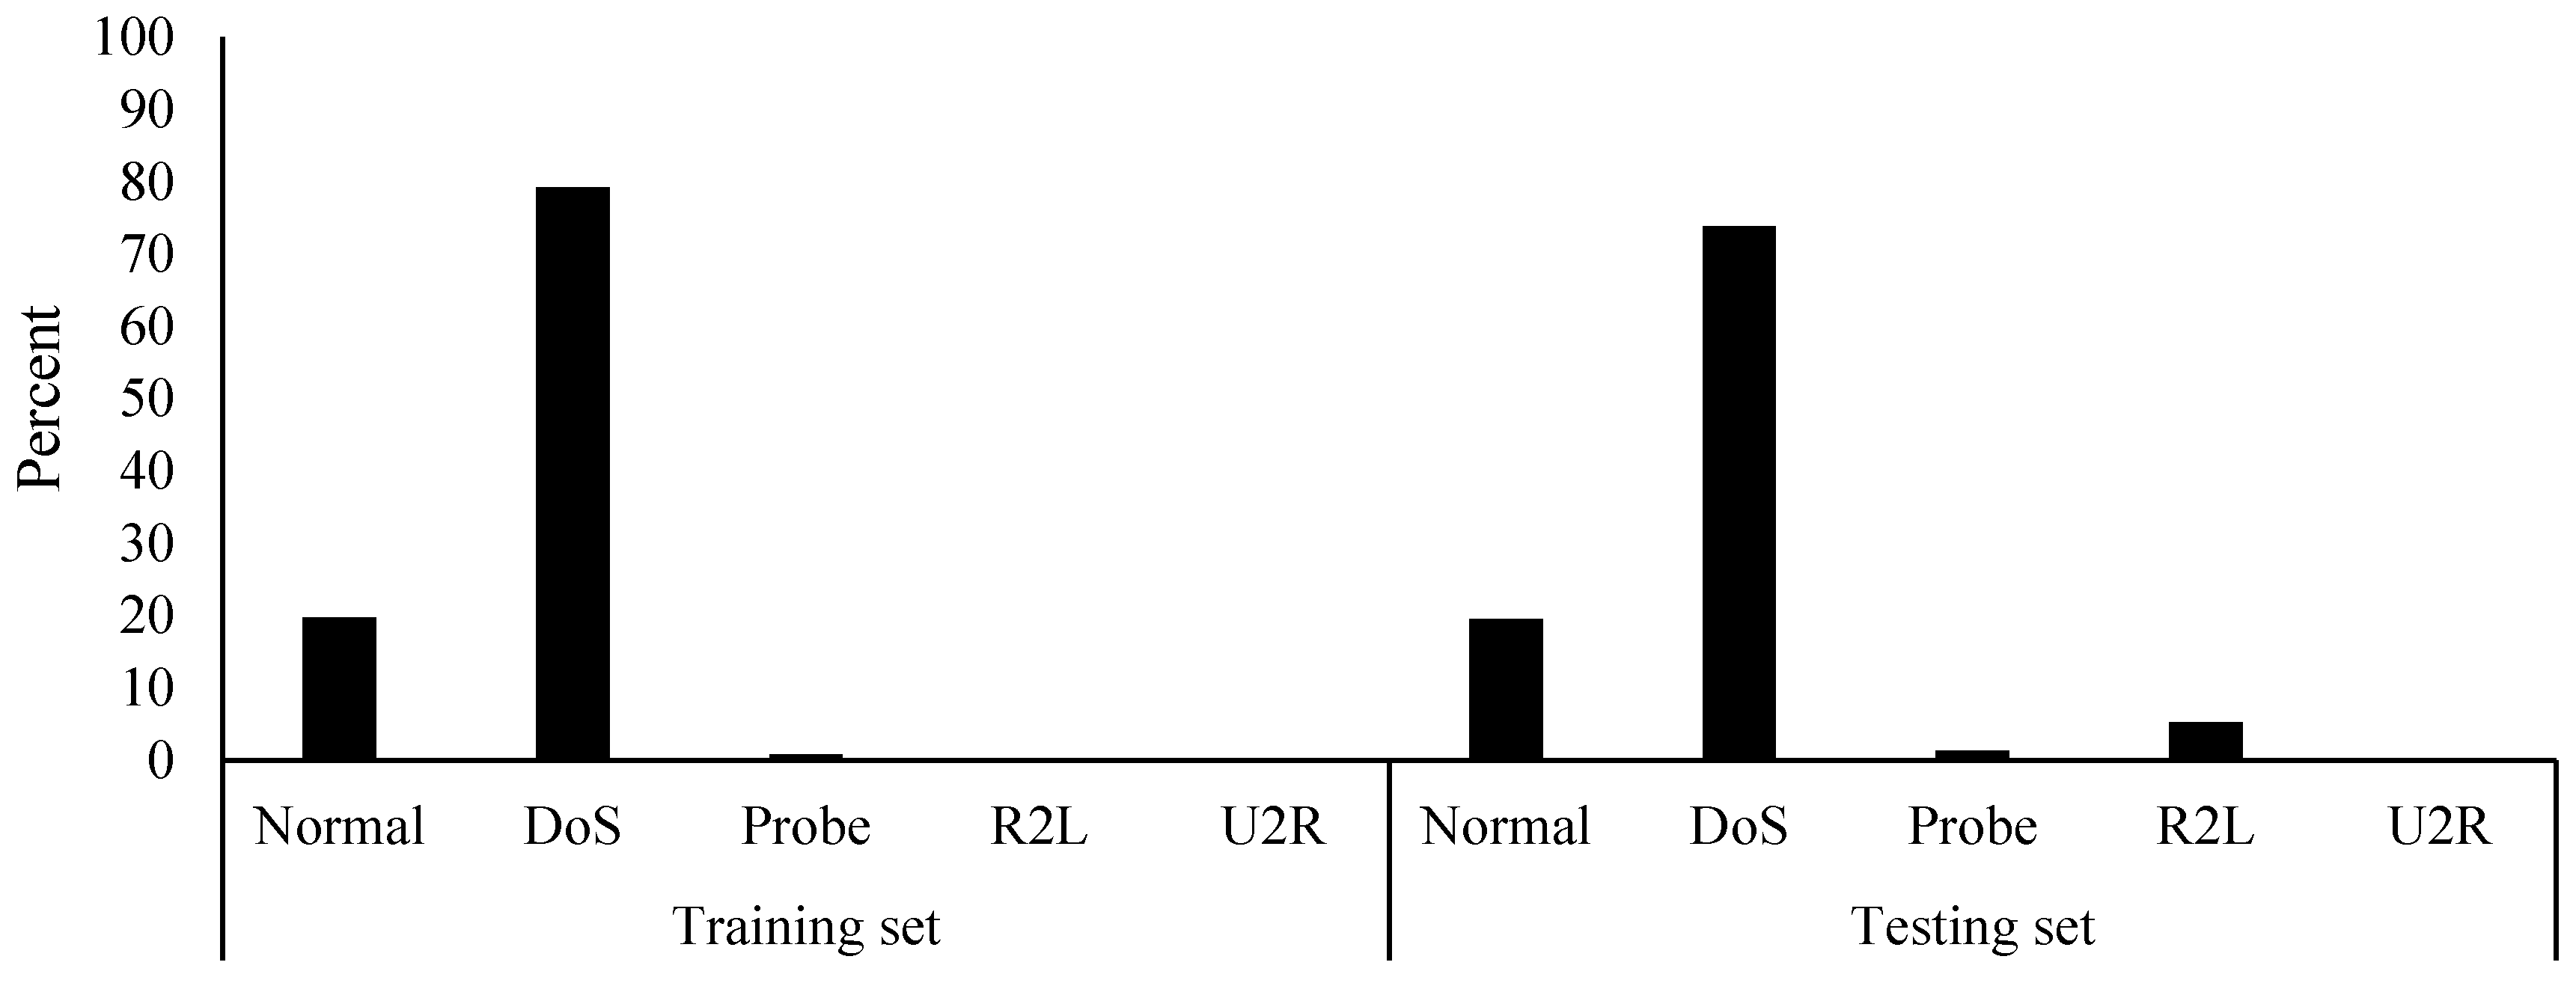
42] found that 142 studies have used the KDD99 dataset form year 2010 until 2015. The dataset is available with 41 features (excluding the labels) and five classes, namely Normal, DoS), Probe, remote-to-local (R2L), and user-to-root (U2R). The KDD99 (ten percent variant) contains 494,021 and 311,029 records in the training and testing sets. The classes in the training and testing sets of the KDD99 are imbalanced, as shown in
Figure 1. The DoS class has the highest number of records, while the Normal class comes in second. Moreover, the testing set contains a higher amount of records that are classified as R2L. This distribution of records was found to contain a large amount of duplicated records. The number of records of each class with their amount of duplications is provided in
Table 1.
A graphical representation of the amount of records duplications for each class is given in
Figure 2. The highest amount of duplications in the training set belongs to DoS and Probe classes, whereas the highest amount of duplications in the testing set belongs to DoS and R2L. The Probe class in the testing set also contains a fair amount of duplications. It is essential to address that the U2R class contains no duplications in the training set. However, the full training and testing sets of the KDD99 dataset contain duplicated records of 348,437 (70.53%) and 233,813 (75.17%), respectively. Five percent more duplications were present in the testing set.
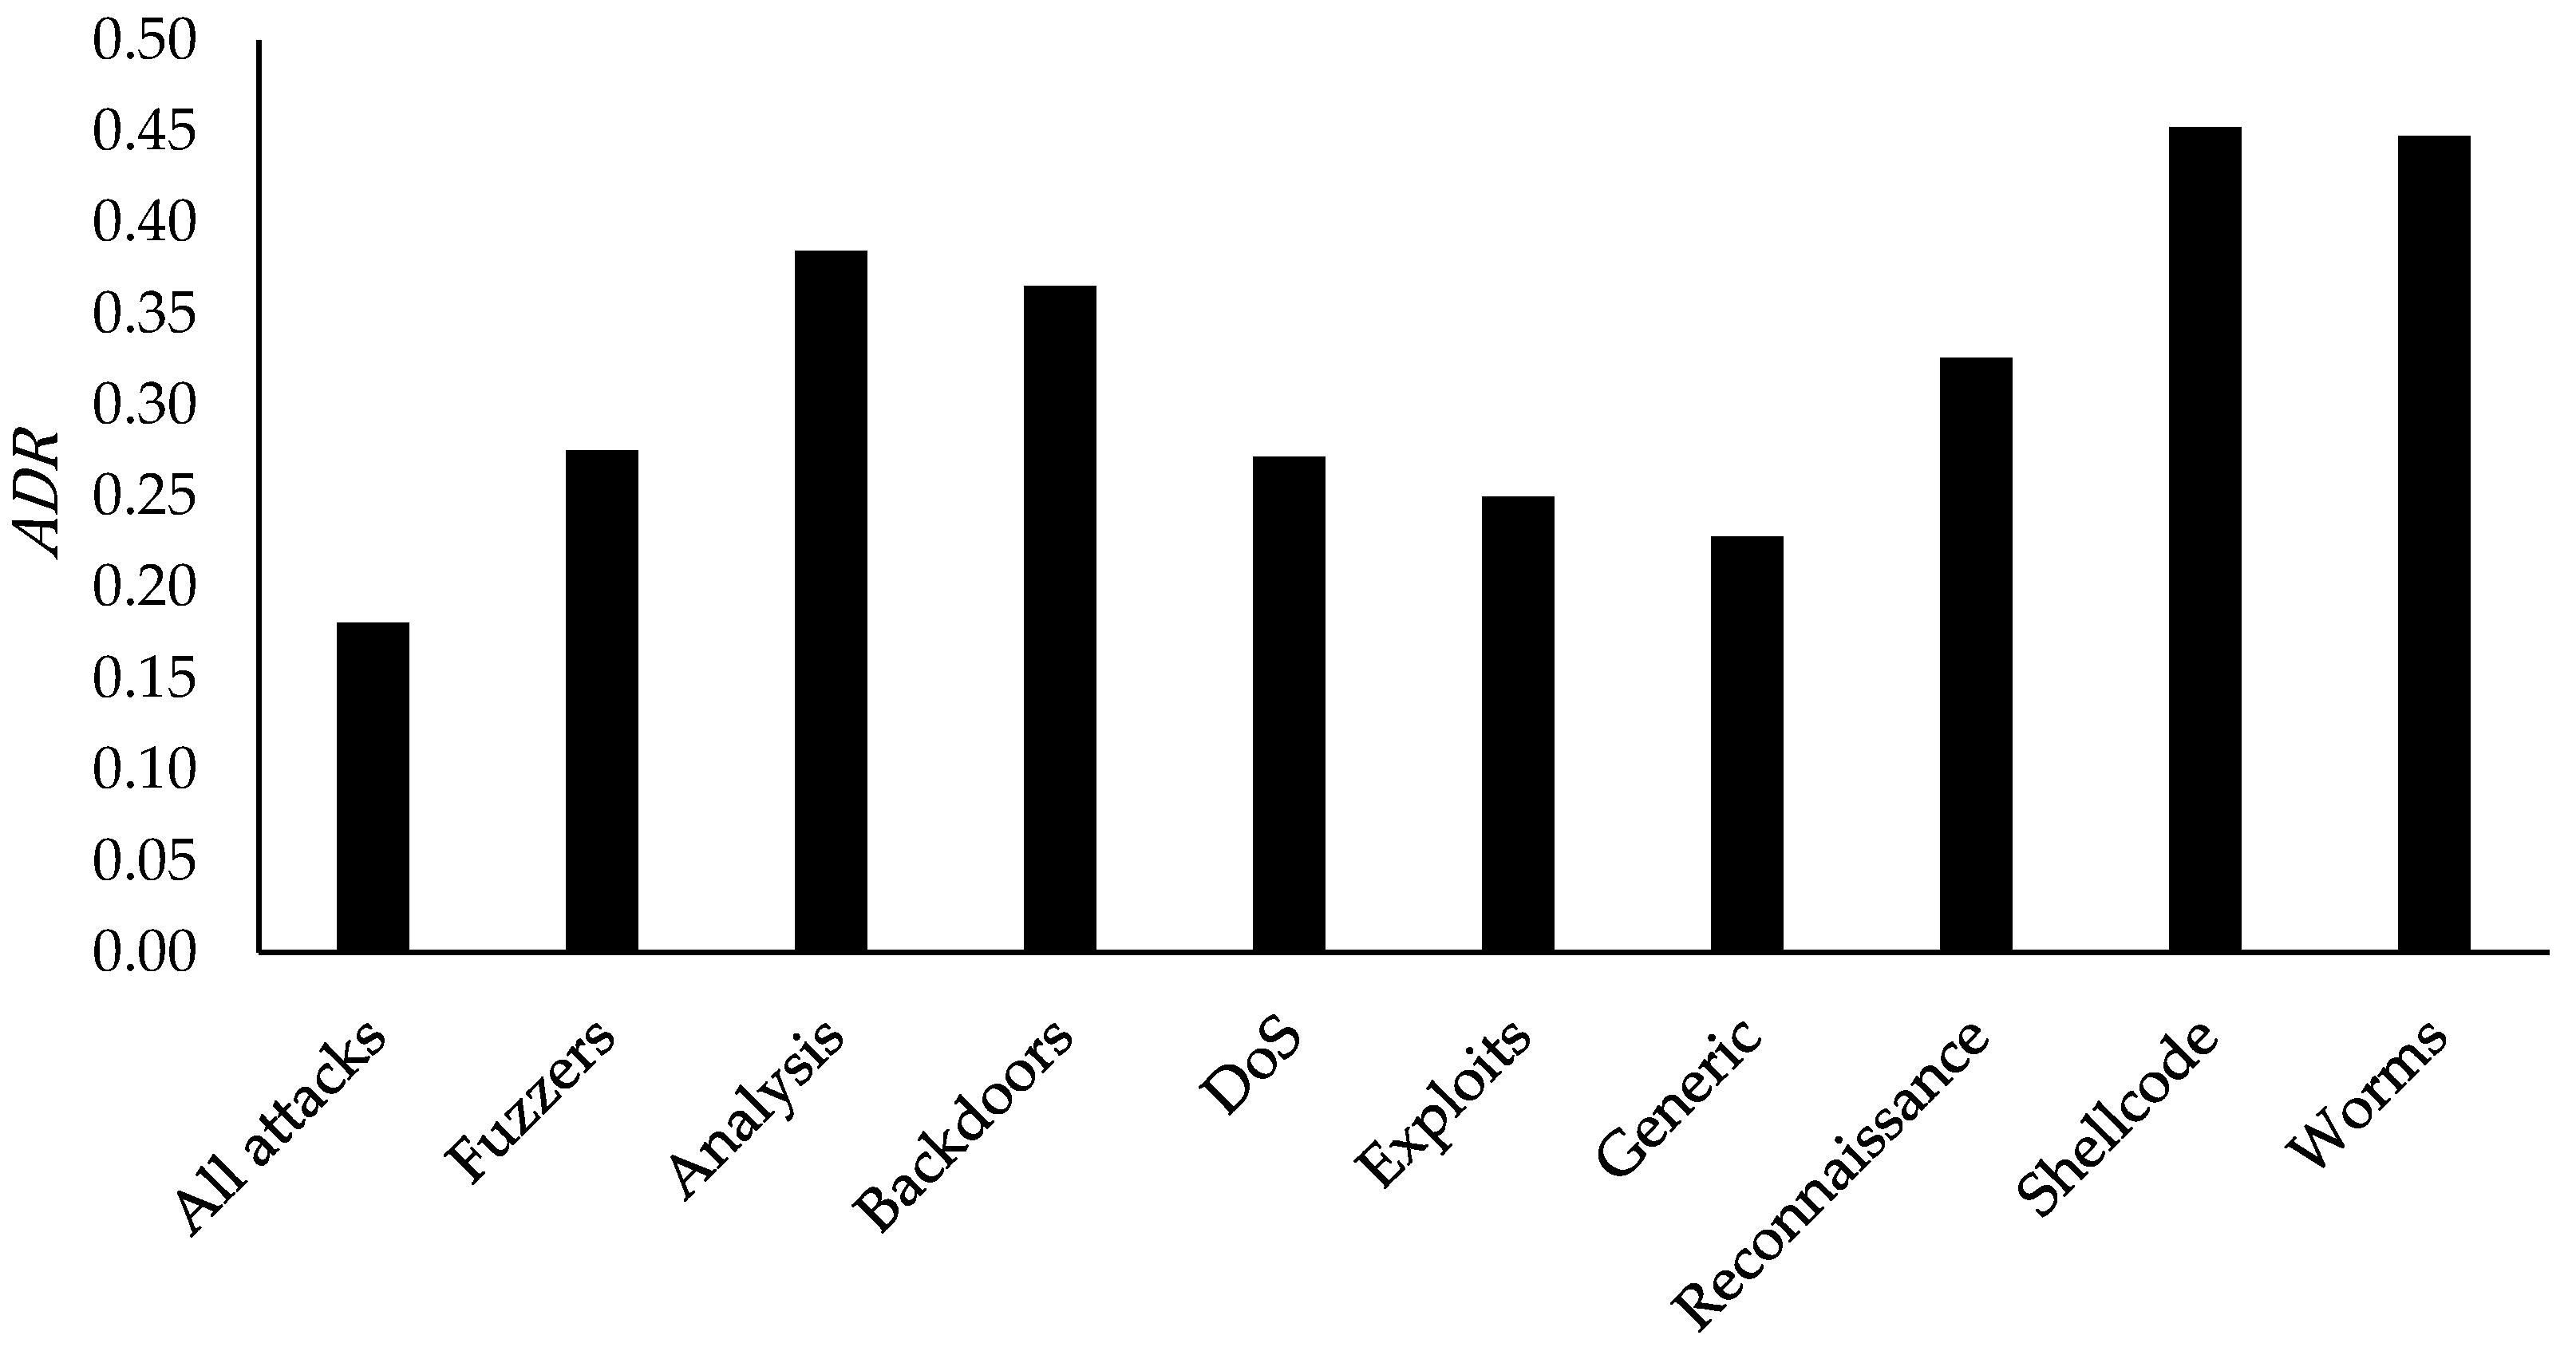
The available UNSW-NB15 dataset contains 42 features (excluding the labels) and ten classes, namely Normal, Fuzzers, Analysis, Backdoors, DoS, Exploits, Generic, Reconnaissance, Shellcode, and Worms. Its training set includes 175,341 records, while the testing set has 82,332 records. The classes in the training and testing sets of the UNSW-NB15 are also imbalanced, as illustrated in
Figure 3. Normal class in both sets contains the highest amount of records. In contrast, Generic and Exploits come in second. Fuzzers class includes a fair amount of records, as well, but the rest of the classes show a low amount of records compared to the mentioned classes. However, it was found that the training set of the UNSW-NB15 contains a high number of duplicated records, whereas the testing set does not contain any. Based on the details given in
Table 2, the full training set shows that it contains 42.24% duplicated records.
Figure 4 illustrates the duplications for each class in the training set. These duplications are found mainly in the Generic, DoS, and Exploits classes. Reconnaissance class also contains a fair amount of duplications.
The class distribution difference between the two datasets is shown in
Figure 5. The KDD99 has a higher amount of records that represent a malicious attack class. Both training and testing sets of the KDD99 have an almost identical percentage of attack and normal records. As for the UNSW-NB15, the records distributions between the attack and normal classes are more balanced than those in the KDD99. Moreover, the percentage of the attacks and normal classes across both sets are slightly different.
The names of the features in each dataset are given in
Table 3. The features in the KDD99 dataset are categorized into four groups. They are given in
Table 4. The first group (basic) contains nine features that include necessary information, such as the protocol, service, and duration. The second group (content) represents thirteen features, containing information about the content, such as the login activities. The third group (time) provides nine time-based features, such as the number of connections that are related to the same host within two seconds period. The fourth (host) contains ten host-based features, which provide information about the connection to the host, such as the rate of connections that have the same destination port number trying to be accessed by different hosts.
As for the features in the UNSW-NB15 dataset, they are categorized into five groups and provided in
Table 5. The first group (flow) includes the protocol feature, which identifies the protocols between the hosts, such as a TCP or UDP. The second group (basic) represents the necessary connection information, such as the duration and number of packets between the hosts. Fourteen features are categorized in this group. The third group (content) provides content information from the TCP, such as the window advertisement values and base sequence numbers. It also provides some information about the HTTP connections, such as the data size transferred using the HTTP service. Eight features are present in this group. The fourth group (time) includes eight features that use time, such as the jitter and arrival time of the packets. The fifth group (additional) includes eleven additional features, such as if a login was successfully made. Moreover, the fifth group includes a few features that calculate the number of rows that use a specific service from a flow of 100 records based on a sequential order. It is important to address that a few described features in Reference [
9], namely srcip, sport, dstip, dsport, stime, and ltime, were not present in the actual dataset; therefore, they were not included in this study. Moreover,
f2-9 was present in the dataset but was not described or categorized in Reference [
9]; therefore, it was categorized in the basic group.
A few features were found to be in common between the two datasets. KDD99′s features
f1-1,
f1-2,
f1-3,
f1-5, and
f1-6 are in common with UNSW-NB15′s features
f2-1,
f2-2,
f2-3,
f2-7, and
f2-8.
f1-1 and
f2-1 describe the connection duration;
f1-2 and
f2-2 give the protocol type, such as transmission control protocol (TCP) or user datagram protocol (UDP);
f1-3 and
f2-3 state the service used at the destination, such as file transfer protocol (FTP) or domain name system (DNS); and
f1-5,
f2-7,
f1-6, and
f2-8 give the number of transmitted data bytes between the source and destination. There are some other features in between the two datasets that share similar characteristics. As described in
Table 6, both datasets contain features that use connection flags. Connection flags provide additional information, such as synchronization (SYN) and acknowledgment (ACK). There were ten features in the KDD99 that use flags, whereas, in the UNSW-NB15, there were only four features. In
Table 6, it can also be seen that the number of features that involve connection count is higher in the KDD99 than UNSW-NB15. Further, the UNSW-NB15 was found to contain more features that are time-based and size-based.

 ,
, 
