Article

Improving Room Carrying Capacity within Built Environments in the Context of COVID-19

1
Department of Civil Engineering, University of Alicante, Ctra. San Vicente del Raspeig s/n, San Vicente del Raspeig, 03690 Alicante, Spain
2
AIRLAB, Singapore University of Technology and Design, 8 Somapah Road, Singapore 487372, Singapore
*
Author to whom correspondence should be addressed.
Symmetry 2020, 12(10), 1683; https://doi.org/10.3390/sym12101683
Submission received: 4 September 2020 / Revised: 7 October 2020 / Accepted: 11 October 2020 / Published: 14 October 2020
(This article belongs to the Special Issue Symmetry in Engineering Sciences Ⅲ)

Abstract

:
The COVID-19 pandemic that has struck the world since March 2019 has established an unusual modus operandi for all of us. During this transient situation, some of the activities have been severely altered, especially those which are performed in indoor spaces such as classrooms, restaurants, or libraries. As physical distance is mandatory in most countries, the capacity of these places has been severely reduced, causing unsustainable economic and logistical issues. This work aims to analyze the possible ways of distributing seats in symmetrical spaces for different uses and room sizes. For that purpose, the classical seat arrangement in rows and columns is compared with an equilateral triangle-based seat pattern, which is proposed as a better solution in most cases. Results show that a greater number of seats is achieved in most situations using the proposed patterns, with mean increases of 13% and peaks from 25% to 50% in some specific circumstances. A discussion about an optimized layout, shape and size of the furniture used in multiple seat tables is included. The outcome shall generate a positive impact on schools, colleges, restaurants, libraries, and similar built environments where seating capacity is crucial.

Graphical Abstract

1. Introduction

The COVID-19 outbreak declared in Wuhan (China) in late 2019 has brought major changes to personal and social behavior worldwide. This pandemic’s effects have been different in each country, depending on the date that the pandemic arrived in, and the strategy followed by them. Up to 25 August 2020, the pandemic has affected 213 countries and territories around the world and two international conveyances (Figure 1). The number of reported cases worldwide exceeds 23,000,000—more than 6,000,000 currently active—the death toll is beyond 800,000 [1,2].
SARS-CoV-2 coronavirus has demonstrated to have a high infection capacity in comparison with other infectious diseases. Several studies determine a basic reproduction number (R0) between 1.4 and 6.5, with mean values around 3.5 [4,5,6,7]. This number indicates the transmissibility of a virus, representing the average number of new infections generated by an infectious person. If this value is equal or greater than 1.0, the disease will continue to spread over time following a geometric progression with a common ratio R0. When R0 values keep under 1.0, the disease is contained, and the number of cases decrease progressively until no new infections are produced.
According to the World Health Organization (WHO), disease transmission can be classified into three different groups:
  • Sporadic cases: with one or more cases, imported or locally detected;
  • Clusters of cases: experiencing cases, clustered in time, geographic location and/or by common exposures;
  • Community transmission: experiencing larger outbreaks of local transmission defined through an assessment of factors including, but not limited to large numbers of cases not linkable to transmission chains, large numbers of cases from sentinel laboratory surveillance, and/or multiple unrelated clusters in several areas of the country/territory/area.
Figure 2 shows the predominant COVID-19 transmission type in each country. As can easily be seen, most countries currently have community transmission or clusters of cases, sporadic cases being relatively uncommon. Both kinds of transmission are more suitable to be developed into crowded indoor spaces where people gather and spend a considerable amount of time together.
Additionally, several outbreak investigation reports revealed that COVID-19 transmission could be especially effective in crowded indoor spaces, such as classrooms, theaters, restaurants or auditoriums [8,9,10]. Mechanical ventilation systems with air recirculation in confined indoor spaces are also associated with increased transmission of respiratory infections and COVID-19 specifically [10,11,12].
As a vaccine is not already available, governments around the world have adopted different measures to prevent the transmission of the disease, aiming to reduce R0 values. There are several universal strategies that could reduce transmission, especially at workplaces, schools and other crowded indoor spaces: hand hygiene, wearing proper facemasks, physical distancing, mobility reduction, regular environmental cleaning and disinfection, risk awareness and communication, and contact management [13].
Physical distancing is one of the factors that can be easily achieved, especially in confined places with a seat setting such as classrooms, theaters, restaurants, auditoriums, or in buses and trains. The droplets generated in common respiratory activities (i.e., speaking, coughing and sneezing) can reach from 0.16 to 2.76 m without wearing facemasks, according to Cheng et al. [14]. WHO recommends at least a physical separation of one meter within desks at schools and workplaces [13,15], while most governments usually raise it between 1.5 to 2 m (see Table 1), and take additional measures such as wearing mandatory facemasks [16,17,18,19,20,21,22,23]. The imposition of these geometric restraints severely affects the capacity of these places by reducing it dramatically. This capacity decrease makes it difficult for them to be economically viable, as in restaurants or theaters, or to perform adequately specific in-person activities such as teaching [18,22,24].
Several authors have studied this issue and raised engineering solutions driven by the need to keep a minimum separation in built environments [25]. Some solutions are oriented to improve the air quality through room ventilation, reducing the concentration of virus-laden microdroplets in the air exhaled by the occupants [26]. This can be achieved by using natural ventilation, opening windows and doors during school hours in countries with a warm climate [27], or by means of mechanical ventilation systems with no air recirculation, instead of using particulate filters and disinfection in recirculated airflows. Other studies have proposed desk rearrangement strategy in offices and classrooms to guarantee the minimum distance [28,29]. Hospitals usually solve this problem by creating restricted isolated areas for infectious diseases [30] or by establishing safety protocols to minimize contact to infected patients, including physical distancing guidelines [31,32,33,34]. Many educational institutions (e.g., universities or schools) have developed COVID-19 safety guidelines that include seating distributions for their indoor spaces using specific values of physical distance between desks, but comprehensive studies for maximizing room carrying capacity under these circumstances were not found in the scientific literature.
In that context, this work provides a simple and inexpensive solution to evaluate the maximum seating capacity in this kind of symmetrical covered space keeping the minimum physical distance. The rest of the paper is organized as follows: Section 2 sets the initial conditions and develops the equations to solve the seat distribution optimization problem. Section 3 presents and analyzes the obtained results. Section 4 makes some concluding remarks and sets future research lines.

2. Materials and Methods

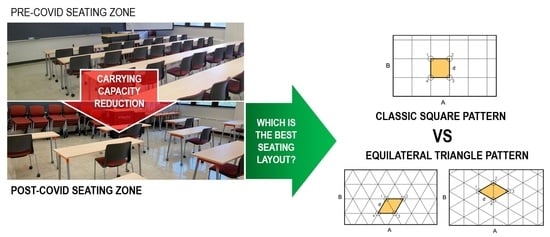
2.1. Problem Definition

With the aim to confront the problem, the room has been divided into three different areas of activity (Figure 3): (i) the performing area (which could not exist in some cases), where the lead performer(s)—teacher(s), lecturer(s), actor(s), singer(s), musician(s), etc.—carry out the main activity; (ii) the circulation area, used for general internal circulation of individuals along with space; and (iii) the seating area, where the audience takes a seat to watch or participate in the main activity.
In this study, we assume that:
  • The space is open plan—that is, without any architectural element placed within its perimeter.
  • The shape of the seating area could be assimilated into a rectangle. This is a common setting for most of the indoor activities requiring seats (e.g., classrooms, sports courts), as the walls usually follow orthogonal directions.
  • The seating area cannot be modified, and therefore it is the same before and after the seat redistribution.
  • There is no possibility of placing any surface that blocks the airflow between two or more seats, such as transparent protective screens or partitions.
According to the Euclidean geometry of the plane, there are three possible distribution patterns that we can consider for distributing the maximum quantity of people in a determined area:
(a)
Square pattern (Figure 4a): this is the most common distribution adopted for rectangular surfaces in pre-COVID spaces, as it is simple to plan and easy to deploy.
(b)
Equilateral triangle pattern (Figure 4b,c): this is the most compact distribution per se, as it guarantees a constant distance between its vertexes with the minimum surface area, but under certain boundary conditions may not be the optimal solution. It has two possible optimal orientations, which are obtained by making one side of the triangle parallel to each side of the rectangular area.
Consequently, the optimization problem to solve is which of these three distributions provides the maximum quantity of people with a minimum separation d between them, in a rectangular surface with dimensions A × B.

2.2. Model Development

In the first place, we have to take into account that it is necessary to detract from the initial gross seating area an unused perimetral fringe as it is necessary for placing the furniture (i.e., desks, chairs) of those seating places located at the boundaries, as it can be seen in Figure 5. Thus, the effective net area for the model, Seff, will be
S e f f = ( W 2 a ) ( L 2 b ) = A × B
where W and L are, respectively, the width and length of the seating area, and a, b are the horizontal and vertical distance from the center of any individual place to its edge, including the desk if present.
The parameter d previously shown in Figure 4 refers to the length of the side of each cell, as a result of the addition of two sub-parameters: the intimate distance radius, r—typically 0.3–0.4 m according to [35]—and the minimum physical distance between subjects, p, as defined in Table 1, which frequently adopts values from 1 to 2 m. Hence, it can be expressed as follows:
d = 2r + p
A trivial solution could be first presented for the case of an infinite or semi-infinite surface area, which could be applied for a seating area with A and B values significantly greater than d. In that particular circumstance, any of the triangular distributions will always lead to a greater number of individuals, according to the ratio K defined in the following equation:
K = S S = 2 3 = 1.1547
where S is the surface area of a square and S is the surface area of two contiguous equilateral triangles with the same side length as the squares. Therefore, in this case there will be 15.47% more seats by using the triangular pattern instead of the square one.
However, when the covered surface area is much smaller, as is the case with most actual indoor spaces, we need to determine which of the three configurations will give us a greater number of seats (Nmax): square pattern (Nsq), horizontal triangle pattern (Nth), and vertical triangle pattern (Ntv):
N s q = ( 1 + α ) ( 1 + β )
N t v = ( 1 + α ) ( 1 + β ) 1 + β 2 δ α
N t h = ( 1 + α ) ( 1 + β ) 1 + α 2 δ β
N m a x = max ( N s q , N t h , N t v )
where α = A / d , α = 2 A / 3 d , β = B / d , β = 2 B / 3 d , δ α = A / d + 0.5 ( 1 + α ) , and   δ β = B / d + 0.5 ( 1 + β ) . The parameters α and β stand for the number of spaces between rows and a column for a square pattern layout. The parameters α’ and β’ are used instead of α and β in horizontal and vertical triangle patterns, respectively, in order to consider the height of the triangle ( d 3 / 2 ) . Eventually, the parameters δ α and δ β are applied in certain cases to correct the overall number of seats.
Figure 6 shows a detailed flowchart of the methodological process followed for algorithm definition and results production.

3. Results and Discussion

3.1. Analysis of Environment Uses and Sizes

There are three main parameters to determine the maximum amount of seats and their pattern distribution: the net seating area dimensions (A, B) and the distance d adopted (see Table 2). These parameters can be easily converted into two dimensionless values: A/d and B/d, which will be used for displaying the results.
Table 3 shows the range of values that are commonly adopted for A/d and B/d for the five building typologies and uses studied in this work. The upper and lower limits for each typology were calculated by dividing the typical room dimensions according to [36] by the maximum and minimum value of d shown in Table 2. The covered ranges for each typology are represented in Figure 7. In the same figure there are defined three kinds of zones which will be analyzed subsequently: (a) The area of study (zone 1), which comprehends all the possible values ranging from 1 to 20; (b) the area of usual values (zone 2), which is defined by merging the areas defined for each typology; and (c) the area of shared values (zone 3), obtained as the intersection of the five typological zones. The blank parts of that graph show rare or infrequent combinations of A/d and B/d values for length and width. Values over 20 (i.e., an open-plan seating area over 40 m long or wide) are very rare.
Figure 8a shows the maximum capacity that can be obtained in the seating area, using the best of the three patterns defined in Figure 4, according to (7). Figure 8b displays the increment of seat capacity (∆N) obtained by (8), when it exists, respect to the square pattern, if a triangular distribution is used. The blank spaces indicate no gain in seating capacity, or even a decrease.
Δ N = N m a x N s q 0
The pattern that maximizes the number of seats can be determined by (9a) and (9b). Depending on the value of these two dimensionless parameters, A/d and B/d, it can be observed that triangular patterns permit to obtain a greater number of seats, especially when A/d or B/d is greater than 4.5. In fact, if we look at Figure 9a, it is only for lower usual values of A/d and B/d that the square pattern has an advantage over the triangular seat distribution. For the values of these two parameters located in zone 3, the triangular distribution is preferred in almost 100% of the situations.
{         max   ( N t h , N t v ) > N s q   ,     t r i a n g l e   p a t t e r n max   ( N t h , N t v ) = N s q   ,                   i n d i s t i n c t   max   ( N t h , N t v ) < N s q   ,     s q u a r e   p a t t e r n
{     N t h > N t v > N s q   ,                                 h o r i z o n t a l   t r i a n g l e   p a t t e r n   N t v > N t h > N s q   ,       v e r t i c a l   t r i a n g l e   p a t t e r n
n = Δ N N s q 100
Attending to the percentual increment in the number of seats (n) caused by using the triangular pattern instead of the square one (10), Figure 9b shows that when the number of seats is low (e.g., small classrooms), certain combinations of A/d and B/d values can add up to 50% more seats in the room. However, in this zone, there are isolated windows of values where the square pattern is more convenient. For mid-sized spaces, the increments usually are between 20% to 30%, whereas for larger areas, the values oscillate from 4% in a few points up to 25%. As previously stated in (3), as the surface area grows, the trend is to stabilize on 15.5%. Focusing on the rectangular region where there are the most frequent values, which go from 4.5 to 9.5, the maximum increase obtained is 28%, and the average value reaches 13%.
Table 4 shows the percentual distribution of carrying capacity increase attending to the three areas defined in Figure 7. Results show that there is no capacity increase in the 2.7% of the usual cases, whereas in almost 80% of the cases located in this area the carrying capacity increases from 10% to 25%; in almost half of these, the increment ranges from 15% up to 25%. If we observe what happens in the shared values area, the results are similar: only 0.4% of the cases do not add up any seat, while roughly 75% of the cases guarantee from 10% to 25% of seat capacity growth. Figure 10 shows the individual and accumulated distribution of these increments of seating capacity in the three delimited areas.

3.2. Remarks on Furniture Types and Dimensions

The previous results can be accurate for individual distribution of the seats, but in some places like certain classrooms [37], libraries, or dining spaces, the subjects usually share a table. For those situations, it could be very useful to study the possible table allocations and the very geometry of the table—that is, its shape and size.
Figure 11 illustrates four of the most common distributions for the different seat patterns studied in this work. It can be observed in Figure 11b that some of the table layouts could lead to a decrease in the number of seats, which can alter the results shown in the previous subsection.
That figure also reveals that the dimensions of the tables are conditioned by the physical distance d. For that reason, as shown in Table 5, it is possible to determine the range of valid table sizes for each value of d, previously defined in Table 2.
In case of the tables that have a lesser diameter or length, they can be easily adapted by placing a new board with the correct dimensions above the existing table surface. However, as it can be noted, some of the values can be excessive for a regular table. It is not common to find tables with a diameter greater than 2.5 m, or rectangular tables more than 3.5 m wide, for example.

4. Conclusions

In this paper, a comprehensive model for optimizing the number of seats on orthogonal closed spaces is presented. The study compares the traditional seat layout in square pattern with the most effective seat distribution using equilateral triangles. The effectivity of this uncommon distribution has been analyzed for several kinds and sizes of indoor spaces, concluding that in most cases the alternative pattern is preferable to the classic one. When the number of seats is low, this pattern can add up to 50% more seats in the room. For intermediate-sized spaces, the capacity increments range between 20% to 30%, while for larger areas the values oscillate from 4% to 25%. Results also show that triangular patterns add no carrying capacity only in the 2.7% of the usual cases analyzed, whereas in almost 80% of the cases located in this zone the carrying capacity increases by 10% to 25%. The implications of the size and shape of the existing furniture for shared table layouts have also been discussed.
As a further line of research, this methodology could be extended to other geometric shapes, not as common as the rectangular, or rooms with irregular contours. More complex numerical models will be needed for solving this problem.

Author Contributions

Conceptualization, L.B.; methodology, L.B. and C.B.; software, L.B.; validation, L.B. and C.B.; formal analysis, L.B.; writing—original draft preparation, L.B.; writing—review and editing, C.B.; visualization, L.B. and C.B.; project administration, L.B. All authors have read and agreed to the published version of the manuscript.

Funding

This research did not receive any specific grant from funding agencies in the public, commercial, or not-for-profit sectors.

Conflicts of Interest

The authors declare no conflict of interest.

References

  1. World Health Organization Coronavirus Disease (COVID-19): Weekly Epidemiological Update. Available online: https://www.who.int/docs/default-source/coronaviruse/situation-reports/20200824-weekly-epi-update.pdf?sfvrsn=806986d1_4 (accessed on 26 August 2020).
  2. Worldometer Coronavirus Live Update. Available online: https://www.worldometers.info/coronavirus/ (accessed on 26 August 2020).
  3. World Health Organization Coronavirus Disease (COVID-19) Dashboard. Available online: https://covid19.who.int/ (accessed on 25 August 2020).
  4. Li, Y.; Wang, L.W.; Peng, Z.H.; Shen, H.B. Basic reproduction number and predicted trends of coronavirus disease 2019 epidemic in the mainland of China. Infect. Dis. Poverty 2020, 9. [Google Scholar] [CrossRef] [PubMed]
  5. Liu, Y.; Gayle, A.A.; Wilder-Smith, A.; Rocklöv, J. The reproductive number of COVID-19 is higher compared to SARS coronavirus. J. Travel Med. 2020, 27, 1–4. [Google Scholar] [CrossRef] [PubMed] [Green Version]
  6. Zhao, S.; Cao, P.; Gao, D.; Zhuang, Z.; Cai, Y.; Ran, J.; Chong, M.K.C.; Wang, K.; Lou, Y.; Wang, W.; et al. Serial interval in determining the estimation of reproduction number of the novel coronavirus disease (COVID-19) during the early outbreak. J. Travel Med. 2020, 27, 1–3. [Google Scholar] [CrossRef] [PubMed]
  7. Flaxman, S.; Mishra, S.; Gandy, A.; Unwin, J.T.; Coupland, H.; Mellan, T.A.; Zhu, H.; Berah, T.; Eaton, J.W.; Guzman, P.N.P.; et al. Report 13: Estimating the Number of Infections and the Impact of Non-Pharmaceutical Interventions on COVID-19 in 11 European Countries; Imperial College London: London, UK, 2020. [Google Scholar]
  8. Leclerc, Q.J.; Fuller, N.M.; Knight, L.E.; Funk, S.; Knight, G.M. What settings have been linked to SARS-CoV-2 transmission clusters? Wellcome Open Res. 2020, 5, 83. [Google Scholar] [CrossRef] [PubMed]
  9. Hamner, L.; Dubbel, P.; Capron, I.; Ross, A.; Jordan, A.; Lee, J.; Lynn, J.; Ball, A.; Narwal, S.; Russell, S.; et al. High SARS-CoV-2 Attack Rate Following Exposure at a Choir Practice—Skagit County, Washington, March 2020. MMWR. Morb. Mortal. Wkly. Rep. 2020, 69, 606–610. [Google Scholar] [CrossRef] [PubMed]
  10. Lu, J.; Gu, J.; Gu, J.; Li, K.; Xu, C.; Su, W.; Lai, Z.; Zhou, D.; Yu, C.; Xu, B.; et al. COVID-19 Outbreak Associated with Air Conditioning in Restaurant, Guangzhou, China, 2020. Emerg. Infect. Dis. 2020, 26, 1628–1631. [Google Scholar] [CrossRef] [PubMed]
  11. Baka, A.; Cenciarelli, O.; Kinross, P.; Penttinen, P.; Plachouras, D.; Semenza, J.; Suetens, C.; Weist, K. Heating, Ventilation and Air-Conditioning Systems in the Context of COVID-19 Target Audience Evidence for Transmission in Closed Spaces and the Role of Heating, Ventilation and Air-Conditioning (HVAC) Systems; European Centre for Disease Prevention and Control: Solna, Sewden, 2020. [Google Scholar]
  12. Shen, Y.; Li, C.; Dong, H.; Wang, Z.; Martinez, L.; Sun, Z.; Handel, A.; Chen, Z.; Chen, E.; Ebell, M.; et al. Airborne Transmission of COVID-19: Epidemiologic Evidence from Two Outbreak Investigations. SSRN Electron. J. 2020. [Google Scholar] [CrossRef]
  13. World Health Organization. Considerations for Public Health and Social Measures in the Workplace in the Context of COVID-19; World Health Organization: Geneva, Switzerland, 2020. [Google Scholar]
  14. Cheng, C.H.; Chow, C.L.; Chow, W.K. Trajectories of large respiratory droplets in indoor environment: A simplified approach. Build. Environ. 2020, 183, 107196. [Google Scholar] [CrossRef] [PubMed]
  15. World Health Organization. Considerations for School-Related Public Health Measures in the Context of COVID-19; World Health Organization: Geneva, Switzerland, 2020. [Google Scholar]
  16. Boris Johnson Ditches 2m Physical Distancing Rule in England for “1m-Plus.”. Available online: https://www.theguardian.com/world/2020/jun/23/boris-johnson-ditches-2-metre-rule-in-england-for-1-metre-plus-coronavirus (accessed on 26 August 2020).
  17. Coronavirus: La Nueva Normalidad Fija en 1,5 Metros la Distancia de Seguridad. Available online: https://www.lavanguardia.com/vida/20200610/481701697640/nueva-normalidad-coronavirus-espana-distancia-seguridad-mascarillas.html (accessed on 26 August 2020).
  18. Un Docente Calcula el Número de Alumnos por Aula Según las Normas de Seguridad: “Solo Caben 8.”. Available online: https://www.niusdiario.es/sociedad/educacion/docente-calcula-numero-alumnos-aula-segun-normas-seguridad-solo-caben-ocho_18_2949720058.html (accessed on 26 August 2020).
  19. Do We Still Need to Maintain 1.5 Metres Physical Distance from Each Other as Threat of Coronavirus Eases in Australia? Available online: https://www.abc.net.au/news/health/2020-06-19/could-the-1.5m-rule-be-reviewed-now-coronavirus-cases-are-so-low/12363254 (accessed on 26 August 2020).
  20. Nueva Normalidad: El Gobierno Fija Finalmente la Distancia Interpersonal en 1,5 Metros y Obligará Durante Meses a Usar Mascarillas. Available online: https://www.elmundo.es/espana/2020/06/09/5edf71e9fc6c835f688b45be.html# (accessed on 26 August 2020).
  21. Ministerio de Universidades. Recomendaciones del Ministerio de Universidades del Para Adaptar el Curso Universitario 2020-2021 a una Presencialidad Adaptada; Ministerio de Universidades: Madrid, Spain, 2020. [Google Scholar]
  22. UK Government Cabinet Office Review of Two Metre Social Distancing Guidance. Available online: https://www.gov.uk/government/publications/review-of-two-metre-social-distancing-guidance/review-of-two-metre-social-distancing-guidance (accessed on 26 September 2020).
  23. Chu, D.K.; Akl, E.A.; Duda, S.; Solo, K.; Yaacoub, S.; Schünemann, H.J.; El-harakeh, A.; Bognanni, A.; Lotfi, T.; Loeb, M.; et al. Physical distancing, face masks, and eye protection to prevent person-to-person transmission of SARS-CoV-2 and COVID-19: A systematic review and meta-analysis. Lancet 2020, 395, 1973–1987. [Google Scholar] [CrossRef]
  24. Jourdan, D.; Marmot, M.; Gray, N. Coronavirus: There Is an Urgent Need to Re-Open Schools—This is How to Make It Happen. Available online: https://theconversation.com/coronavirus-there-is-an-urgent-need-to-re-open-schools-this-is-how-to-make-it-happen-137818 (accessed on 31 August 2020).
  25. Bonell, C.; Melendez-Torres, G.J.; Viner, R.M.; Rogers, M.B.; Whitworth, M.; Rutter, H.; Rubin, G.J.; Patton, G. An evidence-based theory of change for reducing SARS-CoV-2 transmission in reopened schools. Health Place 2020, 64, 102398. [Google Scholar] [CrossRef] [PubMed]
  26. Morawska, L.; Tang, J.W.; Bahnfleth, W.; Bluyssen, P.M.; Boerstra, A.; Buonanno, G.; Cao, J.; Dancer, S.; Floto, A.; Franchimon, F.; et al. How can airborne transmission of COVID-19 indoors be minimised? Environ. Int. 2020, 142, 105832. [Google Scholar] [CrossRef] [PubMed]
  27. Dietz, L.; Horve, P.F.; Coil, D.A.; Fretz, M.; Eisen, J.A.; Van Den Wymelenberg, K. 2019 Novel Coronavirus (COVID-19) Pandemic: Built Environment Considerations To Reduce Transmission. mSystems 2020, 5. [Google Scholar] [CrossRef] [PubMed] [Green Version]
  28. Uscher-Pines, L.; Schwartz, H.L.; Ahmed, F.; Zheteyeva, Y.; Meza, E.; Baker, G.; Uzicanin, A. School practices to promote social distancing in K-12 schools: Review of influenza pandemic policies and practices. BMC Public Health 2018, 18, 1–13. [Google Scholar] [CrossRef] [PubMed]
  29. Dooyema, C.A.; Copeland, D.; Sinclair, J.R.; Shi, J.; Wilkins, M.; Wells, E.; Collins, J. Factors influencing school closure and dismissal decisions: Influenza A (H1N1), michigan 2009. J. Sch. Health 2014, 84, 56–62. [Google Scholar] [CrossRef] [PubMed]
  30. Asperges, E.; Novati, S.; Muzzi, A.; Biscarini, S.; Sciarra, M.; Lupi, M.; Sambo, M.; Gallazzi, I.; Peverini, M.; Lago, P.; et al. Rapid Response to COVID-19 Outbreak in Northern Italy: How to Convert a Classic Infectious Disease Ward into a COVID-19 Response Centre. J. Hosp. Infect 2020, 105, 477–479. [Google Scholar] [CrossRef] [PubMed] [Green Version]
  31. Wee, L.E.I.; Sim, X.Y.J.; Conceicao, E.P.; Aung, M.K.; Tan, K.Y.; Ko, K.K.K.; Wong, H.M.; Wijaya, L.; Tan, B.H.; Venkatachalam, I.; et al. Containing COVID-19 outside the isolation ward: The impact of an infection control bundle on environmental contamination and transmission in a cohorted general ward. Am. J. Infect. Control 2020, 48, 1056–1061. [Google Scholar] [CrossRef] [PubMed]
  32. Wee, L.E.; Ying Sim, J.X.; Conceicao, E.P.; Aung, M.K.; Tan, J.Y.; Venkatachalam, I. Containment of COVID-19 amongst ancillary healthcare workers: An integral component of infection control. J. Hosp. Infect. 2020. [Google Scholar] [CrossRef] [PubMed]
  33. Wee, L.E.; Conceicao, E.P.; Sim, X.Y.J.; Aung, M.K.; Tan, K.Y.; Wong, H.M.; Wijaya, L.; Tan, B.H.; Ling, M.L.; Venkatachalam, I. Minimizing Intra-Hospital Transmission of COVID-19: The Role of Social Distancing. J. Hosp. Infect 2020, 105, 113–115. [Google Scholar] [CrossRef] [PubMed]
  34. Gagneux-Brunon, A.; Pelissier, C.; Gagnaire, J.; Pillet, S.; Pozzetto, B.; Botelho-Nevers, E.; Berthelot, P. SARS-CoV-2 infection: Advocacy for training and social distancing in healthcare settings. J. Hosp. Infect. 2020. [Google Scholar] [CrossRef] [PubMed]
  35. Amaoka, T.; Laga, H.; Saito, S.; Nakajima, M. Personal space modeling for human-computer interaction. In Lecture Notes in Computer Science (Including Subseries Lecture Notes in Artificial Intelligence and Lecture Notes in Bioinformatics); Springer: Berlin/Heidelberg, Germany, 2009; pp. 60–72. [Google Scholar]
  36. Neufert, E.; Neufert, P.; Kister, J. Architects’ Data, 5th ed.; John Wiley & Sons, Ltd.: Hoboken, NJ, USA, 2019; ISBN 978-1-119-28435-2. [Google Scholar]
  37. Park, E.L.; Choi, B.K. Transformation of classroom spaces: Traditional versus active learning classroom in colleges. High. Educ. 2014, 68, 749–771. [Google Scholar] [CrossRef]
Publisher’s Note: MDPI stays neutral with regard to jurisdictional claims in published maps and institutional affiliations.
Figure 1. Total COVID-19 cases per 1 million population worldwide as of August 25, 2020 [3].
Symmetry 12 01683 g001
Figure 2. Predominant transmission type in the COVID-19 infected countries, August 2020 [3].
Symmetry 12 01683 g002
Figure 3. Areas of activity considered in this study for a generic indoor space.
Symmetry 12 01683 g003
Figure 4. Possible seat distribution patterns on a rectangular area: (a) Square pattern; (b) Equilateral triangle pattern, aligned to side A; and (c) Equilateral triangle pattern, aligned to side B. The shaded areas have the same number of vertexes (seats).
Symmetry 12 01683 g004
Figure 5. Definition of the seating area parameters.
Symmetry 12 01683 g005
Figure 6. Workflow of the methodological process followed in this study.
Symmetry 12 01683 g006
Figure 7. The usual range of dimensions of the seating area for the studied building typologies and uses. Graphical definition of usual values area and shared values area within the area of study.
Symmetry 12 01683 g007
Figure 8. (a) Maximum seat capacity achieved by using the most suitable seat pattern; (b) Increment of seat capacity (∆N) using a triangular seat distribution pattern, compared to a square pattern.
Symmetry 12 01683 g008
Figure 9. (a) Seat pattern for obtaining the highest carrying capacity, by general pattern type (upper left zone) and by specific pattern type (lower right zone); (b) Percentage increase of seating capacity using a triangular pattern, compared to a square pattern.
Symmetry 12 01683 g009
Figure 10. Carrying capacity increment distribution for the three zones defined.
Symmetry 12 01683 g010
Figure 11. Possible table layouts: (a) Round or octagonal tables for four people in a square seat pattern; (b) Round or hexagonal tables for three people in a triangular seat pattern; (c) Rectangular tables for four people in a square seat pattern; (d) Rectangular tables forming continuous rows in a triangular seat pattern.
Symmetry 12 01683 g011
Table 1. Minimum mandatory physical distance between individuals in different countries [19,20,21,22,23].
CountryMinimum Physical Distance (m)
Canada, United Kingdom2.0
United States of America1.8 1
Australia, Germany, Greece, The Netherlands, Spain1.5
China, Denmark, France, Italy, Hong Kong, New Zealand, Singapore1.0
1 The imposed restriction is 6 feet, approximately 1.8 m.
Table 2. Common values adopted for d.
p (m)r = 0.30 mr = 0.35 mr = 0.40 m
2.02.62.72.8
1.82.42.52.6
1.52.12.22.3
1.01.61.71.8
Table 3. Values adopted for A/d and B/d attending to the type of space and its dimensions [36].
TypologySmallMediumLarge
Classroom1.7−3.7 2.5−5.63.6−9.4
Lecture hall2.1−6.34.3−9.45.7−12.5
Restaurant / Dining court3.2−7.54.3−8.96.1−14.4
Library4.3−11.36.3−18.07.1−25.0
Sports court / venue5.4−15.614.3−37.532.1−75.0
Table 4. Increments in room’s seat capacity attending to the analyzed cases.
Carrying Capacity Increase Range (%)% of Total Cases (Zone 1)% of Usual Cases (Zone 2)% of the Shared Cases (Zone 3)
012.92.70.4
(0–10)15.215.624.3
[10–15)28.738.740.2
[15–25)33.639.030.3
[25–35)7.13.74.8
[35–45)0.40.10.0
[45–50]2.10.20.0
Table 5. Dimensions of the tables for the adopted values of d.
d (m)Diameter for Round / Octagonal / Hexagonal Tables (m)Length for Rectangular Tables (m)
Square Seat PatternTriangle Seat PatternSquare Seat PatternTriangle Seat Pattern
1.62.261.852.672.40
1.72.401.962.832.55
1.82.552.083.002.70
2.12.972.423.503.15
2.23.112.543.673.30
2.33.252.663.833.45
2.43.392.774.003.60
2.53.542.894.173.75
2.63.683.004.333.90
2.73.823.124.504.05
2.83.963.234.674.20

