Article

Thermo-Mechanical Performance of a Phase Change Energy Pile in Saturated Sand

1
College of Civil and Transportation Engineering, Shenzhen University, Shenzhen 518060, China
2
College of Civil Engineering, Longdong University, Qingyang 745000, China
3
School of Architecture and Built Environment, The University of Newcastle, Callaghan, NSW 2308, Australia
*
Author to whom correspondence should be addressed.
Symmetry 2020, 12(11), 1781; https://doi.org/10.3390/sym12111781
Submission received: 12 October 2020 / Revised: 22 October 2020 / Accepted: 23 October 2020 / Published: 27 October 2020

Abstract

:

Featured Application

Phase change energy pile can be used to utilize shallow geothermal energy efficiently.

Abstract

To reduce the thermal response and improve the heat storage capacity of energy piles, a phase change (PC) energy pile was proposed. This innovative PC pile is made of concrete containing macro-encapsulated PCM hollow steel balls (HSB) as coarse aggregates. A numerical model was developed to simulate the thermo-mechanical behaviors of the PC pile under thermal cycles and sustained loading. The computational model is a three-dimensional model that is symmetrical for the two horizontal directions in geometry. Heat transfer process follows conservation laws of energy. The numerical model was validated by the experiments conducted on the PC pile and the results show that the model can reproduce the major thermo-mechanical effects. Then, the model was used to compare the performance between the ordinary concrete pile and the PC pile in saturated sand under the same experimental conditions, where the piles were considered to be thermo-elastic in nature and the sand was considered as a Mohr–Coulomb elastic-plastic material. The thermo-mechanical response of the PC pile under different thermal loads was analyzed. The results show that at the end of heating, the temperature, strain, and displacement of the PC pile were lower than those of the ordinary pile. As the thermal loading increased, the range of temperature change in the soil around the PC pile increased, as well as the strain and displacement of the pile. The residual strain and plastic displacement after the temperature cycles also increased with the increase of thermal loading. Therefore, when designing phase change energy piles, full consideration should be given to the matching of thermal loads and PC temperature, so as to balance the heat transfer rate of the pile and the thermal response.

Graphical Abstract

1. Introduction

In the era of energy structure transformation, especially facing the huge challenges of building energy conservation and emission reduction, the development and utilization of renewable clean energy is imperative. The renewable clean energies currently used are mainly sourced from geothermal energy, hydroelectric energy, wind energy, and solar energy. Compared with other clean energies, geothermal energy has larger reserves, wider distribution, higher utilization efficiency, and lower application cost. At the same time, it is not affected by external factors such as season, climate, and day and night changes, and is thus considered a realistic and extremely competitive new energy [1]. A ground source heat pump (GSHP) is a device that uses rock and soil, groundwater, or surface water as a low-temperature heat source to transfer low-grade thermal energy to high-grade thermal energy by introducing a small amount of high-grade energy (such as electricity, etc.). Studies have shown that GSHPs typically consume 1 kwh of energy but can produce more than 4 kwh of heat or cooling energy [2].
As a renewable and clean energy development technology, underground structures with heat pump systems, can be used for heating and cooling in buildings, infrastructure, and various other environments, and are being promoted and applied worldwide. This energy technology basically combines the mechanical properties of underground structures with shallow geothermal energy transmission. In winter, the shallow geothermal energy can be extracted from underground to heat the upper building; in summer, the heat in the upper building can be stored in the ground to meet the cooling needs of the upper building. An energy pile is a typical type of underground energy structure, which combines a GSHP system with a traditional pile foundation. The pile body provides space for heat exchange pipes, and releases heat from the upper building to the heat exchange tubes. Then the heat exchange tube in the pile release the heat into the soil around the pile, along with the flow of the circulating fluid to achieve the function of pile–soil heat exchange. This not only can avoid the shortcomings of traditional GSHP technology, such as large underground space requirement and difficult boring construction, but also uses concrete that has good thermal conductivity compared to soil to improve the heat exchange efficiency [3].
At present, the research on energy piles mainly focuses on the heat transfer efficiency of pile–soil. For example, Hamada et al. [4] conducted thermal response tests on three heat exchange piles with different buried tube forms in the foundation of an office building. The U-shaped heat exchange tube has the most economical efficiency, and a relatively simple installation method to obtain more applications. Kramer et al. [5] conducted a series of thermal performance model tests, which showed that thermal cycling can improve heat transfer efficiency. The first cycle increased the thermal potential of the ground. This enhanced potential could be used in the initial stage of subsequent reverse thermal cycling to obtain higher heat transfer efficiency. Cui et al. [6,7] established a three-dimensional heat conduction model based on the finite volume method to study the thermal performance of energy piles. The simulation results showed that as the distance between the heat exchange tubes increased, the heat transfer efficiency between the pile and the soil continued to increase, while the increase rate of the heat transfer efficiency slowed down.
On the other hand, heat transfer will cause additional stress and strain in the pile, and some research has also been performed on this aspect. For instance, Luo et al. [8] investigated the energy pile with double U-shaped heat exchange tubes, and analyzed the thermal stress of the energy pile. The results showed that the additional thermal stress generated by the thermal load was higher in the middle of the pile than that at the pile ends. Laloui et al. [9] carried some experimental and numerical studies on an energy pile and found that the thermal effects produced much larger axial stresses than those created by the dead weight of the building at the pile toe. Bourne-Webb et al. [10] conducted a temperature cycling test on energy piles under long-term static load, and concluded that the additional stress of the pile caused by the mechanical load may exceed the ultimate bearing capacity of the pile when the pile was heated. In addition, temperature is also an important factor affecting the bearing capacity of energy piles [11].
Some previous experimental studies reported that the additional thermal deformation caused by the temperature change of the energy pile would inevitably lead to the settlement of the pile foundation and affect the safety of the pile structure [10]. For example, Ng et al. [12,13] conducted centrifuge tests on energy piles in sand and clay, and analyzed the settlement of energy piles in different soils. Their results showed that the cyclic temperature load caused a cumulative downward displacement of the energy pile. Kalantidou et al. [14] and Yavari et al. [15,16] studied the temperature and displacement changes of heat exchange piles consisting of aluminum pipes under different axial loads, and the results showed that the settlement was irreversible after heating cycles. Nguye et al. [17] studied the thermodynamic behavior of energy piles under the action of a large number of thermal cycles. They concluded that the irreversible settlement of the pile top caused by the first thermal cycle was the largest, and then the amount of cumulative irreversible settlements became small as the number of temperature cycles increased. Marto et al. [11] conducted six sets of tests on energy piles in clay, and found that after the same thermal cycle, the settlement of the piles increased with the increase of thermal load and axial load. You et al. [18] studied the thermodynamic properties of CFG (Cement Fly-ash Gravel) piles, and found that the cooling stage had more influence on the displacement of energy piles than the heating stage.
In addition to experiments, numerical simulation is also an effective method to study the performance of energy piles, and numerical simulation can better control various conditions and facilitate the comparative analysis of single factor. In order to study the thermo-mechanical characteristics of energy piles, researchers have proposed a number of models, including solid cylindrical models [19,20], annular cylindrical heat source models [21], composite cylindrical models [22], composite toroidal coil source models [23], the transient coil source model [6], and other numerical models that consider the heat transfer of the circulating fluid in the pipeline. Many critical parameters, such as thermal loads, soil properties, head load, etc., were analyzed and the numerical results generally agreed well with the corresponding test’s results [24]. In most cases, the applicability and accuracy of numerical methods for investigating energy piles were validated.
Based on the current research, it was found that thermal loads have an adverse effect on the mechanical properties of energy piles. Increasing the energy density of the pile is an effective way to alleviate or eliminate this adverse effect. The phase change material can absorb or release heat by changing its state (phase change) without changing the temperature. Using phase change paraffin in energy piles not only can improve heat storage capacity and heat exchange efficiency of the piles, but can also reduce the uneven temperature change of the pile body by the phase change action, and thereby reduce the uneven axial stress [24]. Despite the demand for energy piles increasing, the potential use of this relatively new technology of phase change materials in energy piles is challenging, as there is a lack of reliable information concerning the thermo-mechanical behaviors of PC energy piles under different thermal loading conditions.
In this study, a finite element model was developed to simulate the thermo-mechanical performance of a pile. The numerical model was validated by experiments conducted on the proposed PC energy pile. The experimental studies were based on a previous study [25]. Furthermore, the model was used to compare the performance between the ordinary concrete pile and the PC pile in saturated sand. The temperature change of pile and soil, strain and displacement of pile, and the soil pressure surrounding the pile were examined. The effect of thermal loads on the PC pile was also studied. The simulation results can provide a theoretical reference for the efficient promotion and application of PC energy piles.

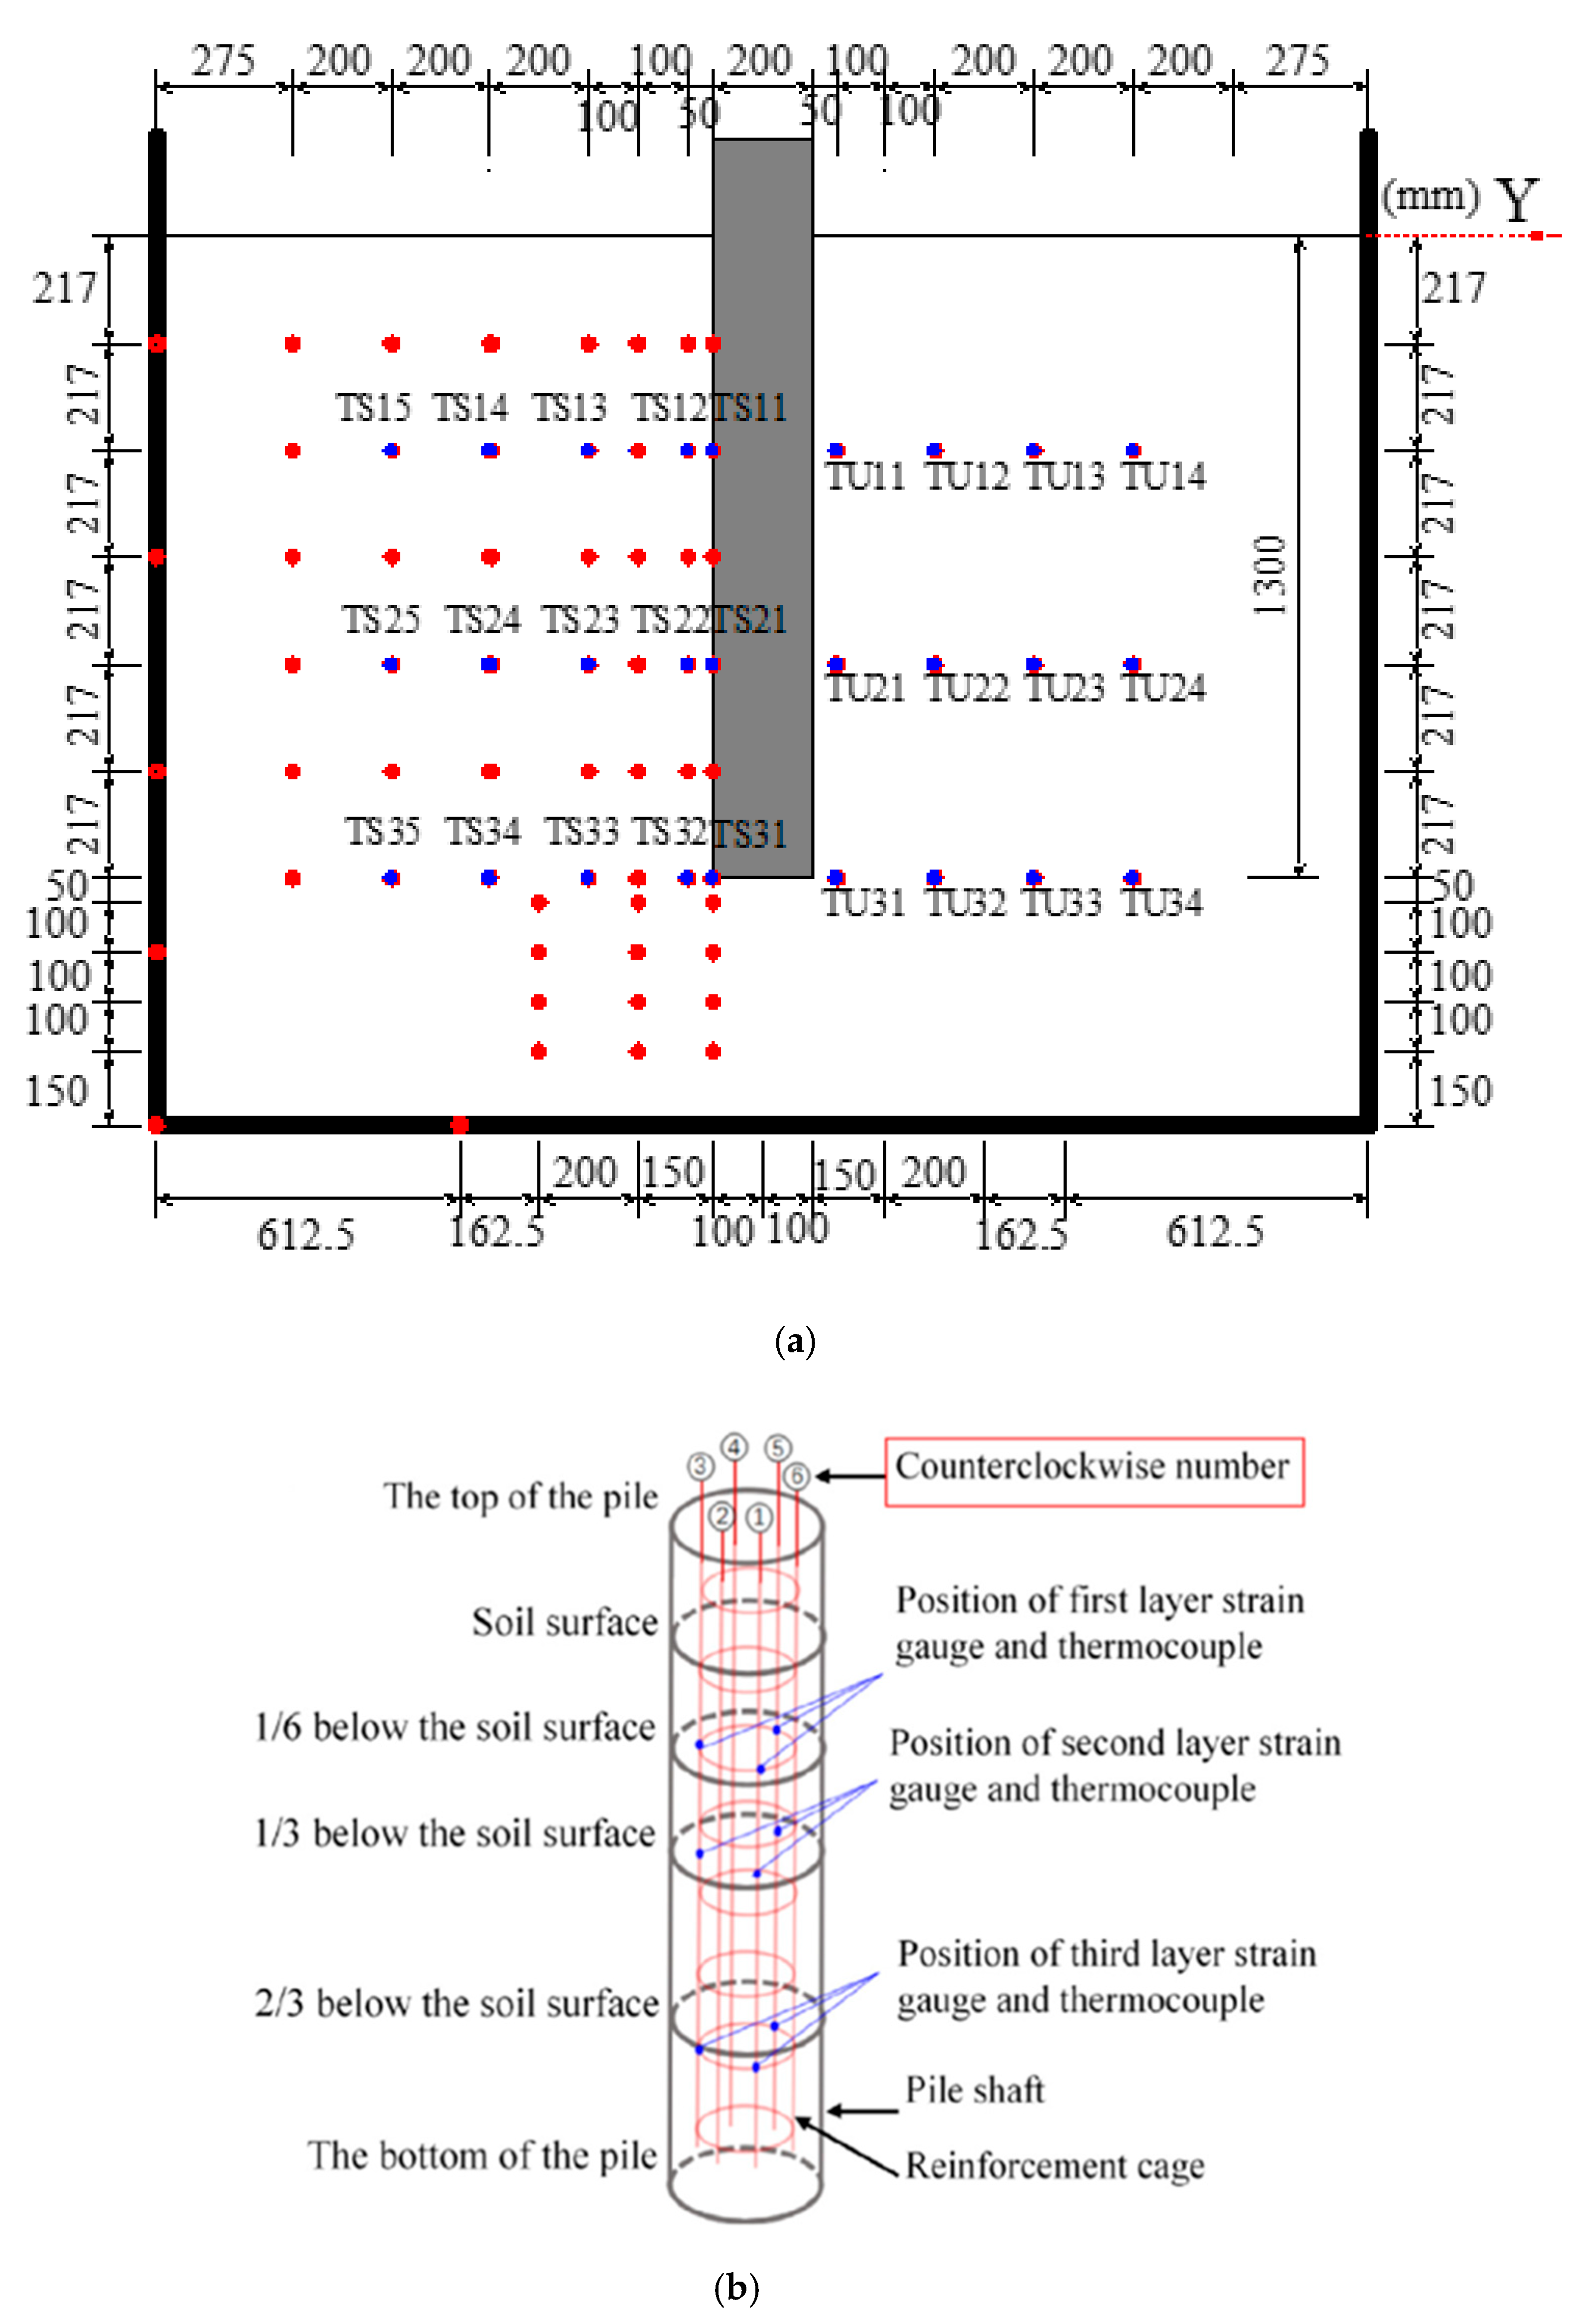
2. Brief Description of Experiments

2.1. PC Pile Development and Experiment Conditions

The PC pile prototype was made of concrete containing macro-encapsulated phase change paraffin hollow steel balls (HSB) as coarse aggregates. The compressive strength of the concrete was designed to meet the requirements in the design specifications of the pile foundation. The thermal loading experiments were conducted in a model steel tank with a size of 2.45 m × 2.45 m × 2 m (length × width × height). The PC pile had a diameter of 0.2 m and length of 1.5 m. The embedment depth of the pile in the saturated sand was 1.3 m, so the pile top was 0.2 m above the soil surface to facilitate the application of static loads on the pile head (Figure 1a). The double U-shaped heat exchange PE tubes were tied to a steel cage and run along with the pile as shown in Figure 1b.

2.2. Loading Condition

A static load of 6.5 kN was first applied on the top of the pile step by step using weight plates to represent the dead loads from an upper structure. After the static loading, heating–cooling cycles were performed through the water circulation system. During the heating, the temperature of the inlet water in the tank was kept constant at 40 °C, and the energy pile was heated at a flow rate of 0.3 m3/h for 16 h, followed by cooling to initial room temperature (18.5 °C) with circulating water at the same flow rate for 8.5 h. Three continuous heating–cooling cycles were performed in the experiments. The temperature in pile and soil, pore pressure of the soil, and strain along the pile were measured during the thermal cycle. The layout of the position of measuring points of the temperature and soil pressure is shown in Figure 2a. Thermocouples and strain gauges were fixed onto a steel reinforcement inside the pile to measure the temperatures and thermal strain (Figure 2b).

3. Numerical Models

To better control various conditions and make a comparative analysis, to understand the role of each influencing factor, a numerical model was developed to compare the thermo-mechanical performance of the ordinary concrete pile and the PC pile.

3.1. Basic Assumptions

To conform to the actual heat transfer law, and avoid making the model too complicated with specific details, the following assumptions were made during the simulation.
  • Since the vertical static load imposed on the pile head was small and the rigidity of the pile itself was relatively large, the load on pile head would not cause plastic damage, so an ideal linear elastic material was used to approximately model the pile.
  • As the temperature change range was not large, the change of material parameters, such as the thermal conductivity, specific heat, and elastic modulus of the pile and soil, were not considered during the thermal cycles and loading.
  • During the heat transfer process of the energy pile, the temperature change in the longitudinal direction was much smaller than the temperature change in the radial direction. Therefore, the heat transfer of the energy pile in the longitudinal direction was negligible.

3.2. Governing Equations

3.2.1. The Governing Equation of Heat Conduction

According to the law of heat conservation, the heat generated by the temperature change per unit time is equal to the heat generated in the unit per unit time, namely:
q x x + q y y + q z z Q + ρ c T t = 0
where, q x , q y , q z are the heat flux per unit time per unit length in the three-dimensional space of x , y , z . Q is the heat flowing through the area of the object per unit time, ρ is the density of the material, c is the specific heat capacity of the material, and T indicates temperature difference T 2 T 1 .
Substituting the heat flux of the material q n = k T n in three directions into Equation (1), it can be obtained:
x ( k T x ) + y ( k T y ) + z ( k T z ) + Q ρ c T t = 0
For vector equations, the above formula can be expressed as:
k T + Q = ρ c T t
In the formula, is the symbol of the Hamiltonian. The above is the derivation process of the heat conduction control equation.

3.2.2. The Governing Equation of Heat Convection

Heat convection is a mode of heat transfer by the mass motion of a fluid. Heat convection occurs to the surface of an object where the surrounding fluid of the object is heated and energy moved away from the source of heat. Convective heat transfer occurs when the surface temperature differs from that of the surrounding fluid. Newton’s law of cooling believes that the surface of an object and the surrounding environment will exchange heat due to the thermal loading, and the object will release or absorb heat into the fluid. The heat released or absorbed per unit time per unit area is proportional to the thermal loading at the surface. This law is in good agreement with heat convection, therefore,
q ˙ = h Δ T = h ( T c T s )
where, h represents the convective heat transfer coefficient, and T c and T s represent circulating fluid temperature and solid temperature, respectively.
Since the wall thickness of the circulating heat exchange tube is smaller than the diameter of the heat exchange tube, for convenience in modeling, the wall thickness of the heat exchange tube can be ignored. Using the equivalent heat transfer coefficient of the interface between the heat fluid and the tube wall to consider the transient heat transfer of the tube wall:
h T o t a l = [ D p 2 k p ln ( D p d p ) + D p d p h ] 1
where, D p and d p represent the outer and inner diameters of the heat exchange tube, respectively, and k p represent the thermal conductivity of the heat exchange tube.

3.3. Constitutive Models

3.3.1. Thermo-Elastic Model of the Pile

Assuming that the deformation of the pile body during heating and cooling is thermoelastic, the expression of the thermoelastic model is as follows:
[ σ r σ ϕ σ z τ r ] = E 1 2 υ ( 1 + υ ) [ 1 υ υ υ 0 υ 1 υ υ 0 υ υ 1 υ 0 0 0 0 G ] [ ε r ε ϕ ε z γ r z ] E ( 1 2 υ ) α Δ T [ 1 1 1 0 ]
It can be seen that the material parameters involved in the formula are elastic modulus E , Poisson’s ratio υ , and linear expansion coefficient α .

3.3.2. Mohr–Coulomb Model of Soil

The stress–strain of sandy soil was simulated by the Mohr–Coulomb model. The loading method was thermo-mechanical coupling in sequence, assuming that the mechanical behavior of the soil was independent of temperature changes [26]. The yield surface function of the Mohr–Coulomb model in the principal stress space is
F = R m c q p tan ϕ c = 0
The parameter R m c defines the shape of the Mohr–Coulomb yield surface in the π plane, which can be calculated as follows:
R m c = 1 3 cos φ sin ( θ + π θ ) + 1 3 cos ( θ + π 3 ) tan φ
where θ is the polar declination angle, p is the average stress, calculated by the stress tensor:
p = 1 3 ( σ 11 + σ 22 + σ 33 )
q is the deviator stress, calculated by the deviator stress tensor: q = 3 2 ( s : s ) .
In order to avoid the non-convergent in the calculation, a smooth continuous plastic potential surface that is different from the yield surface to consider the non-associated flow law was adopted,
G p = ( ε c 0 tan ψ ) 2 + ( R m w q ) 2 p tan ψ
In the formula, ψ represents the dilatancy angle, c 0 represents the initial cohesion, and ε represents the eccentricity of the meridian plane. The default value of 0.1 for ε was used in the calculation. R m w controls the shape of the plastic potential surface in the π surface.

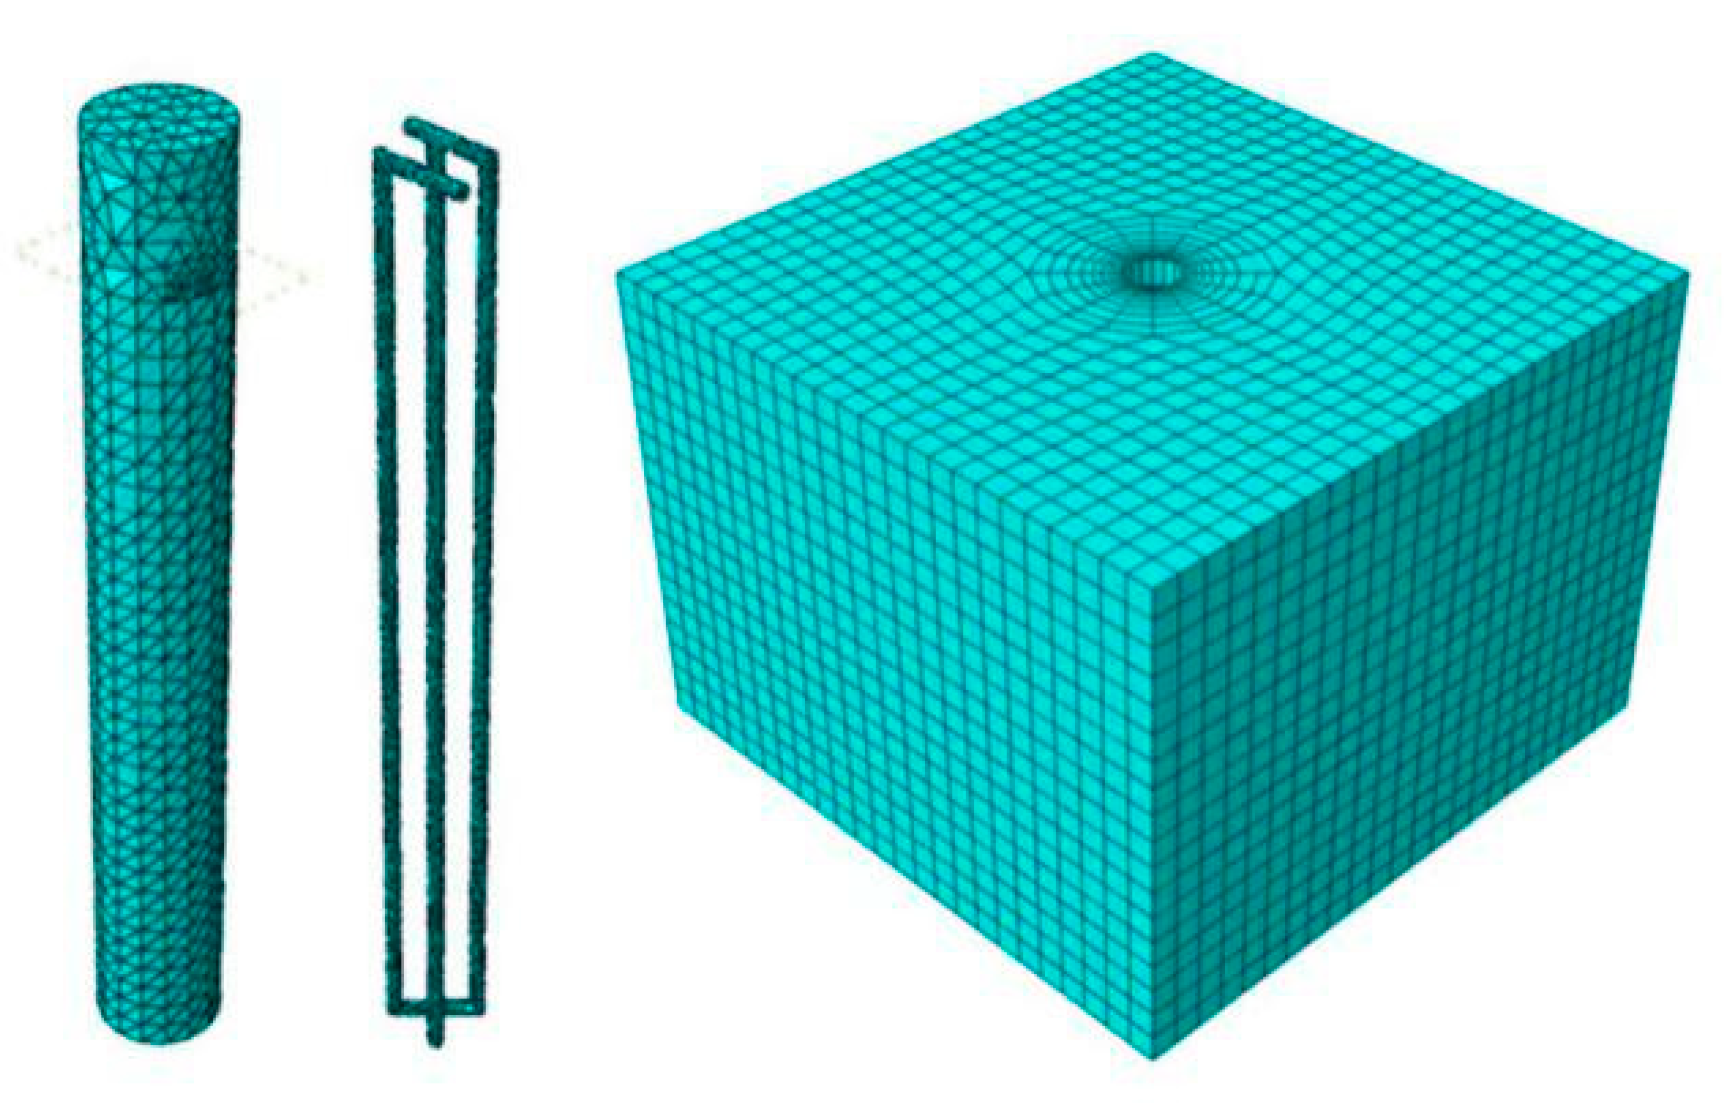
3.4. Finite Element Model

The numerical simulation was conducted using the finite element (FE) analysis software, ABAQUS 6.14. All the simulation conditions were the same as the experimental conditions. The concrete type for both the PC pile and ordinary pile was C40. A parallel double U-shaped heat exchange tube was placed in the interior of the reinforcement cage. The heat exchange tube was a HD100 PE tube, with an outer diameter of 20 mm and an inner diameter of 15 mm. The location of the inlet and outlet of the heat exchange tube on the pile was 200 mm below the pile top. Due to the complexity of the heat exchange tube structure, the modeling process of this part was drawn by CATIA software and imported into the component module of ABAQUS. Figure 3 presents the FE modeling of the pile body, heat exchange tube, and soil. The linear heat transfer tetrahedron element with four nodes (DC3D4) was used for the pile body and the heat exchange tube. The soil element was modeled as a linear heat transfer hexahedron element with eight nodes (DC3D8).
The material properties of the pile and the soil are listed in Table 1. Due to the phase change of PC materials in the process of temperature change, the PC pile had a smaller thermal conductivity and larger specific heat, which indicates that more heat is stored in the pile in the process of temperature change. In order to simulate the energy storage of PC materials, the latent heat module was selected in the thermal module and the temperature range of phase change paraffin was 21.5–23.5 °C, and the enthalpy value was 116.5 J/g.
The heat convection between the heat exchange tube and the pile was applied through the surface heat exchange condition, which was used as the heat source of the whole energy pile system. In order to simulate the temperature change in the tube, the temperature of the measuring points on the surface of heat exchange tubes in the experiment was used to approximate the temperature of the tube, and the temperature between the adjacent measuring points was calculated by the linear difference method. The constraint of pile–soil was bound. For boundary conditions, the perimeter and bottom edges were set to adiabatic boundaries, and the top was set to convective boundaries with air. The initial temperature of all the components was set to the room temperature of 20 °C.

3.5. Mechanical Model

As the simulation was performed by the method of sequential thermal-mechanical coupling, the previously completed temperature model was then modified according to the mechanical model. The specific points are as follows:
(1)
The elastic modulus of the pile (E = 3.25 × 10⁴ MPa) and Poisson’s ratio of soil ( υ = 0.35 ), and the friction angle of the soil were input into the material properties module. In addition, the permeability coefficient of saturated soil was input as k = 6 × 10 3 cm/s, whereas the specific gravity of the interstitial fluid was set to 10 kN/m3.
(2)
The heat exchange tube model and the pile body model were set as binding constraints, the interface between the energy pile and soil were simulated as a frictional contact in the tangential direction. The coefficient of friction (μ) between soil and concrete pile was considered as tanϕ, where ϕ is the internal friction angle of the sand used in the experiments.
(3)
The pile and soil were first subject to gravity force, and then a static load of 6.5 kN was applied to the pile head. The surrounding and bottom of the soil were set as a completely fixed boundary, and the top surface was a free boundary with a pore pressure set to 0 in the predefined field, which means that the top surface was the drainage boundary. Finally, the calculation results of the temperature model were substituted into the stress model for the thermal and mechanical coupling.

4. Results and Discussions

4.1. Validation of Numerical Model

The accuracy of the proposed numerical model was confirmed by comparing the simulated results and experimental results under the same loading conditions. The temperature change, strain of the pile body, displacement on the pile head, and change of soil pressure around the PC pile were analyzed.

4.1.1. Temperature Change in Soil

The experimental and simulation results of temperature change of the measuring points which were located at the depth of 217 mm (TS11) and 150 mm (TS13) away from the pile surface in horizontal direction respectively, are presented in Figure 4. It can be seen from the figure that the simulated values and experimental values of the temperature around the pile are in good agreement. Although there is a small difference between the experimental and simulated values at TS13 which is far away from the pile surface, compared with the location of TS11, the overall trend shows a good consistency. The results indicate that the pile–soil heat transfer model can describe the temperature change of the soil around the pile accurately.

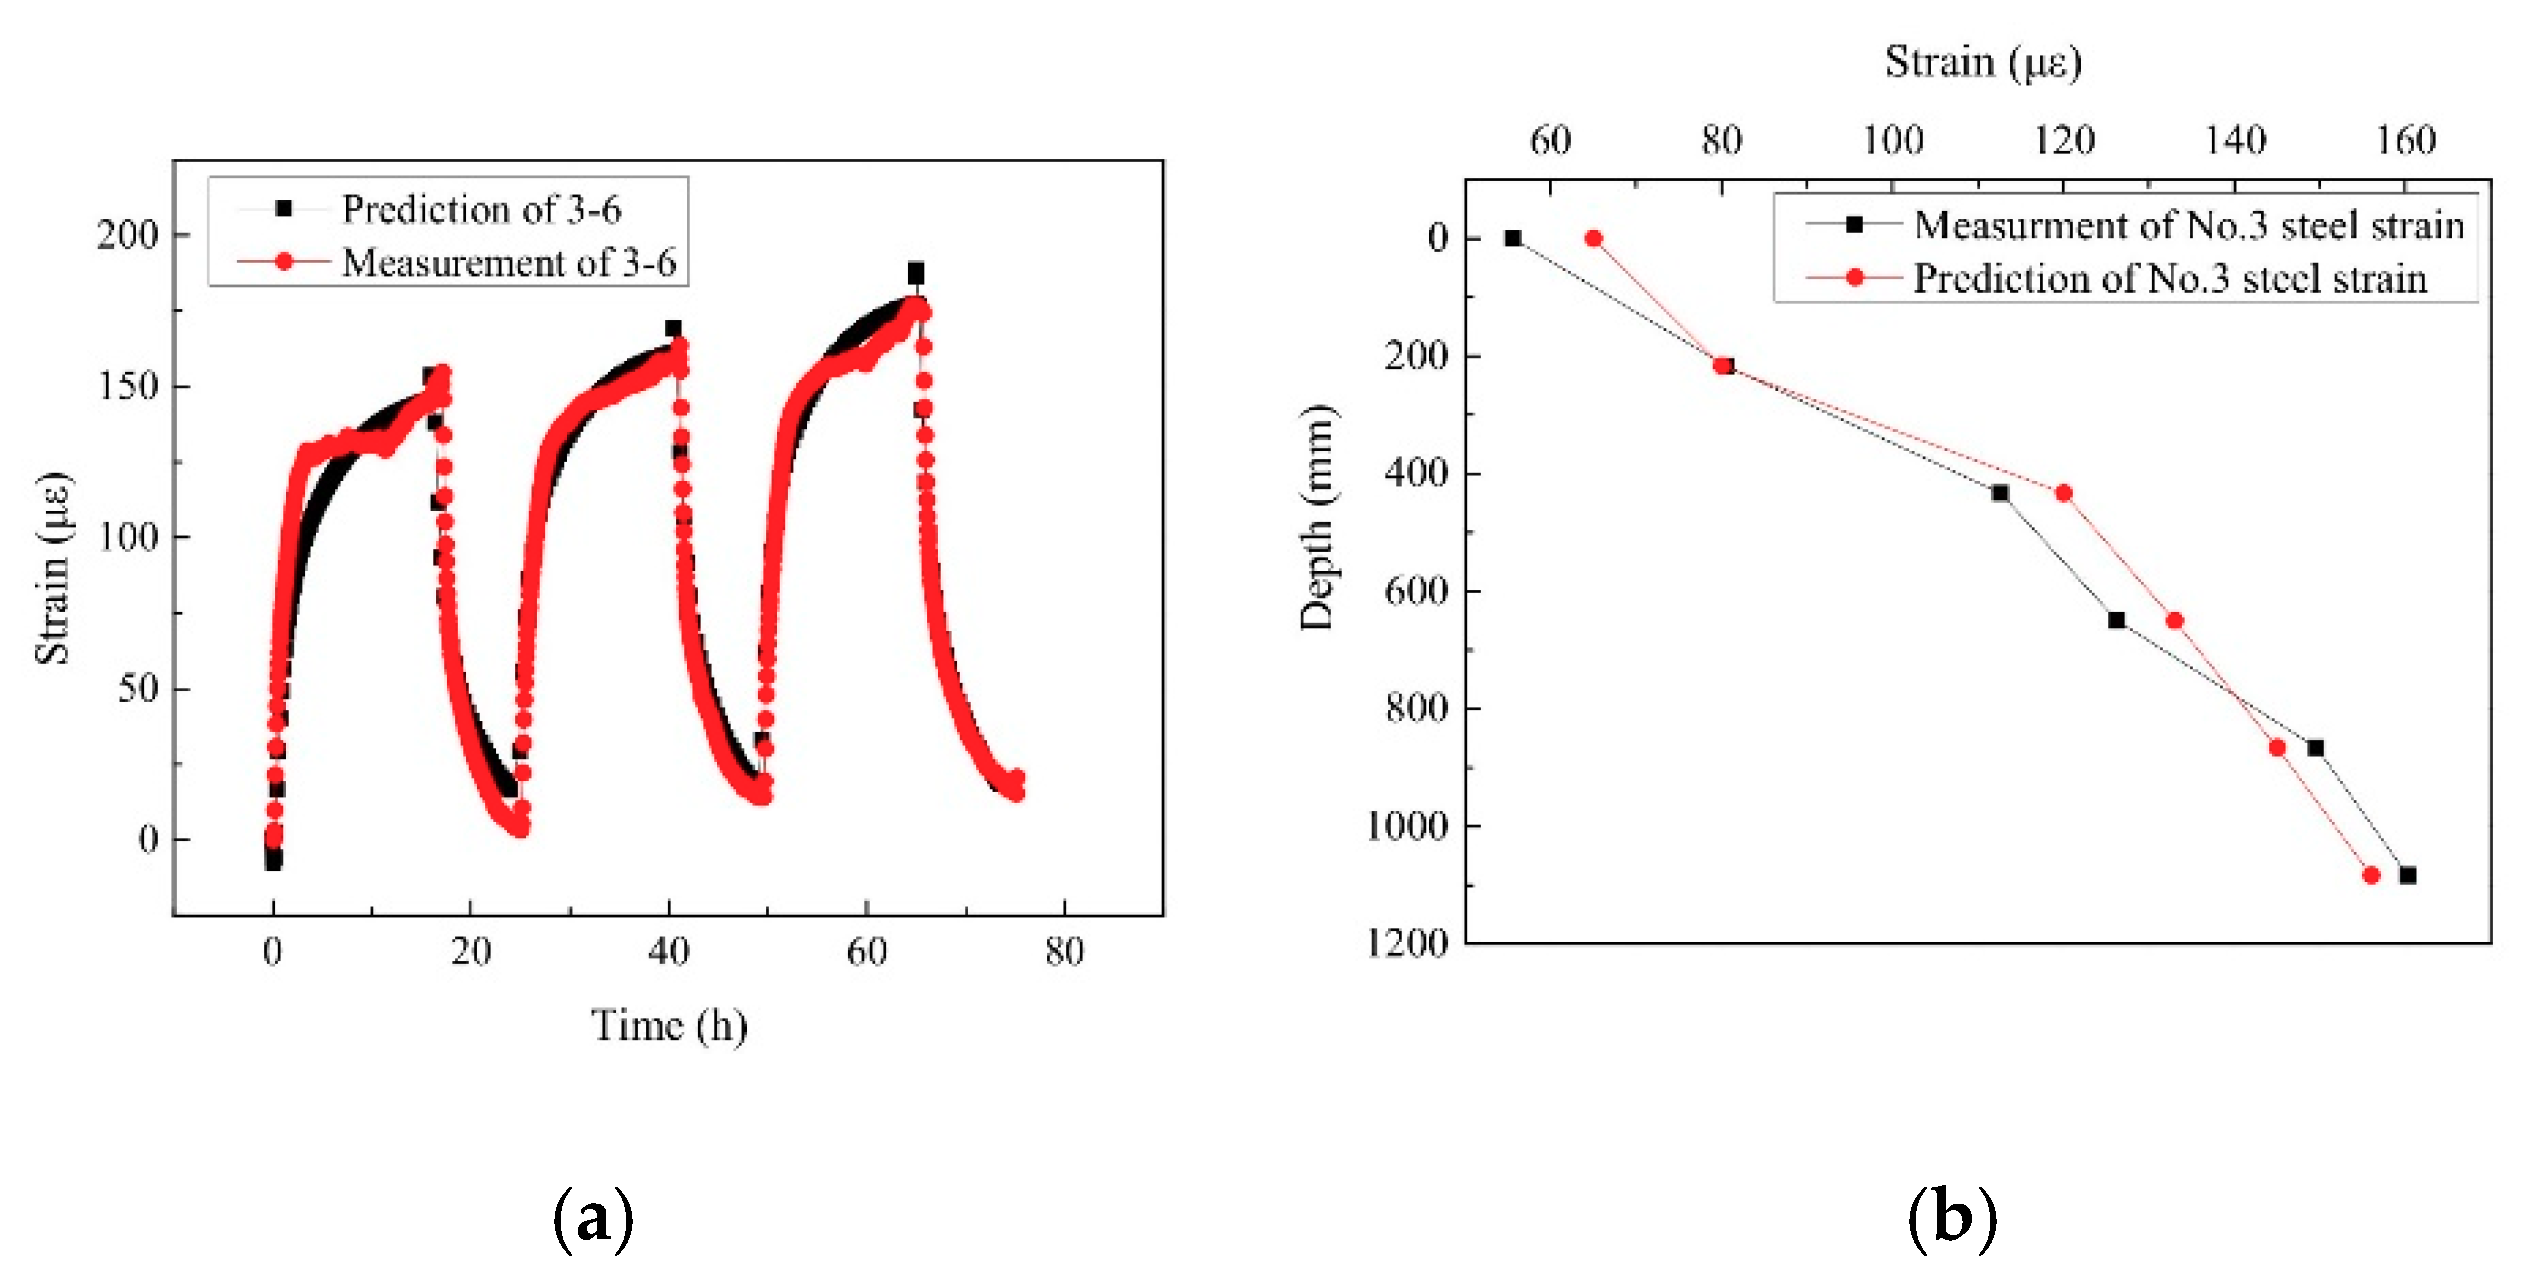
4.1.2. Strain Change in the Pile

The strain variation of the measuring point on No. 3 steel (No. 3–6) located at the depth of 1083 mm in the energy pile is shown in Figure 5a, and the figure shows that the test value and simulation value of strain change with time are in good agreement. Figure 5b shows the comparison between the experimental and simulated values for strain distribution along the depth. It can be seen that the experimental and simulated values are not completely matched due to the influence of the precision of the strain gauges and the simulation accuracy, but whether the strain changes with time or with depth, the variation trend of the test value and the simulation value are the same.

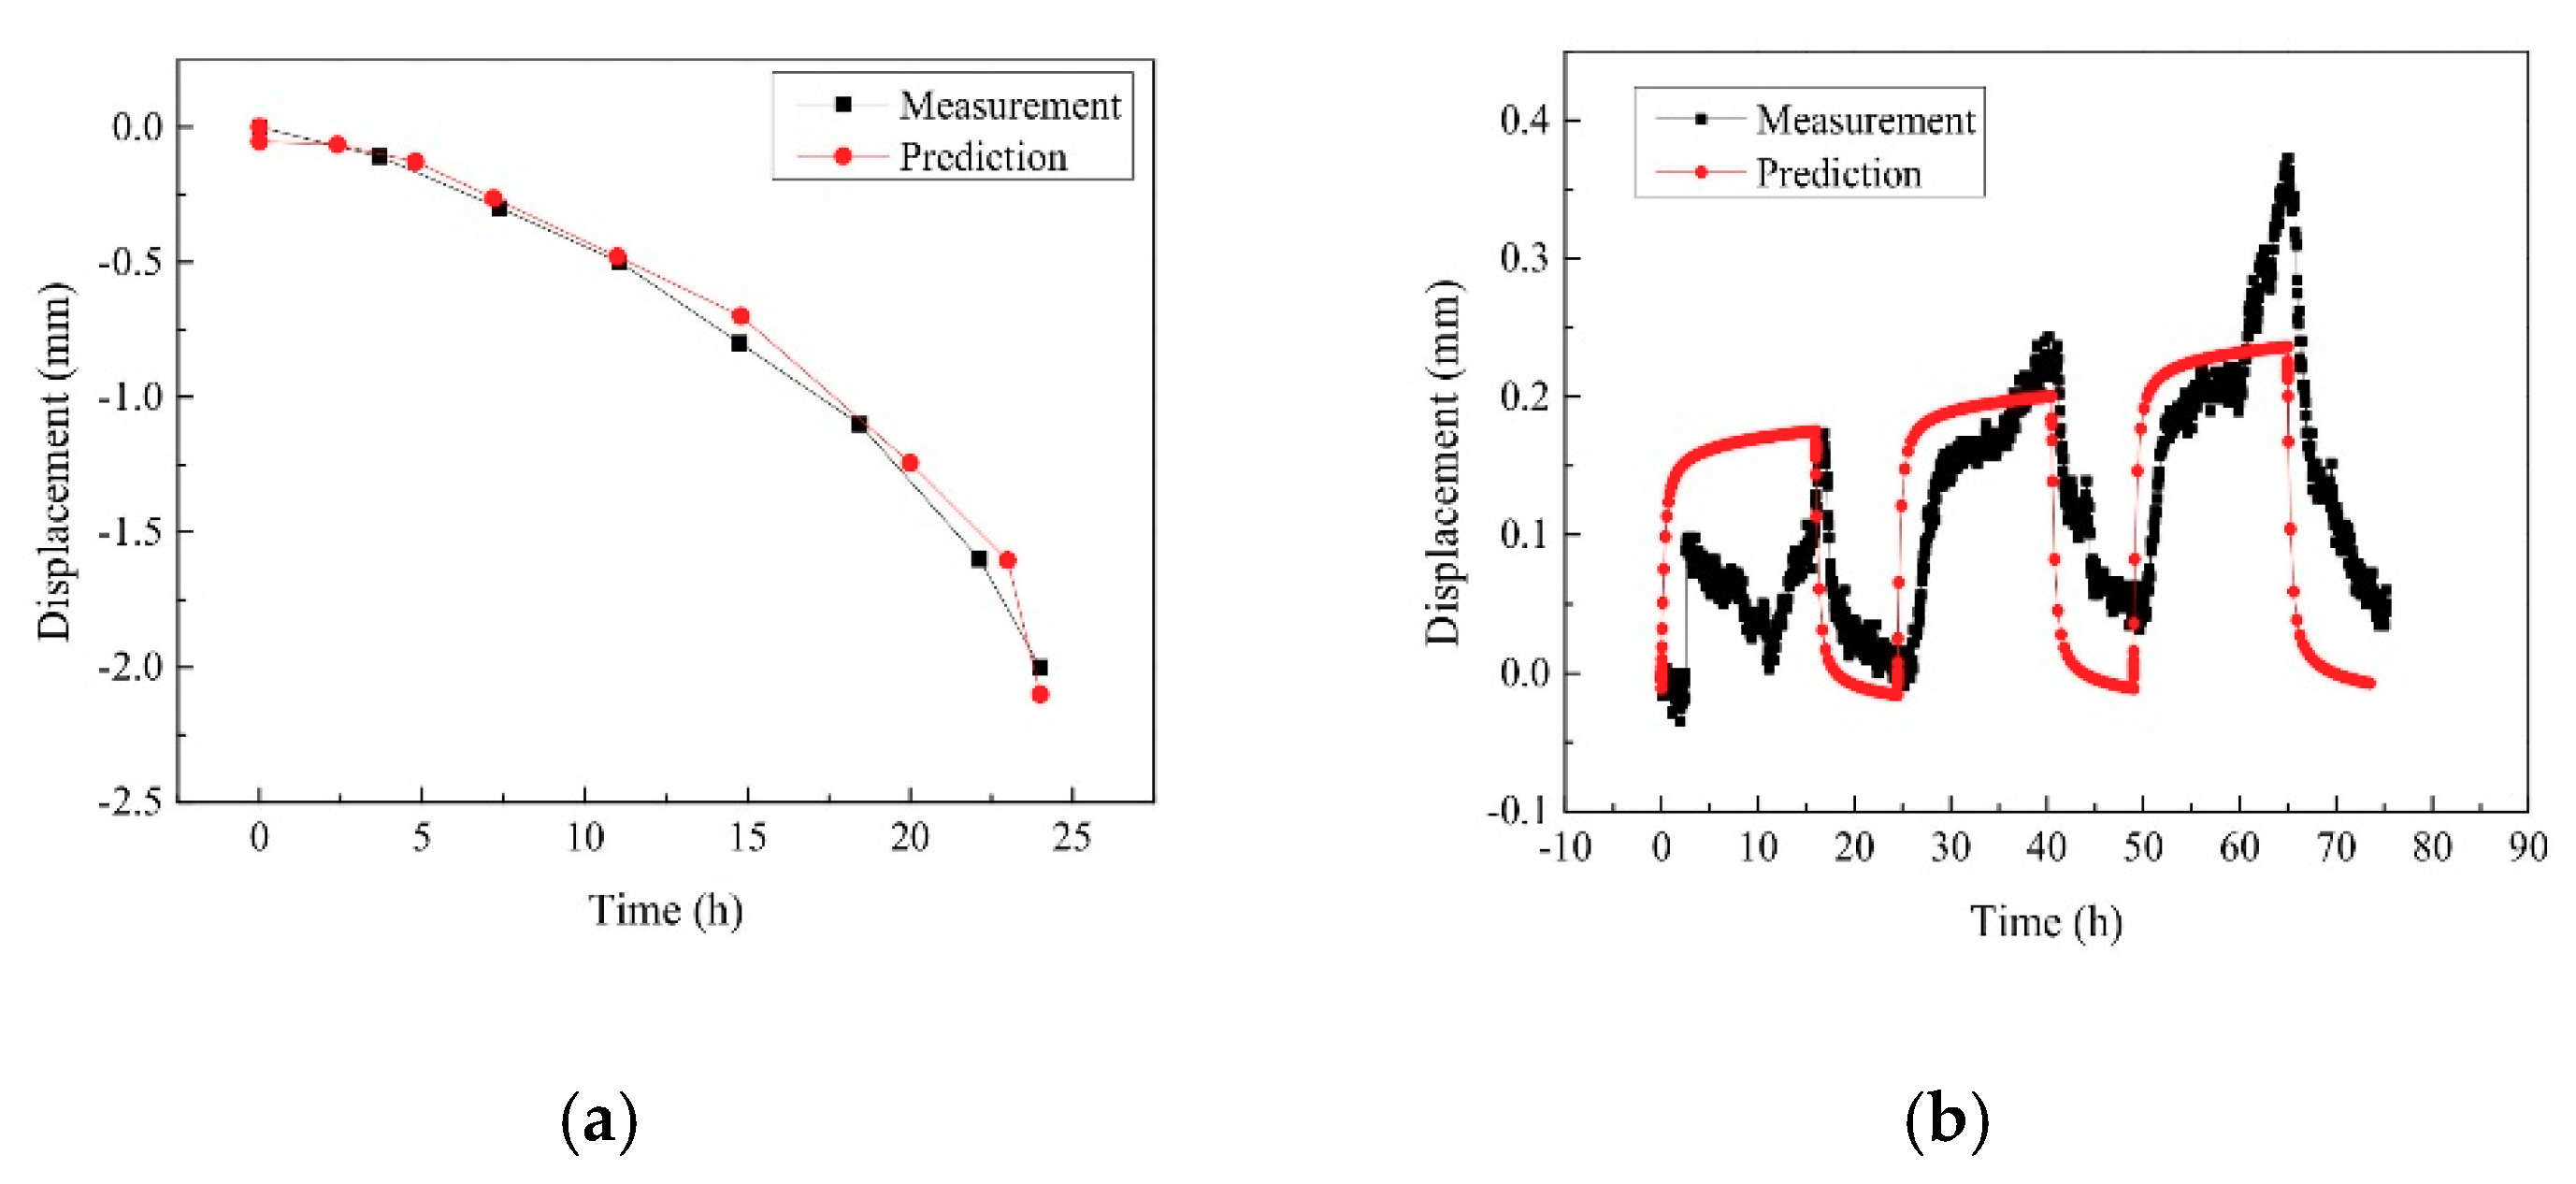
4.1.3. Pile Displacement

The experimental and simulation results of the pile head displacements at different loading stages are compared and shown in Figure 6. In the static loading stage on the pile head, the experimental values of pile displacement are in good agreement with the simulated values. In the thermal loading stage, the trend of the simulated displacement of the pile is consistent with the experimental result, that is, the displacement increased gradually with the increase of temperature, and the displacement accumulated with thermal cycles. For the difference between experimental and simulated values, one reason is the limitation of measuring accuracy, as the dial gauges might not be accurate enough to measure the small expansion of the energy pile under the thermal loading. Another reason is unrecoverable plastic thermal strain accumulated in the soil, and more attention should be paid on this aspect in future studies.

4.1.4. Soil Pressure around Pile

Figure 7 compares the experimental and simulation results of soil pressure around the pile at the measuring point (S31), located at the depth of 200 mm and 217 mm from the pile surface in a horizontal direction. Both experimental and simulation results show that the vertical soil pressure around the pile produced a certain accumulation with the number of thermal cycles. Except for the accumulated thermal stress due to unrecovered temperature, this indicates that the soil around the pile presented consolidation behavior during the thermal cycles. As the number of cycles increased, the degree of consolidation increased, and the peak value of soil pressure also increased. Although their peak values are similar, there are still some differences in the process. The reason for the differences in results between the experiment and simulation may be attributable to the additional soil pressure generated by thermal loading being small and the accuracy of the soil pressure cell being limited. Another reason may that the soil pressure cell was in a three-directional compression state in the soil, however its reading only represented the soil pressure in the vertical direction. The phenomenon of thermo-consolidation was also confirmed by the temperature controlled triaxial test results [27], which revealed that the temperature had a great influence on the accumulative plastic strain, pore water pressure, damping ratio, and dynamic elastic modulus of soft soil.

4.2. Comparison between PC pile and Ordinary Pile

Although there was a little difference in soil behavior between the experiment and simulation, in general, the numerical model could simulate the behavior of the energy piles quite well, and the accuracy of the model was confirmed. As only one energy pile was tested each time during the experiments, due to the boundary effect of model test, the test conditions of different piles could not be completely controlled, in order to be the same each time. Therefore, in order to further compare the thermal responses of the PC energy pile with the ordinary energy pile, numerical simulations on the two piles were carried out under a thermal loading with ΔT = 20 °C for a heating period of 16 h and a cooling period of 8.5 h. Each simulation considered the influence of only one factor and the rest of the factors were kept the same for both piles.

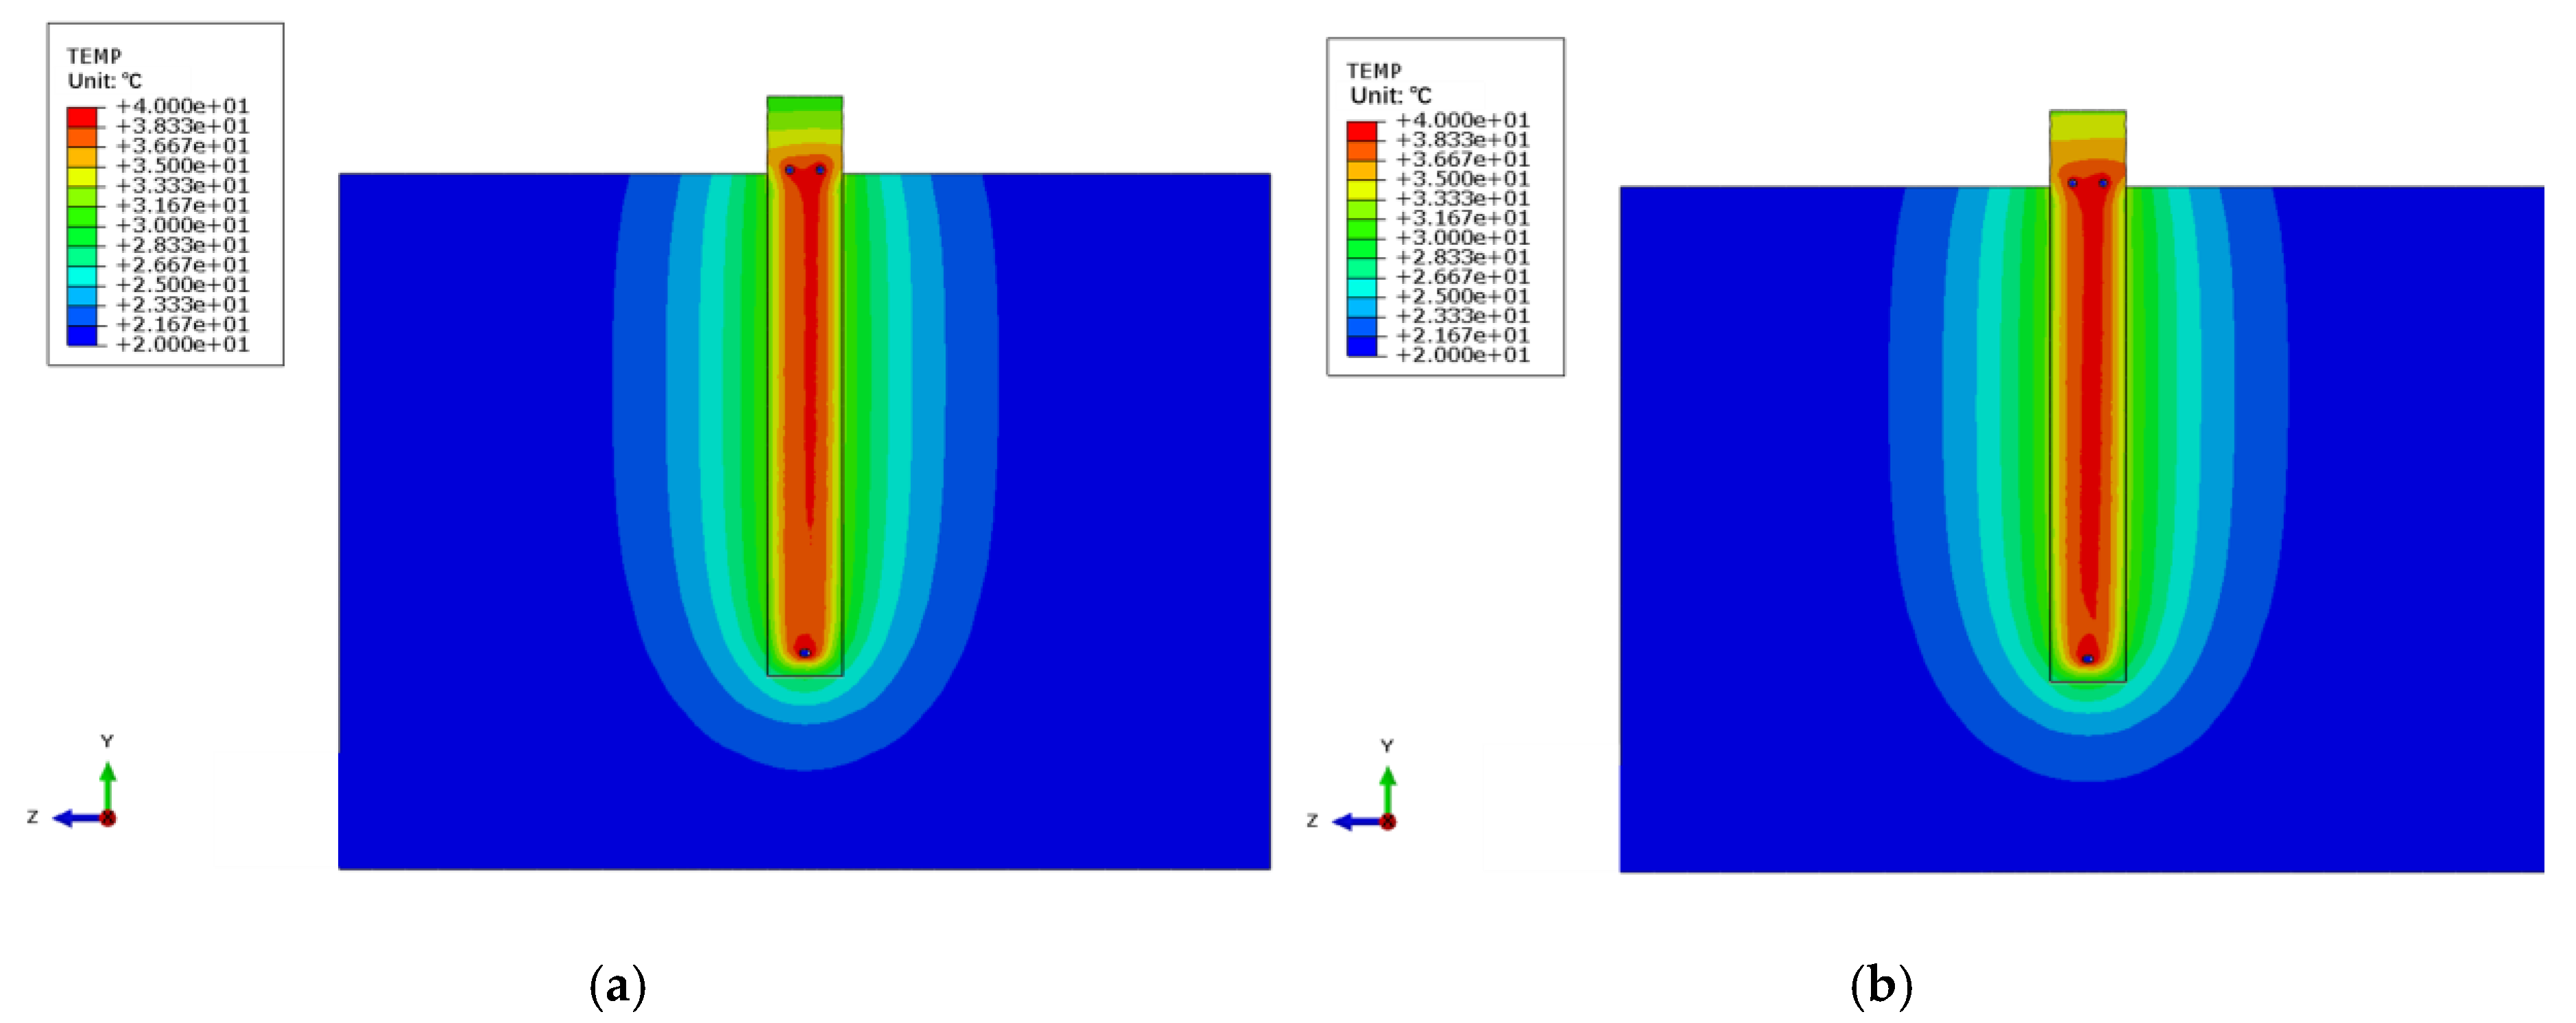
4.2.1. Temperature Change of Pile

The temperature variation of the measuring point located at the depth of 217 mm on the PC pile surface was analyzed and compared with that of the ordinary concrete pile, as shown in Figure 8. Under the same thermal loading, the temperature change of the PC pile was smaller than that of the ordinary pile during the whole heating process. After heating for 1 h, the temperature of the ordinary pile was 26.5 °C, whereas the temperature of the PC pile was 23.8 °C and the temperature difference was 2.7 °C. This is because the thermal temperature was near the range of the phase change temperature (20 °C–22.5 °C) of the PC materials, and the materials melted and absorbed heat energy. With the increase of heating time, the temperature changed beyond the range of the phase change temperature, such that the PC materials no longer played the role of absorbing heat. Thus, at the end of heating for 16 h, the temperature of the ordinary pile was 32.3 °C, while that of the PC pile was 31.7 °C, presenting a small temperature difference of 0.6 °C between the two piles. In the early stage of cooling, the trend of temperature change of the ordinary pile and PC pile was basically the same. However, when the temperature dropped below 22.5 °C in the range of phase transition, the temperature of the PC pile decreased more slowly than that of the ordinary pile, due to the exothermic solidification of the PC materials. From the above analysis, it can be seen that the addition of PC materials can reduce the thermal response of the energy pile.
The temperature distribution of the PC pile and the ordinary pile at the end of heating stage is shown in Figure 9. It can be seen from the figure that the temperature of the PC pile and surrounding soil is slightly lower than that of the ordinary pile. With the addition of PC material, the range of temperature change decreased from 0.45 m to 0.42 m, because of the heat absorbing function of the PC pile. Compared with ordinary piles, the main heat exchange range between PC piles and the soil was much reduced. For dense urban underground space structures, when keeping the same total heat exchange rate, the reduction of heat influence range on surrounding soil environment can reduce the impact on adjacent underground structures, and significantly save underground space resources.

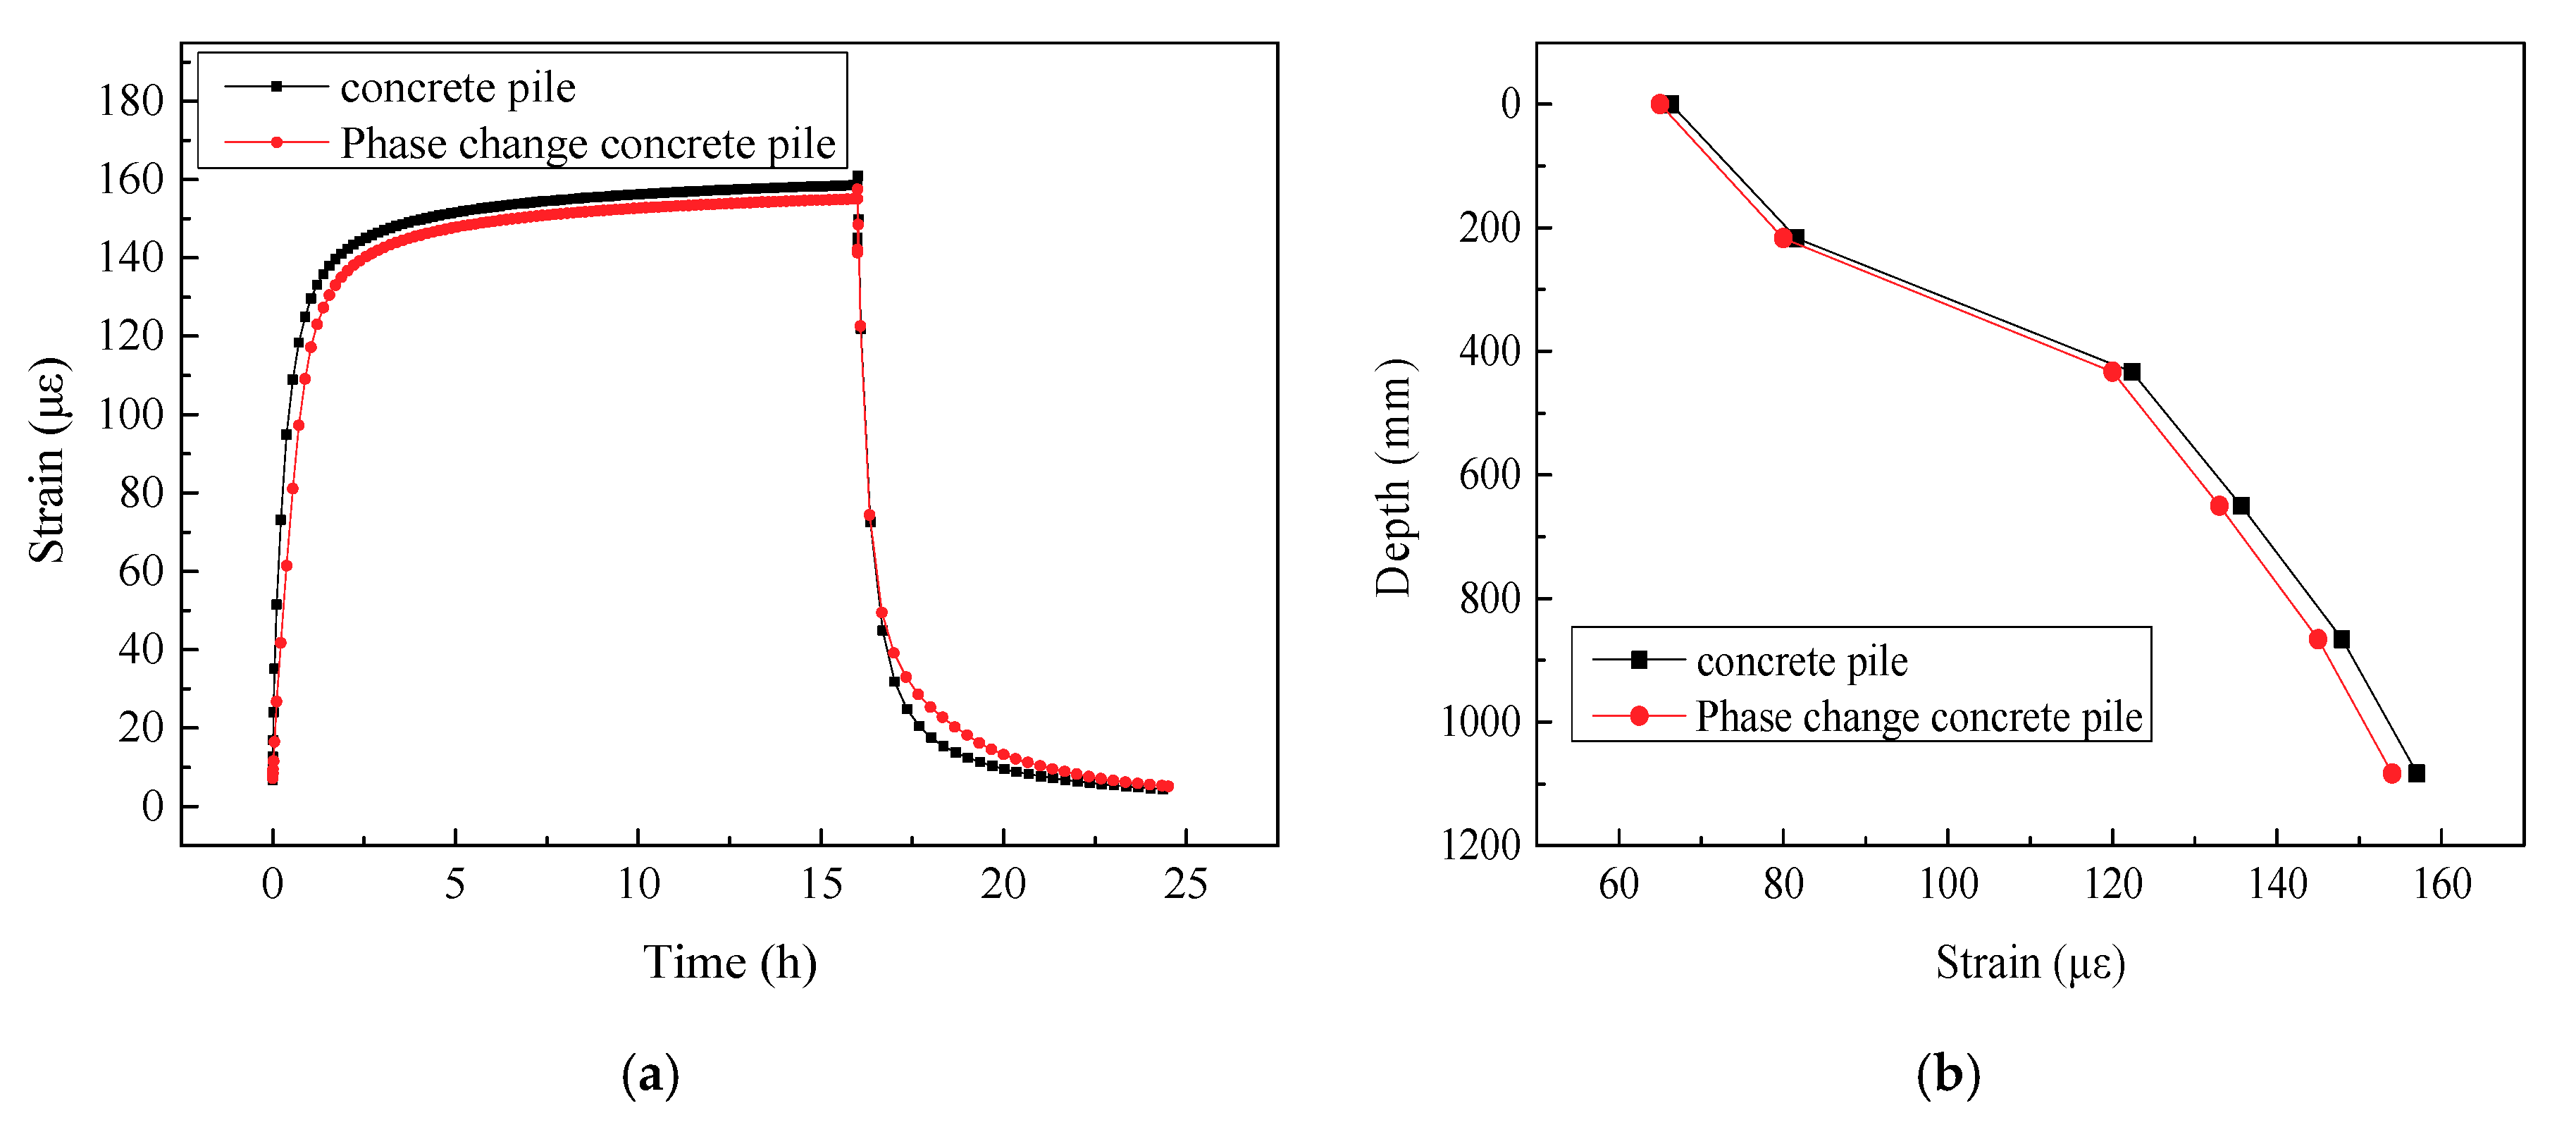
4.2.2. Strain in Pile

The variation of the strain of the ordinary energy pile and PC pile is analyzed at the measuring point located at the depth of 1083 mm on No. 3 steel, as shown in Figure 10a. It can be seen from the figure that the trend of strain change is almost the same with the trend of temperature change. After 1 h of heating, because of the temperature difference between the PC pile and the ordinary pile, the strain value of the ordinary pile was 124.2 με, whereas it was 108.5 με for the PC pile, showing a strain difference of 15.7 με. At the end of heating for 16 h, the strain of the ordinary pile and the PC pile were 161.3 με and 157.2 με, respectively, with a difference of 4.1 με. At the initial stage of cooling, the strain changes of the ordinary pile and the PC pile were basically the same, and the strain of the PC pile was smaller than that of the ordinary pile due to the heat release by paraffin solidification. Finally, the strain tended to be consistent, resulting in a small amount of strain accumulation. Figure 10b shows the variation of strain along the depth of the ordinary pile and the PC pile at the end of heating. The strain of the PC pile is about 2% less than that of the ordinary pile, which shows that the addition of PC materials can reduce the stress of the pile for the same pile constraint. Considering the long-term cycles of thermal loading during the service life, the durability of the pile can be improved due to this reduction of thermal effect.

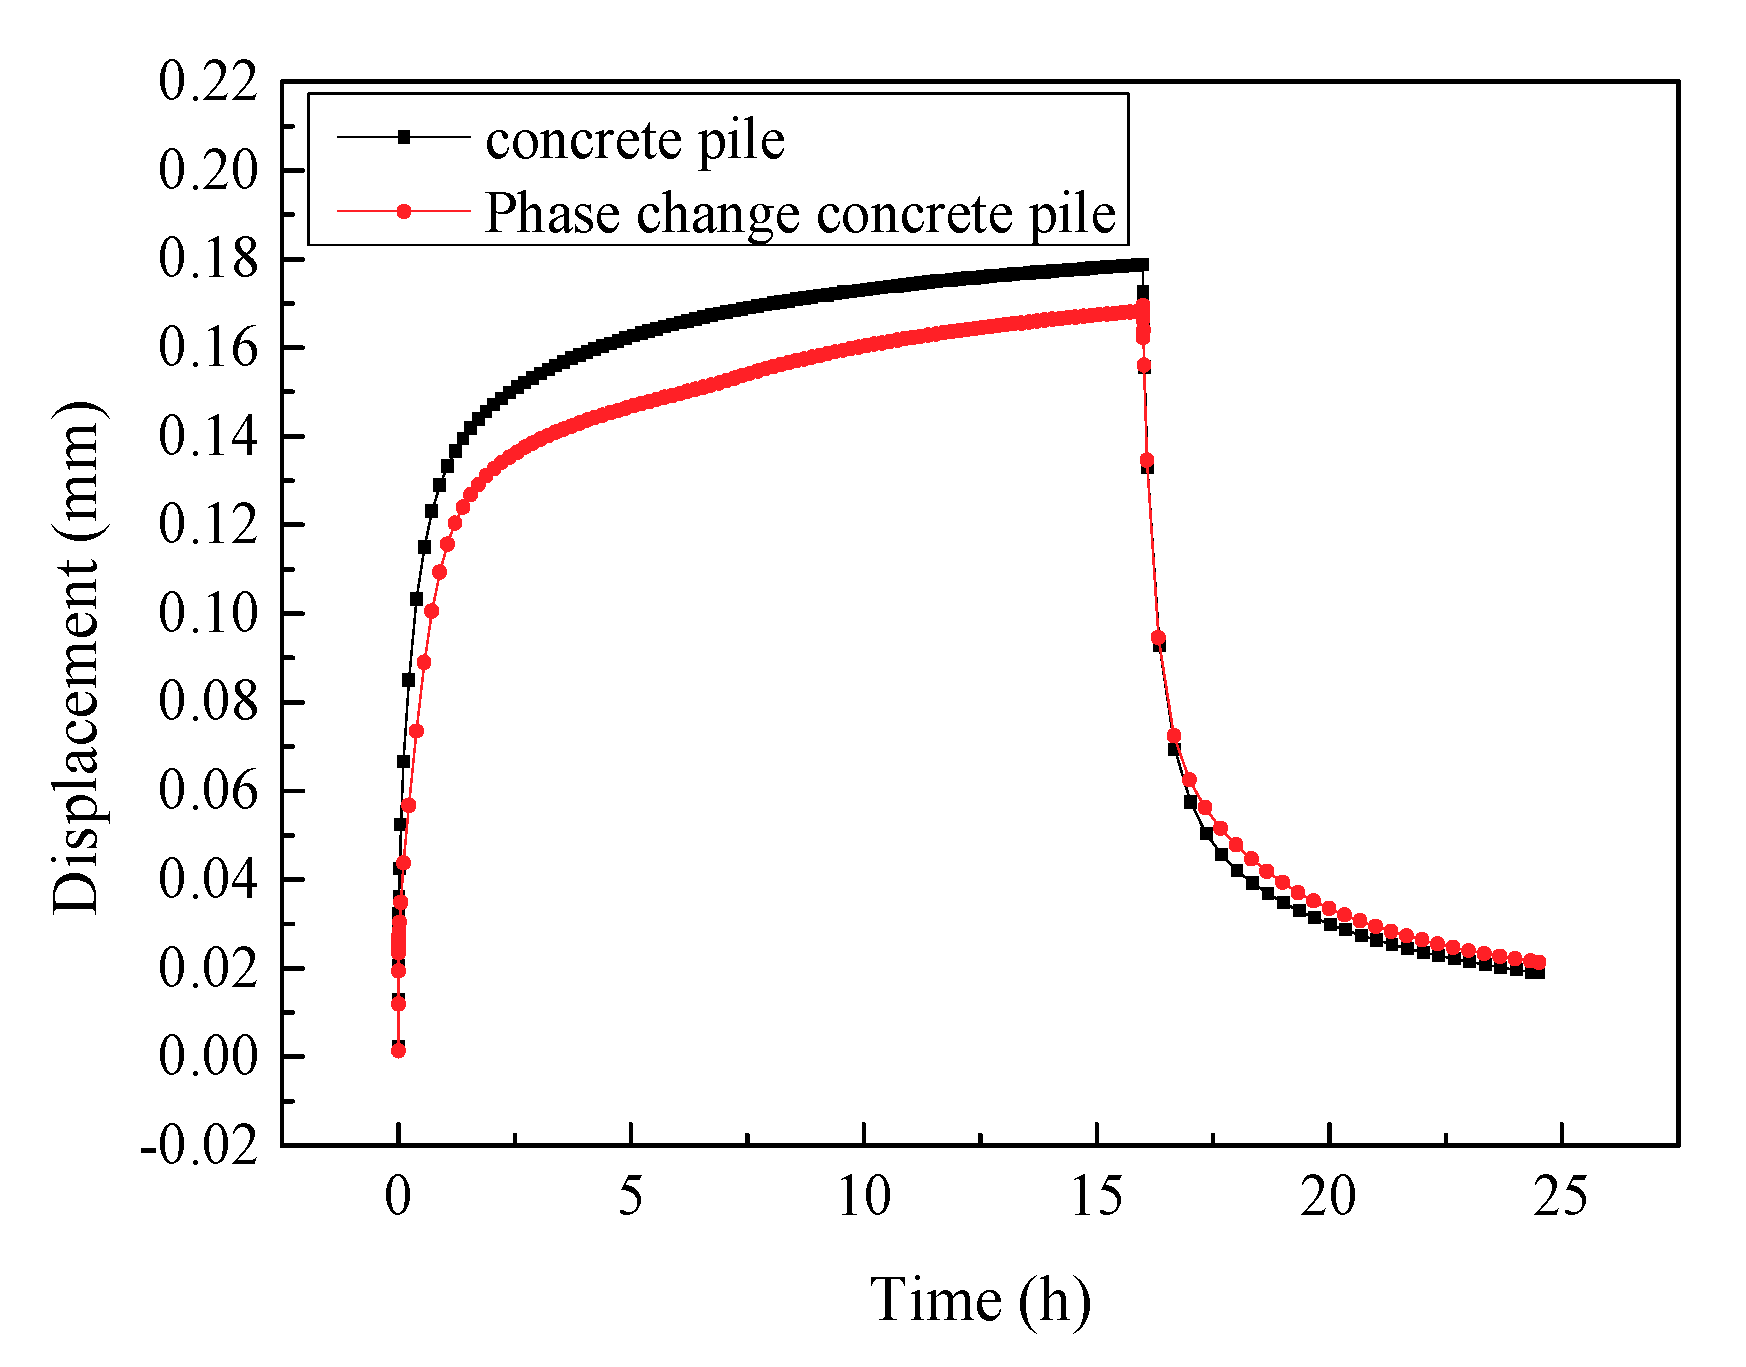
4.2.3. The Displacement of Pile

Due to the heat absorption of PC materials, the expansion of the pile body and the upward displacement of the pile head decreased compared with the ordinary pile, as shown in Figure 11. After heating for 1 h, the displacement of the PC pile was 0.116 mm, and reduced by 13% compared with the ordinary pile (0.133 mm). Similar to the trend of the temperature results, the difference of displacement became large and then decreased gradually. At the end of cooling, the displacement of the ordinary pile and the PC pile were 0.019 mm and 0.021 mm, respectively. This implies the plastic deformation of the two piles was almost the same.

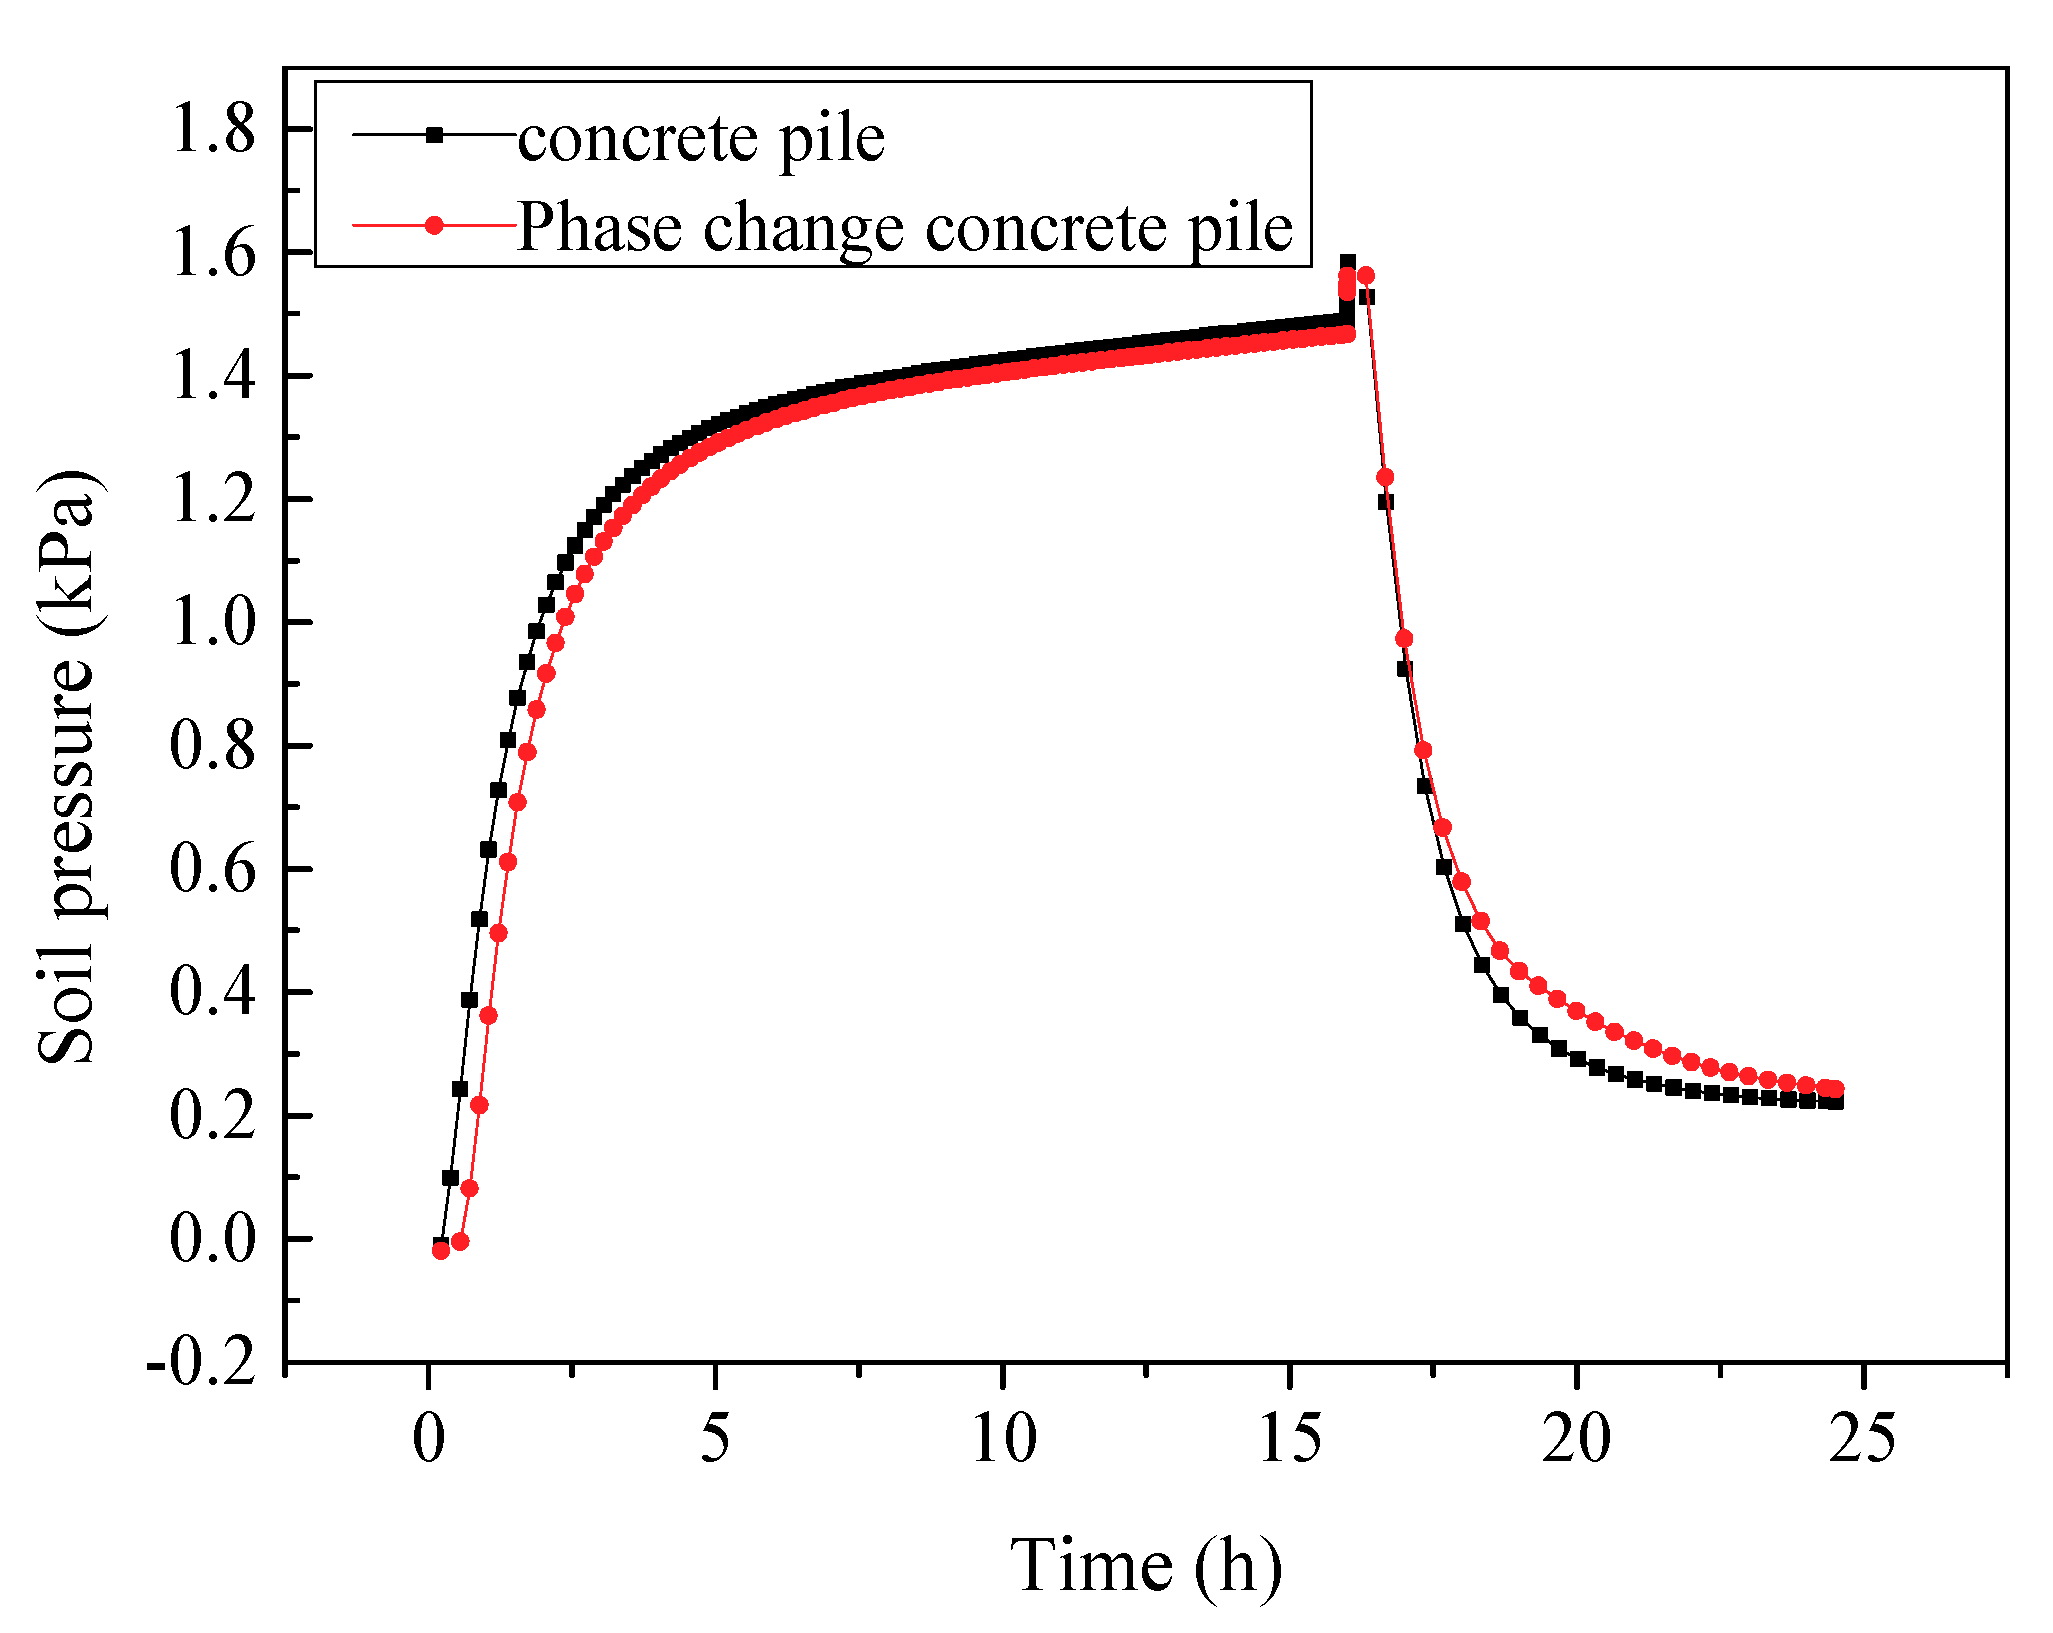
4.2.4. Soil Pressure around Pile

Figure 12 shows the change of soil pressure around the PC pile compared with the ordinary pile. After heating for 1 h, the soil pressure at the measuring point of the ordinary pile was 0.63 kPa, while it was 0.36 kPa for the PC pile, and the difference was 0.27 kPa. After heating for 16 h, the soil pressure around the ordinary pile and PC pile was more or less the same, with a difference of only 0.02 kPa. Apparently, the soil pressure around the ordinary pile was greater than that around the PC pile at the initial stage of heating, and the pressure difference decreased gradually with the increase of heating time. It can also be seen from the figure that the difference of soil pressure around the two piles is smaller than the differences observed for the temperature and strain results at the end of heating. This is because the heat stored in the pile was slowly released to the soil, and the temperature change in the soil was less than that in the pile.

4.3. Influence of Thermal Loads on PC Piles

In cases of PC energy piles, the larger the thermal load, the greater the heat transfer rate. However, too high a thermal load would affect the mechanical characteristics of the pile and functions of the PC materials. Therefore, the mechanical behaviors of a PC pile under three different thermal loads ( Δ T = 10 °C, Δ T = 20 °C, and Δ T = 30 °C), and over a heating period of 16 h and cooling period of 8.5 h were simulated, respectively.

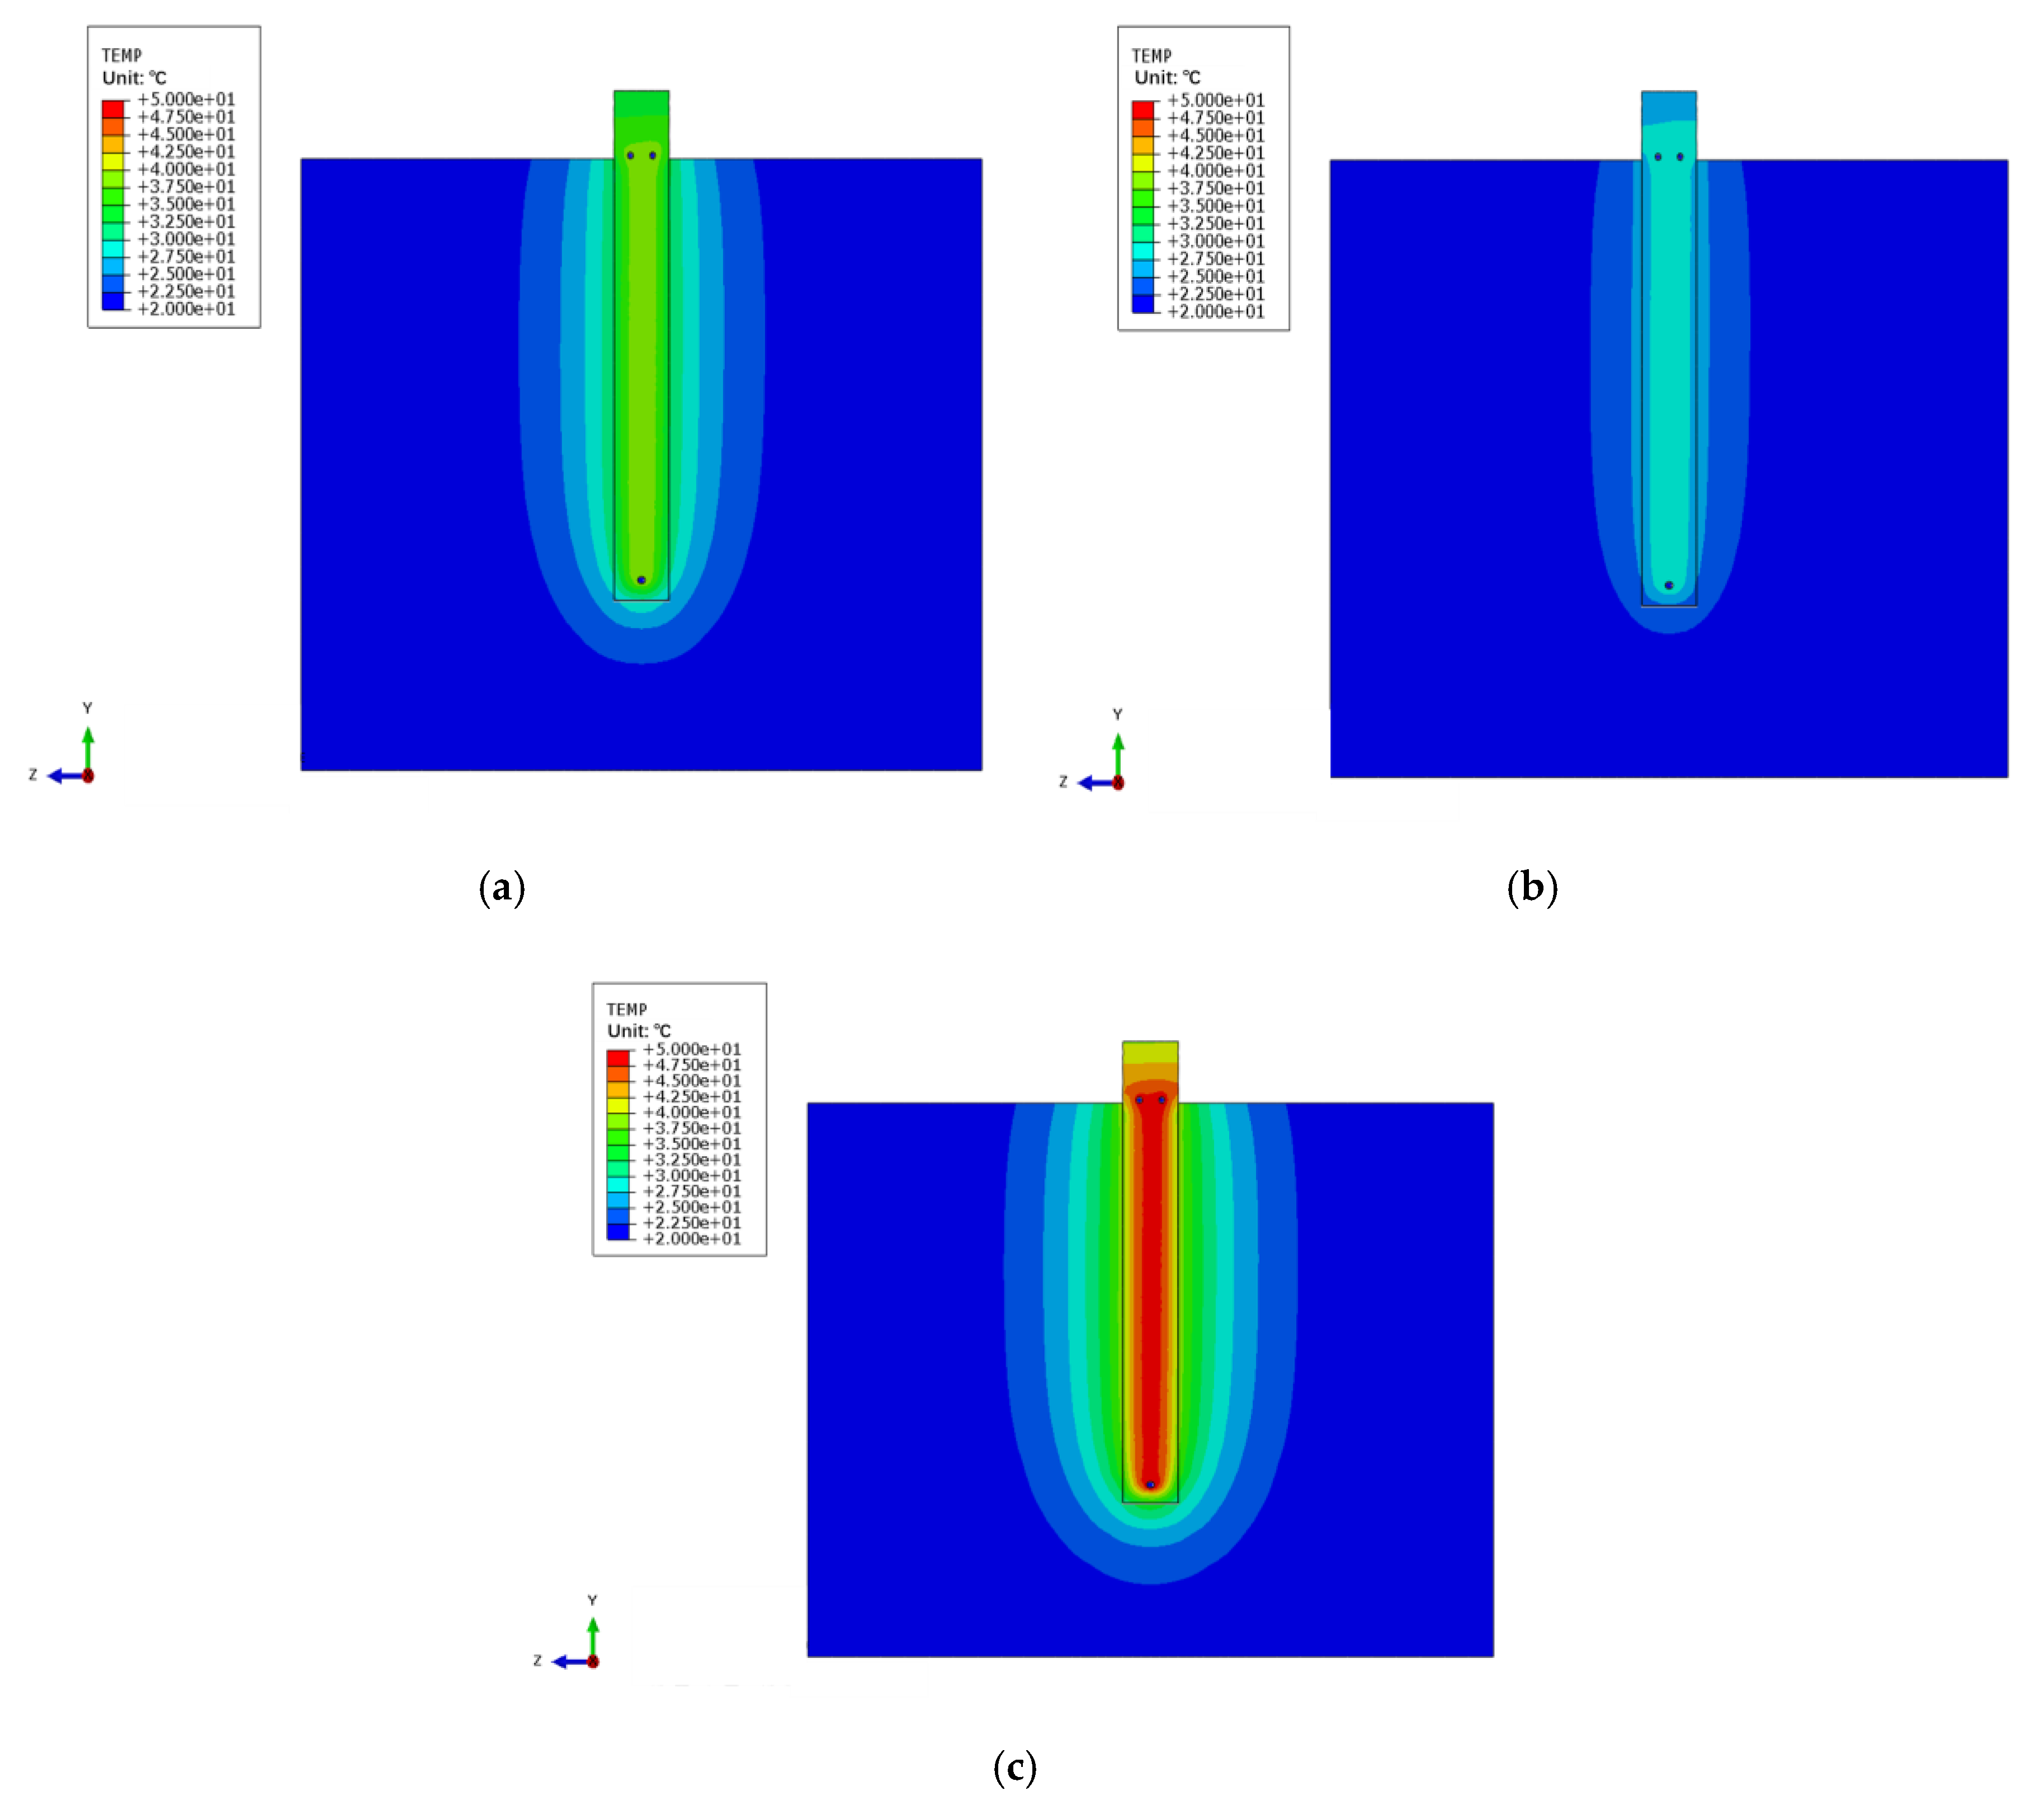
4.3.1. Temperature Change

The temperature distribution of the soil and PC pile after heating for 16 h under different thermal loads is shown in Figure 13. Generally, the temperature values and the influence range increased with the thermal loads. With the increase of thermal loads, the influence range of the soil around the pile increased, but the growth rate became small. The influence ranges of heat exchange in the soil were about 0.2 m, 0.4 m, and 0.45 m in the radial direction of the pile under the three thermal loads of Δ T = 10 °C, Δ T = 20 °C, and Δ T = 30 °C, respectively.

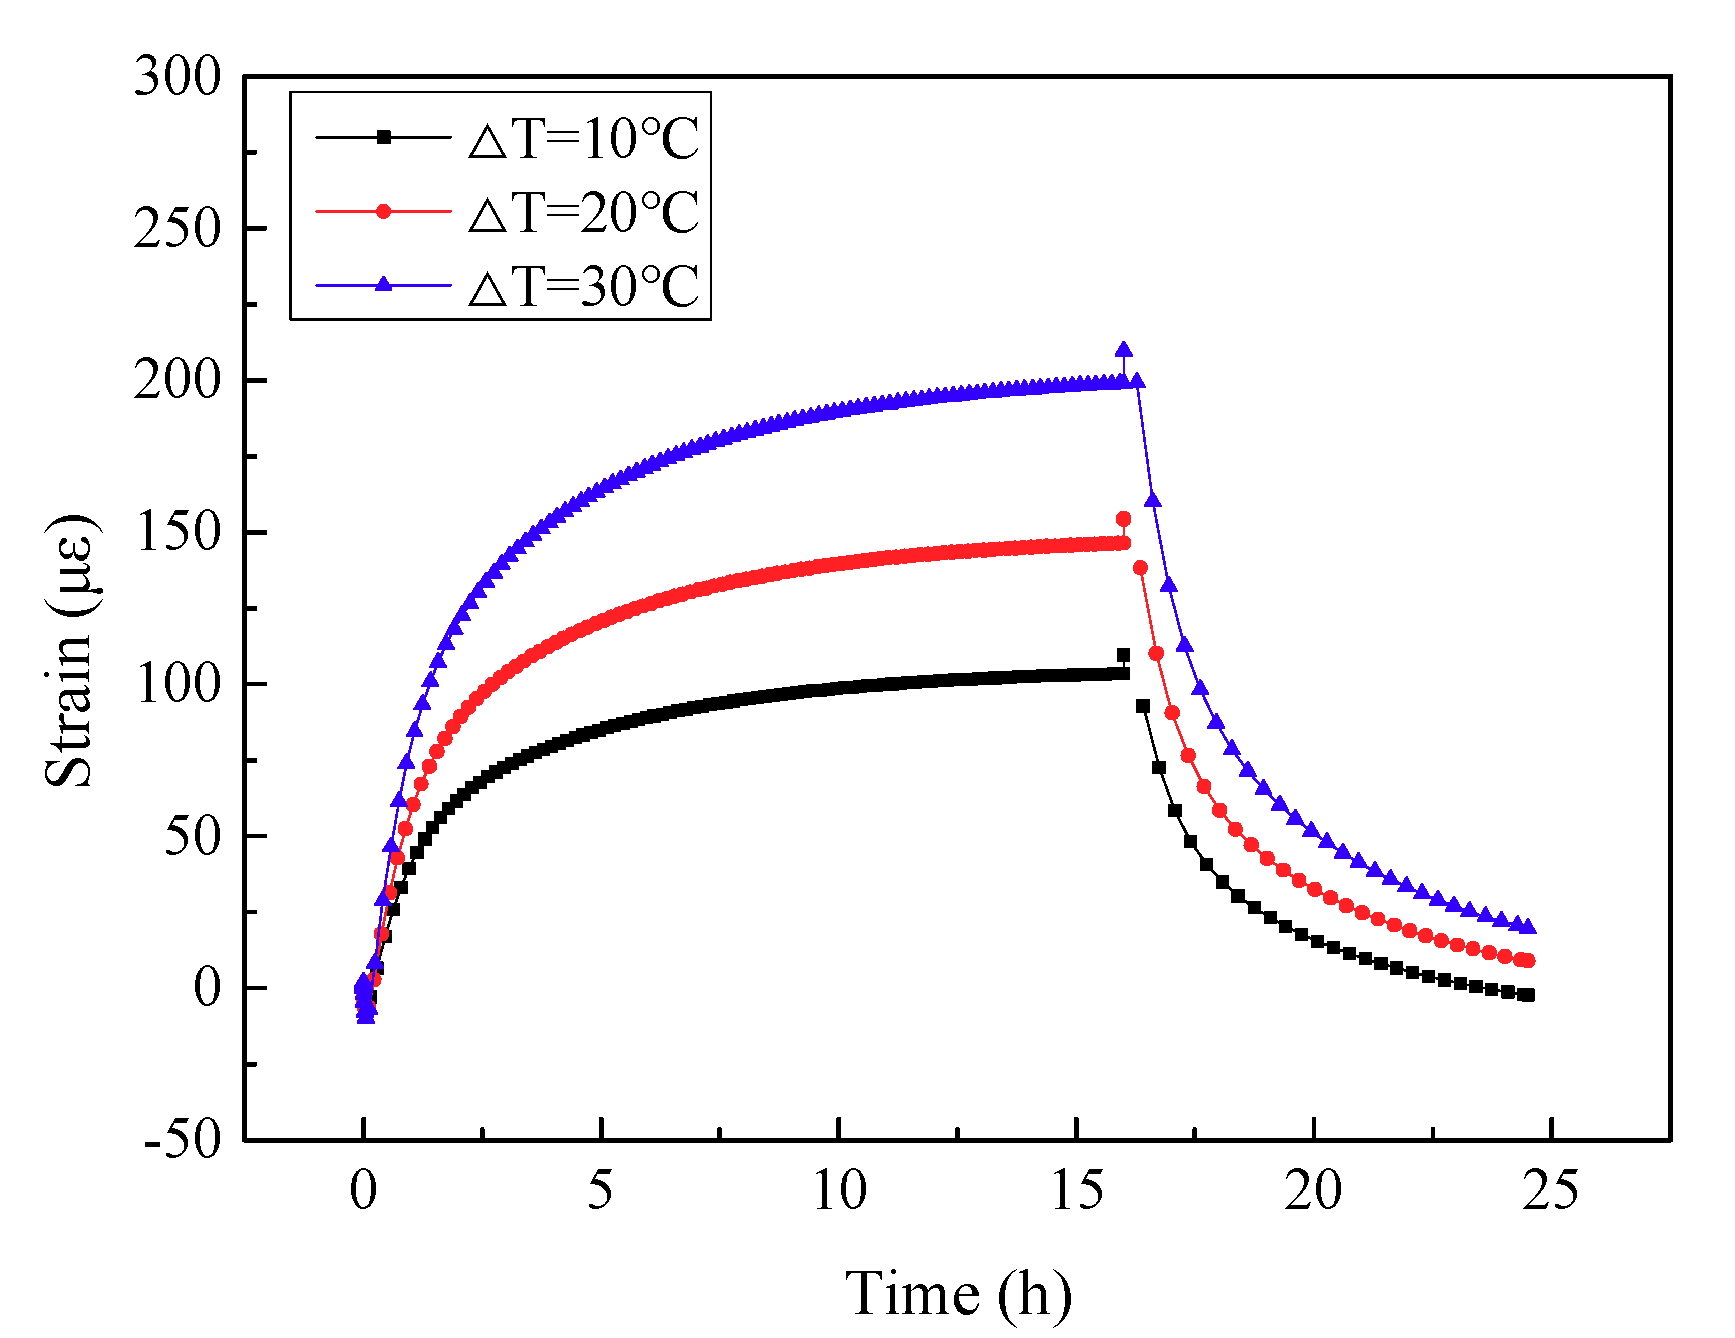
4.3.2. Strain Change in PC Pile

The strain curves of the measuring point located at the depth of 1083 mm on No.3 steel under different thermal loads are shown in Figure 14. As seen from the figure, the peak strain at the end of heating increased with the increase of the thermal loads. The simulated values were 109.5 με, 154.2 με, and 209.4 με, respectively, and the increase of the peak strain was not linear. The strain increment also increased with the increase of thermal loads, the corresponding peak strain increased about 40% when the thermal load increased from 10 °C to 20 °C, and the corresponding peak strain increased about 91% when the thermal load increased from 20 °C to 30 °C. In the cooling stage, the decreasing trend of strain in the three thermal loading conditions was basically the same, and the residual strain was 1.5 με, 8.9με, and 19.5με, respectively. That is, the residual strain increased with the increase of thermal loads.
Figure 15 shows the comparison of axial strain and stress of the PC pile under different thermal loads of Δ T = 30 °C, Δ T = 40 °C, and Δ T = 50 °C, respectively. It can be seen from the figure that the higher the thermal load, the greater the expansion of the pile. As the thermal load increased, the strain and axial force increased, but the increment ratio decreased slightly. The strain and axial stress of the pile are affected by the restraint conditions. For the present conditions, as a typical friction pile in medium-density sand, the toe of the pile was less restrained, so the axial force at the end of pile was relatively small.

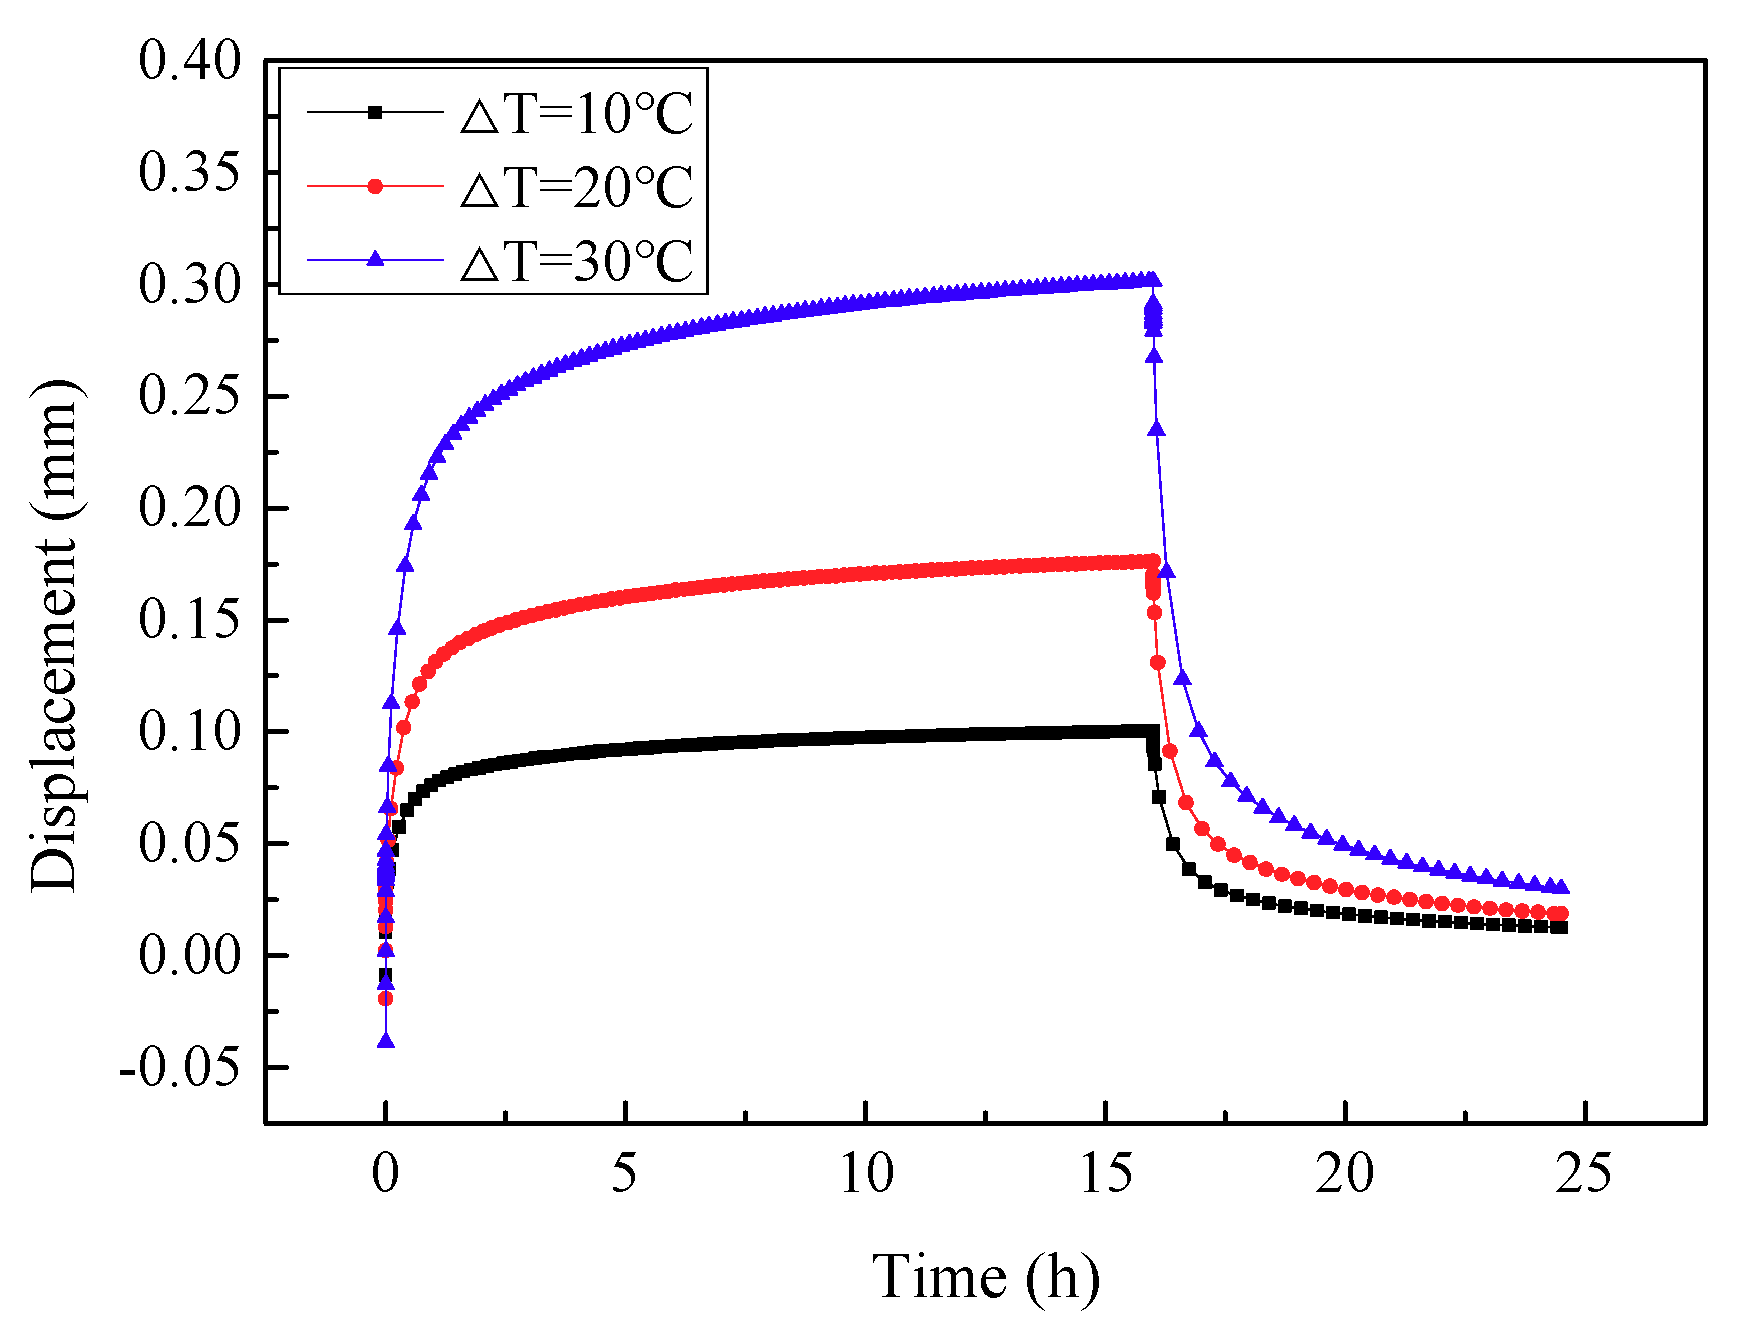
4.3.3. Displacement on Pile Head

The displacements of the pile head with time under different thermal loads are shown in Figure 16. It can be seen from the figure that the values of displacement were 0.096 mm, 0.168 mm, and 0.289 mm under the three thermal loads of Δ T = 10 °C, Δ T = 20 °C, and Δ T = 30 °C, respectively. Clearly, the displacement of the pile head gradually increased with the increase of thermal loads. Similarly to the strain results, the increase of the displacement was also not linear. Comparing the displacement changes under the three thermal load conditions in the heating stage, it was also found that the value of displacement increased by 0.006 mm, 0.013 mm, and 0.023 mm, respectively, when heating from 4 h to 16 h, meaning that with the increase of thermal loading, the increment of displacement increased during the period of 4 h to 16 h. At Δ T = 10 °C, the effect of phase-change paraffin on the displacement of the pile was the greatest (the temperature of the circulating fluid was in the range of the phase-change temperature of paraffin), and the peak value of the displacement was reduced. When the thermal loading increased, due to the large amount of heat beyond the paraffin phase change heat storage range, the effect of phase change on the temperature and displacement change of pile was getting smaller. At the end of cooling, the plastic displacements under the three thermal conditions were 0.012 mm, 0.018 mm, and 0.029 mm, respectively. The influence of paraffin on plastic displacement decreased with the increase of thermal loading. Therefore, the design of the PC pile should match the phase change temperature of materials and the actual working temperature conditions of the energy pile to achieve better heat storage and a high efficiency of energy utilization.

5. Conclusions

In this study, the thermo-mechanical characteristics of the PC energy pile were studied through numerical analysis, and the influence of thermal loading on the performance of the PC piles was also examined. According to the experimental and simulation results, the proposed numerical method could model the thermo-mechanical behavior of energy piles and reproduce the experiment results quite well. Based on this study, the following major conclusions were drawn:
(1)
Phase change materials can be used in energy piles to reduce the temperature change of the pile to a certain extent. At the end of heating, the temperature of the PC pile was 0.6 °C lower than that of ordinary energy pile without phase change materials. When the temperature dropped below 22.5 °C, the temperature decreased more slowly than the ordinary pile due to the exothermic phase change of paraffin, and the range of soil temperature change around the pile reduced by 0.03 m compared to the ordinary pile.
(2)
At the end of heating, the strain at the measuring point of the phase change energy pile was 2% smaller than that of the ordinary energy pile, and the displacement was reduced by 6%, which shows that the addition of phase change materials can reduce the thermal response of the energy pile compared with ordinary pile. Moreover, the stress distribution in the pile can be reduced and consequently the durability of the pile can be improved. After the thermal cycles, the residual deformation was basically the same.
(3)
The difference in the soil pressure change around the PC pile at the end of heating was small, indicating that the addition of phase change materials has little effect on the soil pressure around the pile.
(4)
When the thermal load increased from 10 °C to 30 °C, the exchange range between pile and soil increased from 0.2 m to 0.45 m, and the growth rate decreased with the increase in thermal loading. The pile strain showed a nonlinear increasing trend with the increase of thermal loading. Meanwhile, the observed strain and axial stress of the pile increased with the increase of the depth.
(5)
In the heating stage, the increment of the displacement at the head of the PC pile increased with the increase of the thermal loading. After the cooling stage, the residual strain and plastic displacement also increased with the increase of the thermal loading. At the loading condition of Δ T = 10 °C, the phase change material had the greatest influence on the displacement and residual strain of the pile. With the increase of the thermal loading, its influence became less and less obvious. Therefore, in the design of phase change energy piles, full consideration should be given to the compatibility of the thermal loads and the phase-change temperature of the material. While phase-change material is of great potential for use in controlling the thermal response of energy piles, more attention should be paid to balance the heat transfer rate and the thermal response of the pile.

Author Contributions

Conceptualization, X.B., and H.C.; methodology, T.D., Y.L., and X.B.; software, T.D., and Y.L.; validation, Y.L., T.D. and X.B.; formal analysis, X.B.; investigation, X.B., H.C.; resources, X.B., H.C.; data curation, X.B., H.C.; writing—original draft preparation, T.D., Y.L., W.T. and X.B.; writing—review and editing, X.B., H.C., and W.T.; visualization, T.D., Y.L.; supervision, X.B., H.C.; project administration, H.C.; funding acquisition, H.C. All authors have read and agreed to the published version of the manuscript.

Funding

This research was funded by the national Natural Science Foundation of China, grant number 51925804.

Acknowledgments

This research is fully supported by the national Natural Science Foundation of China (No. 51925804).

Conflicts of Interest

The authors declare no conflict of interest.

References

  1. Adinolfi, M.; Loria, A.F.R.; Laloui, L.; Aversa, S. Experimental and numerical investigation of the thermo-mechanical behaviour of an energy sheet pile wall. Geomech. Energy Environ. 2020, 25, 100208. [Google Scholar]
  2. Brandl, H. Energy foundations and other thermo-active ground structures. Géotechnique 2006, 56, 81–122. [Google Scholar] [CrossRef]
  3. You, S.; Cheng, X.; Guo, H.; Yao, Z. In-situ experimental study of heat exchange capacity of CFG pile geothermal exchangers. Energy Build. 2014, 79, 23–31. [Google Scholar] [CrossRef]
  4. Hamada, Y.; Saitoh, H.; Nakamura, M.; Kubota, H.; Ochifuji, K. Field performance of an energy pile system for space heating. Energy Build. 2007, 39, 517–524. [Google Scholar] [CrossRef]
  5. Kramer, C.A.; Ghasemi-Fare, O.; Basu, P. Laboratory Thermal Performance Tests on a Model Heat Exchanger Pile in Sand. Geotech. Geol. Eng. 2014, 33, 253–271. [Google Scholar] [CrossRef]
  6. Cui, P.; Li, X.; Man, Y.; Fang, Z. Heat transfer analysis of pile geothermal heat exchangers with spiral coils. Appl. Energy 2011, 88, 4113–4119. [Google Scholar] [CrossRef]
  7. Cui, Y.; Zhu, J. 3D transient heat transfer numerical analysis of multiple energy piles. Energy Build. 2017, 134, 129–142. [Google Scholar] [CrossRef]
  8. Luo, J.; Zhao, H.; Gui, S.; Xiang, W.; Rohn, J. Study of thermal migration and induced mechanical effects in double U-tube energy piles. Comput. Geotech. 2017, 91, 1–11. [Google Scholar] [CrossRef]
  9. Laloui, L.; Nuth, M.; Vulliet, L. Experimental and numerical investigations of the behaviour of a heat exchanger pile. Int. J. Numer. Anal. Methods Geomech. 2006, 30, 763–781. [Google Scholar] [CrossRef]
  10. Bourne-Webb, P.; Freitas, T.B. Thermally-activated piles and pile groups under monotonic and cyclic thermal loading—A review. Renew. Energy 2020, 147, 2572–2581. [Google Scholar] [CrossRef]
  11. Marto, A.; Amaludin, A. Response of shallow geothermal energy pile from laboratory model tests. IOP Conf. Ser. Earth Environ. Sci. 2015, 26, 012038. [Google Scholar] [CrossRef]
  12. Ng, C.W.W.; Gunawan, A.; Shi, C.; Ma, Q.; Liu, H.L. Centrifuge modelling of displacement and replacement energy piles constructed in saturated sand: A comparative study. Géotech. Lett. 2016, 6, 34–38. [Google Scholar] [CrossRef]
  13. Ng, C.W.W.; Shi, C.; Gunawan, A.; Laloui, L. Centrifuge modelling of energy piles subjected to heating and cooling cycles in clay. Géotech. Lett. 2014, 4, 310–316. [Google Scholar] [CrossRef]
  14. Kalantidou, A.; Tang, A.M.; Pereira, J.M.; Hassen, G. Preliminary study on the mechanical behaviour of heat exchanger pile in physical model. Géotechnique 2012, 62, 1047–1051. [Google Scholar] [CrossRef] [Green Version]
  15. Yavari, N.; Tang, A.M.; Pereira, J.M.; Hassen, G. Mechanical behaviour of a small-scale energy pile in saturated clay. Géotechnique 2016, 66, 878–887. [Google Scholar] [CrossRef]
  16. Yavari, N.; Tang, A.M.; Pereira, J.-M.; Hassen, G. Experimental study on the mechanical behaviour of a heat exchanger pile using physical modelling. Acta Geotech. 2014, 9, 385–398. [Google Scholar] [CrossRef]
  17. Nguyen, V.T.; Tang, A.M.; Pereira, J.M. Long-term thermo-mechanical behavior of energy pile in dry sand. Acta Geotech. 2017, 12, 729–737. [Google Scholar] [CrossRef]
  18. You, S.; Cheng, X.; Guo, H.; Yao, Z. Experimental study on structural response of CFG energy piles. Appl. Eng. 2016, 96, 640–651. [Google Scholar] [CrossRef]
  19. Man, Y.; Yang, H.; Diao, N.; Cui, P.; Lu, L.; Fang, Z.J.H. Development of spiral heat source model for novel pile ground heat exchangers. Hvac R Res. 2011, 17, 1075–1088. [Google Scholar]
  20. Man, Y.; Yang, H.; Diao, N.; Liu, J.; Fang, Z. A new model and analytical solutions for borehole and pile ground heat exchangers. Int. J. Heat Mass Transf. 2010, 53, 2593–2601. [Google Scholar] [CrossRef]
  21. Ghasemi-Fare, O.; Basu, P. A practical heat transfer model for geothermal piles. Energy Build. 2013, 66, 470–479. [Google Scholar] [CrossRef]
  22. Hu, P.; Zha, J.; Lei, F.; Zhu, N.; Wu, T. A composite cylindrical model and its application in analysis of thermal response and performance for energy pile. Energy Build. 2014, 84, 324–332. [Google Scholar] [CrossRef]
  23. Wang, D.; Lu, L.; Cui, P. A novel composite-medium solution for pile geothermal heat exchangers with spiral coils. Int. J. Heat Mass Transf. 2016, 93, 760–769. [Google Scholar] [CrossRef]
  24. Dubey, A.A.; Kumar, S. Assessment of stress-strain behavior of energy piles installed in sand. Int. J. Geomate 2017, 12, 112–120. [Google Scholar] [CrossRef]
  25. Yang, W.; Lu, P.; Chen, Y. Laboratory investigations of the thermal performance of an energy pile with spiral coil ground heat exchanger. Energy Build. 2016, 128, 491–502. [Google Scholar] [CrossRef]
  26. Wang, B.; Bouazza, A.; Haberfield, C. Preliminary Observations from Laboratory Scale Model Geothermal Pile Subjected to Thermal-Mechanical Loading. Geo-Frontiers 2011, 2011, 430–439. [Google Scholar]
  27. Bao, X.; Li, Y.; Feng, T.; Cui, H.; Chen, X. Investigation on thermo-mechanical behavior of reinforced concrete energy pile with large cross-section in saturated sandy soil by model experiments. Undergr. Space 2019, 5, 229–241. [Google Scholar] [CrossRef]
Figure 1. Experiment setup. (a) Symmetrical configuration of PC pile test in horizontal direction (unit: mm); (b) heat exchange tubes in the pile.
Symmetry 12 01781 g001
Figure 2. Layout of measuring points. (a) Arrangement of thermocouples (unit: mm); (b) location of strain gauges and thermocouples within the pile body.
Symmetry 12 01781 g002
Figure 3. Symmetrical FE model of pile, tube, and soil in the numerical simulation.
Symmetry 12 01781 g003
Figure 4. Comparison of experimental and simulated results of soil temperature around the pile. (a) Temperature change at TS11; (b) Temperature change at TS13.
Symmetry 12 01781 g004
Figure 5. Experimental and simulated results of strain change in the pile. (a) Time history of strain change; (b) strain distribution at the end of the first heating.
Symmetry 12 01781 g005
Figure 6. Comparison of pile displacement in the static loading stage and heating stage. (a) Displacement of the pile in the static loading stage; (b) displacement of the pile during thermal cycles.
Symmetry 12 01781 g006
Figure 7. Comparison of soil pressure.
Symmetry 12 01781 g007
Figure 8. Comparison of temperature change of PC pile and ordinary pile
Symmetry 12 01781 g008
Figure 9. Temperature distribution at the end of the heating stage. (a) ordinary pile; (b) PC pile.
Symmetry 12 01781 g009
Figure 10. Comparison of strain in different piles. (a) Time history of strain change; (b) distribution of strain along the depth.
Symmetry 12 01781 g010
Figure 11. Comparison of displacement at the pile head of different materials.
Symmetry 12 01781 g011
Figure 12. Comparison of soil pressure around piles of different materials.
Symmetry 12 01781 g012
Figure 13. Temperature distribution after heating for 16 h under different thermal loads. (a) ΔT = 10 °C; (b) ΔT = 20 °C; (c) ΔT = 30 °C.
Symmetry 12 01781 g013
Figure 14. Comparison of soil pressure around piles of different materials.
Symmetry 12 01781 g014
Figure 15. Axial strain and stress of the PC pile under different thermal loadings. (a) Axial strain; (b) Axial stress.
Symmetry 12 01781 g015
Figure 16. Time history of displacement of the pile top under different thermal loads.
Symmetry 12 01781 g016
Table 1. Values of material parameters.
Sample MaterialThermal Conductivity
W/(m·K)
Specific Heat Capacity
J/(kg °C)
Coefficient of Thermal Expansion
(/°C)
Relative Density
saturated sand2.711551.46 × 10−642%
ordinary concrete1.899630.98 × 10−5--
phase change concrete1.6510800.9 × 10−5--
Publisher’s Note: MDPI stays neutral with regard to jurisdictional claims in published maps and institutional affiliations.

