Abstract
Previously published models of frontal activity linked high relative left frontal activity to the behavioral approach system (BAS) and impulsivity. Additionally, these models did not account for BAS facets encompassing the anticipation of reward, i.e., goal-driven persistence (BAS–GDP) and reward interest (BAS–RI), from those that deal with the actual hedonic experience of reward, i.e., reward reactivity (BAS–RR) and impulsivity (BAS–I). Using resting electroencephalographic (EEG) recordings, the source localization (LORETA) method allowed us to calculate the hemispheric asymmetry of the current density within the alpha band (7.5–13 Hz) in ten regions of interest. Compared to low BAS subtrait scorers, high BAS subtrait scorers (except for BAS–I) were correlated with greater relative left-sided activity in the superior frontal gyrus (BA10). Further, an isolated effective coherence (iCOH) analysis of the beta activity (21 Hz) disclosed that high impulsive scorers as compared to low impulsive ones had higher connectivity between the superior frontal gyrus and middle temporal gyrus, which was not compensated for by enhanced inhibitory alpha (11 Hz) connectivity between these regions. For the beta frequency, we also found in highly impulsive individuals that (i) both left and right middle temporal lobes directly influenced the activity of the left and right superior frontal lobes, and (ii) a clear decoupling between left and right superior frontal lobes. These findings could indicate reduced control by the supervisory system in more impulsive individuals.
1. Introduction
One dominant personality theory, namely the reinforcement sensitivity theory (RST) [1,2], outlines two main temperamental systems used to describe human personality: the behavioral approach system (BAS), alternatively known as the behavioral activation system [3,4], and the behavioral inhibition system (BIS). The BAS is thought to encompass behavioral activation, the approach to goals, and responses to reward signals. The BIS is thought as sensitive to punishment stimuli and to involve behavioral inhibition, withdrawal, and escape from threats [5]. In this theory, a less defined fight–flight system (FFS) is also incorporated that accounts for fear. Although RST is currently accepted as a useful tool for understanding the biological bases of behavior and personality [6], it is limited because of the relatively complex functioning in and between the conceptualized systems. Consequently, any rare attempt to provide a psychometric description of them produces uncertainty. [7]. However, this theory was recently revised [8,9,10,11]. The revised version of the RST (rRST) developed the FFS further into a fight–flight–freeze system (FFFS), the functions of which are clearly distinct from those of BIS. In the rRST, the BIS is believed to be the system that resolves all forms of goal conflict. The FFFS controls any type of aversive stimulus, such as fighting threats, frustrative non-rewards, fleeing in active avoidance, or freezing to avoid predators’ interest. As is widely known, the BAS is multidimensional, both on the basis of empirical evidence [12,13] and on theoretical grounds [14,15]. In the rRST, the behavioral activation processes govern a number of cognitive functions, for example in working memory and executive control, in persistence in executing planned behavior, and in identifying and catching the final biological reinforcer [14,16]. One favored RST questionnaire is composed of the Carver and White BIS and BAS scales (the BIS/BAS questionnaire) [12]. This instrument has shown excellent reliability and validity. It includes three scales measuring three BAS subtraits (drive, reward responsiveness, and fun seeking) and one scale measuring BIS.
1.1. Personality Traits and EEG Alpha Asymmetry
The BIS/BAS questionnaire has been widely employed in an increasing number of EEG studies suggesting that individual differences in the approach and avoidance systems and emotional control are linked to electroencephalographic (EEG) frontal asymmetry in the alpha band (8–13 Hz) [17,18,19]. Alpha band power is inversely associated with cortical activation, since the alpha rhythm desynchronizes in response to an activating stimulation [20,21]. In the resting idling condition, the relative activation in homologous areas of the left and right hemispheres is usually obtained by subtracting the resting EEG alpha power of a given area in the left hemisphere from that of the homologous one in the right hemisphere [22]. An increase in activity (i.e., a decrease in alpha power) in the left rather than the right frontal region is thought to be associated with approach motivation, while higher activity in the right rather than the left frontal region (i.e., a relative increase of alpha power in the left frontal region) is believed to indicate withdrawal motivation.
Findings have consistently supported the notion that resting cortical activation is higher in individuals with high self-reported BAS. However, equal support is shown for both bilateral activation [23,24,25] and left-lateralized activation [26,27,28]. This rift in the literature suggests the need to better understand specific recording characteristics that may affect the localization of electrophysiological activity associated with high self-reported BAS [29]. In addition, the relationship between the BIS and right frontal cortical activation has received less empirical attention [25,30,31,32]. However, despite some experimental evidence linking FFFS with right frontal activity, many studies have failed to find an association of trait or state withdrawal with right frontal hemisphere activation [19]. In addition, in a recent study approach motivation and impulse control were found to be associated with the activity of the left and right frontal cortices, respectively [33].
Asymmetric hemispheric activation has been found to relate to both trait [30] and situational approach and avoidance motivation [34,35,36]. However, Neal and Gable [37] noted that while past work considering behavioral approach and avoidance as states have consistently related these states to asymmetric activation, evidence for approach and avoidance as traits has been inconsistent [38]. On the basis of this observation and their previous findings, Gable and colleagues [23] suggested that hemispheric asymmetry at the resting level of activity may indicate the operation of the supervisory control system, which supervises approach and avoidance behavior rather than approach and avoidance per se.
From the viewpoint of rRST, in the BIS/BAS questionnaire, the FFFS and BIS are not separately conceptualized or measured. This may explain the inconsistent findings in past research looking at the association of the BIS traits with resting frontal alpha activity. Recently, Neal and Gable [32] suggested that these incongruent findings may be due to the fact that in the BIS scale, there are items referring to both the FFFS and revised BIS traits. These authors, who derived the BIS and FFFS subscales from the original Carver and White BIS and BAS scales [12], showed that the BIS subscale (but not the FFFS) is associated with greater relative right than left frontal hemispheric activity, while impulsivity was associated with less relative right frontal activity.
To facilitate behavioral and neuroscience research on rRST, Corr and Cooper [39] developed the Reinforcement Sensitivity Theory Personality Questionnaire (RST-PQ). This questionnaire measures four subscales of the BAS–goal-driven persistence (BAS–GDP), reward interest (BAS–RI), reward reactivity (BAS–RR), and impulsivity (BAS–I). The first two BAS facets characterize the early stages of approach (“wanting”, i.e., “anticipatory pleasure” or “hope” to achieve a reward) and are associated with dopaminergic neurotransmission [40,41]. The BAS–RR indexes behavioral and emotional excitement to reward and BAS–I indexes the “pleasure attack” as the final biological reinforcer is reached (“liking”) [42] and seems to be more closely related to opioidergic than to dopaminergic neurotransmission [43,44,45]. This tool conceptualizes facets covering FFFS behavior (fight, freeze, and active avoidance) and the BIS functions (motor planning interruption, worry, obsessive thoughts, and behavioral disengagement), and allows separate measures of these two fundamental traits and of reward sensitivity and impulsivity. In the present study, we administered the RST-PQ and state anxiety questionnaire [46] to participants of both sexes to examine the relation of BIS, FFFS, and BAS facets with asymmetry in frontal alpha activation.
Wacker and colleagues conducted a meta-analysis of studies examining the relationship of the BAS with frontal alpha asymmetry and reached the conclusion that this association is weak [38]. They observed that a link between alpha asymmetry and the BAS appeared only in the cases in which the EEG was recorded in male participants by an appealing female experimenter. This explanation was also advised in a later study by Schneider and co-workers [47], who failed to find a significant correlation between alpha asymmetry and personality in adolescents. This hypothesis also seems consistent with our recent findings obtained in a group of female participants with a male experimenter [13]. In a previous study of our own, we used standardized low-resolution brain electromagnetic tomography (sLORETA) [48] to determine the relation of BIS/BAS and dispositional optimism traits with interhemispheric alpha asymmetry [28]. We found a significant association of BAS traits with relatively lower current EEG alpha density in the left middle frontal gyrus (Brodmann area 11 (BA11L) in the left hemisphere), indicating relatively high left frontal hemisphere activation. These findings also seem consistent with our more recent results of significant associations of BAS–I with greater relative left frontal activity, and FFFS (but not BIS), with greater relative right frontocentral activity in a group of female students with a young female experimenter. These relations disappeared with an experimenter of the opposite sex [13]. Interestingly, Gable and colleagues [23] in a resting EEG alpha asymmetry study reported a robust relationship between greater positive urgency and greater relative left frontal activity. Using source localization, these authors observed that this relationship was due to reduced right frontal activity in the inferior frontal gyrus. This observation led these authors to conclude that reduced right frontal activity may reflect the activity of the supervisory control system.
1.2. Aims and Hypotheses
According to the rRST model, and in line with previous EEG alpha and current density findings [13,23,28], we predicted a positive association of higher BAS and its subtraits (BAS–GDP, BAS–RI, BAS–RR, and BAS–I) with the relatively higher frontal left, rather than right, hemisphere activation, as measured by conventional alpha band power. Building on previous research linking personality traits to right frontal alpha activity [19,32], we expected that the BIS, as measured by the RST-PQ, would be related to the relative right frontal activity. In addition, considering our recent findings linking FFFS with greater relative right frontocentral activity [13], we expected that greater FFFS would be related to enhanced right frontal hemispheric asymmetry.
In the present study, we also applied the eLORETA method to avoid the known problem of lack of validity of anterior asymmetry measures among studies using different reference montages, such as the averaged earlobes, scalp vertex, and the average reference [49,50,51]. The eLORETA method includes a zero-error current source density approach [48,52,53]. This method is preferable since it localizes electrocortical sources on the scalp and provides current density measures, which are not dependent on the recording reference. Additionally, this method has proved its validity in linking the approach with the activity in the middle frontal gyrus [28,54]. Using a set of 10 regions of interest (ROIs; left and right frontopolar, frontal, frontocentral, temporal, and parietal regions), one of the main aims was to test the robustness of the correlation between RST-PQ measures with resting frontal asymmetry of current spectral density (CSD, eLORETA) in the alpha band (7.5–13 Hz). Finally, using the eLORETA tool of isolated effective coherence (iCOH), a further aim of this study was to highlight causal directional effective connectivity of preferentially involved frequency oscillations within a set of ROIs. It is expected that the results will clarify the role of each ROI in supporting information flow between different cortical regions and differentiate high (Hi) versus low (Lo) levels of the personality trait of interest [55].
2. Methods
2.1. Participants and Questionnaires
One-hundred and forty-three right-handed psychology students participated in this study. Three participants were excluded for failing to complete individual difference measures and four were excluded for excessive artifacts in EEG data. Thus, data from one-hundred and thirty-six participants were included (75 females: M = 22.2, SD = 2.6, range 18–29 yrs; 61 males: M = 23.2, SD = 2.9, range 19–34 yrs). The Italian version of the original Edinburgh Inventory Questionnaire was used to measure hand preference [56]. Participants declared being free of neurological or psychiatric issues. Women during their menstrual period were invited for the EEG recordings after the onset of menses (between the 5th and 11th day) to avoid possible influences of menstrual stress on resting EEG. The participants completed the Reinforcement Sensitivity Theory Personality Questionnaire (RST-PQ) [39]. RST-PQ measures three major systems: the fight/flight/freeze system (FFFS; fear/active avoidance); the behavioral inhibition system (BIS; related to anxiety); the behavioral approach system (BAS). The BAS is composed of four subscales: goal-driven persistence (BAS–GDP), reward interest (BAS–RI), reward reactivity (BAS–RR), and impulsivity (BAS–I), while BAS total (BAS–TOT) is the average of the three BAS subscales measuring responsiveness and pursuit of rewards. Cronbach′s α values for GDP, RI, RR, and Imp, respectively, were 0.85, 0.79, 0.78, and 0.77, and for the BAS–TOT, α was 0.87. Cronbach′s α values for BIS and FFFS, respectively, were 0.86 and 0.81. Participants also completed the state form of the State-Trait Anxiety Inventory (STAI-Y1) [46] to measure state anxiety.
2.2. Resting Condition
EEG data were obtained during 4.5-min eyes-closed and 4.5-min eyes-open resting conditions. Participants were instructed to keep their eyes open for about a 4.5-min interval and closed for a 4.5-min interval. The eyes-open/eyes-closed order was counterbalanced across participants. They were required to stay still and avoiding blinking and eye movements during EEG recordings. They were generally informed that resting EEG recording served to evaluate EEG correlates of personality without any information about the specific study aims and hypotheses.
2.3. EEG Assessment and Alpha Asymmetry
A 32-channel tin electrode stretch Lycra cap (Electro-Caps, Eaton, OH, USA) was used for EEG recordings on the scalp (10–20 system). A ground electrode was mounted between FPz and Fz. Electrode impedances were kept under 5 kΩ, with homologous electrodes held within a difference of 1 kΩ. EEG activity was recorded from 30 scalp sites and referenced online to averaged earlobes (Fp1, Fp2, F7, F8, F3, F4, FT7, FT8, T3, T4, FC3, FC4, C3, C4, CP3, CP4, TP7, TP8, T5, T6, P3, P4, O1, O2, Fz, FCz, Cz, CPz, Pz, Oz). Bipolar vertical and horizontal electro-oculograms (EOGs) were recorded, using standard tin electrodes, respectively, from the epicanthus of the left and the right eye and from the supra- and infraorbital positions of the right eye. EEG was recorded in DC mode by using a NuAmp acquisition system (Neuroscan Acquire 4.3, Compumedics Neuroscan Inc., Charlotte, NC, USA) using an online notch filter at 50 Hz. Gain was set at 200 (100 for eye channels) with a 0.01–100 Hz bandpass (Butterworth zero-phase filter with 24 dB/octave roll-off). Online sampling frequency was set at 1000 Hz. Continuous EOG and EEG recordings were visually inspected offline, and EEG data showing ocular, muscular, or movement artifacts were rejected for all simultaneously recorded channels (Barlow, 1986; Hagemann, Naumann, and Thayer, 2001). Considering that eLORETA processing required an averaged reference, the EEG was re-referenced to the average of all 30 recording electrodes and resampled at 250 Hz. Signal analyses were performed using Brain Vision Analyzer 2.1 (Brain Product GmbH, Gilching, Germany). Ocular movements were removed from the EEG by using Gratton and colleagues’ method [57]. After ocular correction, data were again visually inspected by two separate experimenters for appropriate removals and corrections of artifacts. All artifact-free 4-s epochs were applied a Hamming window (10% slope periodic at each edge) to avoid artificial estimates of spectral power. Contiguous epochs were 50% overlapped to minimize loss of data due to Hamming window extraction. For each eyes-open/closed condition, an average of about 56 epochs was obtained (ranging from 52 to 60 epochs that corresponded to 3.5–4 min of artifact-free signals). Fast Fourier Transform (FFT) was performed on all epochs to compute spectral power (μV2) spaced at intervals of 0.5 Hz. The band inspected was the traditional alpha band (7.5–13 Hz), and power values were averaged across epochs.
Asymmetry scores were calculated at the frontopolar (Fp1, Fp2) and frontal (F3, F4) sites by subtracting natural logarithm log (base e)-transformed alpha power obtained at the left site from that obtained at the right site [28,30,58]. Similarly, asymmetry scores were also calculated for frontocentral (FC3, FC4), inferior frontal sites (F7, F8), central sites (C3, C4), centroparietal (CP3, CP4), and parietal sites (P3, P4) to examine whether the effect was specific to frontal regions. Low or negative asymmetry scores indicated greater relative right frontal activity, as alpha power inversely relates to cortical activity. Since EEG power values tend to be positively skewed, natural log transformation is usually used in EEG asymmetry research [59,60]. These alpha asymmetry scores served to compute partial correlations with personality measures of interest while controlling the effect of gender and state anxiety. Additionally, to obtain a reliability measure of alpha asymmetry at the abovementioned scalp sites of interest, split-half correlations between the alpha asymmetry scores were calculated for eyes-open and eyes-closed resting conditions. The split-half was obtained by splitting the EEG epochs into two halves (one based on odd numbers and the other half on even numbers) of 104 epochs each and correlating alpha asymmetry scores of interest between the two halves. Following the guidelines of Cicchetti and Sparrow [61], split-half correlations were defined as: excellent reliability > 0.75, good reliability 0.75–0.60, fair reliability 0.59–0.40, and poor reliability < 0.40.
Computation of asymmetry measures and statistical analyses were performed using SAS version 9.4.
2.4. Cortical Source Analysis by eLORETA
The 30-channel EEG data were analyzed with eLORETA (exact low-resolution electromagnetic tomography) [62]. We applied the implementation version 20150415 of eLORETA (available as free academic software from http://uzh.ch/keyinst/loreta). This method provides a space solution confined to cortical grey matter (6239 voxels) with a spatial resolution of 5 mm. Neural activity was computed as the magnitude of current source density (CSD μA/mm2) without assuming a predefined number of active sources [28,29]. We first calculated cross-spectral matrices from the EEG (4-s windows). Then, the pseudoinverse solution by eLORETA transformed yielded images of standardized current density with exact localization [63], albeit with low resolution. As the analysis was performed at 3.5 to 4.5 min intervals, a mean number of 4-sec epochs of about 59 maps were averaged, finally rendering the CSD maps. EEG source analysis was performed in the frequency domain and the alpha frequency band was analyzed (7.5–13 Hz) at each voxel. Within resting conditions, cross-spectral matrices of the EEG epochs were first computed with sLORETA software, requiring the use of an average reference. sLORETA source analysis was applied to the average cross-spectral matrices for each participant. In accordance with previous research [28,64], alpha source activities were combined into 10 ROIs, reported here following Brodmann’s areas (BA) nomenclature: two left (L) and right (R) frontal (BA10L and BA10R; BA11L and BA11R), middle temporal (BA21L and BA21R), posterior cingulate (BA31L and BA31R), and precuneus (BA7L and BA7R). Cortical regions were defined by a sphere surrounding the centroid of each ROI. A large radius would tend to produce an averaged current vector falling in all directions (and thus, close to 0), and a small radius would not give the best precision because of noise effects in the LORETA calculation of spectral current generators, especially when the number of averaged vectors is small. Thus, we chose a radius of 10 mm for each ROI as a good compromise [65]. The Cartesian coordinates (Montreal Neurological Institute system, MNI) depicting the centroids of our selected ROIs are listed in Table 1. For each ROI, the mean alpha power was calculated using all voxels belonging to the same anatomical region. To reduce skew, averaged CSD values for each ROI were submitted to a natural log transformation. For each left and right hemisphere ROI, an alpha asymmetry score was calculated by subtracting, for each couple of ROIs, the left CSD measure from the corresponding right one. Because alpha activity is inversely related to cortical activation [20], higher CSD scores indicate higher left-sided cortical activity. For each ROI, zero-order correlation coefficients and regression analyses were computed to evaluate the predictive power of personality traits on alpha asymmetry scores. The False Discovery Rate (FDR) method was used to correct significance levels. Following FDR correction, ROIs showing significant correlations between CSD alpha asymmetries and trait measures (p < 0.05) were identified as electrocortical correlates of each trait.

Table 1.
Brodmann regions of interest (ROIs) and corresponding Montreal Neurological Institute (MNI) coordinates.
Statistical comparisons of high vs. low trait levels (3.5–4.5 min of resting eyes-open/closed conditions) of LORETA images were based on statistical non-parametric mapping (SnPM) [66]. This procedure employs the SnPM of the maximum across all voxels for the 10 ROIs, which does not require a specific statistical distribution, and accounts for multiple comparisons. For this purpose, a total of 5000 surrogates were generated by application of the SnPM method. Significance testing was performed by using a log F-ratio statistic (p < 0.05).
2.5. Isolated Effective Coherence (iCOH)
Effective connectivity data were computed by means of iCOH (implemented in the eLORETA program package) across all oscillatory frequencies from 0.5 to 45. Multivariate autoregressive (MVAR) models, on which the iCOH method relies, were fitted to consecutive 4-s EEG epochs. Outputs were averaged to obtain a single effective connectivity response per subject varying from 3.5 to 4.5 min intervals and subsequently, averaged across subjects to yield the final group result. The software LORETA can compute automatically all necessary parameters for the calculus of iCOH (the optimal autoregressive order p = 6 was assumed in our case) and provides an iCOH spectrum as output to a given set of EEG data input. Details on the mathematical derivation of the iCOH method are given by Pascual-Marqui and colleagues [55]. The iCOH scores are normalized and hence, independent of the strength of the underlying generators. The computation of iCOH and interpretation of findings requires first the use of a source localization method [55]. Since cortical activity does not project radially onto the scalp, iCOH and other connectivity measures should not be interpreted as representing cortical connections [67,68,69]. The frequency representation of iCOH allows us to deduce which frequency oscillations are involved in the information transfer between a given number of brain regions [55]. Under the assumption of a linear autoregressive model, iCOH correctly assesses direct causal connections transmitting oscillatory information between nodes. The simple variable-by-variable t-statistic was used as a statistical measure of “distance” between the two personality groups. Correction of significance for multiple testing was applied by using SnPM in the eLORETA t-test package. Surrogate permutations (5000 in our case) are created rendering a histogram that provides the statistical threshold [55].
3. Results
Split-half correlations between alpha asymmetry scores for each region of interest were: frontopolar (r = 0.65), frontal (r = 0.69), frontocentral (0.50), inferior frontal (r = 0.67), central (r = 0.54), centroparietal (r = 0.56), and parietal (r = 0.51).
FDR-corrected correlations among RST-PQ personality traits and state anxiety are shown in Table 2. BAS–TOT was positively correlated with all subscales of the BAS (see Table 2). As expected, BAS–GDP was positively correlated with BAS–RI, and BAS–RI with BAS–RR. Finally, BAS–I was significantly correlated with BAS–RR alone.
Table 2.
Pearson correlation coefficients for personality (RST-PQ, n = 136, 75 females). Behavioral Approach System (BAS): goal-driven persistence (BAS–GDP), reward interest (BAS–RI), reward reactivity (BAS–RR), and impulsivity (BAS–I); Behavioral Inhibition System (BIS), Fight–Flight–Freeze System (FFFS), and state anxiety (STAI-Y1).
3.1. Alpha-Asymmetry Correlates of BAS and its Facets
Partial correlations, controlling for state anxiety and gender, performed between alpha asymmetry scores of each recording site of interest and BAS factor did not reveal any significant association for frontocentral, inferior frontal, central, centroparietal, and parietal sites (all p > 0.10, FDR correction; see upper-half quadrant of Table 3). However, BAS–GDP was positively associated with frontal alpha asymmetry and, additionally, BAS–RI with frontopolar alpha asymmetry, indicating a relative frontal left hemisphere asymmetry in higher BAS–GDP/RI scorers.
Table 3.
Partial correlations (controlling for state anxiety and gender) of personality traits during rest conditions with: (1) EEG alpha asymmetry at frontopolar (Fp1, Fp2), frontal (F3, F4), frontocentral (FC3, FC4), inferior frontal sites (F7, F8), central sites (C3, C4), centroparietal (CP3, CP4), and parietal sites (P3, P4); (2) CSD-alpha asymmetry at Brodmann areas BA10, BA11, BA7, BA31, and BA21 (n = 136, 75 females).
Correlations between CSD alpha asymmetry data of each ROI and BAS factors, after partial-out of the effect of participant’s gender and state anxiety, yielded significant positive associations of BAS–TOT, BAS–GDP, BAS–RI, and BAS–RR in the superior frontal gyrus (BA10). An exception was BAS–I, which was not found significantly correlated with frontal CSD alpha asymmetry at BA10 (see lower quadrant of Table 3). Interestingly, BAS–TOT, BAS–RR, and BAS–I were all significantly and positively correlated with CSD alpha asymmetry in the middle temporal gyrus (BA21, the bottom of Table 3). All these significant relationships were paralleled by separate bivariate regressions, showing that higher BAS trait and subtrait scorers significantly predicted greater relative left hemisphere asymmetry in the frontal and temporal regions. These positive associations of BAS–TOT and BAS subscales and CSD alpha asymmetries did not substantially change after controlling for gender and state anxiety. Regressions are reported in Table 4.
Table 4.
Top-half quadrant: Bivariate regression analyses between frontopolar (Fp1, Fp2), frontal (F3, F4), EEG-alpha asymmetry, and BAS scales of the RST-PQ. Bottom-half quadrant: Bivariate regression analyses between CSD-alpha asymmetry in the superior frontopolar gyrus (BA10), middle temporal gyrus alpha asymmetry, and BAS scales of the RST-PQ. Probabilities are corrected using the False Discovery Rate (FDR) method.
To exclude the threat of multicollinearity, we examined multicollinearity through the Variance Inflation Factor (VIF) and tolerance in multiple regressions, using as predictors BAS–TOT, BAS–GDP, BAS–RI, BAS–RR, and BAS–I and as criterion, CSD alpha asymmetry at the BA10 region. These results indicated a lack of multicollinearity for all BAS facets (tolerance values ranged from 0.205 to 0.346; VIF values ranged from 2.886 to 4.880), since no tolerance values fell below 0.1 and no VIF value was above 10. However, for BAS–TOT, we found an expected threat of multicollinearity, this trait being the sum of all BAS facets (Tolerance = 0.051, VIF = 19.445).
3.2. Functional Source Localization Differences Between High and Low BAS Individuals
The LORETA t-test tool revealed significant differences in CSD alpha between high and low BAS facets. The one-tiled log F-ratio thresholds for significance ranged from −2.15 to t = −2.56 at p < 0.05. High BAS–TOT scorers, as well as high BAS–GDP, BAS–RI, and BAS–RR scorers, had significantly lower CSD in the alpha frequency band on the left frontal lobe than low BAS trait scorers. All these differences met one-tiled thresholds of significance (see Figure 1) and indicated a relative inhibition of the frontal left hemisphere (BA10) in lower BAS individuals. Differences between high and low BAS–I scorers did not meet the significance criterion.
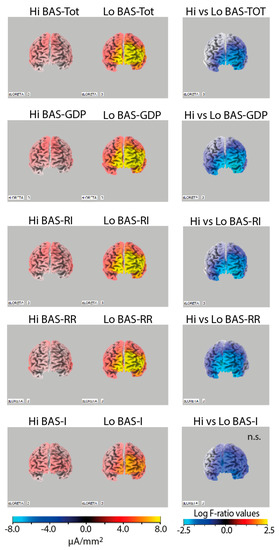
Figure 1.
Left panels: Alpha band (7.5–13 Hz) current density images in high (Hi) vs. low (Lo) BAS trait (BAS–TOT) and subtrait scorers (BAS–GDP, BAS–RI, BAS–RR, and BAS–I; left panels), showing more pronounced alpha activity in the left hemisphere in Lo BAS scorers. Right panels: Statistical comparisons of current density images (one-tiled t-test) of Hi vs. Lo BAS scorers, showing a relative lower alpha current density in the left superior frontal gyrus (BA10) in Hi compared to Lo BAS trait scorers, with the exception of the difference between Hi and Lo BAS–I scorers that did not meet the significance level.
3.3. BAS Differences on iCOH of Significant ROIs
The calculus of iCOH values was performed across the four ROIs that provided a significant association with BAS traits that had CSD alpha asymmetry scores, i.e., BA10L, BA10R, BA21L, and BA21R.
Statistical comparisons of connections across the four selected ROIs yielded significant differences (t-test) for only the BAS–I traits. iCOH spectra in the resting condition at each ROI of Hi versus Lo BAS–I are illustrated, respectively, with blue and red curves in Figure 2a. For any pair of ROIs, the y-axis represents the iCOH values indicating connectivity strength (effect size) as a function of oscillatory frequency. The oscillatory frequency ranges from 0.5 up to 43 Hz (Nyquist frequency of 64 Hz). Plots are arranged as a square matrix of the order 4, wherein columns represent “ROI senders”, while rows are “ROI receivers” of information flow (i.e., every single ROI acted as sender and the remaining ROIs as receivers. The correspondence of each ROI position in the square matrix is the same for rows and columns. Information flow among the four ROIs was almost symmetrical, although a prominent role of BA10R and BA21R as senders was also observed for alpha at 11 Hz and beta at 21 Hz. In Figure 2a, dashes below the curves indicate significant differences (p < 0.05) between Hi versus Lo BAS–I (blue dashes A > B). Interestingly, it is important to note that Hi BAS–I individuals had a relatively enhanced connectivity compared to Lo BAS–I participants. These personality differences were observed at each ROI and for both alpha and beta oscillation frequencies (Figure 2a). Interesting also, in Hi and Lo BAS–I groups, we observed that in terms of alpha connectivity, BA10L was disconnected from BA21L, and BA10L can receive from BA21R, but cannot send to it. Additionally, in terms of beta activity, a disconnection between BA10L and BA10R was common to both BAS–I groups. In Figure 2b is displayed a synthesis of statistically significant connectivity differences between BAS–I groups, red arrows correspond to relatively enhanced connectivity in Hi BAS–I group. The intensity of the effect is graphically represented by the thickness of the lines and arrows. As reported in Figure 2b, we had an increased alpha and beta connectivity in Hi BAS–I compared to Lo BAS–I individuals, indicating opposite control mechanisms in these individuals. It is also important to note that at an alpha frequency in Hi BAS–I, the main senders to the other regions were BA10R and BA21R, although the former was slightly stronger in sending than the latter to the latter, but not vice versa. At beta frequency, both BA10R and BA21R regions were the sender and receiver of each other in the Hi BAS–I group.
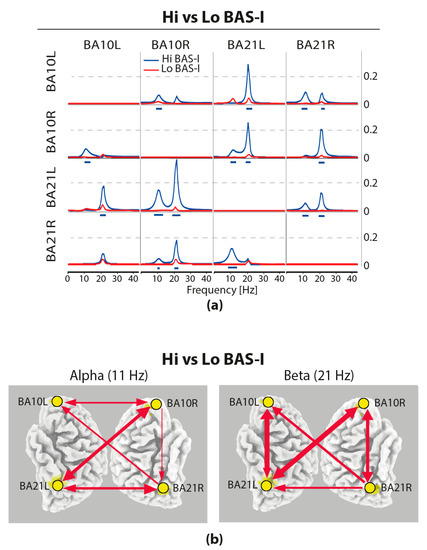
Figure 2.
(a) Effective connectivity assessed with the isolated effective coherence (iCOH) measure in Hi vs. Lo BAS–I during rest. iCOH values representing connectivity strength (effect size) as a function of frequency for any pair of the four ROIs. Plots arranged as a square matrix of order 4; columns represent “senders” and rows are “receivers” of information flow. For the abbreviations of the ROIs, see Table 1. iCOH in Lo BAS–I (red curves) and in Hi BAS–I scorers (blue curves). Frequency range from 0.5 to 45 Hz (0.5-Hz resolution). Blue dashes below the curves indicate significant higher iCOH differences between Hi and Lo BAS–I scorers for alpha at 11 Hz and beta at 21 Hz. (b) Synthesis of statistically significant connectivity differences (iCOH) of alpha and beta oscillatory information flow of Hi minus Lo BAS–I during resting state. Red arrows correspond to relatively enhanced connectivity in the Hi BAS–I group. The intensity of the effect is graphically represented by the thickness of the lines and arrows. All displayed arrows are at least significant at p < 0.05, with correction for multiple testing by means of non-parametric randomization of the exceedance proportion test.
4. Discussion
We calculated split-half correlations of resting state EEG alpha asymmetry scores of scalp sites of interest. In agreement with Cicchetti and Sparrow guidelines [61], we found a good test–retest reliability for frontopolar, frontal, and inferior frontal, while for the frontocentral, central, centroparietal, and parietal scalp sites, we obtained fair reliability. Considering that these data were obtained across an average time of 6.9 min recording split, we can conclude that our reliability findings at the frontal leads are acceptable and in line with current research [70,71].
Alpha asymmetry, calculated at conventional frontopolar scalp sites (Fp1, Fp2), showed that higher BAS–TOT and BAS–RI were both associated with high left hemisphere activation (upper-half quadrant in Table 3). This relation was also significant for both BAS–TOT and to a larger extent for BAS–GDP with alpha asymmetry calculated at the frontal leads (F3, F4). However, we failed to find significant relations for alpha asymmetry measures with BIS and FFFS traits. Thus, these findings indicate that using the classic interhemispheric alpha power asymmetry index, the expected association between frontal left hemisphere activation and the BAS trait was confirmed for only BAS–GDP and BAS–RI, conceptualized as reward sensitivity components [7], while this relationship was not confirmed for BAS components reflecting reward reactivity (BAS–RR) and impulsivity (BAS–I). Additionally, we failed to find the expected association of frontal right hemisphere activation with BIS and FFFS traits [13,32]. It is important to note that we obtained the present findings after controlling for state anxiety and gender, whose potential influence on hemispheric potentially has been previously proved [13,38,72,73]. Finally, these significant personalities versus asymmetry associations parallel previous findings reported in classic studies [30,74,75,76].
Using the CSD measure of alpha asymmetry, as derived from CSD mean values within the alpha band, we found that the relative left hemisphere alpha asymmetry at the superior frontal gyrus (BA10L) was positively associated with higher BAS and its subtraits of BAS–GDP, BAS–RI, and BAS–RR, but not BAS–I (Table 3 and Table 4 and the left column in Figure 1). In addition, a relatively high left hemisphere alpha asymmetry in the middle temporal gyrus (BA21L) was significantly associated with higher BAS–TOT, BAS–RR, and BAS–I scores. However, it is important to underline that our CSD findings of positive relations between greater relative left alpha asymmetry at the superior frontal gyrus (BA10) and BAS reward-sensitive and reactive traits stem from the relatively higher left frontal alpha-band activity (i.e., lower left cortical activity) in Lo BAS reward-sensitive individuals compared to low BAS ones, making a relative left hemisphere asymmetry in Hi BAS scorers, although we did not observe direct differences between hemispheres in these participants (see comparisons across all voxels in Figure 1). However, in terms of frontal left hemisphere asymmetry in higher BAS scorers, current source localization findings represent a validation of our previous results [28] and the original findings reported in classic studies [58,74,75,76]. Indeed, the present results also parallel original LORETA findings linking the activity in the medial frontal gyrus with the individual’s susceptibility to respond with approach-related tendencies [54]. Reviews of functional magnetic resonance imaging (fMRI) studies have outlined a leading role of the orbital frontal cortex (BA10) in encoding the subjective values of different types of rewards and controlling both individual differences in reward-driven reactivity and reward learning [77,78,79,80,81]. The orbital frontal cortex receives signals directly from the olfactory, visual, taste, and somatosensory areas [82,83] and strictly interacts with the amygdala and ventral striatum, which contribute to reward and affective processing [84,85]. This frontal region is believed to be involved in the storage of rewards’ values and affective processing of reward [79]. Enhanced left orbital frontal cortex activity seems to be implicated in guiding choice behavior in consonance with the estimated reward value of those choices [82,86], along with playing a role in the inhibition of impulsive behavior, implying that this region may integrate representations of positive and negative outcomes. Increased resting-state correlations between regions of basal ganglia, associated with “wanting” [87] and the activity of the superior frontal cortex indicate that this region plays a role in suppressing impulsive behavior through the increased communication with working memory regions, responsible for assessing desirable outcomes as does the middle temporal cortex [79,80,88].
The present significant associations of frontal left hemisphere asymmetry with the “wanting” components of the behavioral approach are also in line with previous fMRI reports linking the activity in the orbitofrontal cortex with the reward monitoring value of the ongoing cognitive processes [89,90] and with cognitive empathy [91]. It is important to outline that reward-sensitive traits reflect the individual propensity for reward interest (BAS–RI) and goal planning and -driven persistence (BAS–GDP), which characterize the “anticipatory pleasure” (or “hope”) in the early stages of approach behavior. The reward reactivity (BAS–RR) trait represents an individual’s tendency to experience the hedonic aspect of reward (i.e., “pleasure”), which provides the emotional positive reinforcement for BAS behavior, while impulsivity expresses an individual’s tendency for rapid action sufficient to “capture” the desired object [7,14]. Moreover, our current correlation findings of higher resting left, rather than right, hemisphere activation at the middle temporal gyrus (BA21) in higher BAS–RR and BAS–I participants are novel, although they could be considered an extension of previously reported findings [23]. Previous research has highlighted the role of the orbital frontal cortex together with the medial temporal lobe in decision making for choices that draw on memory [79,80]; however, this also extends to intertemporal choices in cases in which future thinking counterbalances the tendency to choose prompt rewards in healthy individuals [88,92]. Meanwhile, patients with medial temporal lobe lesions have impaired episodic future thinking ([93,94,95,96], but see [97]) and prevalently, patients with left medial temporal lobe lesions will fail to show a change in temporal discounting [98]. Other fMRI research has highlighted the left middle temporal gyrus, together with the OFC, as sensitive to the valence component of reward, social cognition [99], and deductive reasoning, mainly when the construction of a mental model is necessary to understand the beliefs and intentions of others [100]. In sum, this reviewed research adds to a growing body of evidence that future thinking processes are subserved by the medial temporal lobe and have an adaptive value for humans.
Based on the observations reported above, we think that our findings linking relative left hemisphere alpha asymmetry in the middle temporal gyrus in high BAS–RR and BAS–I individuals may indicate that in reward-reactive individuals, the relatively higher left, rather than right, hemisphere alpha asymmetry in the medial temporal lobe is necessary to facilitate the amplification of “pleasure”, which provides positive reinforcement for BAS behavior. In humans, reward reactivity is often anticipatory (“hope”), although it also relates to the achievement of local goals, signaling that the temporospatial distance to the final biological goal is reducing. This view suggests the importance of future thinking processes, subserved by the middle temporal gyrus, and their adaptive value for humans. In addition, rush impulsive individuals, interested in a rapid reaction, seem subserved by a relative left hemisphere alpha asymmetry in the middle temporal gyrus that facilitates fast reactions.
We determined the functional connectivity between cortical brain areas of interest, since this measure can provide us with more direct information regarding the statistical dependencies between the neuronal activity of different brain regions and how these dependences can differ between high versus low levels of the personality traits of interest. This was done through the calculus of the LORETA tool of iCOH across our previously selected four ROIs (BA10L, BA10R, BA21L, and BA21R). This made us reveal personality differences in the degree and directionality of information flow in terms of spectral characteristics of frequency oscillations between ROIs. The BAS–I subtrait was the only one showing significant differences in information flow between ROIs. We found that high impulsive scorers had higher effective connectivity than low ones for both the 11 Hz alpha frequency and 21 Hz beta frequency (Figure 2a). In terms of alpha connectivity, we note that for Hi BAS–I, the main senders were BA10R and BA21R, although the BA10R was sending to BA21R and not vice versa. For these participants, clear relative alpha frequency decoupling in the left hemisphere between frontal and temporal ROIs (i.e., between BA10L and BA21L) was noteworthy (Figure 2b). We think that this alpha decoupling together with a reduced relative inhibitory control of BA10L in the middle temporal regions may be a characteristic of these impulsive individuals.
In terms of beta frequency, the high impulsive scorers showed that within each hemisphere, the frontal region was a sender to and receiver from the middle temporal region (Figure 2a,b). In addition, it is important to underline that for beta frequency, but not for alpha frequency, we found a clear decoupling between the left and right superior frontal regions in these individuals. For beta frequency, it was the left medial temporal lobe (BA21L) and, to a less extent the right one (BA21R), that directly influenced the activity of the left and right superior frontal lobe (BA10L/R; Figure 2b). Thus, both medial temporal lobe regions appeared as major cortical relay stations for beta synchronization in the superior frontal regions.
How can we explain the current resting-state findings of high alpha and beta connectivity among ROIs in higher impulsivity scorers? One possible explanation could come from a different emerging reconceptualization of impulsivity [101] within the context of a dual-mode supervisory system [102] rather than as a personality construct in itself. Such theory conceptualizes a sub-ordered system that responds quickly to eventful associative cues and a supervisory system that plans and responds deliberately to rewarding stimuli. The low serotonergic function appears to enhance the influence of the lower order system. This often yields pathological impulsive reactivity [103]. According to this view, impulsive responses may be expressions of the more reactive, fast processing mode of the sub-ordered system, and impulsivity may derive from a reduced control of the supervisory control system.
Under this view, in the present study, we observed a high connection for beta activity (21 Hz) in Hi BAS–I individuals between the left superior frontal gyrus and middle temporal gyrus (which was not compensated by enhanced inhibitory alpha connectivity between these regions, see Figure 2b), which may reflect reduced control by the supervisory system. That is, in high impulsivity individuals, there exist operating brain compensation mechanisms involving the cooperation of frontal and temporal cortical regions, since these individuals need additional cognitive resources to facilitate a fast reaction without planning (rush impulsivity), and thus, bypass decision making processes for choices that draw directly from memory. This explanation is in line with the view that in highly impulsive individuals, the frontal regions responsible for the cognitive control of behavior are subject to a strong influence of reward signals from striatal regions, which bypass frontopolar control [89]. This explanation is also in line with earlier studies’ findings showing abnormal reward-related processing in healthy individuals, such as expectation of reward [104] and ventral striatal deficits that may be linked to impulsivity [105], sensation seeking and heightened reward sensitivity all associated with antisocial behavior [106], and high impulsive [107] or impulsive/antisocial traits [108,109]. Additionally, inpatient psychopathic criminals have been found to be characterized by enhanced communication between reward-related striatal regions and frontal brain regions [110]. Recently, Angelides and colleagues [111], measuring resting-state fMRI connectivity and BIS/BAS trait scores of the Carver and White questionnaire [12], reported a significant correlation for BAS fun-seeking with resting-state connectivity between the middle orbital frontal cortex and putamen. These findings suggest that spontaneous synchrony between reward-processing regions may reflect specific aspects of impulsivity.
5. Conclusions
This work demonstrates a significant relationship between left hemisphere alpha asymmetry at the superior frontal gyrus (BA10) and reward-sensitive BAS subtraits, which is in line with previous findings [17,28,30,58], although source localization of this relationship revealed its origin as reduced activity in the left frontal pole in low BAS scorers. In addition, the results demonstrate novel associations for both BAS reward reactivity and impulsivity with left hemisphere alpha asymmetry at the medial temporal gyrus (BA21).
The current study failed to find any significant relation for right hemisphere alpha asymmetry with BIS and/or FFFS, a finding that is not in line with prior reports [30,75,112] but parallels other findings [28,76]. An effective connectivity analysis between a pair of frontal and medial temporal regions has outlined enhanced relative connectivity at a 21 Hz beta frequency in high impulsive individuals between these cortical regions, with a clear decoupling between the left and right frontal regions. We observed that the left medial temporal lobe (BA21L) and, to a lesser extent, the right one (BA21R), directly influenced the activity of the left and right superior frontal lobe (BA10L/R). Thus, both medial temporal lobe regions appeared as major cortical relay stations for beta synchronization in the superior frontal regions. Finally, in impulsive individuals, we also observed a relative alpha frequency (11 Hz) decoupling between frontal and temporal regions that may account for impulsive behavior. The present results are in line with a growing body of evidence that neurophysiological markers of personality traits reflect underlying mechanisms of basis systems regulating human behavior [113,114]. Such markers can help understand vulnerability to mental illness and treatment development.
It is important to note at least three limitations that may have bounded our findings. First, for resting EEG recordings, we used a period of about 4.5 min for eyes open and 4.5 min eyes closed, obtained in a single session. This did not avoid the unwanted state-like fluctuations in EEG asymmetry, the reduction of which requires the collection of data on at least three separate occasions [51]. Second, our effective connectivity analysis was performed using only two selected pairs of regions. While this reduction, on the one hand, has facilitated the understanding of the results, on the other hand, it has prevented the finding of a larger set of functional connectivities significantly associated with personality. Third, given that recent research has outlined that the problem in research on emotional lateralization and oscillatory asymmetries might be due to the lack of ecological validity [115], it would be highly interesting to see more EEG studies using active approach/avoidance behavior to validate these resting-state findings during actual behavior.
Author Contributions
Conceptualization, V.D.P.; methodology, V.D.P.; software, A.V.; validation, V.D.P., A.V., and G.C.; formal analysis, V.D.P.; investigation, A.V. and G.C.; resources, V.D.P.; data curation, A.V. and G.C.; writing--original draft preparation, V.D.P.; writing--review and editing, V.D.P.; visualization, V.D.P.; supervision, V.D.P.; project administration, V.D.P.; funding acquisition, V.D.P. All authors have read and agreed to the published version of the manuscript.
Funding
This research was supported by a grant from La Sapienza University of Rome, Italy to Vilfredo De Pascalis (Macroarea B, Delibera S.A. n.50/19 del 12/02/2019).
Conflicts of Interest
The authors declare no conflict of interest.
References
- Gray, J.A. The psychophysiological basis of introversion-extraversion. Behav. Res. Ther. 1970, 8, 249–266. [Google Scholar] [CrossRef]
- Gray, J.A. The Neuropsychology of Anxiety: An Enquiry into the Functions of the Septo-Hippocampal System; Oxford University Press: Oxford, UK, 1982. [Google Scholar]
- Fowles, D.C. Biological Variables in Psychopathology: A Psychobiological Perspective. In Comprehensive Handbook of Psychopathology, 3rd ed.; Sutker, P.B., Adams, H.E., Eds.; Kluwer Academic Publishers: New York, NY, USA, 2002; pp. 85–104. [Google Scholar]
- Fowles, D.C. Application of a behavioral theory of motivation to the concepts of anxiety and impulsivity. J. Res. Personal. 1987, 21, 417–435. [Google Scholar] [CrossRef]
- Carver, C.S.; Scheier, M.F. Feedback processes in the simultaneous regulation of action and affect. In Handbook of Motivation Science; Shah, J.Y., Gardner, W.L., Eds.; Guilford Press: New York, NY, USA, 2008; pp. 308–324. [Google Scholar]
- Kennis, M.; Rademaker, A.R.; Geuze, E. Neural correlates of personality: An integrative review. Neurosci. Biobehav. Rev. 2013, 37, 73–95. [Google Scholar] [CrossRef] [PubMed]
- Corr, P.J. Reinforcement sensitivity theory of personality questionnaires: Structural survey with recommendations. Personal. Individ. Differ. 2016, 89, 60–64. [Google Scholar] [CrossRef]
- Corr, P.J.; McNaughton, N. Neuroscience and approach/avoidance personality traits: A two stage (valuation–motivation) approach. Neurosci. Biobehav. Rev. 2012, 36, 2339–2354. [Google Scholar] [CrossRef] [PubMed]
- Gray, J.A.; McNaughton, N. The Neuropsychology of Anxiety: An Enquiry into the Functions of the Septo-Hippocampal System, 2nd ed.; Oxford University Press: Oxford, UK, 2000. [Google Scholar]
- McNaughton, N.; Corr, P.J. A two-dimensional neuropsychology of defense: Fear/anxiety and defensive distance. Neurosci. Biobehav. Rev. 2004, 28, 285–305. [Google Scholar] [CrossRef]
- McNaughton, N.; Corr, P.J. The neuropsychology of fear and anxiety: A foundation for reinforcement sensitivity theory. In The Reinforcement Sensitivity Theory of Personality; Corr, P.J., Ed.; Cambridge University Press: Cambridge, UK, 2008; pp. 44–94. [Google Scholar] [CrossRef]
- Carver, C.S.; White, T.L. Behavioral inhibition, behavioral activation, and affective responses to impending reward and punishment: The BIS/BAS scales. J. Personal. Soc. Psychol. 1994, 67, 319. [Google Scholar] [CrossRef]
- De Pascalis, V.; Sommer, K.; Scacchia, P. Resting Frontal Asymmetry and Reward Sensitivity Theory Motivational Traits. Sci. Rep. 2018, 8, 13154. [Google Scholar] [CrossRef]
- Corr, P.J. (Ed.) The Reinforcement Sensitivity Theory of Personality; Cambridge University Press: Cambridge, UK, 2008. [Google Scholar] [CrossRef]
- Smillie, L.D.; Cooper, A.J.; Wilt, J.; Revelle, W. Do extraverts get more bang for the buck? Refining the affective-reactivity hypothesis of extraversion. J. Personal. Soc. Psychol. 2012, 103, 306. [Google Scholar] [CrossRef]
- Carver, C.S. Impulse and constraint: Perspectives from personality psychology, convergence with theory in other areas, and potential for integration. Personal. Soc. Psychol. Rev. 2005, 9, 312–333. [Google Scholar] [CrossRef]
- Coan, J.A.; Allen, J.J.B. Frontal EEG asymmetry and the behavioral activation and inhibition systems. Psychophysiology 2003, 40, 106–114. [Google Scholar] [CrossRef] [PubMed]
- Coan, J.A.; Allen, J.J.B. Frontal EEG asymmetry as a moderator and mediator of emotion. Biol. Psychol. 2004, 67, 7–50. [Google Scholar] [CrossRef] [PubMed]
- Gable, P.A.; Neal, L.B.; Threadgill, A.H. Regulatory behavior and frontal activity: Considering the role of revised-BIS in relative right frontal asymmetry. Psychophysiology 2018, 55, e12910. [Google Scholar] [CrossRef]
- Lindsley, D.B.; Wicke, J.D. The Electroencephalogram: Autonomous electrical activity in man and animals. In Bioelectric Recording Techniques; Thompson, R., Patterson, M.N., Eds.; Academic Press: New York, NY, USA, 1974; pp. 3–79. [Google Scholar]
- Allen, J.J.B.; Urry, H.L.; Hitt, S.K.; Coan, J.A. The stability of resting frontal electroencephalographic asymmetry in depression. Psychophysiology 2004, 41, 269–280. [Google Scholar] [CrossRef]
- Davidson, R.J. EEG Measures of Cerebral Asymmetry: Conceptual and Methodological Issues. Int. J. Neurosci. 1988, 39, 71–89. [Google Scholar] [CrossRef]
- Gable, P.A.; Mechin, N.C.; Hicks, J.A.; Adams, D.L. Supervisory control system and frontal asymmetry: Neurophysiological traits of emotion-based impulsivity. Soc. Cogn. Affect. Neurosci. 2015, 10, 1310–1315. [Google Scholar] [CrossRef] [PubMed]
- Hewig, J.; Hagemann, D.; Seifert, J.; Naumann, E.; Bartussek, D. The relation of cortical activity and BIS/BAS on the trait level. Biol. Psychol. 2006, 71, 42–53. [Google Scholar] [CrossRef]
- Shackman, A.J.; McMenamin, B.W.; Maxwell, J.S.; Greischar, L.L.; Davidson, R.J. Right dorsolateral prefrontal cortical activity and behavioral inhibition. Psychol. Sci. 2009, 20, 1500–1506. [Google Scholar] [CrossRef]
- Amodio, D.M.; Master, S.L.; Yee, C.M.; Taylor, S.E. Neurocognitive components of the behavioral inhibition and activation systems: Implications for theories of self-regulation. Psychophysiology 2008, 45, 11–19. [Google Scholar] [CrossRef]
- Boksem, M.A.S.; Smolders, R.; Cremer, D.D. Social power and approach-related neural activity. Soc. Cogn. Affect. Neurosci. 2009, 7, 516–520. [Google Scholar] [CrossRef]
- De Pascalis, V.; Cozzuto, G.; Caprara, G.V.; Alessandri, G. Relations among EEG-alpha asymmetry, BIS/BAS, and dispositional optimism. Biol. Psychol. 2013, 94, 198–209. [Google Scholar] [CrossRef]
- Harmon-Jones, E.; Gable, P.A. On the role of asymmetric frontal cortical activity in approach and withdrawal motivation: An updated review of the evidence. Psychophysiology 2018, 55, e12879. [Google Scholar] [CrossRef] [PubMed]
- Sutton, S.K.; Davidson, R.J. Prefrontal Brain Asymmetry: A Biological Substrate of the Behavioral Approach and Inhibition Systems. Psychol. Sci. 1997, 8, 204–210. [Google Scholar] [CrossRef]
- Balconi, M. Frontal brain oscillation modulation in facial emotion comprehension: The role of reward and inhibitory systems in subliminal and supraliminal processing. J. Cogn. Psychol. 2011, 23, 723–735. [Google Scholar] [CrossRef]
- Neal, L.B.; Gable, P.A. Regulatory Control and Impulsivity Relate to Resting Frontal Activity. Soc. Cogn. Affect. Neurosci. 2017. [Google Scholar] [CrossRef] [PubMed]
- Neal, L.B.; Gable, P.A. Shifts in frontal asymmetry underlying impulsive and controlled decision-making. Biol. Psychol. 2019, 140, 28–34. [Google Scholar] [CrossRef] [PubMed]
- Coan, J.A.; Allen, J.J.B.; Harmon-Jones, E. Voluntary facial expression and hemispheric asymmetry over the frontal cortex. Psychophysiology 2001, 38, 912–925. [Google Scholar] [CrossRef]
- Gable, P.; Harmon-Jones, E. Relative left frontal activation to appetitive stimuli: Considering the role of individual differences. Psychophysiology 2008, 45, 275–278. [Google Scholar] [CrossRef]
- Poole, B.D.; Gable, P.A. Affective motivational direction drives asymmetric frontal hemisphere activation. Exp. Brain Res. 2014, 232, 2121–2130. [Google Scholar] [CrossRef]
- Neal, L.B.; Gable, P.A. Neurophysiological markers of multiple facets of impulsivity. Biol. Psychol. 2016, 115, 64–68. [Google Scholar] [CrossRef]
- Wacker, J.; Chavanon, M.-L.; Stemmler, G. Resting EEG signatures of agentic extraversion: New results and meta-analytic integration. J. Res. Personal. 2010, 44, 167–179. [Google Scholar] [CrossRef]
- Corr, P.J.; Cooper, A.J. The Reinforcement Sensitivity Theory of Personality Questionnaire (RST-PQ): Development and Validation. Psychol. Assess. 2016. [Google Scholar] [CrossRef] [PubMed]
- DeYoung, C.G. Personality Neuroscience and the Biology of Traits. Soc. Personal. Psychol. Compass 2010, 4, 1165–1180. [Google Scholar] [CrossRef]
- Yacubian, J.; Sommer, T.; Schroeder, K.; Gläscher, J.; Braus, D.F.; Büchel, C. Subregions of the ventral striatum show preferential coding of reward magnitude and probability. NeuroImage 2007, 38, 557–563. [Google Scholar] [CrossRef] [PubMed]
- Corr, P.J. Approach and avoidance behaviour: Multiple systems and their interactions. Emot. Rev. 2013, 5, 285–290. [Google Scholar] [CrossRef]
- Drago, F.; Caccamo, G.; Continella, G.; Scapagnini, U. Amphetamine-induced analgesia does not involve brain opioids. Eur. J. Pharmacol. 1984, 101, 267–269. [Google Scholar] [CrossRef]
- Schweinhardt, P.; Seminowicz, D.A.; Jaeger, E.; Duncan, G.H.; Bushnell, M.C. The anatomy of the mesolimbic reward system: A link between personality and the placebo analgesic response. J. Neurosci. 2009, 29, 4882–4887. [Google Scholar] [CrossRef] [PubMed]
- Shimizu, T.; Iwata, S.-I.; Morioka, H.; Masuyama, T.; Fukuda, T.; Nomoto, M. Antinociceptive mechanism of l-DOPA. Pain 2004, 110, 246–249. [Google Scholar] [CrossRef]
- Spielberger, C.D.; Gorsuch, R.; Lushene, R.; Vagg, P.R.; Jacobs, G.A. Manual for the Statetrait Anxiety Inventory (Form Y); Consulting Psychologist Press: Palo Alto, CA, USA, 1988. [Google Scholar]
- Schneider, M.; Chau, L.; Mohamadpour, M.; Stephens, N.; Arya, K.; Grant, A. EEG asymmetry and BIS/BAS among healthy adolescents. Biol. Psychol. 2016, 120, 142–148. [Google Scholar] [CrossRef]
- Pascual-Marqui, R.D. Standardized low-resolution brain electromagnetic tomography (sLORETA): Technical details. Methods Find Exp. Clin. Pharm. 2002, 24, 5–12. [Google Scholar]
- Hagemann, D.; Naumann, E.; Becker, G.; Maier, S.; Bartussek, D. Frontal brain asymmetry and affective style: A conceptual replication. Psychophysiology 1998, 35, 372–388. [Google Scholar] [CrossRef] [PubMed]
- Hagemann, D.; Naumann, E.; Thayer, J.F. The quest for the EEG reference revisited: A glance from brain asymmetry research. Psychophysiology 2001, 38, 847–857. [Google Scholar] [CrossRef]
- Hagemann, D. Individual differences in anterior EEG asymmetry: Methodological problems and solutions. Biol. Psychol. 2004, 67, 157–182. [Google Scholar] [CrossRef] [PubMed]
- Fuchs, M.; Kastner, J.; Wagner, M.; Hawes, S.; Ebersole, J.S. A standardized boundary element method volume conductor model. Clin. Neurophysiol. 2002, 113, 702–712. [Google Scholar] [CrossRef]
- Jurcak, V.; Tsuzuki, D.; Dan, I. 10/20, 10/10, and 10/5 systems revisited: Their validity as relative head-surface-based positioning systems. NeuroImage 2007, 34, 1600–1611. [Google Scholar] [CrossRef]
- Pizzagalli, D.A.; Sherwood, R.J.; Henriques, J.B.; Davidson, R.J. Frontal brain asymmetry and reward responsiveness: A source-localization study. Psychol. Sci. 2005, 16, 805–813. [Google Scholar] [CrossRef] [PubMed]
- Pascual-Marqui, R.D.; Biscay, R.J.; Bosch-Bayard, J.; Lehmann, D.; Kochi, K.; Yamada, N.; Kinoshita, T.; Sadato, N. Isolated effective coherence (iCoh): Causal information flow excluding indirect paths. arXiv 2014, arXiv:1402.4887. [Google Scholar]
- Salmaso, D.; Longoni, A.M. Problems in the assessment of hand preference. Cortex 1985, 21, 533–549. [Google Scholar] [CrossRef]
- Gratton, G.; Coles, M.G.; Donchin, E. A new method for off-line removal of ocular artifact. Electroencephalogr. Clin. Neurophysiol. 1983, 55, 468–484. [Google Scholar] [CrossRef]
- Harmon-Jones, E.; Allen, J.J. Behavioral activation sensitivity and resting frontal EEG asymmetry: Covariation of putative indicators related to risk for mood disorders. J. Abnorm. Psychol. 1997, 106, 159. [Google Scholar] [CrossRef]
- Allen, J.J.B.; Coan, J.A.; Nazarian, M. Issues and assumptions on the road from raw signals to metrics of frontal EEG asymmetry in emotion. Biol. Psychol. 2004, 67, 183–218. [Google Scholar] [CrossRef] [PubMed]
- Tomarken, A.J.; Davidson, R.J.; Wheeler, R.E.; Kinney, L. Psychometric Properties of Resting Anterior EEG Asymmetry: Temporal Stability and Internal Consistency. Psychophysiology 1992, 29, 576–592. [Google Scholar] [CrossRef]
- Cicchetti, D.V.; Sparrow, S.A. Developing criteria for establishing interrater reliability of specific items: Applications to assessment of adaptive behavior. Am. J. Ment. Defic. 1981, 86, 127–137. [Google Scholar]
- Pascual-Marqui, R.D. Discrete, 3D distributed, linear imaging methods of electric neuronal activity. Part 1: Exact, zero error localization. arXiv 2007, arXiv:0710.3341. [Google Scholar]
- Pascual-Marqui, R.D. Theory of the EEG inverse problem. In Quantitative EEG Analysis: Methods and Clinical Applications; Tong, S., Thakor, N.V., Eds.; Artech House: Boston, MA, USA, 2009; pp. 121–140. [Google Scholar]
- Okamoto, M.; Dan, H.; Sakamoto, K.; Takeo, K.; Shimizu, K.; Kohno, S.; Oda, I.; Isobe, S.; Suzuki, T.; Kohyama, K.; et al. Three-dimensional probabilistic anatomical cranio-cerebral correlation via the international 10–20 system oriented for transcranial functional brain mapping. NeuroImage 2004, 21, 99–111. [Google Scholar] [CrossRef]
- Siclari, F.; Bernardi, G.; Riedner, B.A.; LaRocque, J.J.; Benca, R.M.; Tononi, G. Two Distinct Synchronization Processes in the Transition to Sleep: A High-Density Electroencephalographic Study. Sleep 2014, 37, 1621–1637. [Google Scholar] [CrossRef] [PubMed]
- Nichols, T.E.; Holmes, A.P. Nonparametric permutation tests for functional neuroimaging: A primer with examples. Hum. Brain Mapp. 2002, 15, 1–25. [Google Scholar] [CrossRef] [PubMed]
- Grech, R.; Cassar, T.; Muscat, J.; Camilleri, K.P.; Fabri, S.G.; Zervakis, M.; Xanthopoulos, P.; Sakkalis, V.; Vanrumste, B. Review on solving the inverse problem in EEG source analysis. J. Neuroeng. Rehabil. 2008, 5, 25. [Google Scholar] [CrossRef]
- Lehmann, D.; Faber, P.L.; Tei, S.; Pascual-Marqui, R.D.; Milz, P.; Kochi, K. Reduced functional connectivity between cortical sources in five meditation traditions detected with lagged coherence using EEG tomography. NeuroImage 2012, 60, 1574–1586. [Google Scholar] [CrossRef]
- Jatoi, M.A.; Kamel, N.; Malik, A.S.; Faye, I. EEG based brain source localization comparison of sLORETA and eLORETA. Australas. Phys. Eng. Sci. Med. 2014, 37, 713–721. [Google Scholar] [CrossRef]
- Martín-Buro, M.C.; Garcés, P.; Maestú, F. Test-retest reliability of resting-state magnetoencephalography power in sensor and source space. Hum. Brain Mapp. 2016, 37, 179–190. [Google Scholar] [CrossRef]
- Candelaria-Cook, F.T.; Schendel, M.E.; Ojeda, C.J.; Bustillo, J.R.; Stephen, J.M. Reduced parietal alpha power and psychotic symptoms: Test-retest reliability of resting-state magnetoencephalography in schizophrenia and healthy controls. Schizophr. Res. 2020, 215, 229–240. [Google Scholar] [CrossRef]
- Hagemann, D.; Naumann, E.; Thayer, J.F.; Bartussek, D. Does resting electroencephalograph asymmetry reflect a trait? An application of latent state-trait theory. J. Personal. Soc. Psychol. 2002, 82, 619–641. [Google Scholar] [CrossRef]
- Hagemann, D.; Hewig, J.; Seifert, J.; Naumann, E.; Bartussek, D. The latent state-trait structure of resting EEG asymmetry: Replication and extension. Psychophysiology 2005, 42, 740–752. [Google Scholar] [CrossRef] [PubMed]
- Davidson, R.J. Cerebral asymmetry and emotion: Conceptual and methodological conundrums. Cogn. Emot. 1993, 7, 115–138. [Google Scholar] [CrossRef]
- Davidson, R.J. Anterior electrophysiological asymmetries, emotion, and depression: Conceptual and methodological conundrums. Psychophysiology 1998, 35, 607–614. [Google Scholar] [CrossRef] [PubMed]
- Coan, J.A.; Allen, J.J.B. The state and trait nature of frontal EEG asymmetry in emotion. In The Asymmetrical Brain; Hugdahl, K., Davidson, R.J., Eds.; MIT Press: Cambridge, MA, USA, 2003; pp. 565–615. [Google Scholar]
- Kringelbach, M.L.; Rolls, E.T. The functional neuroanatomy of the human orbitofrontal cortex: Evidence from neuroimaging and neuropsychology. Prog. Neurobiol. 2004, 72, 341–372. [Google Scholar] [CrossRef] [PubMed]
- Kim, H.; Shimojo, S.; O’Doherty, J.P. Overlapping responses for the expectation of juice and money rewards in human ventromedial prefrontal cortex. Cereb. Cortex 2011, 21, 769–776. [Google Scholar] [CrossRef]
- Montague, P.R.; Berns, G.S. Neural Economics and the Biological Substrates of Valuation. Neuron 2002, 36, 265–284. [Google Scholar] [CrossRef]
- Levy, D.J.; Glimcher, P.W. The root of all value: A neural common currency for choice. Curr. Opin. Neurobiol. 2012, 22, 1027–1038. [Google Scholar] [CrossRef]
- Zhu, J. Neural Representation of Social, Monetary and Chocolate Reinforcer Processing; Aston University: Birmingham, UK, 2016. [Google Scholar]
- Elliott, R.; Friston, K.J.; Dolan, R.J. Dissociable Neural Responses in Human Reward Systems. J. Neurosci. 2000, 20, 6159. [Google Scholar] [CrossRef] [PubMed]
- Rolls, E.T. The orbitofrontal cortex and reward. Cereb. Cortex 2000, 10, 284–294. [Google Scholar] [CrossRef] [PubMed]
- Carmichael, S.T.; Price, J.L. Sensory and premotor connections of the orbital and medial prefrontal cortex of macaque monkeys. J. Comp. Neurol. 1995, 363, 642–664. [Google Scholar] [CrossRef] [PubMed]
- Montague, P.R.; McClure, S.M.; Baldwin, P.R.; Phillips, P.E.M.; Budygin, E.A.; Stuber, G.D.; Kilpatrick, M.R.; Wightman, R.M. Dynamic Gain Control of Dopamine Delivery in Freely Moving Animals. J. Neurosci. 2004, 24, 1754. [Google Scholar] [CrossRef][Green Version]
- Tanji, J.; Hoshi, E. Behavioral planning in the prefrontal cortex. Curr. Opin. Neurobiol. 2001, 11, 164–170. [Google Scholar] [CrossRef]
- Schmidt, L.; d’Arc, B.F.; Lafargue, G.; Galanaud, D.; Czernecki, V.; Grabli, D.; Schüpbach, M.; Hartmann, A.; Lévy, R.; Dubois, B. Disconnecting force from money: Effects of basal ganglia damage on incentive motivation. Brain 2008, 131, 1303–1310. [Google Scholar] [CrossRef]
- Peters, J.; Büchel, C. Episodic Future Thinking Reduces Reward Delay Discounting through an Enhancement of Prefrontal-Mediotemporal Interactions. Neuron 2010, 66, 138–148. [Google Scholar] [CrossRef]
- Ridderinkhof, K.R.; Ullsperger, M.; Crone, E.A.; Nieuwenhuis, S. The role of the medial frontal cortex in cognitive control. Science 2004, 306, 443–447. [Google Scholar] [CrossRef]
- Pochon, J.B.; Levy, R.; Fossati, P.; Lehericy, S.; Poline, J.B.; Pillon, B.; Le Bihan, D.; Dubois, B. The neural system that bridges reward and cognition in humans: An fMRI study. Proc. Natl. Acad. Sci. USA 2002, 99, 5669–5674. [Google Scholar] [CrossRef]
- Shamay-Tsoory, S.G.; Aharon-Peretz, J.; Perry, D. Two systems for empathy: A double dissociation between emotional and cognitive empathy in inferior frontal gyrus versus ventromedial prefrontal lesions. Brain 2009, 132, 617–627. [Google Scholar] [CrossRef]
- Benoit, R.G.; Gilbert, S.J.; Burgess, P.W. A Neural Mechanism Mediating the Impact of Episodic Prospection on Farsighted Decisions. J. Neurosci. 2011, 31, 6771. [Google Scholar] [CrossRef] [PubMed]
- Kwan, D.; Craver, C.F.; Green, L.; Myerson, J.; Rosenbaum, R.S. Dissociations in future thinking following hippocampal damage: Evidence from discounting and time perspective in episodic amnesia. J. Exp. Psychol. Gen. 2013, 142, 1355–1369. [Google Scholar] [CrossRef]
- Race, E.; Keane, M.M.; Verfaellie, M. Medial Temporal Lobe Damage Causes Deficits in Episodic Memory and Episodic Future Thinking Not Attributable to Deficits in Narrative Construction. J. Neurosci. 2011, 31, 10262. [Google Scholar] [CrossRef]
- Race, E.; Keane, M.M.; Verfaellie, M. Losing sight of the future: Impaired semantic prospection following medial temporal lobe lesions. Hippocampus 2013, 23, 268–277. [Google Scholar] [CrossRef]
- Tulving, E. Memory and consciousness. Can. Psychol. Psychol. Can. 1985, 26, 1–12. [Google Scholar] [CrossRef]
- Squire, L.R.; van der Horst, A.S.; McDuff, S.G.R.; Frascino, J.C.; Hopkins, R.O.; Mauldin, K.N. Role of the hippocampus in remembering the past and imagining the future. Proc. Natl. Acad. Sci. USA 2010, 107, 19044–19048. [Google Scholar] [CrossRef] [PubMed]
- Palombo, D.J.; Keane, M.M.; Verfaellie, M. The medial temporal lobes are critical for reward-based decision making under conditions that promote episodic future thinking. Hippocampus 2015, 25, 345–353. [Google Scholar] [CrossRef]
- Xu, J.; Lyu, H.; Li, T.; Xu, Z.; Fu, X.; Jia, F.; Wang, J.; Hu, Q. Delineating functional segregations of the human middle temporal gyrus with resting-state functional connectivity and coactivation patterns. Hum. Brain Mapp. 2019, 40, 5159–5171. [Google Scholar] [CrossRef]
- Goel, V.; Grafman, J.; Sadato, N.; Hallett, M. Modeling other minds. Neuroreport 1995, 6, 1741–1746. [Google Scholar] [CrossRef]
- Carver, C.S.; Johnson, S.L.; Joormann, J. Two-Mode Models of Self-Regulation as a Tool for Conceptualizing Effects of the Serotonin System in Normal Behavior and Diverse Disorders. Curr. Dir. Psychol. Sci. 2009, 18, 195–199. [Google Scholar] [CrossRef]
- MacDonald, K.B. Effortful control, explicit processing, and the regulation of human evolved predispositions. Psychol. Rev. 2008, 115, 1012–1031. [Google Scholar] [CrossRef]
- Raine, A. From Genes to Brain to Antisocial Behavior. Curr. Dir. Psychol. Sci. 2008, 17, 323–328. [Google Scholar] [CrossRef]
- Knutson, B.; Adams, C.M.; Fong, G.W.; Hommer, D. Anticipation of increasing monetary reward selectively recruits nucleus accumbens. J. Neurosci. 2001, 21, RC159. [Google Scholar] [CrossRef] [PubMed]
- Basar, K.; Sesia, T.; Groenewegen, H.; Steinbusch, H.W.M.; Visser-Vandewalle, V.; Temel, Y. Nucleus accumbens and impulsivity. Prog. Neurobiol. 2010, 92, 533–557. [Google Scholar] [CrossRef] [PubMed]
- Glenn, A.L.; Yang, Y. The Potential Role of the Striatum in Antisocial Behavior and Psychopathy. Biol. Psychiatry 2012, 72, 817–822. [Google Scholar] [CrossRef]
- Buckholtz, J.W.; Treadway, M.T.; Cowan, R.L.; Woodward, N.D.; Li, R.; Ansari, M.S.; Baldwin, R.M.; Schwartzman, A.N.; Shelby, E.S.; Smith, C.E.; et al. Dopaminergic Network Differences in Human Impulsivity. Science 2010, 329, 532. [Google Scholar] [CrossRef]
- Buckholtz, J.W.; Treadway, M.T.; Cowan, R.L.; Woodward, N.D.; Benning, S.D.; Li, R.; Ansari, M.S.; Baldwin, R.M.; Schwartzman, A.N.; Shelby, E.S.; et al. Mesolimbic dopamine reward system hypersensitivity in individuals with psychopathic traits. Nat. Neurosci. 2010, 13, 419–421. [Google Scholar] [CrossRef]
- Bjork, J.M.; Chen, G.; Hommer, D.W. Psychopathic tendencies and mesolimbic recruitment by cues for instrumental and passively obtained rewards. Biol. Psychol. 2012, 89, 408–415. [Google Scholar] [CrossRef] [PubMed]
- Geurts, D.E.M.; von Borries, K.; Volman, I.; Bulten, B.H.; Cools, R.; Verkes, R.-J. Neural connectivity during reward expectation dissociates psychopathic criminals from non-criminal individuals with high impulsive/antisocial psychopathic traits. Soc. Cogn. Affect. Neurosci. 2016, 11, 1326–1334. [Google Scholar] [CrossRef]
- Angelides, N.H.; Gupta, J.; Vickery, T.J. Associating resting-state connectivity with trait impulsivity. Soc. Cogn. Affect. Neurosci. 2017, 12, 1001–1008. [Google Scholar] [CrossRef] [PubMed]
- Davidson, R.J. Affect, cognition, and hemispheric specialization. In Emotions, Cognition, and Behavior; Izard, C.E., Kagan, J., Eds.; Cambridge University Press: New York, NY, USA, 1985; pp. 320–365. [Google Scholar]
- Nusslock, R.; Harmon-Jones, E.; Alloy, L.B.; Urosevic, S.; Goldstein, K.; Abramson, L.Y. Elevated left mid-frontal cortical activity prospectively predicts conversion to bipolar I disorder. J. Abnorm. Psychol. 2012, 121, 592–601. [Google Scholar] [CrossRef] [PubMed]
- Cyders, M.A.; Dzemidzic, M.; Eiler, W.J.; Coskunpinar, A.; Karyadi, K.A.; Kareken, D.A. Negative Urgency Mediates the Relationship between Amygdala and Orbitofrontal Cortex Activation to Negative Emotional Stimuli and General Risk-Taking. Cereb. Cortex 2015, 25, 4094–4102. [Google Scholar] [CrossRef] [PubMed]
- Ocklenburg, S.; Berretz, G.; Packheiser, J.; Friedrich, P. Laterality 2020: Entering the next decade. Laterality 2020, 1–33. [Google Scholar] [CrossRef] [PubMed]


Publisher’s Note: MDPI stays neutral with regard to jurisdictional claims in published maps and institutional affiliations. |
© 2020 by the authors. Licensee MDPI, Basel, Switzerland. This article is an open access article distributed under the terms and conditions of the Creative Commons Attribution (CC BY) license (http://creativecommons.org/licenses/by/4.0/).