Article

Ontology-Based Decision Support Tool for Automatic Sleep Staging Using Dual-Channel EEG Data

1
School of Electronic and Information Engineering, Lanzhou Jiaotong University, Lanzhou 730070, China
2
Key Laboratory of Opto-Technology and Intelligent Control, Ministry of Education, Lanzhou Jiaotong University, Lanzhou 730070, China
3
School of Information Science and Engineering, Lanzhou University, Lanzhou 730000, China
*
Authors to whom correspondence should be addressed.
Symmetry 2020, 12(11), 1921; https://doi.org/10.3390/sym12111921
Submission received: 25 September 2020 / Revised: 10 November 2020 / Accepted: 20 November 2020 / Published: 21 November 2020

Abstract

:
Sleep staging has attracted significant attention as a critical step in auxiliary diagnosis of sleep disease. To avoid subjectivity of doctor’s manual sleep staging, and to realize scientific management of massive physiological data, an ontology-based decision support tool is proposed. The tool implements an automated procedure for sleep staging using dual-channel electroencephalogram (EEG) signals. First of all, it encodes EEG features, sleep-related concepts and other contextual information to “EEG-Sleep ontology”. Secondly, a rule-set is constructed based on a data mining technique. Finally, the first two steps are processed in a reasoning engine which is automatically assign each 30 s epoch (segment) sleep stage to one of five possible sleep stages: WA, NREM1, NREM2, SWS and REM. The rule set is obtained using EEG data taken from the Sleep-EDF database [EXPANDED] according to the random forest algorithm (RF), we prove that the performance of the proposed method with 89.12% accuracy, and 0.81 Kappa statistics is superior to other algorithms such as Bayesian network, C4.5, support vector machine, and multilayer perceptron. Additionally, our proposed approach improved performance when compared to other studies using a small subset of the Sleep-EDF database [EXPANDED].

1. Introduction

Sleep staging is traditionally performed by well-trained experts based on the visual interpretation of the Polysomnography (PSG) according to the R&K rules [1] or new guideline developed by the American academy of sleep medicine (AASM) [2]. PSG is a set of concurrent physiological signals recorded over a whole night’s sleep, the signals principally include: (1) EEG, (2) electrooculogram (EOG), and (3) chin electromyogram (EMG). The recording period is generally divided into fixed epochs of 20 or 30 s prior to being recognized as different sleep states. In this study, we use five-state sleep stages according to standard R&K rules: (1) wake (WA), (2) non-rapid eye movement (NREM) sleep stage NREM1, (3) NREM2, (4) and the slow wave sleep (SWS) [3]. NREM3 and NREM4 are pooled into SWS and (5) rapid eye movement (REM).
The incidence of sleep-related diseases is increasing, including: sleep apnea [4], insomnia [5], narcolepsy, and depression [6,7]. Such conditions have potentially serious effect on the health and quality of life (QoL) of those suffering from such sleep disorders. Studies have shown that sleep apnea affects over 2% of adult women and 4% of adult men [4] and Ohayon [5] found that insomnia is experienced by approximately 33% in the general population. Accurate and effective identification of sleep stages plays a major role in assisting the diagnosis of sleep related conditions.
Generally, healthy adult require seven to eight hours sleep daily. When asleep, the proportion of WA, NREM1, NREM2, SWS, and REM is 3 ± 2%, 3.5 ± 1.5%, 50 ± 5%, 18 ± 5%, 22.5 ± 2.5% respectively [8]. These proportions reveal alterations in sleep internal architecture. If the proportions are not within the normal ranges, then sleep-related disorders may be present and the relative proportions may provide an effective basis for diagnosis. Thus, accurate recognition of sleep stages serves as an important aspect for the investigation sleep-related disorders.
Manual sleep staging (visual interpretation) is a subjective and time-consuming process. Studies have shown that there are often inconsistencies in manual sleep staging by different experts [9]. However, with the development of advanced data mining techniques and signal processing methods, automatic sleep staging has gained traction as shown by published studies, see for example [10,11].
In general, the automatic staging process is implemented by the extraction of a large number of EEG features. However, managing and organizing unstructured EEG features is a complex and time-consuming process for a computer system. To solve this problem, Ontology-Based Modeling (OBM) has been shown to be an effective method, OBM being useable as a simple data structure while incorporating the capability of reasoning and inference.
Ontology has been often used in knowledge representation and classification as a decision support tool [12,13]. The major advantages of ontology are [14]: (1) it can be realized the effectiveness, specification, conciseness, decidability, and consistency of knowledge representation, (2) it offers facilities for knowledge acquisition, knowledge sharing and knowledge reuse, (3) the huge feature set can be managed organically and hierarchically.
Based on the above discussion, we proposed an OBM-based decision support tool for automatic sleep staging to represent EEG features, sleep-related concepts and contextual information. Meanwhile, a rule-set is constructed using EEG features and the related result of visual interpretation. Finally, EEG-Sleep ontology and the rule-set are added to a reasoning engine for automatic sleep staging.
The remainder of this paper is organized as follows: the following section will provide a review of existing empirical research on automatic sleep staging. Section 3 introduces the visual interpretation. Section 4 presents the ontology-based decision support tool framework and all its modules. Section 5 sets out the experimentation with the results and a discussion. The last section gives conclusions with potential topics for future work.

2. Related Work

Recently, researchers have proposed various methods of sleep stages, including: (1) neural networks [3,15,16,17], (2) hidden markov models [18], (3) decision trees [19], (4) visibility graphs [20], (5) spectral analysis of frequency bands [21], (6) fuzzy system [22], (7) multi-scale entropy [23], and (8) autoregressive models [24]. Research has employed EEG features [15,16,22,23,24] and EEG, EOG, EMG, and ECG features [17,18,19,21,25]. Charbonnier et al. [18] suggests that PSG signals should be processed with adequate techniques to obtain inputs to the classifier, which are the most similar to the visual interpretation information used by experts. The goal is to obtain acceptable results for automatic sleep staging.
The diverse approaches documented in the literature each have differing advantages and limitations. Table 1 lists an overview of the literature and the methods proposed in this study. These studies are usually based on a large number of features, but they cannot provide a specific representation and management method for these features. Additionally, the methods being proposed have significant limitations in that they fail to generalize and have never been used on a large scale.
OBM has been applied in many fields such as attack detection [26], software engineering [27], agriculture [28], medical practice [29], and so on. However, OBM was mainly used for data description and the management of knowledge in the biomedical field [30,31]. In practice, OBM has often been applied as a knowledge-driven decision support tool [32]. For example, Dasmahapatra et al. [33] use ontology to represent the varied nature of expertise by describing concepts and relationships for breast cancer. Zhang et al. [14] have implemented an ontology-driven tool that can assist physicians in cases of mild cognitive impairment (MCI) in which ontology is used to represent knowledge related to the semantic structure of cortical thickness. Previous research has not generally used OBM to describe and manage EEG features. Su et al. [34] have recently proposed an approach using OBM to describe EEG features in emotion recognition.
Based on the research identified and the reported results, this paper proposes an ontology-based decision support tool which exploits ontological representation and management of sleep staging with related information along with data mining technology to enable an effective achievement of automatic sleep staging. This tool will assist physicians to improve the accuracy and effectiveness in the diagnosis of sleep-related disorders. In addition, this paper uses many symbols and abbreviations for simplicity and readability, which are listed in Table 2.

3. Visual Interpretation

Traditionally, sleep staging have been divided based on PSG visual interpretation using the R&K rules [1]. For five different sleep stages, EEG signals have different characteristic waves as briefly described in Table 3.

4. Materials and Methods

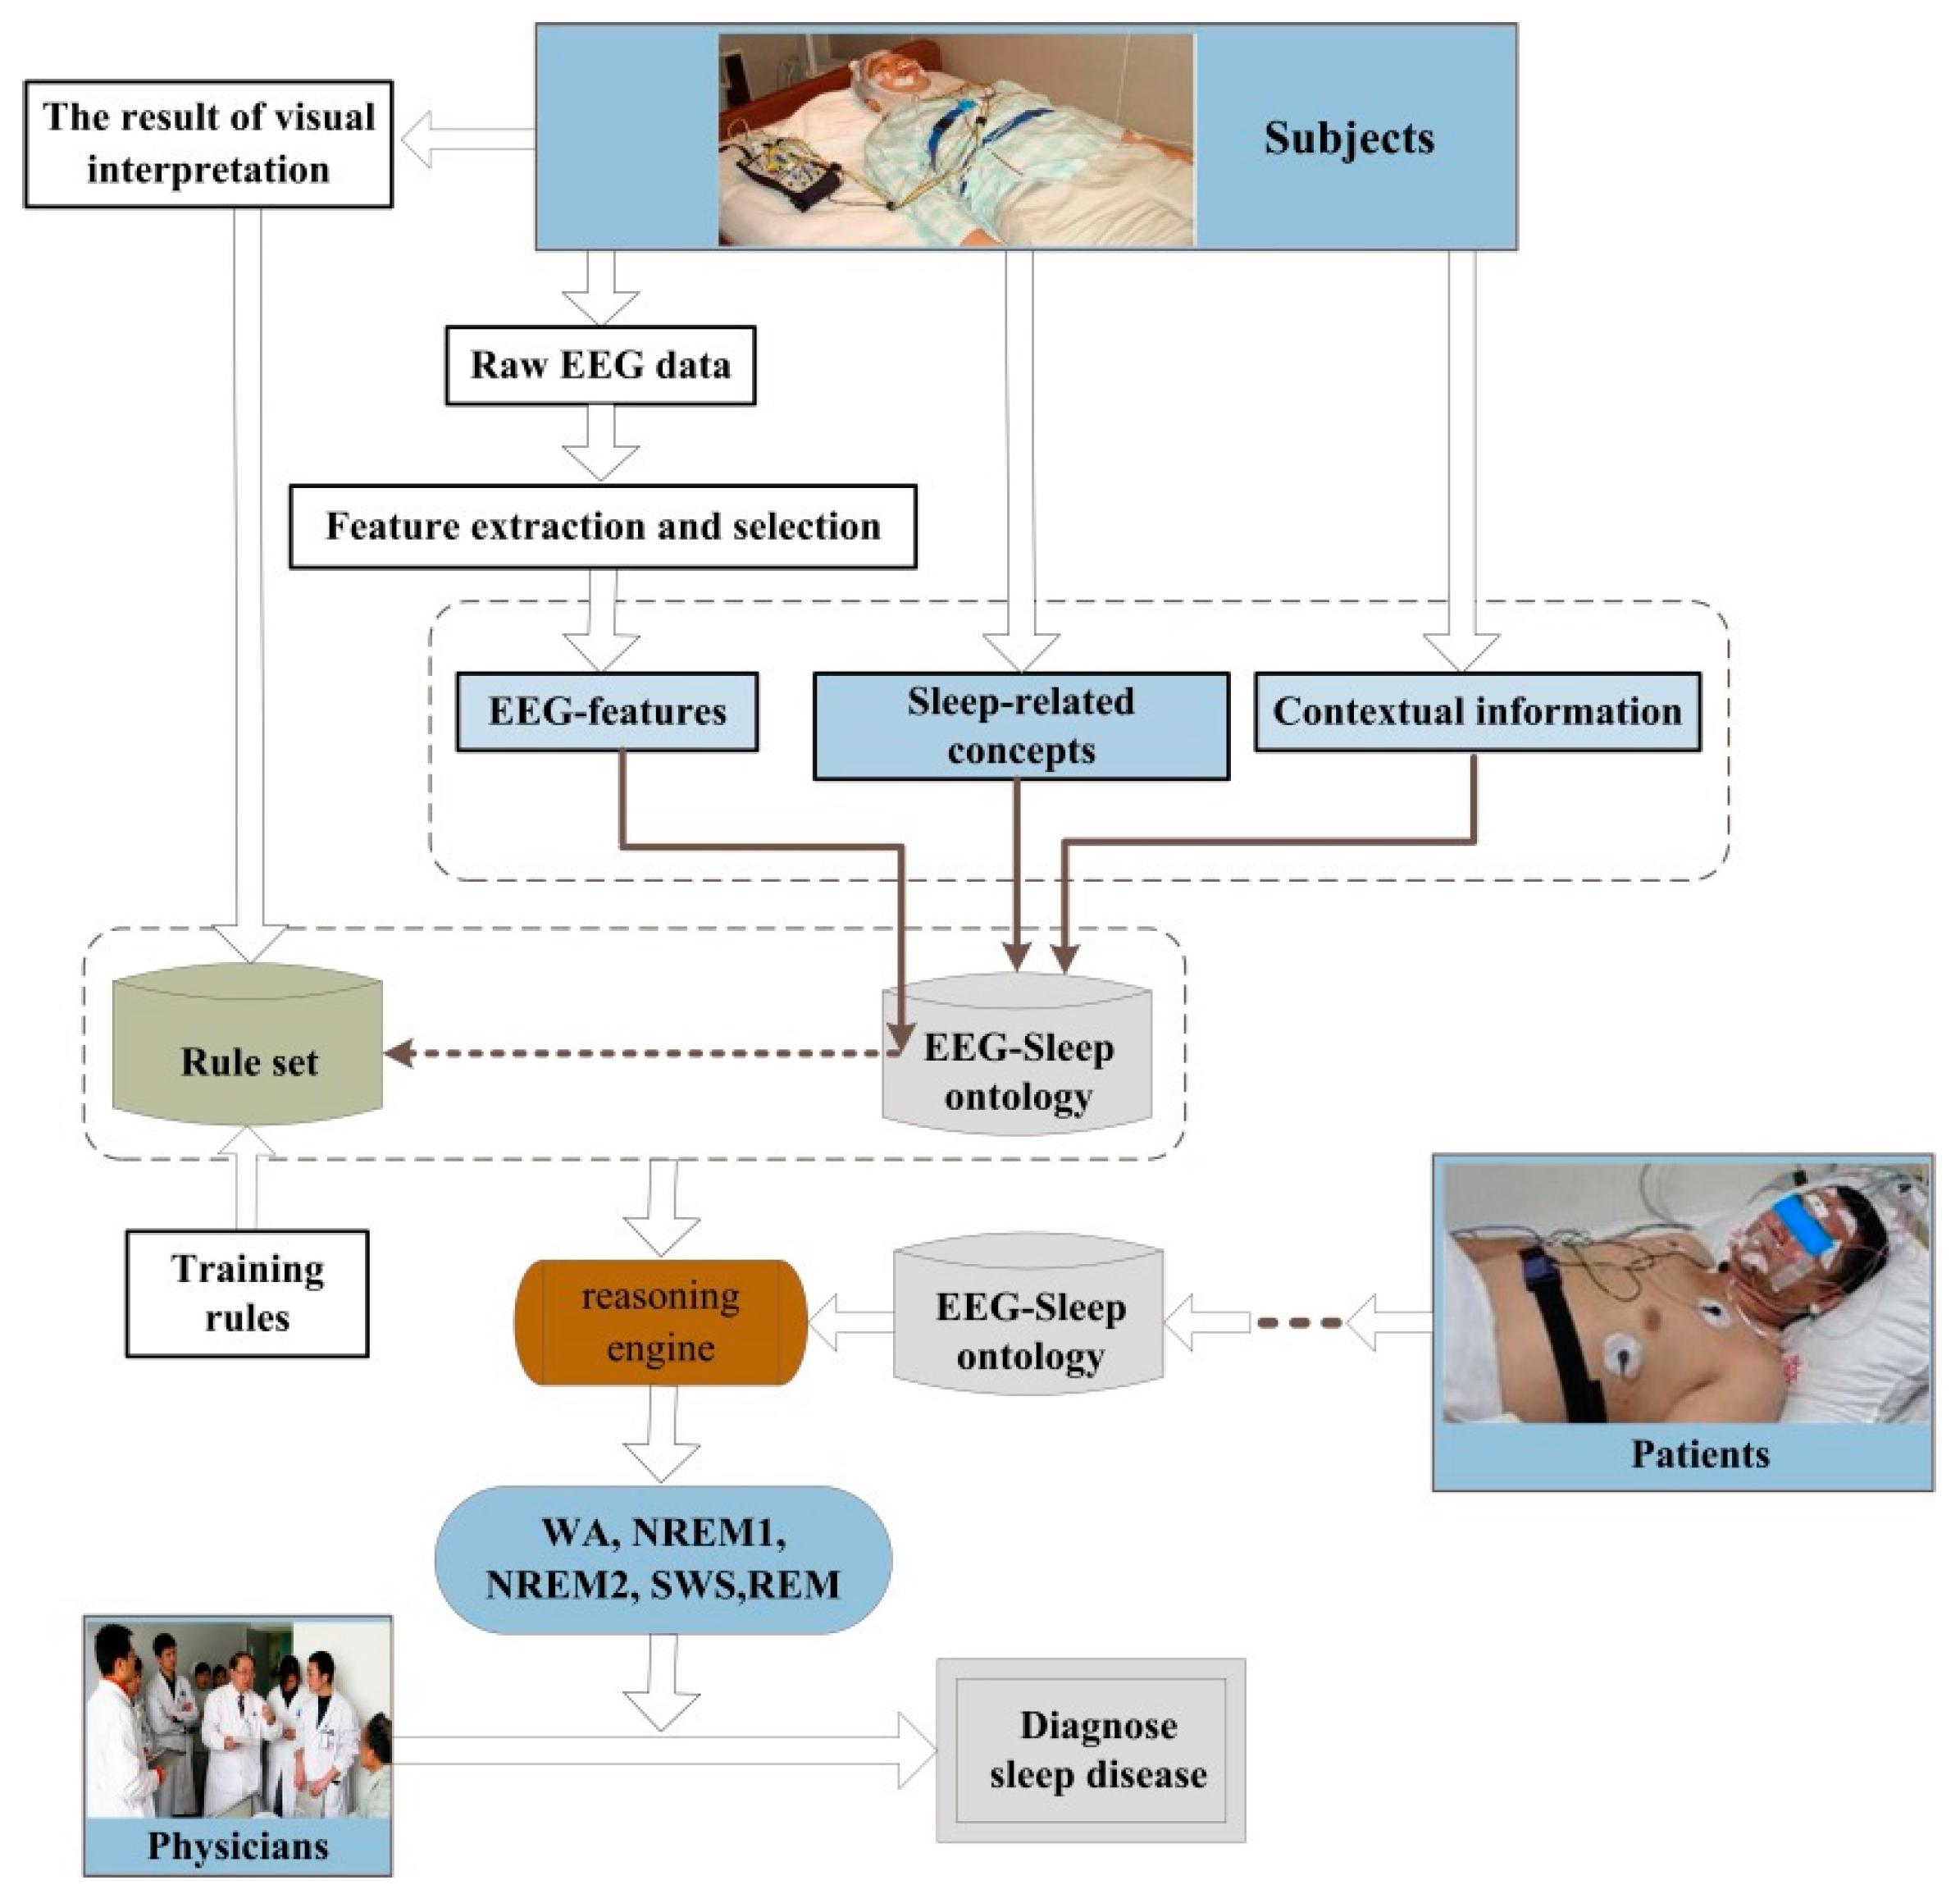
4.1. The Architecture of the Automatic Sleep Staging Tool

The architecture of the automatic sleep staging tool is shown in Figure 1. This architecture consists of three principal modules: EEG-Sleep ontology, a rule set, and a reasoning engine. The simplified operating procedure is as follows:
(1) Raw data were collected from sleeping of subjects.
(2) Given that the raw EEG data cannot be directly used for automatic sleep staging, a large set of EEG-features are extracted and selected from raw EEG data.
(3) Next, the set of EEG-features, sleep-related concepts, and contextual information are mapped to an ontology (termed EEG-Sleep ontology), which will be used to represent and manage the above three kinds of information.
(4) The rule set is trained using an EEG features set and the related result of visual interpretation based on training rules.
(5) EEG-Sleep ontology together with rule set compose a reasoning engine, which will be applied to infer five-state sleep stages.
(6) To collect raw data during periods when patients are sleeping, repeat step 1. This creates EEG-Sleep ontology for patients who are used to managing related information. The EEG-Sleep ontology of patients act as the input of a reasoning engine, which is to implement automatic sleep staging by querying the rule set.
(7) Finally, the reasoning engine output five-state sleep stages (WA, NREM1, NREM2, SWS and REM) is used to assist physicians in diagnosing sleep-related disease.

4.2. Data Description and Preprocessing

4.2.1. Data Description

The raw EEG data and peripheral physiological information are obtained from the Sleep-EDF database (EXPANDED) [35,36], which belongs to PhysioBank [37]. Sixty one data recordings were taken from 42 Caucasian subjects. The demographic range is 18 to 66 years at the time of the recordings with the population consisting of 25 males and 17 females.
The initial 39 sets of data were recorded in 1987–1991 from healthy volunteers, the data recordings (SC*PSG.edf files) were obtained during approximately 20 h while volunteers were staying at home. The final 22 sets of data were recorded in 1994 from participants who experienced mild difficulty in falling asleep, in all other respects the subjects were healthy, the data recordings (ST*PSG.edf files) were collected during an overnight stay in hospital.
The data recordings include EEG data from Fpz-Cz and Pz-Oz electrode locations, horizontal EOG, each sampled at 100 Hz. In addition, the SC*PSG.edf files contain the submental EMG, oro-nasal respiration, rectal body temperature, all sampled at 1 Hz. The ST*PSG.edf files also contain submental EMG sampled at 100 Hz and an event marker sampled at 1 Hz.
In this study, we only chose dual channel EEG in Fpz-Cz and Pz-Oz to complete automatic sleep staging. The main reasons for this are as follows:
(1) A variety of physiological signals can reflect different states of sleep staging. However, EEG signals have been shown to be the most effective physiological signs for sleep staging [3].
(2) In this study, EEG signals from the Sleep-EDF database (EXPANDED) were used to verify the performance of the proposed automatic sleep staging, and there is only dual-channel EEG in this data set.
(3) The International standard for EEG electrode placement specifies C4-A1 and C3-A2 [1], however because the Sleep-EDF database (EXPANDED) contains only Fpz-Cz and Pz-Oz, we used Fpz-Cz and Pz-Oz EEG signals instead of C4-A1 and C3-A2 EEG signals, as suggested by [38].
The original EEG epochs were assigned to one of the following eight-state sleep stages: WA, NREM1, NREM2, NREM3, NREM4, REM, and MVT (Movement time) and UNS (unknown states), with each epoch fixed as 30 s. In this study we only employ five-states: WA, NREM1, NREM2, SWS (NREM3 and NREM4), and REM for sleep staging.

4.2.2. Data Preprocessing

The majority of the sleep signals fall within the 0.5 to 30 Hz range, thus a band-pass Butterworth filter with a low cut-off frequency of 0.5 Hz and a high cut-off frequency of 30 Hz is applied to eliminate low-frequency breathing waves and high-frequency electromyography waves in this study.
To prevent the influence of extreme or abnormal values on the research, the EEG data for each channel of each subject are normalized in the range (0, 1) using a Min–Max normalization and the process is as follows:
X n o r m = x m i n m a x m i n
X is the initial value, Xnorm is the normalized value, minis the minimum value of all data in a channel, and max is the maximum value of all data in a channel.

4.3. EEG Features Extraction

Typically, EEG is described in terms of rhythmic activity subdivided into bandwidths known as alpha, beta, theta, delta, spindle, sawtooth, and K complex characteristic waves. Hsu et al. [16] have defined the ranges between frequency bands as follows: alpha (8–13 Hz), beta (12–30 Hz), theta (4–8 Hz), delta (0.5–2 Hz), spindle (12–14 Hz), sawtooth (2–6 Hz), and K complex (1 Hz). In order to extract more effective features, sleep physiological signals were filtered using the Hanning filter and the abovementioned seven bands were divided for further feature extraction.
The methods used in calculating the EEG features most relevant to our study are listed below:
(1) Average amplitude: the amplitude refers to the maximum value of EEG signal change, that is, the peak value. The average amplitude refers to the average value between the peaks of EEG signal.
(2) Variance: is the sample variance of the EEG signal as computed shown in (2):
var = 1 n i = 1 n ( x ( i ) μ ) 2
where μ is the mean of the EEG signal sample, and n is the number of EEG signal sample in the 30 s epochs (in our paper this number is 3000).
(3) Skewness: is a measure of the asymmetry of the EEG around the sample mean. Defined as (3):
skew = E ( x μ ) 3 / σ 3
where σ is the standard deviation of the EEG signal, and E is the mathematical expectation.
(4) Kurtosis: is a measure of how outlier-prone a probability distribution:
kurt = E ( x μ ) 4 / σ 4
(5) Hjorth parameters: are indicators of statistical properties used in signal processing in the time domain. The Hjorth parameters are normalized slope descriptors (NSDs) usually used in sleep EEG processing for data reducing and automatic sleep staging [39]. The parameters are: Activity (Act), Mobility (Mob), and Complexity (Com).
Act: is a measure of the variance of the amplitude, also known as mean power, and was obtained by (5):
Act = 1 n 1 i = 1 n ( x ( i ) var ) 2
Mob: is the standard deviation of the slope of the EEG signal normalized by its standard deviation and obtained by (6) and (7):
x d ( i ) = x ( i + 1 ) x ( i ) T e i [ 2 , n ]
Mob = ( 1 n 2 i = 2 n ( x d ( i ) var d ) 2 / 1 n 1 i = 1 n ( x ( i ) var ) 2 ) 1 / 2
Com: represents the change in frequency. It displays values below 1 for EEG signals more complex than a sine wave and was obtained by (8) and (9):
x d d ( i ) = ( x ( i ) 2 x ( i 1 ) + x ( i 2 ) ) T e 2 i [ 3 , n ]
Com = ( 1 n 3 i = 3 n ( x d d ( i ) var d d ) 2 / 1   n 1 i = 1 n ( x ( i ) var ) 2 ) 1 / 2
(6) Absolute spectral power and relative spectral power: absolute spectral power represents the total power in a frequency band such as f1 and f2. Relative spectral power depends on the spectral composition of the signal and is expressed as relative frequency units. For example, let Sxx(fi) be the power spectral density computed at frequency fi for the signal x. The relative spectral power in the frequency band [f1, f2] is given by (10):
Pxx , rel ( f 1 ,   f 2 ) = fi = f 1 f 2 Sxx ( f i ) · Δ f Pxx , tot
where Δ f = Fs / N , with Fs is the sampling rate (in our paper this rate is 100 Hz) and N is number of samples in x. Pxx , tot is the total power in m different frequency bands as shown in (10):
Pxx , tot = k = 1 m Pxx , rel ( fk , fk + 1 )
(7) Spectral entropy: is used to describe the relationship between power spectrum and entropy rate, which is defined by:
S p E ( X ) = π π l o g f ( w ) d w
(8) Shannon entropy: this feature reveals the uncertainty of physiological signal in a non-linear system, which is defined by:
S h E ( X ) = i = 1 n p ( x i ) l o g   p ( x i )
(9) Kolmogorov Entropy: is the greater the information loss rate, and as defined follows:
K o E = lim Δ t lim ε lim n i = 0 m P ( i 0 , i 1 , i n ) ln P ( i 0 , i 1 , i n )
(10) Largest lyapunov exponent: is used to characterize and differentiate pathological state, and is defined as follows:
λ m a x = 1 t n t 0 i = 1 n l o g L ( t i ) L ( t i 1 )
where L(ti) represents the shortest distance from the 0 point at time ti.
(11) C0-complexity: this feature reveals the proportion of non-linear components in the original physiological signal. The C0-complexity is obtained as follows:
C 0 = A 1 A 0 = n = 1 N | Y ( n ) X ( n ) | 2 n = 1 N | X ( n ) | 2
where A0 is the measurement of the non-linear components of the physiological signal, A0 is the measurement of the physiological signal.

4.4. EEG Features Selection

Traditionally, EEG is quantitatively analyzed using linear methods, which encompass frequency and time domain analyses. Linear methods can be used to construct a time series of EEG signals with a specific mathematical expression in several non-overlap frequency bands. These frequency bands appeared in different sleep staging and will be used as a visual interpretation criteria (see Section 3).
Recently, various statistic measures and non-linear methods are widely employed in EEG quantitative analysis. Because it is computationally impossible to verify all of the possible EEG features, in this study, we only extract EEG features that are widely acknowledged using three approaches:
(1) Linear methods: (a) the relative spectral power of alpha, beta, theta, delta, spindle, sawtooth, and K complex; (b) the absolute power of alpha, beta, theta, delta, spindle, sawtooth, and K complex; (c) the absolute ratio of beta power to delta power, sigma power to beta power, theta power to alpha power; and (d) the center frequency, hjorth parameters (Activity, Mobility, and Complexity), etc.
(2) Statistic methods: Average amplitude, Variance, Skewness, Kurtosis, etc.
(3) Nonlinear methods: Spectral entropy, Shannon entropy, Kolmogorov entropy, the max lyapunov exponent, C0-complexity, etc.
For the details of the above 3 categories of methods for extracting EEG see Section 4.3. Generally, selecting a feature subset that best reflects different sleep stages requires the testing of all possible combinations of features. Testing all feature combinations is extremely challenging, and to find the best feature combination is a complex, computationally intensive, and time consuming process. Given the issues and challenges identified, a heuristic algorithm [40] was applied to find optimal feature combinations from the feature set. In this paper, the heuristic algorithm consists of two parts: sequential forward selection (SFS) and sequential backward selection (SBS). SFS originates in a null set and each time a feature is selected, the evaluation function is triggered to achieve an optimal value. However, SBS originates in corpora, and each time a feature is removed, the evaluation function is triggered to achieve an optimal value. Finally, 40 features were selected according to the heuristic algorithm and the order of importance is as follows: Prel(Cz, δ), Com(Cz), Prel(Oz, δ), Act(Cz), Amp(Cz, ave), Amp(Oz, ave), Act(Oz), Prel(Cz, saw), Ent(Cz, spc), Mob(Cz), Mob(Oz), Com(Oz), Ent(Oz, spc), Prel(Oz, saw), Prel(Cz, θ), Pabs(Cz, θ), Pabs(Cz, saw), Prel(Oz, θ), Var(Oz), Var(Cz), Prel(Oz, β), Pabs(Cz, α), Pabs(Oz, saw), Pabs(Oz, δ), Pabs(Oz, α), Pabs(Oz, θ), Pabs(Cz, δ), Prel(Cz, β), Pabs(Cz, spi), Prel(Oz, spi), Prel(Cz, spi), Prel(Cz, α), Kurt(Cz), Pabs(Oz, α), Pabs(Oz, spi), Kurt(Oz), Pabs(Oz, β), Skew(Cz), Pabs(Cz, β), Skew(Oz). Because of space restriction, we only used the featured abbreviations. For example, Prel(Cz, δ) denotes the relative spectral power of delta on the Fpz-Cz electrode. Once the EEG features have been calculated, the EEG features, together with sleep-related concepts and contextual information, constitute the EEG-Sleep ontology.

4.5. Principal Components of the Automatic Sleep Staging Tool

The core issues of the automatic sleep staging tool include: (1) descriptive knowledge, (2) procedural knowledge, and (3) knowledge reasoning [41]. Thus, three main components are used to realize the above different core issues. The relationships between the main components and core issues are shown in Figure 2.
In Figure 2, descriptive knowledge is a domain of compositional elements such as original concepts with their properties and interrelationships. Thus, EEG-Sleep ontology is composed of EEG features, sleep-related concepts, and contextual information. Procedural knowledge realizes the generation of a rule set, and it includes training rules and training data. In this study, training input consists of two parts: EEG features and the corresponding results of visual interpretation. Knowledge reasoning based on the inference engine is constructed to enable the processing of formalized knowledge [31] according to the rule set.

4.5.1. EEG-Sleep Ontology

Normally, descriptive knowledge includes difference layers of technology. Therefore, a top-down method, as discussed in [42], is used to identify the layers composing the EEG-Sleep ontology structure from the most general to the most specific. The ontology structure is composed of three layers: category layer, class layer, and instance layer. Moreover, to improve the expressiveness of the sleep staging related knowledge, and to manage information of subjects or patients, we exploit the EEG-Sleep ontology, which is used to store EEG features, sleep-related concepts and contextual information. It provides the capability to simply represent the domain of interest in the form of terms. The essence of the terms lies in the core concepts, which constitute the basic elements used in reasoning. Each core concept is defined by means of an attribute set and an operation set. Generally, these core concepts are defined in the class layer with the attribute set and operation set defined in the instance layer. Additionally, the EEG-Sleep ontology defines two property types: “object” and “data” properties. “Object” properties are used to reflect the domain and range (in Semantic Web terms) of core concepts. “Data” properties are used to reflect data types in specific domains. Thus, “object” and “data” properties are used to connect three layers, or to connect different information in the same layer.
Based on the above design idea, the inheritance relationship between three layers can be established as shown in Figure 3. In detail, the top layer is the category layer. This layer mainly involves three parts: EEG features, sleep-related concepts, and contextual information. The core concepts about the three parts are shown in the class layer. For example, the domain of interest with respect to sleep-related concepts has two core concepts: sleep stages and the stages rule. As mentioned, we can also find some specific instance (i.e., the attribute set and or the operation set) of each core concept in each instance layer. For these specific instances, see Table 4. Several examples of “object” properties and “data” properties are listed in Table 5 and Table 6.
As shown in Table 5 and Table 6, an “object” property “hassleepstages” exists between the core concept “Subject” and the core concept “Sleep stages”. Simultaneously, “Sleep stages” has a data property “hasvalue”. The data type of this property is “Integer” and the data value range in (WA, NREM1, NREM2, SWS, REM).
Additionally, object attributes and data attributes can be connected by different layers of EEG-Sleep ontology. For example, one core concept termed “relative power alpha” is derived from the domain of interest related to EEG features. The “relative power alpha” is_calculated_on, types, is_come_subject, has_feature_values equal to {Fpz-Cz, Integer, ST7092J0, [0.2911, 0.7434, ⋯, 0.7482]}.

4.5.2. Rule Set

To ensure the objectivity and robustness of sleep staging, the rule set is obtained by training a large data set. An RF algorithm [43] is used to realize training rules. RF is a set of multitude decision trees.
The process of creating a decision tree employs a bootstrap sample of the original training data. For each decision tree, there is a set of burst nodes and leaf nodes with the burst nodes serving as a specific splitting criterion based on one of its attributes and leaf node serves as a class value. A route from a root node to a leaf node is equivalent to a rule, and a decision tree is equivalent to a rule set. For a classification problem applied to the input vector down to each of the decision trees in the RF, each tree will give a classification result, and the final result of classification is the most popular class by voting from all the trees.
In this paper, as discussed in [44], the principal motivation of selecting the RF algorithm includes:
(1) The RF algorithm has been shown to be effective in multi-class problems.
(2) The RF algorithm provides good predictive performance even when most predictive variables are noisy.
(3) The RF algorithm shows strong robustness and high-speed operation efficiency with respect to large feature sets.
(4) The RF algorithm is a rule-based inference method with the rules expressed by an appropriate IF-THEN logic statement.
(5) The RF algorithm corrects potential issues of the over-fitting of decision trees. (6) There is a large number of high quality and free tool packages including the original Fortran code from Breiman and Cutler, the MATLAB tool package, and the Waikato Environment for Knowledge Analysis (WEKA) package [45].
Given these positive traits, the RF algorithm was selected for training rules. We use the RF classifier in MATLAB to realize training rules. Variables in the rule set represent inputs such as: (1) EEG features and (2) corresponding results of visual interpretations; these two variables generate a rule set according to training rules. In other words, setting up the rule set to identify the five-state sleep stages becomes a static pattern involving the dynamic combination of EEG features and the corresponding results of visual interpretations based on training rules.
Figure 4 shows a sub-set of the rule set generated by training rules, where an “IF-THEN” logic structure is used to describe a specific produce process of the rule. A concrete example is as follows:
[IF “Pz-Oz_Mobility”<0.24
THEN IF “Fpz-Cz_Relative_Power_Delta”<0.61
THEN subject=<SWS>].
The corresponding rule set is depicted in Figure 4. Shown is the rule depth routing of the decision according to the bold arrow, and the detailed IF-THEN statement corresponding to this rule and is shown as follows:
String rules=
“[Rule1: (?subjectrdf:typebase:Subject)
(?EEG_feature1 rdf:type ?Mobility)
(?EEG_feature1base:hasValue ?value1) lessthan(?value1, 0.24)
(?EEG_feature1 base:onElectrode ?electrode1)
(electrode1rdfs:label “Pz-Oz”)
(?EEG_feature2 rdf:type ?Relative_Power_Delta)
(?EEG_feature2 base:hasValue ?value2) lessthan(?value2, 0.61)
(?EEG_feature2 base:onElectrode ?electrode2)
(electrode1rdfs:label “Fpz-Cz”)
(?sleepstagesrdf:typebase:Sleepstages)
(?sleepstagesbase:hasSymbol “4”)
->(?subject base:hasSleepstages ?sleepstags)]”.

4.5.3. Inference Engine

There are two core issues in our proposed tool as they relate to the EEG-Sleep ontology and rule set, core issues are descriptive knowledge and procedural knowledge. Another core issue is knowledge reasoning based on an inference engine. The inference engine is designed to approximate human reasoning capabilities in reaching conclusions from existing data, and it provides a bridge between EEG-Sleep ontology and rule sets (see Figure 1 and Figure 2). A specific implementation process is as follows:
(1) Raw data is collected from patients to create EEG-Sleep ontology.
(2) Once the EEG-Sleep ontology of patients has been created, it will serve as an input for an inference engine. Meanwhile, find a rule which satisfies the requirements of the input data, and base it on Jena API [46] query results from the rule set (which has been established).
(3) Finally, five-state sleep stages are identified according to the rules found in the previous step.

5. Results and Discussions

5.1. Overall Performance of the Difference Classifiers

In this study, in order to execute unbiased reasoning in a rule set, half of the data from the 42 independent participants were used for training and the other half for testing. Meanwhile, to illustrate the effectiveness of the proposed approach, we have conducted a comparative analysis between our proposed RF algorithms and four alternative classification algorithms:
(1) Bayesian network (BN): it consists of a directed acyclic graph and a conditional probability matrix. Each node in the directed acyclic graph and represents an observation variable. If there is a directed edge between two nodes, it means that there is probability dependence between the nodes. The strength of this probability dependence is determined by the probability matrix [47].
(2) C4.5: A method of classifying samples based on their corresponding features. In an ideal situation, the purest features are extracted and appropriate nodes are sectioned and can greatly improve the accuracy of the classifier. However, it has the problem of over-fitting [48].
(3) Multilayer perception (MLP): It is an artificial neural network with a forward structure. It usually consists of an input layer, an output layer and a middle hidden layer [49].
(4) Support vector machine (SVM): It was originally used to solve the binary classification problem, constructing a linear classification model in the feature space to find the hyperplane with the largest support vector interval. It is currently widely used to solve multi-classification problems [50].
RF, BN, C4.5, SVM use MATLAB’s own classifier without parameter modification. MLP uses Weka’s own classifier also without parameter modification. Figure 5 shows the average accuracy of sleep staging for the five classification algorithms in the test set. The definition of accuracy is as follows:
accuracy = TP + TN TP + TN + FN + FP
The meanings of TP, TN, FP, and FN are shown in Table 7.
As can be seen from Figure 5, the average accuracy of sleep staging are 89.12%, 83.01%, 78.31%, 86.42%, and 86.21% by using RF, BN, C4.5, MLP and SVM respectively. Meanwhile, it can be seen that the best result of 5-state sleep staging was obtained by RF. To better evaluate the performance of each algorithm, we applied the following statistical measures for each test set to analyze the recognition capabilities of different algorithms. Specific experimental comparison results are presented Figure 6 where we show: (a) Sensitivity, Precision, F-Measure, and ROC Area, (b) Specificity, (c) Kappa statistic.
(1) Sensitivity: the proportion of positives that are correctly identified, also called the true positive rate (TPR) defined as TP/(TP + FN), or called the recall in some fields.
(2) Specificity: the proportion of negatives that are correctly identified, also called the true negative rate (FPR) defined as TN/(TN + FN).
(3) Precision: defined as TP/(TP + FP).
(4) F-Measure: the weighted harmonic mean of Precision and Recall, defined as 2*Precision*Recall/(Precision + Recall).
(5) ROC Area: the combination of Sensitivity and specificity under different threshold.
(6) Kappa statistic: reflects the agreement degree of prediction classification and the true classification, defined as 2(TN*TP-FP*FN)/((TN + FN)*(FN + TP) + (FP + TP)*(TN + FP)).
For the above six statistical metrics, higher values for Sensitivity, Precision, F-Measure, ROC Area, and Kappa statistic indicates improved classification. However, where the values of the Specificity parameter are lower, this also points to improved classification. The experimental results are shown in Figure 6 where we show that Sensitivity, Precision, F-Measure, ROC Area, and Kappa statistic of RF are higher than the other four alternative classification algorithms. The Specificity of BN and MLP are a little lower than RF, but based on a comprehensive comparison of the various aspects, we finally selected the RF algorithm.
It can be seen from Figure 5 and Figure 6, besides Specificity, that the best results of other indicators such as Accuracy, Sensitivity, Precision, F-Measure, ROC Area, and Kappa statistic all come from RF. The Accuracy, Sensitivity, Precision, F-Measure, ROC Area, and Kappa statistic can reach up to 89.12%, 88.95%, 85.36%, 85.91%, 95.84%, and 0.81, respectively. However, the Specificity only can be as low as 7.21%. Why is the comprehensive performance of the RF classifier selected in this study better than the other classifiers? We think there are two main reasons:
(1) The nature of the RF algorithm makes it impossible for the structures of each decision tree to be completely the same, and the comprehensive voting of all decision trees will greatly improve the classification performance. For example, suppose an RF consists of three decision trees, and the error rate of each tree is 30%. After comprehensive voting, the error rate is reduced to 21.6%. Therefore, the comprehensive performance of the RF classifier is significantly higher than that of C4.5.
1 × 0.33 + 3 × 0.32 × (1 − 0.3)1 = 0.216
(2) The experimental data used in this study is not continuous, but an integration of overnight data. See the last paragraph of Section 4.2.1. The data usage strategy of this study is consistent with the RF random sampling mechanism [51], which ensures that the generalization ability of RF is further enhanced, and can dig out the hidden rules behind sleep data, so it has a better comprehensive performance than other classifiers such as BN, MLP, and SVM.

5.2. Classification Accuracy of the Single Sleep Stage.

The classification result of five sleep stages is shown in Table 8, where each column represents sleep stages as predicted by our proposed decision support tool, while each row represents the actual sleep stages by well-trained technicians according to the R&K rules (see [1]). From Table 8 it can be seen that the lowest accuracy relates to NREM1 with a classification rate of 57.86%, while the classification accuracy for the other stages is significantly better (81.92–93.43%).
Considering the result of NREM1, although it represents the lowest classification accuracy, it is actually in our expectation because: (1) NREM1 and REM exhibit similar EEG wave patterns, and (2) NREM1 is a transition phase of WA and NREM2 [52]. This result is consistent with the conclusion reported in [53] that the NREM1 stage was easily mistakenly categorized as any of the WA, NREM2, and REM stages.

5.3. Comparison with Existing Methods

The objective of this study is to develop a decision support tool capable of providing an effective and automatic alternative to sleep staging. To verify the performance of the proposed method, we carried out a comparative analysis between our method and four existing methods [11,16,19,25]. Methods documented in [11,16,24] only use EEG signals; whereas the method introduced in [18] use EEG, EOG, and EMG signals. The research result was reported in [11,16,24] using a small subset of our applied database. The performance comparison results are listed in Table 9.
From Table 9, we can see that the number of epochs used in studies [11,16,24] were much smaller than the number of epochs used in our research. Additionally, we have observed that: (1) the accuracy achieved in these four studies are lower than the accuracy achieved in our study, and (2) in our study, the Kappa statistic can reach up to 0.81, clearly superior to the Kappa statistic achieved in [11].
It is worth noting that the literature [18] uses 13 features for sleep staging, while our paper uses 40 features for sleep staging. Our accuracy is only 3.83% higher than that in the literature [18]. We believe that the main reason for this result is that Pan et al. used a multi-modal physiological signal fusion strategy based on EEG, EOG, and EMG, and multiple physiology signals complement each other to improve the classification accuracy.

6. Conclusions

This paper proposes an ontology-based automatic sleep staging tool to identify five different sleep stages, and then to assist physicians in the diagnosis of sleep-related diseases. The design of the tool is predicated on combining knowledge representation and knowledge reasoning.
In this paper, the public Sleep-EDF database [EXPANDED] has been used to demonstrate the performance of the automatic sleep staging tool. The experimental results of 10-fold cross-validation of five sleep stages show that the accuracy and the Kappa statistic can reach up to 89.12% and 0.81 with 32,940 EEG epochs.
As we have shown, our proposed approach is feasible and potentially usable in real-world sleep diseases assistant diagnostics. On the basis of the automatic sleep staging tool, our focus will be on an exploitation of the discrimination of NREM1 from WA, NREM2 and REM by adopting fusion multifold physiological signals such as EEG, EOG, and EMG. Because multifold physiological signals may complement each other, levels of recognition accuracy may be improved.

Author Contributions

The individual contribution and responsibilities of the authors were as follows: B.Z., Z.Y. and H.C. jointly design and write articles; J.L., W.C. and Z.Z. provided extensive advice for revision of the whole article. All authors have read and agreed to the published version of the manuscript.

Funding

This work was partially supported by the National Natural Science Foundation of China (Nos. 61962034 and 61941109), in part by Tianyou Youth Talent Lift Program of Lanzhou Jiaotong Univesity, in part by Opening Fundation of Key Laboratory of Opto-technology and Intelligent Control (Lanzhou Jiaotong University), Ministry of Education (KFKT2020-13), and in part by Scientific Research Innovation Project of School of Electronics and Information Engineering in Lanzhou Jiaotong University.

Acknowledgments

The authors are very grateful to the editor and reviewers for their insightful and constructive comments and suggestions, which are very helpful in improving the quality of the paper.

Conflicts of Interest

The authors declare no conflict of interest.

References

  1. Rechtschaffen, A.; Kales, A. A manual of standardized terminology, techniques and scoring systems for sleep stages of human subjects. Health Inst. 1968, 50, 1–51. [Google Scholar]
  2. Iber, C.; Ancoli-Israel, S.; Chesson, A.; Quan, S.F. The AASM Manual for the Scoring of Sleep and Associated Events: Rules, Terminology and Technical Specifications; American Academy of Sleep Medicine: Westchester, NY, USA, 2007; pp. 1–79. [Google Scholar]
  3. Charbonnier, S.; Zoubek, L.; Lesecq, S.; Chapotot, F. Self-evaluated automatic classifier as a decision-support tool for sleep/wake staging. Comput. Biol. Med. 2011, 41, 380–389. [Google Scholar] [CrossRef] [PubMed]
  4. Mahowald, M.W.; Schenck, C.H. Insights from studying human sleep disorders. Nat. Cell Biol. 2005, 437, 1279–1285. [Google Scholar] [CrossRef] [PubMed]
  5. Ohayon, M.M. Epidemiology of insomnia: What we know and what we still need to learn. Sleep Med. Rev. 2002, 6, 97–111. [Google Scholar] [CrossRef] [PubMed]
  6. Jiang, H.; Hu, B.; Liu, Z.; Yan, L.; Wang, T.; Liu, F.; Kang, H.; Li, X. Investigation of different speech types and emotions for detecting depression using different classifiers. Speech Commun. 2017, 90, 39–46. [Google Scholar] [CrossRef]
  7. Li, X.; Hu, B.; Sun, S.; Cai, H. EEG-based mild depressive detection using feature selection methods and classifiers. Comput. Methods Progr. Biomed. 2016, 136, 151–161. [Google Scholar] [CrossRef]
  8. Carskadon, M.A.; Dement, W.C. Normal human sleep: An overview. Princ. Pract. Sleep Med. 2005, 12, 13–23. [Google Scholar]
  9. Norman, R.G.; Pal, I.; Stewart, C.; Walsleben, J.A.; Rapoport, D.M. Interobserver Agreement Among Sleep Scorers from Different Centers in a Large Dataset. Sleep 2000, 23, 1–8. [Google Scholar] [CrossRef]
  10. Anderer, P.; Gruber, G.; Parapatics, S.; Woertz, M.; Miazhynskaia, T.; Klösch, G.; Saletu, B.; Zeitlhofer, J.; Barbanoj, M.J.; Danker-Hopfe, H.; et al. An E-Health Solution for Automatic Sleep Classification according to Rechtschaffen and Kales: Validation Study of the Somnolyzer 24 × 7 Utilizing the Siesta Database. Neuropsychobiology 2005, 51, 115–133. [Google Scholar] [CrossRef]
  11. Berthomier, C.; Drouot, X.; Herman-Stoïca, M.; Berthomier, M.P.; Prado, J.; Bokar-Thire, D.; Benoit, O.; Mattout, J.; D’Ortho, M.-P. Automatic Analysis of Single-Channel Sleep EEG: Validation in Healthy Individuals. Sleep 2007, 30, 1587–1595. [Google Scholar] [CrossRef] [Green Version]
  12. Zhang, X.; Hu, B.; Moore, P.; Chen, J.; Zhou, L. Emotiono: An Ontology with Rule-Based Reasoning for Emotion Recognition. In Proceedings of the 18th International Conference on Neural Information Processing, Shanghai, China, 13–17 November 2011; pp. 89–98. [Google Scholar]
  13. Zhang, X.; Hu, B.; Chen, J.; Moore, P. Ontology-based context modeling for emotion recognition in an intelligent web. World Wide Web 2013, 16, 497–513. [Google Scholar] [CrossRef]
  14. Zhang, X.; Hu, B.; Ma, X.; Moore, P.; Chen, J. Ontology driven decision support for the diagnosis of mild cognitive impairment. Comput. Methods Progr. Biomed. 2014, 113, 781–791. [Google Scholar] [CrossRef] [PubMed]
  15. Correa, A.G.; Laciar, E.; Patino, H.D.; Valentinuzzi, M.E. An automatic sleep-stage classifier using electroencephalographic signals. Int. J. Med. Sci. 2008, 1, 13–21. [Google Scholar]
  16. Hsu, Y.-L.; Yang, Y.-T.; Wang, J.-S.; Hsu, C.-Y. Automatic sleep stage recurrent neural classifier using energy features of EEG signals. Neurocomputing 2013, 104, 105–114. [Google Scholar] [CrossRef]
  17. Tagluk, M.E.; Sezgin, N.; Akin, M. Estimation of Sleep Stages by an Artificial Neural Network Employing EEG, EMG and EOG. J. Med. Syst. 2010, 34, 717–725. [Google Scholar] [CrossRef]
  18. Pan, S.-T.; Kuo, C.-E.; Zeng, J.-H.; Liang, S.-F. A transition-constrained discrete hidden Markov model for automatic sleep staging. Biomed. Eng. Online 2012, 11, 52. [Google Scholar] [CrossRef] [Green Version]
  19. Hanaoka, M.; Kobayashi, M.; Yamazaki, H. Automatic sleep stage scoring based on waveform recognition method and decision-tree learning. Syst. Comput. Jpn. 2002, 33, 1–13. [Google Scholar] [CrossRef]
  20. Zhu, G.; Li, Y.; Wen, P.P. Analysis and Classification of Sleep Stages Based on Difference Visibility Graphs from a Single-Channel EEG Signal. IEEE J. Biomed. Health Inform. 2014, 18, 1813–1821. [Google Scholar] [CrossRef]
  21. Principe, J.; Gala, S.; Chang, T. Sleep staging automaton based on the theory of evidence. IEEE Trans. Biomed. Eng. 1989, 36, 503–509. [Google Scholar] [CrossRef]
  22. Pinero, P.; Garcia, P.; Arco, L.; Alvarez, A.; Garca, M.M.; Bonal, R. Sleep stage classification using fuzzy sets and machine learning techniques. Neurocomputing 2004, 58, 1137–1143. [Google Scholar] [CrossRef]
  23. Bingtao, Z.; Lei, T.; Liu, H.; Cai, H.S. EEG-based automatic sleep staging usingontology and weighting feature analysis. Comput. Math. Methods Med. 2018, 6534041, 1–16. [Google Scholar]
  24. Liang, S.-F.; Kuo, C.-E.; Hu, Y.-H.; Pan, Y.-H.; Wang, Y.-H. Automatic Stage Scoring of Single-Channel Sleep EEG by Using Multiscale Entropy and Autoregressive Models. IEEE Trans. Instrum. Meas. 2012, 61, 1649–1657. [Google Scholar] [CrossRef]
  25. Krakovská, A.; Mezeiová, K. Automatic sleep scoring: A search for an optimal combination of measures. Artif. Intell. Med. 2011, 53, 25–33. [Google Scholar] [CrossRef] [PubMed]
  26. Feng, T.; Sun, G.N.; Xia, Y.H.; Ma, J.F. Modeling and detection of ontology-based Byzantine attacks. J. Univ. Chin. Acad. Sci. 2011, 28, 696–705. [Google Scholar]
  27. Orgun, B.; Vu, J. HL7 ontology and mobile agents for interoperability in heterogeneous medical information systems. Comput. Biol. Med. 2006, 36, 817–836. [Google Scholar] [CrossRef]
  28. Soergel, D.; Lauser, B.; Liang, A.; Fisseha, F.; Keizer, J.; Katz, S. Reengineering thesauri for new applications: The AGROVOC Example. J. Digit. Inf. 2004, 4, 1–23. [Google Scholar]
  29. Thakor, N.; Tong, S. Advances in Quantitative Electroencephalogram Analysis Methods. Annu. Rev. Biomed. Eng. 2004, 6, 453–495. [Google Scholar] [CrossRef]
  30. Rector, A.; Rogers, J. Ontological and Practical Issues in Using a Description Logic to Represent Medical Concept Systems: Experience from GALEN. Reason. Web 2006, 4126, 197–231. [Google Scholar] [CrossRef]
  31. Bratsas, C.; Koutkias, V.G.; Kaimakamis, E.; Bamidis, P.D.; Pangalos, G.Ι.; Maglaveras, N. KnowBaSICS-M: An ontology-based system for semantic management of medical problems and computerised algorithmic solutions. Comput. Methods Progr. Biomed. 2007, 88, 39–51. [Google Scholar] [CrossRef]
  32. Isern, D.; Sánchez, D.; Moreno, A. Ontology-driven execution of clinical guidelines. Comput. Methods Progr. Biomed. 2012, 107, 122–139. [Google Scholar] [CrossRef]
  33. Dasmahapatra, S.; Dupplaw, D.; Hu, B.; Lewis, P.; Shadbolt, N. Ontology-Mediated Distributed Decision Support for Breast Cancer. Artif. Intell. Med. 2005, 3581, 221–225. [Google Scholar]
  34. Su, Y.; Hu, B.; Xu, L.; Cai, H.; Moore, P.; Zhang, X.; Chen, J. EmotionO+: Physiological signals knowledge representation and emotion reasoning model for mental health monitoring. In Proceedings of the 2014 IEEE International Conference on Bioinformatics and Biomedicine (BIBM), Belfast, UK, 2–5 November 2014; pp. 529–535. [Google Scholar]
  35. The Sleep-EDF Database [Expanded]. Available online: http://physionet.org/pn4/sleep-edfx/#sleep-recordings-and-hypnograms-in-european-data-f (accessed on 20 November 2020).
  36. Kemp, B.; Zwinderman, A.; Tuk, B.; Kamphuisen, H.; Oberye, J. Analysis of a sleep-dependent neuronal feedback loop: The slow-wave microcontinuity of the EEG. IEEE Trans. Biomed. Eng. 2000, 47, 1185–1194. [Google Scholar] [CrossRef] [PubMed]
  37. Goldberger, A.L.; Amaral, L.A.N.; Glass, L.; Hausdorff, J.M.; Ivanov, P.C.; Mark, R.G.; Mietus, J.E.; Moody, G.B.; Peng, C.-K.; Stanley, H.E. PhysioBank, PhysioToolkit, and PhysioNet. Circulation 2000, 101, e215–e220. [Google Scholar] [CrossRef] [PubMed] [Green Version]
  38. Sweden, B.; Kemp, B.; Kamphuisen, H.A.C. Alternative electrode placement in (automatic) sleep scoring (Fpz-Cz/Pz-Oz versus C4-A1/C3-A2). Sleep 1990, 13, 279–283. [Google Scholar] [CrossRef] [Green Version]
  39. Mouze-Amady, M.; Horwat, F. Evaluation of Hjorth parameters in forearm surface EMG analysis during an occupational repetitive task. Electroencephalogr. Clin. Neurophysiol. 1996, 101, 181–183. [Google Scholar] [CrossRef]
  40. Zoubek, L.; Charbonnier, S.; Lesecq, S.; Buguet, A.; Chapotot, F. Feature selection for sleep/wake stages classification using data driven methods. Biomed. Signal Process. 2007, 2, 171–179. [Google Scholar] [CrossRef]
  41. Esposito, M.; De Pietro, G. An ontology-based fuzzy decision support system for multiple sclerosis. Eng. Appl. Artif. Intell. 2011, 24, 1340–1354. [Google Scholar] [CrossRef]
  42. Sowa, J.F. Top-level ontological categories. Int. J. Hum. Comput. Stud. 1995, 43, 669–685. [Google Scholar] [CrossRef]
  43. Breiman, L. Random Forests. Mach. Learn. 2001, 45, 5–32. [Google Scholar] [CrossRef] [Green Version]
  44. Hua, J.; Xiong, Z.; Lowey, J.; Suh, E.; Dougherty, E.R. Optimal number of features as a function of sample size for various classification rules. Bioinformatics 2005, 21, 1509–1515. [Google Scholar] [CrossRef] [Green Version]
  45. Garner, S. WEKA: The Waikato environment for knowledge analysis. In Proceedings of the New Zealand Computer Science Research Students Conference, Hamilton, New Zealand, 18–21 April 1995; pp. 57–64. [Google Scholar]
  46. Jena, A.P.I. Available online: http://jena.apache.org/ (accessed on 20 November 2020).
  47. Jensen, F.V. An Introduction to Bayesian Network. Technometrics 1966, 39, 336–337. [Google Scholar]
  48. Li, X.; Jing, Z.; Hu, B.; Zhu, J.; Zhong, N.; Li, M.; Ding, Z.; Yang, J.; Zhang, L.; Feng, L.; et al. A Resting-State Brain Functional Network Study in MDD Based on Minimum Spanning Tree Analysis and the Hierarchical Clustering. Complexity 2017, 2017, 1–11. [Google Scholar] [CrossRef]
  49. Haykin, S. Neural Networks: A Comprehensive Foundation. Inf. Process. Manag. 1995, 31, 71–80. [Google Scholar]
  50. Hu, B.; Dai, Y.; Su, Y.; Moore, P.; Zhang, X.; Mao, C.; Chen, J.; Xu, L. Feature Selection for Optimized High-Dimensional Biomedical Data Using an Improved Shuffled Frog Leaping Algorithm. IEEE/ACM Trans. Comput. Biol. Bioinform. 2016, 15, 1765–1773. [Google Scholar] [CrossRef] [PubMed]
  51. Fraiwan, L.; Lweesy, K.; Khasawneh, N.; Wenz, H.; Dickhaus, H. Automated sleep stage identification system based on time–frequency analysis of a single EEG channel and random forest classifier. Comput. Methods Progr. Biomed. 2012, 108, 10–19. [Google Scholar] [CrossRef] [PubMed]
  52. Himanen, S.-L.; Hasan, J. Limitations of Rechtschaffen and Kales. Sleep Med. Rev. 2000, 4, 149–167. [Google Scholar] [CrossRef]
  53. Corsi-Cabrera, M.; Muñoz-Torres, Z.; Del Río-Portilla, Y.; Guevara, M. Power and coherent oscillations distinguish REM sleep, stage 1 and wakefulness. Int. J. Psychophysiol. 2006, 60, 59–66. [Google Scholar] [CrossRef]
Figure 1. The architecture of automatic sleep staging tool.
Symmetry 12 01921 g001
Figure 2. The relationship between main components and core issues.
Symmetry 12 01921 g002
Figure 3. The architecture of EEG-Sleep ontology.
Symmetry 12 01921 g003
Figure 4. Part of rule sets generated by training rules.
Symmetry 12 01921 g004
Figure 5. Accuracy of 5-state sleep staging.
Symmetry 12 01921 g005
Figure 6. The specific experiment comparison result of five classifiers. (a) Sensitivity, Precision, F-Measure, and ROC Area; (b) Specificity; (c) Kappa statistic.
Symmetry 12 01921 g006
Table 1. Overview of research on automatic sleep staging.
LiteratureData SourcesMethodLimitationsWhether to Provide a Feature Management Strategy (Yes or No)
[17]EEG, EOG, EMGneural networksMultiple physiological signal devices limit the subjects’ movement and reduce the quality of physiological signalsno
[18]EEG, EOG, EMGneural networksno
[19]EEG, EOG, EMGhidden markov modelsno
[20]EEG, EOG, EMGdecision treesno
[22]EEG, EOG, EMGspectral analysisno
[26]EEG, EOG, EMG, ECGoptimal combinationno
[15]EEGneural networksLess restriction and interferenceno
[16]EEGneural networksno
[21]EEGvisibility graphsno
[23]EEGfuzzy systemno
[24]EEGmulti-scale entropyno
[25]EEGautoregressive modelno
Our proposed methodEEGrandom forestyes
Table 2. List of notations and abbreviations.
AbbreviationFull Name
αalpha
βbeta
θtheta
δdelta
spispindle
sawsawtooth
AmpAmplitude
varVariance
skewSkewness
kurtKurtosis
ActActivity
MobMobility
ComComplexity
PrelRelative spectral power
PabsAbsolute spectral power
EntEntropy
spcSpectral
Table 3. Characteristic wave of EEG in different sleep stages.
Sleep StageCharacteristic Wave
WAAlpha, beta
NREM1Theta
NREM2K complex, spindle
SWSDelta
REMAlpha, beta, theta, sawtooth
Table 4. Core concepts and corresponding specific instances.
Core ConceptsSpecific Instances
Relative power alphaFpz-Cz, Pz-Oz
Sleep stagesWA, NREM1, NREM2, SWS, REM
Stages ruleR&K rules, AASM rules
SubjectSC4001E0, ⋯, ST7141J0
Table 5. Part of objective properties in EEG-sleep ontology.
Objective PropertiesDomainRange
is_calculated_onRelative power alphaValues range
has_AgeSubjectAge range
on_ElectrodeKurtosisScalp region
is_ReflectEEG featureSleep stages
Table 6. Part of data properties in EEG-sleep ontology.
Data PropertiesDomainData Type
has_feature_valuesRelative power alphadouble
has_ValueSleep stagesinteger
sample_RateSamplefloat
has_Valuehas_Valuedouble
Table 7. Confusion matrix of statistical Boolean metrics.
Correct ClassificationPrediction Classification
10
1true positives (TP)false negatives (FN)
0false positives (FP)true negatives (TN)
Table 8. The result of sleep staging based on the RF algorithm.
Decision Support Tool
WANREM1NREM2SWSREMAC (%)
ExpertsWA2193214179397881.92
NREM12261512533134057.86
NREM26720614,19751727893.43
SWS906276871291.77
REM4117244710418187.24
Average AC (%) 89.12
Table 9. Number of epochs, Kappa statistic and accuracy comparison of five studies.
ResearchersNumber of EpochsKappa StatisticAverage AC (%)
Berthomier et al. [11]85000.6171.2
Hsu et al. [16]2880-87.2
Pan et al. [18]18,0000.7385.29
Liang et al. [24]3708-83.6
The present study32,9400.8189.12
Publisher’s Note: MDPI stays neutral with regard to jurisdictional claims in published maps and institutional affiliations.

