Experimental Performance Analysis of a Small Thermoelectric System Applicable to Real-Time PCR Devices

1
Power Service BG, Doosan Heavy Industries & Construction, Changwon 51711, Korea
2
Department of Healthcare Information Technology, Inje University, Gimhae 50834, Korea
3
Department of Information Communication System, Inje University, Gimhae 50834, Korea
4
Paik Institute for Clinical Research, Inje University, Busan 47392, Korea
*
Author to whom correspondence should be addressed.
Symmetry 2020, 12(12), 1963; https://doi.org/10.3390/sym12121963
Submission received: 26 October 2020
/
Revised: 17 November 2020
/
Accepted: 21 November 2020
/
Published: 27 November 2020
(This article belongs to the Special Issue Heat Transfer in Engineering)
Abstract
:At the International Space Station (ISS), not only observation of the space environment, but also biological and medical research under weightlessness has been conducted. The efficient use of energy from waste heat from the ISS away from the Earth is very important to the efficient operation of the ISS. To develop a thermoelectric module that can be used for real-time polymerase chain reaction (PCR) machinery used in biological and medical research, we simulated and evaluated the thermoelectric waste heat recovery system. Specifically, the thermoelectric module was attached to a stainless steel duct, and a hot air blower was faced with the duct inlet. The power of the thermoelectric system was measured by controlling the temperature of the hot air inlet. Additionally, the thermoelectric performance was evaluated according to the heat sink attached to the cold side of the thermoelectric module. Here, we also found the optimal heat exchange factors to improve the power and efficiency of the thermoelectric module. In this regard, it is expected that the thermoelectric module development and analysis study using waste heat will play an important role in the biological and medical research that is being conducted at ISS by developing a real-time PCR utilizing it.
1. Introduction
The increasing presence of humans in orbit over the last 50 years has shown that humans can adapt to short-term space flight. However, we still know very little about the long-term exposure to the space flight environment and its health-related consequences. Future missions to other planets and space objects, such as Mars and the moon and asteroids, provide a remarkable scientific opportunity for space biologists to explore life’s ability to adapt to the environment of space flight during long-term missions.
More specifically, the study of animals in space allows us to investigate the effect of gravity on biological development, an area of research that is not open to humans. The ISS era promises an opportunity to observe and test various features of animal development during long-term exposure to microgravity, as well as access to centrifuges where specimens can be exposed to partial gravity loads. Space probes such as Neurolab provided evidence that frogs and rats need critical periods of gravity for biological development. The ability to store animals on the ISS for multiple life cycles allows scientists to determine exactly how, when, where, and why these gravitational dependencies exist [1]. By studying experimental animals aboard the space probe, scientists can better understand the adaptive response of animals or humans to long-term space flight. The results of these missions can also help determine the requirements for optimal human health in space [2,3].
There is no doubt that the Earth’s gravitational field affects the physiology, morphology, and the behavior of life in almost every phenomenon. Space biology research covers a wide range of biological subfields, including gravity, developmental, and even radiation biology. It also focuses on advanced techniques, including molecular technology, genomics, DNA arrays, gene arrays, cell culture technology, and the study of related habitat systems [1]. Here, the most essential technique in life science research is polymerase chain reaction (PCR). PCR is used to make millions of copies of target DNA fragments, which have a wide range of specialized applications and are used by scientists in all fields of biology [4,5,6]. This is because PCR allows the identification and quantification of specific target species, even when very small numbers are present. Real-time PCR is based on the revolutionary method of PCR, an advanced laboratory technique in molecular biology, which monitors the amplification of target DNA molecules in real-time during PCR [7,8,9]. Thus, real-time PCR is an indispensable tool in modern molecular biology and has transformed scientific research and diagnostic medicine.
The PCR allows the polymerase to select a gene to amplify from a mixed DNA sample by adding small pieces of DNA that are complementary to the gene of interest. These tiny pieces of DNA are known as primers because the polymerase binds and prepares a DNA sample ready to begin copying the gene of interest. During PCR, temperature changes inside the PCR unit are of utmost importance, which is used to control the activity of the polymerase and the binding of primers. To start the reaction, the temperature is raised to 95 °C so that all double-stranded DNA is melted into a single strand. Then lower the temperature to 60 °C, which allows the primer to bind to the gene of interest. Accordingly, the polymerase has a place to bind and can start copying strands of DNA. The optimal temperature for the polymerase to work is 72 °C, so at this point, the temperature is raised to 72 °C to allow the enzyme to work faster. This temperature change is repeated over about 40 cycles. One copy continues until billions of copies have been made [10,11,12].
The efficient use of waste heat energy from ISS far from Earth is critical to the efficient operation of ISS. Since a large amount of thermal energy generated from spacecraft systems in space is released to the outside, applying a thermoelectric power generation system as a waste heat recovery device to utilize waste heat can increase the overall efficiency of the existing system. In this regard, we explored the applicability of the method of using thermoelectric power modules to utilize the temperature changes in the PCR process performed on spacecraft.
The main advantages of thermoelectric generators are direct energy conversion, no moving parts, and a relatively simple structure. However, the application of thermoelectric generators has a disadvantage that it is difficult to use variously due to the limitation of low conversion efficiency. Recently, the idea of using the TEG (thermoelectric generator) system as a waste heat recovery device has been under serious consideration in the automobile and incinerator industry. For waste heat recovery, it is unnecessary to consider the cost of the thermal energy input. The high conversion efficiency is not crucial. Rather, achieving higher power generation may be considered. Several types of thermoelectric generators for waste heat recovery were analyzed and developed by researchers with various approaches. Yu et al. developed a numerical model for a thermoelectric generator with a parallel-plate heat exchanger [13]. In this study, the optimization of the heat exchanger and thermoelectric module geometry was simultaneously performed by the numerical procedure. Crane et al. validated numerical heat exchanger models integrated with thermoelectric modules against experimental data [14]. The work suggests that the operating temperature range of the thermoelectric device should be delicately controlled to maximize the effectiveness of the system. Nuwayhid et al. developed a thermoelectric generator with natural convection cooling which recovered waste heat from a domestic woodstove [15]. In particular, the design factors that could achieve a low cost per watt were demonstrated. Esarte et al. researched the optimum heat exchanger system to maximize the performance of a thermoelectric generator [16]. In particular, theoretical expressions for heat exchangers were developed to compare with the experimental results and matched quite well in the low flow rate of the cooling medium. Saqr et al. reviewed the thermal design of thermoelectric generators for automobile exhaust waste heat recovery [17]. Four main factors that control the thermal efficiency of the thermoelectric generator were presented: heat exchanger geometry, heat exchanger materials, the installation site of the thermoelectric generator within the car, and the coolant system of the thermoelectric generator.
Regarding the above works, the present study tried to hold focus on the other aspects of optimized conditions. As an example, thermoelectric generation performance was evaluated depending on the compressive force applied to the module. The compressive force is, in specific, a crucial means not only to lock TEG device to the heat source, but also to minimize the heat resistance, so TEG can perform maximum power. However, some optimal force exists where, putting more compressive force can reduce the performance because of heat transfer convergence to its maximum level, and putting more stress on the module can reduce the power because of the material’s deformation. Moreover, putting more stress may result in mechanical failure. Additionally, the effect of the thermoelectric module surface temperature uniformity on the overall power generation performance was evaluated quantitatively. On the other hand, the experiment on the thermoelectric module power performance depending on the heat sink was conducted in a similar but partially different way from what Esarte et al. did [16]. The main difference was that in the present study, various types of heat sinks with different geometry (fin height, fin array) were applied whereas in Esarte’s work, heat sinks were almost similar to one other with the same size except that fin thicknesses and numbers were varied from one another. After all, the main purpose of the present study was to simulate the waste heat recovery TEG system in automobiles and small-sized industrial facilities and thus, find the design factor that enhances the overall performance of the TEG system.
2. Materials and Methods
Before discussing the experiment, thermoelectric generation phenomena will be briefly explained. The solid-state direct energy conversion is based on the thermoelectric phenomena which cover the Seebeck, Peltier, and Thompson effects. For the thermoelectric generation case, the dominating thermoelectric phenomenon is the Seebeck effect of which the main principle is as follows: When the junctions of two dissimilar semiconductors, as shown in Figure 1, are maintained at different temperatures, the current flows through the closed-loop. The temperature difference between the two junctions and the electromotive force has the following linear relation where is the Seebeck coefficient.
where: E—open circuit voltage (V); α—Seebeck coefficient (V/K); ΔT—hot/cold side temperature difference [17]. The figure of merit ZT (figure of merit) determines the generation performance of a specific thermoelectric material and is characterized by the thermal/electrical conductivity, Seebeck coefficient, and the hot/cold side average temperature as described by Equation (2).
where: ZT—figure of merit (-); κ—thermal conductivity (W/m2∙K); σ—electrical conductivity (Ω); —mean temperature (K) [17].
ZT is a measure that determines the performance of thermoelectric material itself. Higher ZT is desirable in general. Looking at Equation (2), we can find why higher ZT is desirable. Low thermal conductivity between the hot and cold side of the module ensures ΔT is relatively well preserved so that electricity is well-produced according to Equation (1). High electrical conductivity and the Seebeck coefficient implies the material has more capability to produce electricity. Higher mean operating temperature implies the material is capable of operating at high temperature, and consequently higher ΔT.
The conversion efficiency, described by Equation (3) could be derived by using energy balance and is shown as a function of ZT and the hot/cold side temperature in the thermoelectric material.
where: TH—hot side temperature (K); TC—cold side temperature (K) [17].
As seen in Equation (3), TH and TC are fixed with varying ZT. We can see conversion efficiency increases with higher ZT.
Current commercial thermoelectric materials usually have ZT of 0.8–1 and conversion efficiency of 4–5%. However, thermoelectric material Bi2Te3, GeTe, PbTe are being developed continuously with each material being doped with Bi and In, and due to the recent developments, it has been reported ZT as high as 2.4 and that conversion efficiency as high as 15% can be achieved [18,19,20].
Now, looking at the thermoelectric generation system for exhaust gas waste heat recovery, the overall system efficiency cannot exactly match the thermoelectric conversion efficiency due to heat loss and thermal contact resistance which occurs at the interfaces. Considering such irreversible effects, the overall system efficiency of the TEG can be analyzed as follows:
where: ε—conversion efficiency (-); ηHX—heat exchanger efficiency; ρ—heat flux efficiency [16].
and indicates the heat exchanger efficiency and heat flux efficiency, respectively. Here, heat exchanger efficiency, , is defied the ratio of ΔTco-ci to ΔThi-ci, which depends on fin geometry, convection type, and flow condition. Heat flux efficiency can be defined as a ratio of actual heat flux to maximum theoretical heat flux. Thermal resistance indeed exists within the interface region of the TEG system such as heat source to a thermoelectric module, and heat sink. Since the conversion efficiency, ε is an uncontrollable value at this moment, the focus should be on improving the other two values, by either designing a highly efficient heat exchanger or reducing thermal contact resistance.
In the present study, three different experiments were conducted, independently. In the first experiment, the thermoelectric module generation performance was evaluated using a high-performance thermoelectric module with heat source and sink block. The general specifications of the thermoelectric module are specified in Table 1. In the second experiment, the TEG system for exhaust gas waste heat recovery was constructed and the power performance characteristics were compared to those of the first experiment. In the last experiment, various types of heat sinks were applied to the thermoelectric module to determine the power generation performance. For the measurement devices, a K-Type thermocouple was used to measure the hot/cold side temperature of the thermoelectric module as well as the inlet/outlet gas temperature inside the TEG system. The voltage was measured by extending the lead wire of the thermoelectric module to the multimeter. The airflow rate in the TEG system was measured using the TESTO portable sensing probe. Overall, such data were converted into digitalized formats by using the Agilent 34970A data logger.
2.1. Module Performance Experimental Setup
As described in Table 1, the thermoelectric module is originally produced from Hi-Z Inc., USA, and was applied to the experimental device to evaluate its performance as seen in Figure 2. The HZ20 model was specified as having a maximum power performance of 19 W. A copper plate with four cartridge heaters inserted inside the plate was used as a heating device to ensure the temperature uniformity of the hot side surface of the thermoelectric module. An aluminum water cooling jacket with a thickness of 2 mm, was attached on the cold side surface of the thermoelectric module. Using a PID temperature controller, the module hot side temperature was controlled from 40–230 °C for the HZ20 model. On the other hand, the cooling jacket was constantly supplied with water of 8LPM and an approximate temperature of 17–18 °C. The hot side temperature was increased by 10 °C for each step, and the open-circuit voltage was measured. When each module achieved its maximum operating temperature, the electric power was measured with variable load resistance which ranges from 0.1–100 Ω. The reason for such measurement was to find the matching load in which the maximum power could be achieved. Additionally, by putting the load cell above the heat sink, the whole pile was compressed by the C-clamp. After so, the module generation performance depending on the compressive force was measured as well.
2.2. TEG Setup and Power Performance Testing
A waste-heat recovering TEG system was constructed by the assembly of a duct, a heat exchanger, a water cooling jacket, and a thermoelectric module. The details of such assembly are described in Figure 3. The exhaust gas was simulated by a hot air blower which was capable of discharging air at a temperature ranging from 25–250 °C. Making indirect contact with hot air, the module was attached to the upper wall of the duct. Unlike the previous experiments, the module hot side temperature was controlled by using a hot air blower which was attached to the duct inlet. Figure 4 shows the schematic of the TEG system experimental setup. Strictly, it was the center of the module hot side temperature which was measured, but it will be abbreviated as just module hot side temperature as a convenience from next on. Additionally, the hot air inlet/outlet temperature and air flowrate at the normal temperature were measured. The module hot side temperature was controlled from 40–230 °C for the HZ20 model. As the whole system stabilized, the power performance was measured.
Imitating exhaust pipe systems capable of waste heat recovery, the porous copper heat exchanger is stored inside the pipe system to maximize the heat transfer. The water jacket attached to the other side of the thermoelectric module was designed and aluminum is selected due to anti-corrosion characteristics and high heat conductivity. Between the water cooling jacket and exhaust pipe system, a commercial thermoelectric module is attached.
2.3. Power Generation Performance of TEM with Various Heat sink Types
For the present experiment, a total of six types of heat sinks were applied to the module, and each heat sink had its belonging case as shown in Figure 5. The experiment was conducted in two steps. For natural convection cooling, only the heat sink was attached to the cold side of the module in the first step. In the second step, a cooling fan was attached to the heat sink, for forced convection cooling. The cooling fan had a maximum flowrate of 10 CFM and consumed 5 W of electrical power. Additionally, it was attached to the heat sink in a way so that the air could flow in a parallel direction to the fins. As the module performance experiment, the module hot side temperature was controlled by the copper heating plate from 50–230 ° C and was increased by 30 °C for each step. To decrease the thermal contact, the thermal compound (silicone grease) was injected at the interface and the compressive force was applied on the whole pile by using the C-clamp. As the hot/cold side temperature of the module stabilized, the power was soon measured.
3. Results and Discussion
3.1. Module Performance Experimental Results
Figure 6a describes the open-circuit voltage and electrical power of the HZ20 model, depending on the module’s hot side temperature. Since ΔT has a linear relationship with voltage according to Equation (1), the power has a double square relationship with ΔT accordingly. For the hot side temperature condition, the model achieved the maximum power output of 15.5 W. Figure 6b shows the closed-circuit voltage and electrical power depending on the load resistance value. The measurements were done when the hot side temperature of the module was at the highest, which is 230 °C. It could be seen that the electric power of the thermoelectric module achieved its maximum at the load resistance value of 0.3 Ω. From such fact, it could be induced those load resistance value matched with the internal resistances of the thermoelectric module. Additionally, the values were the same as the internal resistances labeled in Table 1. In Figure 6c, the open-circuit voltage was measured depending on the compressive force applied to the thermoelectric module at hot side temperature 230 °C. From the graphs, it could be known that there existed an optimal point of the compressive force where the maximum generation performance could be achieved. The open-circuit voltage was maximized when 200 kgf of compressive forces had been applied. Applying more compressive force resulted in the generation performance decrease. One possible reason could be the internal crack within the thermoelectric module because of the excess compressive force.
3.2. Experimental Results of TEG Power Generation Performance
Based on the experimental results of the thermoelectric module performance test, the experimental results of the present TEG test were analyzed. Figure 7 describes the power performance of the TEG model respectively when attached to the exhaust gas duct. As mentioned earlier, since ΔT has a linear relationship with voltage according to Equation (1), it is reasonable that power came out as double square relation with ΔT. Although Figure 7 reveals quite a similar pattern with Figure 6a from the module performance test, it could be seen that the overall performance of the TEG system was declined. The maximum electric power was 8.2 W which was 2.3 W less than the previous module performance test. This was due to the presence of temperature gradient along the axial direction of the exhaust gas duct which affected the module surface temperature distribution as well. As a result, the possibility of the performance decline arises from the uniform temperature distribution on the module surface.
Since the hot side of the TEG is capable of operating up to 230 °C, and it is a device that only needs to be adjusted within 100 °C when developing a PCR device, it will not be difficult to get such a heat source in the ISS environment, whether it can be radiation energy or other heat devices. As mentioned earlier, in the process of selecting the gene to be amplified from the DNA sample of interest through PCR, the temperature change inside the unit between 60 °C and 95 °C is important; the temperature is raised to 95 °C so that all double-stranded DNA would melt into a single strand, and then lowered to 60 °C so that the primers could bind to the gene of interest. Additionally, the optimal temperature for the polymerase to operate the replication of DNA strands is 72 °C. The TEG may have great potential not only for providing power to the real-time PCR device, but also for using it as a heat. Preheating the real-time PCR device can be possible by utilizing the TEG cold side as a heat source. By using an adequate heat-resisting ceramic material, PCR can be controlled within 100 °C. This would effectively save energy for operating real-time PCR in the ISS environment where electric supply may be limited.
3.3. Experimental Results of Power Generation Performance with Various Heat Sinks
The generation performance revealed different characteristics depending on the fin shapes of the heat sinks labeled in Figure 5. Figure 8 represents the hot/cold side temperature difference of the thermoelectric module depending on the hot side temperature for natural and forced convection cooling, respectively. Similarly, Figure 9 shows the electric power performance depending on the hot side temperature. It could be seen that the distributions of the six cases show a resemblance between Figure 6 and Figure 7. Higher temperature difference showed higher power generation performance. For the natural convection cooling condition, as shown in Figure 8a and Figure 9a, Case 6 (extruded fin of height 120 mm) showed the best power generation performance whereas Case 3 (bonded fin, height 45 mm) showed the lowest performance. This could be interpreted as the heat sink, having higher fins and wider fin pitches with less thermal contact resistance were best suited for the natural convection. It would have been relatively easy for natural convection induced buoyancy flows to pass over the path with enough space with reduced boundary layer blockage (Case 6) [21]. On the contrary, the heat sinks, having relatively low fins, narrow fin pitches with high thermal contact resistance, showed poor performance during the natural convection. The main reason for the low performance could be thought of as insufficient space between fins for the air to be circulated. To summarize, Case 6 achieved the highest electric power value of 2.4 W at the hot side temperature of 230 °C in natural convection mode. In the forced convection cooling case, however, the case distributions were relatively different from the previous natural convection cooling case. Case 3 showed the highest power generation performance and the most significant increase than the previous case, although Case 6 achieved relatively higher performance than others as well. This is because unlike the previous natural convection cooling condition, the air circulation between the fins in Case 3 would have been relatively easy by external means, in this case, a cooling fan, and with the contribution of a higher heat transfer area as well due to many numbers of fins [21]. Additionally, forced convection can have enough power to overcome boundary layer blockage within the passage. The highest electric power value at hot side temperature 230 °C was measured 10.5 W in this case which is 15 times the previous power value at the natural convection cooling. The heat sinks with relatively lower fins than others, except for Case 3, showed relatively low performance as expected. It could be concluded that heat sinks with higher fins, low fin pitches, and high heat transfer areas were well suited for forced convection cooling.
4. Conclusions
From the present study, the potential for adopting a thermoelectric system in the ISS environment, especially in the biomedical field, has been investigated by conducting various experiments. In conclusion, the following facts could be found out through the experiments. First, there was a maximum point where the thermoelectric power performance deteriorated when more compression was applied. Second, one of the important factors of a TEG system performance was the temperature uniformity of a thermoelectric module surface and the necessity of a heat spreader was important in a TEG system. Third, when using fins as a heat sink, forced convection insured much higher thermoelectric generation performance than that of natural convection, in general. However, each heat sink revealed different performance in each condition. With fulfilling optimum force, high-performance heat sink, and temperature uniformity in the ISS environment, the PCR system will be provided with stable electric energy to operate.
Author Contributions
Conceptualization, J.H.C. and S.J.; methodology, J.H.C.; software, J.H.C.; validation, J.H.C. and S.J.; formal analysis, J.H.C. and S.J.; investigation, J.H.C. and S.J.; data curation, J.H.C. and S.J.; writing—original draft preparation, J.H.C. and S.J.; writing—review and editing, J.H.C. and S.J.; visualization, J.H.C.; supervision, S.J.; funding acquisition, S.J. All authors have read and agreed to the published version of the manuscript.
Funding
This research received no external funding.
Acknowledgments
This work was partially supported by the National Research Foundation of Korea (NRF) grant funded by the Korea government (MSIT) (No. NRF-2018R1C1B5086455).
Conflicts of Interest
The authors declare no conflict of interest.
References
- Clément, G.S.K. Fundamentals of Space Biology: Research on Cells, Animals, and Plants in Space; Springer: New York, NY, USA, 2006; Volume 18, p. 376. [Google Scholar]
- Goswami, N.; Roma, P.G.; De Boever, P.; Clément, G.; Hargens, A.R.; Loeppky, J.A.; Evans, J.M.; Peter Stein, T.; Blaber, A.P.; Van Loon, J.J.W.A.; et al. Using the Moon as a high-fidelity analogue environment to study biological and behavioral effects of long-duration space exploration. Planet. Space Sci. 2012, 74, 111–120. [Google Scholar] [CrossRef]
- De la Torre, G.G. Cognitive Neuroscience in Space. Life 2014, 4, 281–294. [Google Scholar] [CrossRef] [PubMed] [Green Version]
- Arnheim, N.; White, T.; Rainey, W.E. Application of PCR: Organismal and Population Biology. BioScience 1990, 40, 174–182. [Google Scholar] [CrossRef]
- Reynolds, R.; Sensabaugh, G.; Blake, E. Analysis of genetic markers in forensic DNA samples using the polymerase chain reaction. Anal. Chem. 1991, 63, 2–15. [Google Scholar] [CrossRef] [PubMed]
- David, N.F.; Relman, D.A. Application of Polymerase Chain Reaction to the Diagnosis of Infectious Diseases. Clin. Infect. Dis. 1999, 29, 475–486. [Google Scholar]
- Maurer, J.J. Rapid Detection and Limitations of Molecular Techniques. Annu. Rev. Food Sci. Technol. 2011, 2, 259–279. [Google Scholar] [CrossRef] [PubMed] [Green Version]
- Boonham, N.; Kreuze, J.; Winter, S.; van der Vlugt, R.; Bergervoet, J.; Tomlinson, J.; Mumford, R. Methods in virus diagnostics: From ELISA to next generation sequencing. Virus Res. 2014, 186, 20–31. [Google Scholar] [CrossRef] [PubMed]
- Umesha, S.; Manukumar, H.M. Advanced molecular diagnostic techniques for detection of food-borne pathogens: Current applications and future challenges. Crit. Rev. Food Sci. Nutr. 2018, 58, 84–104. [Google Scholar] [CrossRef] [PubMed]
- Bej, A.K.; Mahbubani, M.H.; Atlas, R.M. Amplification of Nucleic Acids by Polymerase Chain Reaction (PCR) and Other Methods and their Applications. Crit. Rev. Biochem. Mol. Biol. 1991, 26, 301–334. [Google Scholar] [CrossRef] [PubMed]
- Au Lorenz, T.C. Polymerase Chain Reaction: Basic Protocol Plus Troubleshooting and Optimization Strategies. JoVE 2012, e3998. [Google Scholar] [CrossRef] [PubMed]
- Adessi, C.; Matton, G.; Ayala, G.; Turcatti, G.; Mermod, J.-J.; Mayer, P.; Kawashima, E. Solid phase DNA amplification: Characterisation of primer attachment and amplification mechanisms. Nucleic Acids Res. 2000, 28, e87. [Google Scholar] [CrossRef] [PubMed]
- Yu, J.; Zhao, H. A numerical model for thermoelectric generator with the parallel-plate heat exchanger. J. Power Sources 2007, 172, 428–434. [Google Scholar] [CrossRef]
- Crane, D.T.; Jackson, G.S. Optimization of cross flow heat exchangers for thermoelectric waste heat recovery. Energy Convers. Manag. 2004, 45, 1565–1582. [Google Scholar] [CrossRef]
- Nuwayhid, R.Y.; Shihadeh, A.; Ghaddar, N. Development and testing of a domestic woodstove thermoelectric generator with natural convection cooling. Energy Convers. Manag. 2005, 46, 1631–1643. [Google Scholar] [CrossRef]
- Esarte, J.; Min, G.; Rowe, D.M. Modelling heat exchangers for thermoelectric generators. J. Power Sources 2001, 93, 72–76. [Google Scholar] [CrossRef]
- Saqr, K.M.; Mansour, M.K.; Musa, M.N. Thermal design of automobile exhaust based thermoelectric generators: Objectives and challenges. Int. J. Automot. Technol. 2008, 9, 155–160. [Google Scholar] [CrossRef]
- Suwardi, A.; Cao, J.; Zhao, Y.; Wu, J.; Chien, S.W.; Tan, X.Y.; Hu, L.; Wang, X.; Wang, W.; Li, D.; et al. Achieving high thermoelectric quality factor toward high figure of merit in GeTe. Mater. Today Phys. 2020, 14, 100239. [Google Scholar] [CrossRef]
- Suwardi, A.; Cao, J.; Hu, L.; Wei, F.; Wu, J.; Zhao, Y.; Lim, S.H.; Yang, L.; Tan, X.Y.; Chien, S.W.; et al. Tailoring the phase transition temperature to achieve high-performance cubic GeTe-based thermoelectrics. J. Mater. Chem. A 2020, 8, 18880–18890. [Google Scholar] [CrossRef]
- Perumal, S.; Samanta, M.; Ghosh, T.; Shenoy, U.S.; Bohra, A.K.; Bhattacharya, S.; Singh, A.; Waghmare, U.V.; Biswas, K. Realization of High Thermoelectric Figure of Merit in GeTe by Complementary Co-doping of Bi and In. Joule 2019, 3, 2565–2580. [Google Scholar] [CrossRef]
- Incropera, F.P.; DeWitt, D.P.; Bergman, T.L.; Lavine, A.S. Fundamentals of Heat and Mass Transfer; John Wiley & Sons: Hoboken, NJ, USA, 2006. [Google Scholar]
Figure 1.
Schematic of the basic thermoelectric generation circuit. A temperature difference between two dissimilar semiconductors produces a voltage difference between the two substances, which can be applied to thermal-to-electrical energy conversion.
Figure 1.
Schematic of the basic thermoelectric generation circuit. A temperature difference between two dissimilar semiconductors produces a voltage difference between the two substances, which can be applied to thermal-to-electrical energy conversion.

Figure 2.
Experiment setup for measuring module performance.

Figure 3.
Assembly of waste heat recovering thermoelectric generator (TEG) system.
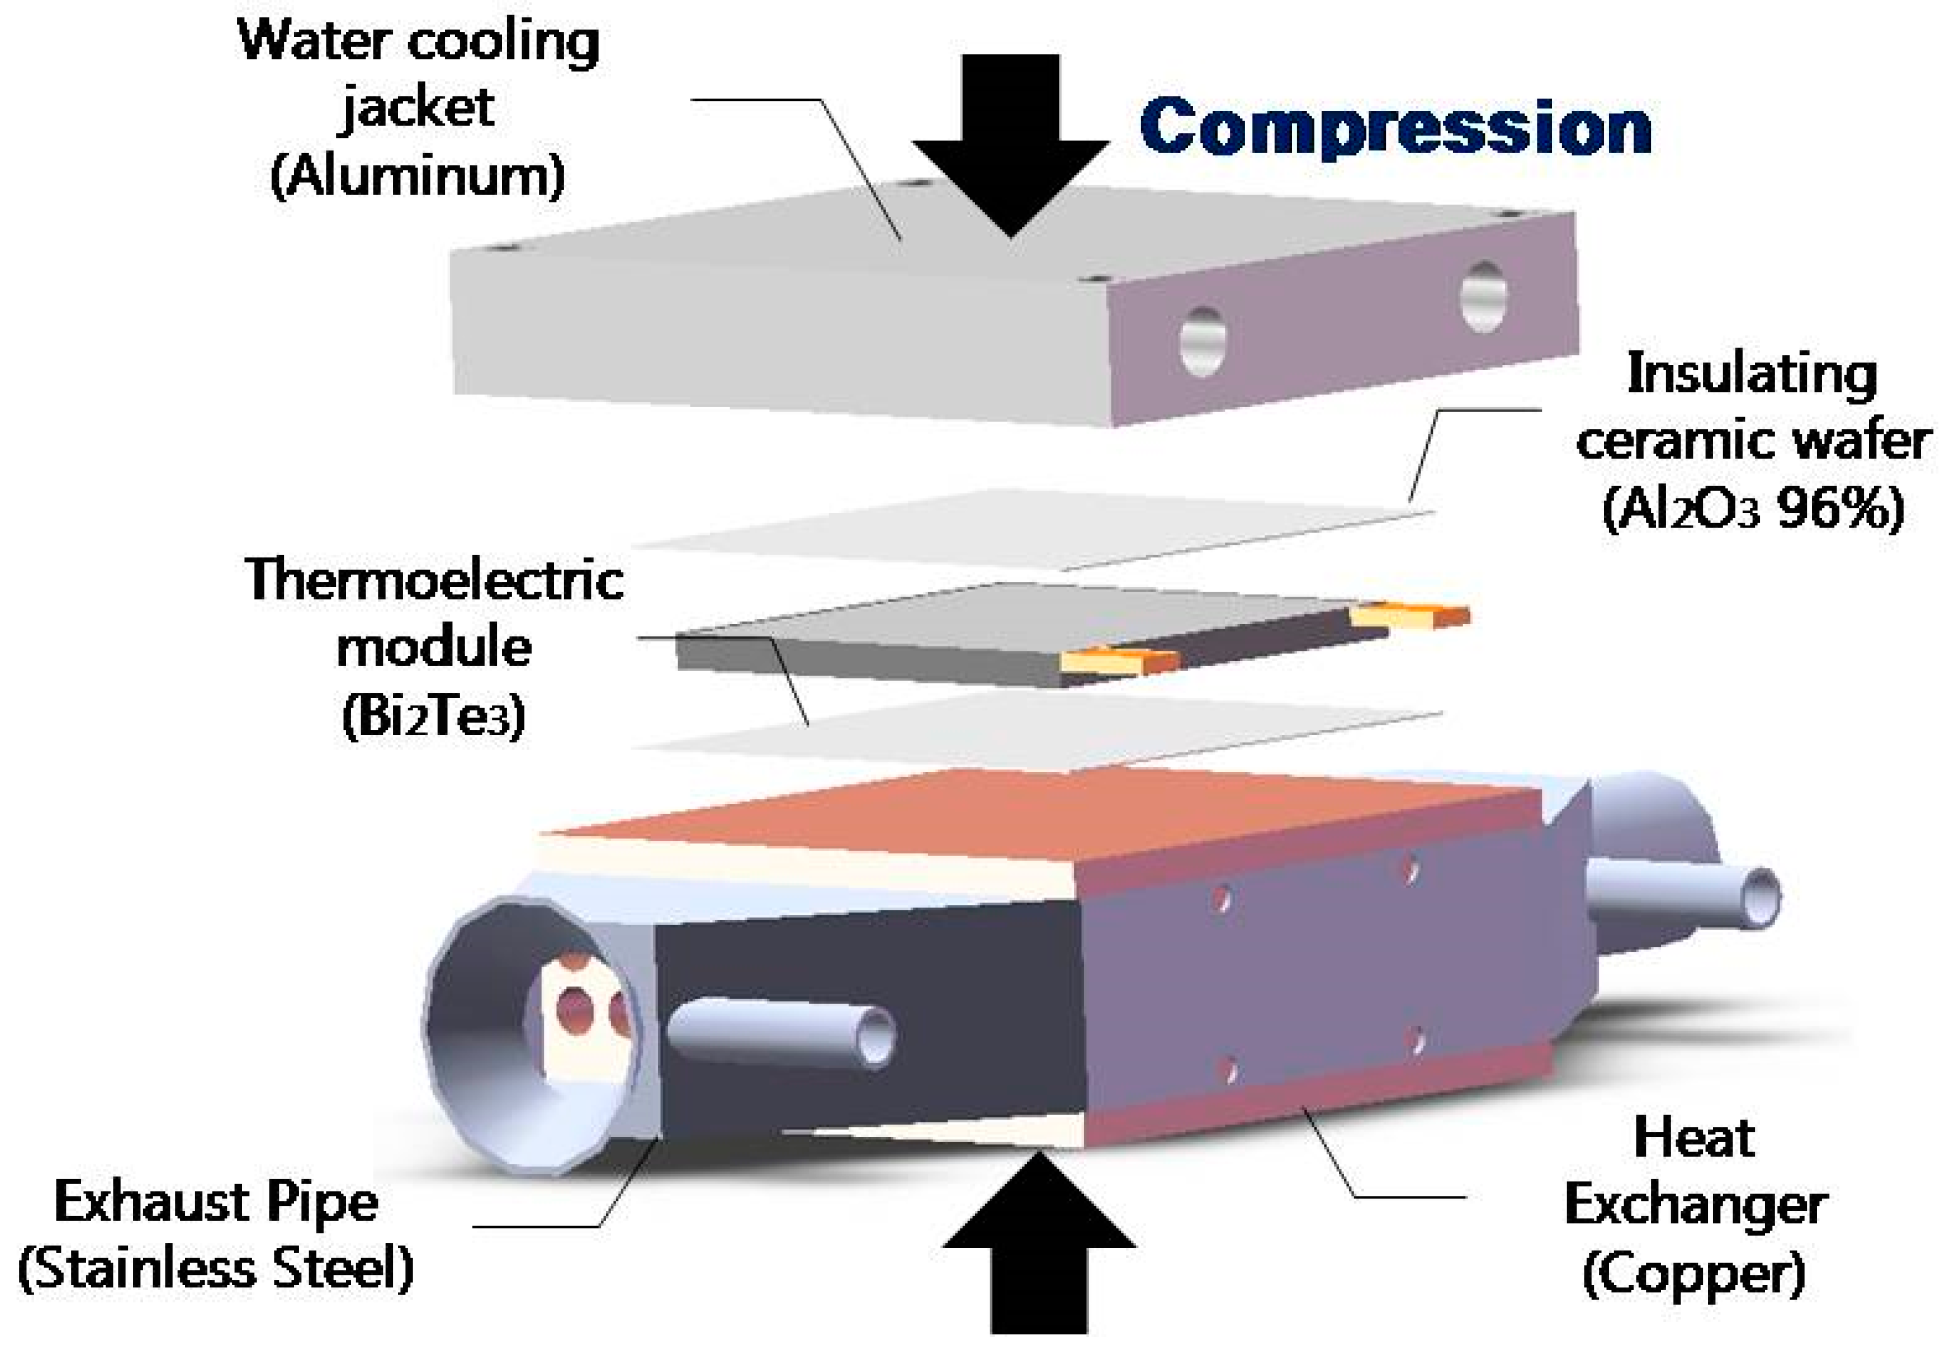
Figure 4.
Schematic of a TEG experimental setup. The experimental setup is divided into two parts: (1) hardware for the experiment—hot air blower, exhaust pipe, a thermoelectric system with heat exchanger, water chamber to supply cold water; (2) data acquisition system: desktop computer, sensors to measure electricity, temperature, data logger.

Figure 5.
Heat sink specifications. Basic specification of the six types of heat sinks used in the thermoelectric experiment (size, fin numbers, and thickness of fin/pitch).
Figure 5.
Heat sink specifications. Basic specification of the six types of heat sinks used in the thermoelectric experiment (size, fin numbers, and thickness of fin/pitch).

Figure 6.
(a) Open circuit voltage and electrical power of HZ20 corresponding to the hot side temperature. (b) Closed-circuit voltage and electrical power corresponding to load resistance (@TH = 230 °C). (c) Measurement of the open-circuit voltage depending on the compressive force applied to the thermoelectric module (@TH = 230 °C) (n = 6).

Figure 7.
Open circuit voltage and power for the TEG depending on the hot side temperature of the thermoelectric module (n = 6).
Figure 7.
Open circuit voltage and power for the TEG depending on the hot side temperature of the thermoelectric module (n = 6).

Figure 8.
Hot/cold temperature difference side by case corresponding to the hot side temperature for (a) natural convection; (b) forced convection (n = 6).
Figure 8.
Hot/cold temperature difference side by case corresponding to the hot side temperature for (a) natural convection; (b) forced convection (n = 6).

Figure 9.
Electric generation performance based on the electric power of the thermoelectric module side by case depending on the hot side temperature for (a) natural and (b) forced convection cooling (n = 6).
Figure 9.
Electric generation performance based on the electric power of the thermoelectric module side by case depending on the hot side temperature for (a) natural and (b) forced convection cooling (n = 6).


Table 1.
Specifications for thermoelectric (TE) modules.
| Model | Material | Max Oper. Temp. | Dimension | Electric Resistance |
|---|---|---|---|---|
| HZ-20 | Bi2Te3 | 230 °C | 75 × 75 mm2 | 0.3 Ω |
Publisher’s Note: MDPI stays neutral with regard to jurisdictional claims in published maps and institutional affiliations. |
© 2020 by the authors. Licensee MDPI, Basel, Switzerland. This article is an open access article distributed under the terms and conditions of the Creative Commons Attribution (CC BY) license (http://creativecommons.org/licenses/by/4.0/).
Share and Cite
MDPI and ACS Style
Chung, J.H.; Jeong, S. Experimental Performance Analysis of a Small Thermoelectric System Applicable to Real-Time PCR Devices. Symmetry 2020, 12, 1963. https://doi.org/10.3390/sym12121963
AMA Style
Chung JH, Jeong S. Experimental Performance Analysis of a Small Thermoelectric System Applicable to Real-Time PCR Devices. Symmetry. 2020; 12(12):1963. https://doi.org/10.3390/sym12121963
Chicago/Turabian StyleChung, Jae Hoon, and Sehoon Jeong. 2020. "Experimental Performance Analysis of a Small Thermoelectric System Applicable to Real-Time PCR Devices" Symmetry 12, no. 12: 1963. https://doi.org/10.3390/sym12121963
Note that from the first issue of 2016, this journal uses article numbers instead of page numbers. See further details here.