1. Introduction
The Internet of Things (IoT) is increasingly attracting incredible attention recently [
1,
2]. According to reports, the number of connected devices is expected to increase from 700 million to 3.2 billion by 2023. The main contributing factor to this rise is the development of 5G technology. The upcoming launch of the fifth generation of cellular mobile communications or 5G is great news for the IoT domain. This is mainly because of the fact that 5G networks will dramatically improve the performance and reliability of these connected devices due to the high-speed ultra-reliable connectivity, very low latency and greater coverage [
1,
2,
3]. The 5G wireless networks that are being deployed in different parts of the world today are expected to play a significant part in the digital transformation and economic success of many countries by enabling a host to unlimited lists of vital applications, such as self-driving and connected vehicles, drone-based deliveries, online shopping, IoT smart cities, e-healthcare and robotic-assisted surgery and many others; see
Figure 1. The technology promises to enable a huge number of connected devices, forming the IoT paradigm. IoT devices are yet considered an attractive target for cyber threat malicious individuals or groups, because they could be hijacked to form what is known as a botnet to launch Distributed Denial of Service (DDoS) attacks to control the networks. 5G and IoT device security is also much more complicated to manage; it is evident that audio steganography is used to preserve the security and privacy of the devices. Audio steganography science is used to transmit secret text or audio information by modifying an audio signal in an imperceptible manner [
4]. The hidden information should be only extracted by the intended recipient, and the stego message after steganography should have the same characteristics as the plain message before applying steganography. Steganography is a term from the Greek language and consists of “stegano = secret, hidden” and “graphy = to write, to draw” [
5]. According to Caldwell, “Steganography is the art and science of communicating in such a way that the existence of the message could not be detected”. Steganography, in order to provide safe communication, hides messages by preventing comprehensibility and confidentiality. Steganography is widely used by the military and diplomats. Nowadays, the steganographic approach used for information is encrypted and transferred through pictures, audio or video. So, it is possible to hide information in songs, films or other information media [
6].
There are several detection techniques of hidden messages in MPEG-1 Audio Layer 3, known as MP3. Steganalysis is being widely used to detect the presence of hidden messages in digital media [
7]. The degree of steganalysis detection accuracy lies with its detectability measure. Most detection-based steganalysis tools find it very difficult to capture micro-trace(s) of the contents of secret messages in audio media. With the advancement of machine learning-based steganalysis algorithms, most of the modification’s traces within an audio file can be detected easily. Yet, there is still need for evaluating the detection accuracy further and in greater detail. It remains unclear if the detection accuracy lies with different bit rates or a constant sampling rate for embedding in an audio file, typically a MPEG-1 Audio Layer 3, known as MP3. It has been utilized in audio information hiding for various reasons, one being that it constitutes a highly popular format for compressed audio.
Steganalysis is a technique, of decoding information that is hidden in image and audio files in [
8] proposed can detect up 1% of the capacity in MP3 files and another that can detect 28 bytes hidden in a file [
9]. It seems that the more steganography techniques are proposed, the more widespread the use of the steganalysis method becomes [
10]. The goal of steganalysis is to collect satisfactory evidence of the presence of embedded messages and break the security of its carrier. Thus, the role of steganalytic techniques that can reliably detect the presence of hidden information in audio files is increasing [
11].
In recent years, neural networks have proven their effectiveness in many applications and are recognized as a powerful data analysis and modeling tool. Most of the proposed steganalysis models are based on artificial neural networks (ANN) [
12,
13]. Learning steganalysis overcomes the analytic challenge by obtaining an empirical model through brute force data analysis [
14]. The solutions come from such areas as pattern recognition, machine learning and artificial intelligence [
15]. The ANN approach to steganalysis detects the presence of an eventual hidden message in a file [
16], whereby the ANN itself is chosen as a classifier to train and test the given audio.
The remaining parts of the paper are organized as follows:
Section 2 presents the related research work,
Section 3, the research methodology,
Section 4, the experimental analysis,
Section 5, the results and
Section 6, the conclusions and recommendations.
2. Related Works
Several factors need to be considered when setting up a realistic MP3 steganalysis benchmark and determining the accuracy of the used technique. Holub and Fridrich [
17] suggest that the first step in determining the accuracy of a MP3 steganalysis model is to restrict the size of the MP3 file. This is necessary, as it is impossible to cover all possible MP3 sets. Therefore, a finite set within the carrier medium should be created. This is crucial, because the size and content of the set within which a data is going to be embedded have a significant impact on the steganalysis results [
18,
19]. The second step is to extract features, where the choice of characteristic features is extracted from all MP3 files. These features are chosen to reduce the dimensionality of the analysis. Although extracting features from an MP3 constitutes a destructive process, the extracted features are expected to be sufficiently descriptive, which means that the information relevant to the steganalysis is retained [
20]. The third parameter is the model or classifier. The model is selected so that steganographic MP3 files and normal files are distinguishable in accordance with the previously extracted features. In most cases, a supervised machine-learning classifier is used. Several of these models and classifiers are discussed in Holub and Fridrich [
17]. Finally, the performance measure determines the accuracy of the detection. The security of a stego algorithm is measured by the ratio between the number N of correctly identified MP3 files and the total number M of MP3s in the defined set. This measure is called accuracy and can be derived from the confusion matrix obtained after a binary classification problem using either stego files or normal files.
The main goal of steganalysis is to detect the existence of a stego-object in a medium that appears suspicious. This domain has progressed following refinements of the initial idea. The binary classification between the cover file and the stego file is fitting for a qualitative steganalysis. However, this is a not a commonly used term. A simple stego algorithm that changes the least significant bits (LSB) of discrete cosine transform (DCT) coefficients directly to embed the message (such as JSteg) will visibly affect the histograms of such coefficients (given that the message being embedded is of sufficient size).
Most steganalysis schemes are derived from this class. Once a stego algorithm is known (assuming its function is made public), a steganalysis scheme can be derived from the way the information is embedded, as, for example, the LSB of DCT coefficients [
21]. The concept of a blind steganalysis (or universal steganalysis) is exactly the opposite of that of a targeted steganalysis. The aim of a steganalysis is to detect all steganographic algorithm types. Pevný and Fridrich [
22] presented examples of detectors for most of the MP3 steganography schemes. Fridrich [
23] indicated that a blind steganalysis can be simplified by using a specific steganalysis scheme. Hernandez-Castro et al. [
24] employed this scheme in elaborating a blind steganalyzer for MP3Stego. Another aspect of steganalysis is the quantitative steganalysis, which differs from the original qualitative steganalysis. This approach forecasts the message length concealed within the cover medium. This problem is different from that of the classical binary classification (cover or stego), particularly with respect to the models employed when conducting a quantitative steganalysis. Chandramouli and Memo [
25] were the first to introduce a quantitative steganalysis. However, this concept was already employed in several studies. Fridrich and Goljan [
26] employed a histogram approach to the DCT coefficients, while Pevný and Fridrich [
22] employed a specific scheme meant for a blind steganalysis. The modified approach was followed by a forensic steganalysis introduced by Cox et al. [
27], which does more than simply performing the detection step of a classical steganalysis. This technique uses the application of numerous other aspects of a steganalysis, as well as a cryptanalysis [
28].
Other types of MP3 steganalyses are the structural steganalysis, visual steganalysis, statistical steganalysis and learning steganalysis. The structural steganalysis is well-suited to manual inspection, whereas a visual steganalysis depends on the subjective interpretation of visual data. Statistical and learning steganography, on the other hand, are well-suited to automated calculations, although a statistical steganalysis usually has an analytic basis. A statistical steganalysis uses statistical methods to detect steganography. This approach requires a statistical model describing the probability distribution of steganography and/or covers. The model is usually developed analytically and, at least in part, requires some manual analysis of relevant covers and stego-objects. Once the model is defined, all the necessary calculations to analyze an actual MP3 are determined, and the test can be automated [
29]. A basic steganalysis model uses statistical hypothesis testing to determine whether a file is a cover or a stego-object. A quantitative steganalysis model may use parameter estimation to estimate the length of the embedded message. Both hypothesis testing and parameter estimation are considered as standard techniques in statistics, the challenge being to develop good statistical models [
30]. The statistical modeling of covers has proven to be very difficult, although it is possible to create good statistical models of steganalysis from a given stego-object in the form of targeted steganalysis models.
In practice, it is often quite difficult to obtain a statistical model analytically. Being the most computerized class of methods, learning steganalysis overcomes the analytic challenge by creating an empirical model through brute force data analysis. The solutions come from such areas as pattern recognition, artificial intelligence or machine learning [
31]. Most of the existing research on steganalysis is particularly based on machine learning, which forms part of this research. The machine is presented with a large amount of sample data called a training set and estimates a model that can later be used for classification. There exists a grey area between statistical and learning techniques, as methods can combine partial analytic models with computer-estimated models of raw data. Defining our scope as learning steganalysis, therefore, does not exclude statistical methods. It means that we are interested in methods where the data are too complex or too numerous to allow a transparent, analytic model. Machine learning may be used in addition to statistics [
32].
It is worth noting that the previous research reviewed [
32] still focuses on steganalytic functions applied to any media, yet without giving much attention to the way in which accuracies of detection of hidden data in complex situations can be determined for practical applications. Therefore, this paper proposes an evolutionary detection accuracy of secret data in MP3 files.
3. Methodology
Three major procedures were involved in this current research aimed at undertaking an experimental study to evaluate the detection accuracy of the secret data embedded in MP3 files. The steps that were followed are data collection, data analysis and interpretation of the results. The datasets used for this study are “Text file” used as the hidden file and “MP3 files” used as the carrier medium. The MP3 files fall into the two categories of a benchmark dataset and a standard dataset. The benchmark dataset was adopted from Homburg et al. [
33], whereas the standard dataset was obtained from Atoum [
34]. In the data collection step, all files obtained were already used in previous research. Therefore, their integrity and validity were already determined. An analytical model for the reposed scheme was tested with the acquired dataset. Various experimental tests for the developed proposed model were carried out using MATLAB.
Table 1 presents the peak signal-to-noise ratio (PSNR) results for Data-1 using the LSB technique for embedding MP3 files, where the secret message is embedded in 1, 2 and 4 LSBs for different genre types (alternative, blues, electronic, folk/country, funk/soul/R&B, jazz, pop, rap/hip-hop and Rock) under a 128-kbps compression rate with the cover MP3 file sizes (158 KB) and times (10 s).
This study uses the potential of the neural network model in solving uncertain cases to model the effect of hidden files inserted into the carrier by a steganographic process. Twenty MP3 files were used as the training dataset for the proposed neural network model, 10 of them being MP3 stego-object files with text messages inserted by the LSB technique and 10 copies of the original files that were not subjected to steganography.
Table 1 shows some of the characteristics of the files used as the input to the neural network. Several iterations of many experiments were conducted to identify the best features of the MP3 files for training the proposed neural network mode. The parameter configuration of the neural network system involved designing two processes, the structure of the network and the vector of the network. In the design process, many trials are used to select features of MP3 files, such as the peak signal-to-noise ratio (PSNR), mean standard error (MSE), correlation and mean. When selecting the feature parameter of the neural network structure, it is also necessary to select the neural network type, number of layers, number of neurons in each layer, training function or algorithm and activation function for each layer. The network vector is used to create the network for the given learning process; it contains information about all features as well.
The results shown in
Figure 2 indicate that the imperceptibility of 1 LSB is better than that of 2 LSB and 4 LSB for all genre types. The imperceptibility in 4 LSB is worse than that of 1 LSB and 2 LSB. The average PSNR values are 64.2147, 61.4541 and 57.2901 for embedding in 1, 2 and 4 LSBs, respectively. The highest value for 1 LSB (64.3768) occurs in the jazz genre, that for 2 LSB (61.8968) occurs in the folk/country genre and that for 4 LSB (57.8767) occurs in the blues genre. The lowest value for 1 LSB (64.1456) occurs in the alternative genre, that for 2 LSB (61.1305) occurs in the blues genre and that for 4 LSB (57.1153) occurs in the rap/hip-hop genre.
3.1. Feature Extraction
Obtaining the features that can reflect differences between stego-objects and cover audio constitutes the most important process in steganalysis. Here, various metrics can be used to determine the experimental strength of the ability to detect bits in any carrier medium [
28]. Crucial to this research are those features below that are seen or observed when attempting to detect the text message hidden inside the MP3 _le. The features that were used are PSNR, MSE, correlation coefficient, total harmonic distortion, power spectral density, energy of sound, standard deviation, mean and sum of squared errors (SSE).
PSNR: An important feature in determining the degree of difference between a data signal and a noise signal. The PSNR of each MP3 file is used to measure the quality of reconstruction of lossy compression.
MSE: Another important measure that evaluates the error in a model. The value for each MP3 measures the quality of sound. This metric is always nonnegative, and values closer to zero are better.
Correlation coefficient: It takes in two or more parameters, and evaluations show how closely they are related. Thus, it applies to be the evaluation of sound quality [
18].
Total harmonic distortion (THD): It tends to show the distributions of the signal within a medium. Thus, it is applied to this research in terms of measuring the percentage of the overall signal composed of harmonic distortion. This metric is a good indicator of sound quality [
18].
Power spectral density (PSD): It gives a well-defined visualization of the signal that is being processed as a plot of the portion of a signal’s power (energy per unit of time) falling within given frequency bins [
24].
Energy of sound: It measures the distance between two points in the signal space and illustrates the signal strength [
24].
Standard deviation: It measures how the set of means deviate from the overall mean of the data that are being processed. In this study, this metric applies to noise and other interference [
24].
Mean: It indicates the average value of a signal within a certain process. In this study, this metric reflects how the signal fluctuates around the mean value [
24].
SSE: It indicates a combination of errors derived from certain processing events. In this research, it evaluates the absolute errors in the signal processing [
18].
Wavelet Domain PSNR and MSE: This feature (wavelet) deals with signals in formats other than the regular frequency domain format. It provides good and accurate details about signal data. Here, it is used as a measure of PSNR and MSE.
3.2. Feature Normalization
In the normalization phase, the data are cleaned to enhance the system performance. Normalization is a transformation procedure that scales the data values within a feature, since the difference between the minimum and maximum values of the feature is usually too large. In
Table 2 the feature data values are normalized to the specified range of 0–1. Among the many normalization techniques that have been proposed [
10], the parameters that include the mean and standard deviation when using z-score normalization and the minimum and maximum values when using min-max normalization are most frequently used [
35]:
3.3. The Experimental Analysis
When a network model undergoes an optimization process, it follows the procedure set by its training functions. The gradient descent with back-propagation and an adaptive learning rate (known as traingdx) used for this study is a network training function that updates the weight and bias values according to the gradient descent momentum and the adaptive learning rate. The major constraints within the model provide various outcomes relative to the input values (weight and bias). The traingdx function updates its weight and bias values according to gradient descent back-propagation and an adaptive learning rate. The network training is stopped when the performance over the validation dataset starts to increase after a steady initial decrease.
In the training process, the preprocessed data are fed into the neural network architecture. The neural network uses weights and biases to update the input according to the desired output. The patterns in the data are identified, and the neural network is trained to predict recurring instances of such patterns. Each layer in the network consists of a group of neurons. Each neuron is the output of the first layer and represents the input to the neurons in the second layer. In feed-forward neural networks, the neurons take input from the previous layer. This propagates the subsequent layers. This study ran this system on 20 MP3 files, half of which were stego files, to train the ANN classifier. The remaining files were used for testing. The proposed model had two hidden layers, containing 20 and 40 neurons, and one output layer. The model used a vector of 20 elements as input to the training process. The neural network was a multilayer perceptron (MLP) with three layers (input layer, output layer and hidden layer). The features of every MP3 file were calculated using the min-max technique for normalization. Subsequently, all the data were collected in one vector, meaning that all the elements for feature extraction were combined. The properties of all 20 MP3 files were calculated, with 0 denoting the characteristics of a normal MP3 file and 1 denoting the characteristics of a stego MP3 file. These inputs were then fed into the neural network for training.
3.4. The Detection Algorithm for MP3 Files
Detecting an MP3 file is synonymous to steganalysis, where the hidden file form in the stego-object is revealed. Various techniques can be applied for this kind of process. The success of each technique lies in its ability to detect a hidden file without damaging or destroying it. In this study, a neural network is used to detect hidden files in a stego file. The neural network starts to propagate the input through the network layers and calculates the output value. An output value above 0.2 indicates that the file is a stego MP3 file, whereas values below this threshold indicate a normal file.
In order to verify the model’s effectiveness, the input vector trained by the neural network is loaded and should simulate the parameters given using the proposed model. The output will be in the range 0–1, according to the activation function of the output layer (i.e., linear function from 0–1). An approximation of the output is used, where the output is considered to be 0 (less than 0.2); otherwise, the output is considered to be 1.
This approximation (or digital encoding) activates the result. An output of 1 indicates that the input is detected, meaning it is a stego MP3 file, whereas an output of 0 indicates that no input file is detected and that it is a normal MP3 file. This implies that the trained model is not able to detect the presence of any embedded file.
- Step 1:
Select every MP3 file to be tested.
- Step 2:
Obtain parameters from the MP3 file, such as bitrate and the frequency of samples.
- Step 3:
Calculate and extract the features from the MP3.
- Step 4:
Normalize the MP3 file using min-max normalization.
- Step 5:
Statistical information regarding the input vector calculated from a specific MP3 file is entered into the network, and an output of 1 or 0 is received, depending on whether the input is a stego file or not.
- Step 6:
Load the trained neural network that was built in the training process, which contains the number of input files, number of layers, object structures of the neural network, functions of the neural network traingdx function for training and SSE as a performance function, as well as other functions and parameters for the neural network (weight and bias values).
- Step 7:
The output is in the range 0–1, depending on the activation function of the output layer.
- Step 8:
The output is 0 if it is less than 0.2 and, otherwise, a stego file.
3.5. Analysis of Detection Accuracy
This study uses SSE to evaluate the network performance. The performance is measured according to the sum of squared errors. Given the training performance over 7500 epochs and the complete input learning iteration, the time duration is approximately 51 s for each iteration. If the final performance error (0.0001) and the gradient of output change (0.0014) are both close to zero, it means that the learning of the network is stable. A large gradient implies that the output is not stable, and the result is an error (even though it is very small), whereas, if very small gradients are reached, the output error is guaranteed to be small. Detecting MP3 files extracts 11 features (mean, standard deviation, correlation coefficient, SSE, PSNR, MSE, wavelet domain PSNR, wavelet domain MSE, THD, PSD and energy of sound) for use as input to the ANN. At the same time, the trained network is loaded into the model, and the output of processing the ANN gives the probability that the input is a stego MP3 file. If the probability is close to 0, the file is a normal MP3 file and, otherwise, a stego-object.
The detection model was constructed using MATLAB 15.1, which allows machine-learning schemes to be implemented. A total of 960 different stego MP3 files were used, each containing 11 features. The confusion matrix and cross-validation were used for training and testing the datasets, and the detection accuracy was measured. In the detection experiment, standard datasets were used. For the standard dataset, a total of 180 MP3 files were used for each genre that was used for each LSB.
4. Presentation of Analytical Results
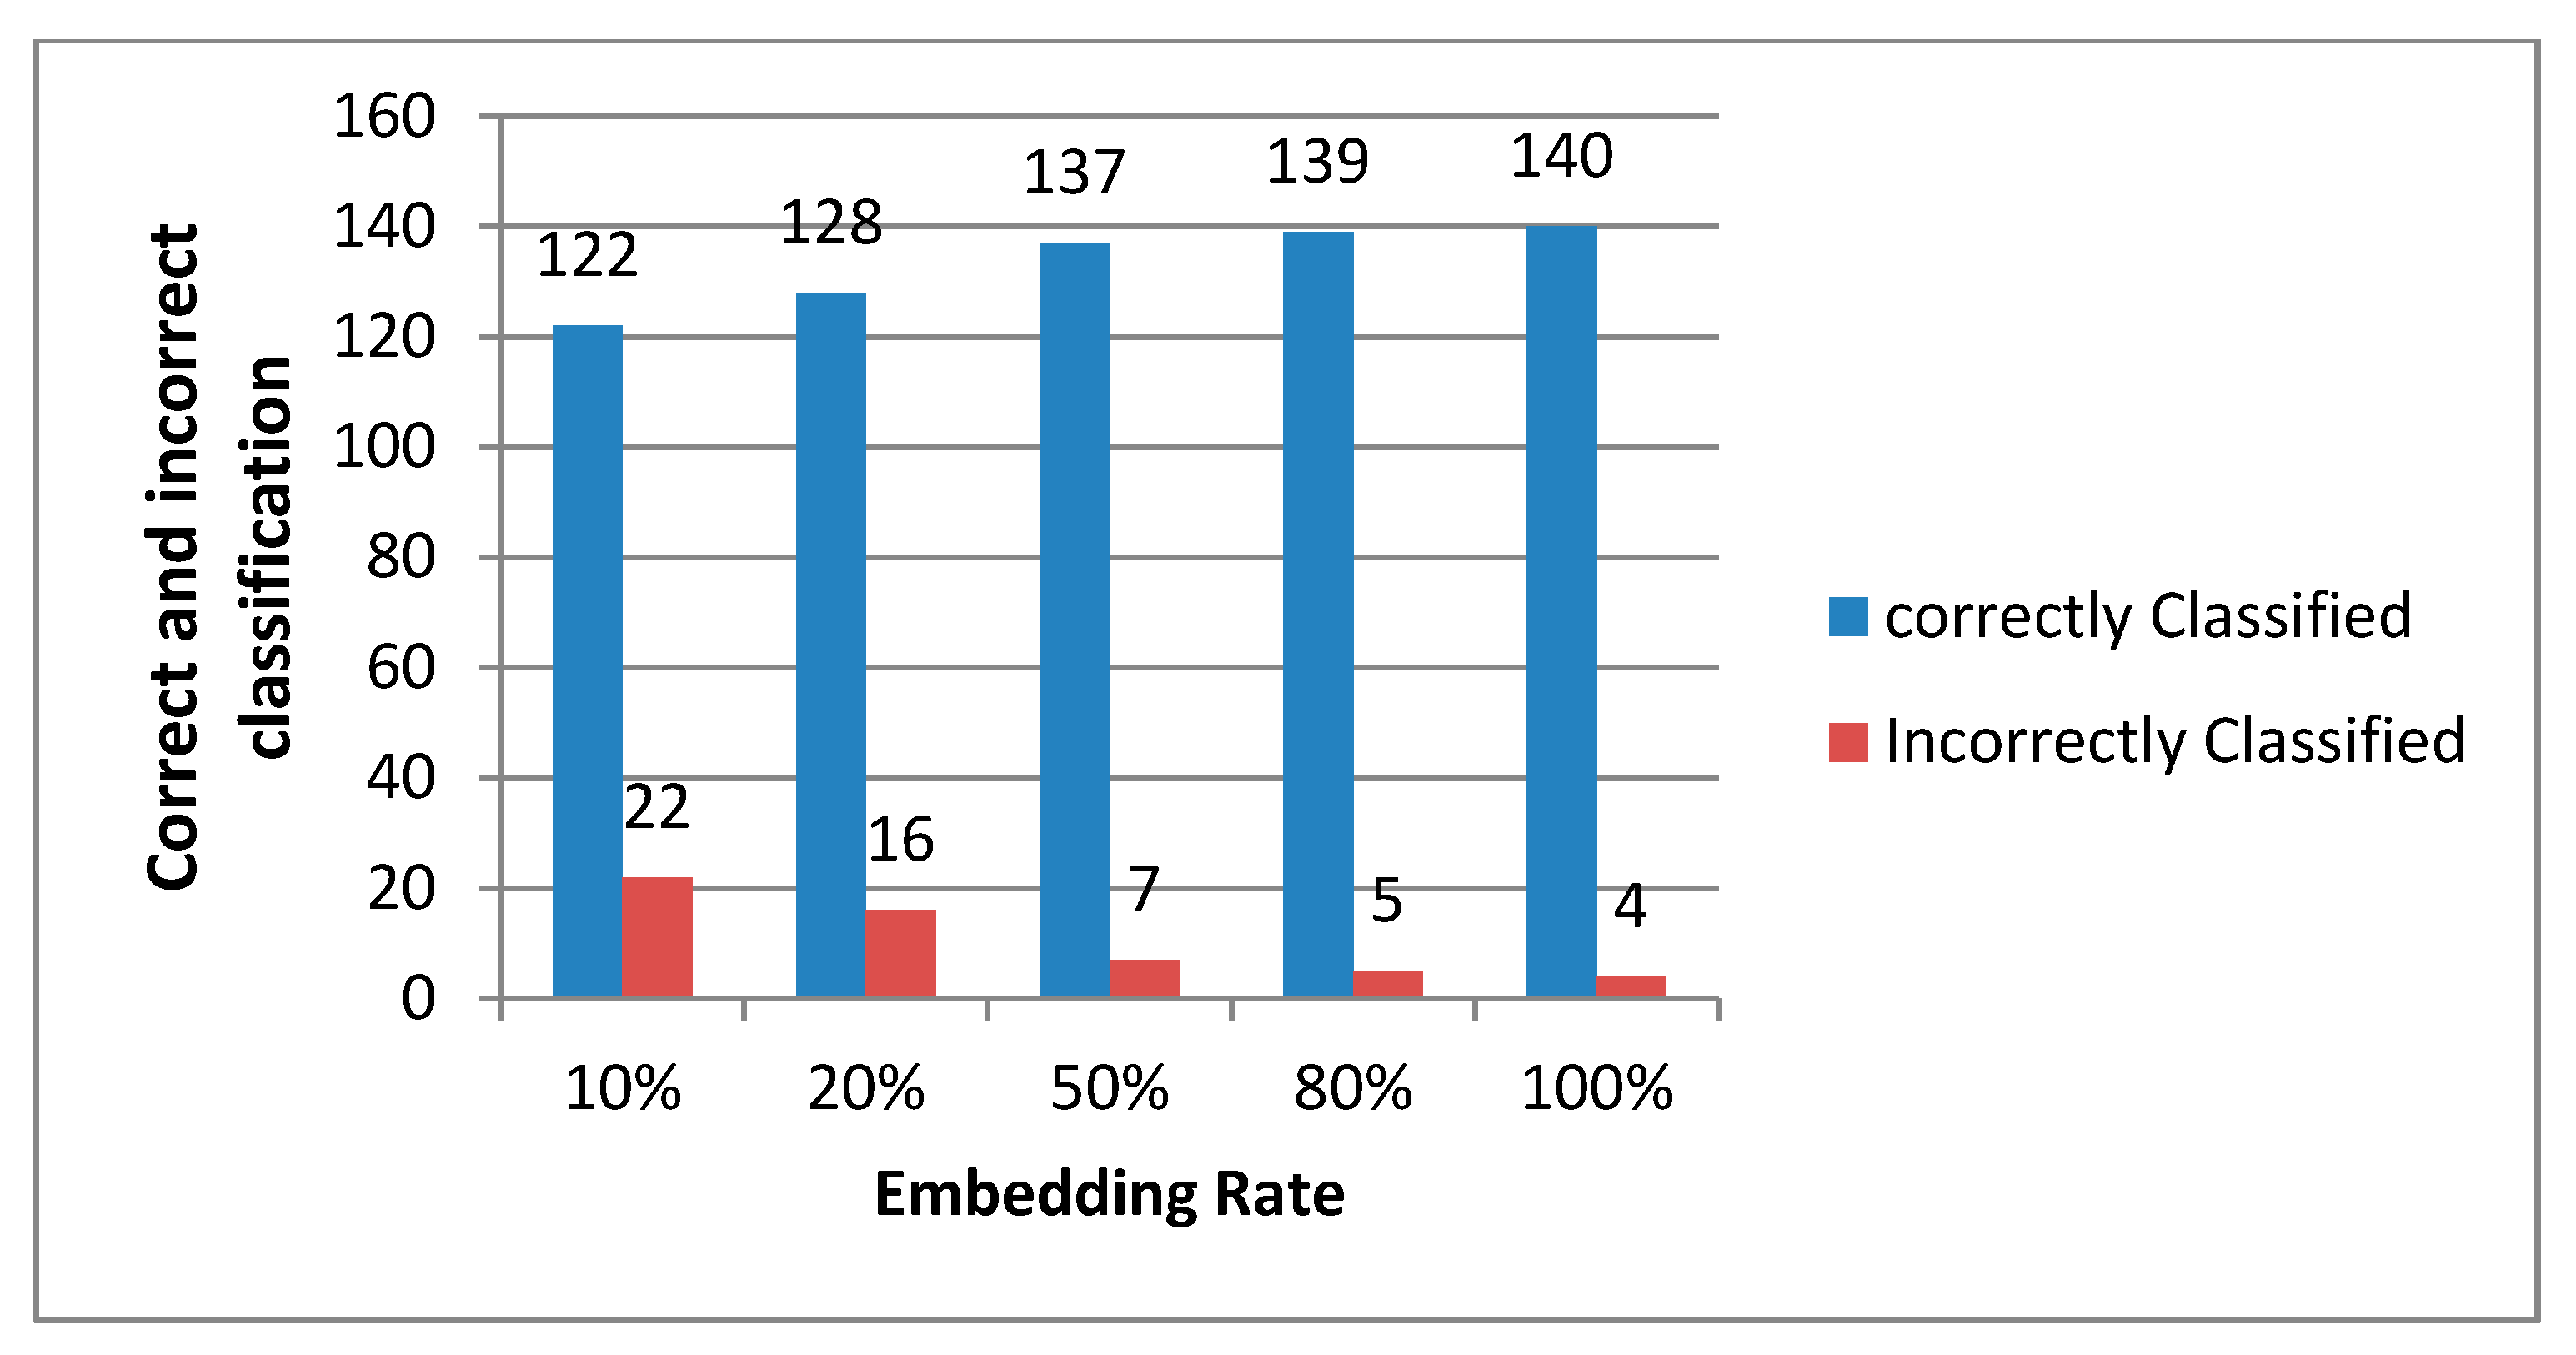
Table 3 presents the accuracy results for different embedding rates (ER) (10%, 20%, 50%, 80% and 100%), where the secret message is embedded using one LSB. In
Figure 3, the 100% ER gives the highest accuracy of 97.22%, with 140 out of 144 files correctly classified (
Figure 4), followed by the 80% ER with an accuracy of 96.53%. The lowest accuracy rate of 84.72% was recorded with the 10% ER, with 122 files correctly classified. In
Table 3, the 50%, 80% and 100% ERs have positive detection accuracies [
36].
Table 4 presents the accuracy results for different ERs (10%, 20%, 50%, 80% and 100%), where the secret message is embedded using two LSB.
Figure 5 shows that the 100% ER achieves the highest accuracy of 97.22%, with 140 files correctly classified out of 144 (
Figure 6). The lowest accuracy rate of 84.72% is given by the 10% ER, with 126 files correctly classified. In
Figure 5, the results show that the 20%, 50%, 80% and 100% ER achieved a positive detection accuracy [
36].
Table 5 presents the accuracy results for different ER (10%, 20%, 50%, 80% and 100%), where the secret message is embedded using four LSB.
Figure 7 shows that the 100% ER gives the highest accuracy of 97.92%, with 141 files correctly classified out of 144 (
Figure 8). The lowest accuracy rate of 90.28% occurs with the 10% ER, with 130 files correctly classified. In
Figure 7, the results show that the 20%, 50%, 80% and 100% ER achieve a positive detection accuracy [
36].
The performance evaluation is divided into two parts. In the first part, the confusion matrix is analyzed, including the false negative rate (FNR), false positive rate (FPR), true positive rate (TPR) and true negative rate (TNR). In order to analyze the confusion matrix, the FNR, FPR, TPR and TNR are measured. The FPR is calculated as the ratio between the number of negative cases wrongly categorized as false positives (FP) and the total number of negative cases. The FNR is calculated as the ratio between the numbers of positive cases wrongly categorized as false negatives (FN) and the total number of positive cases. The TPR is calculated as the ratio between the numbers of negative cases wrongly categorized as true positives (TP) and the total number of negative cases. The TNR is calculated as the ratio between the numbers of positive cases wrongly categorized as true negatives (TN) and the total number of positive cases.
where FN means that the stego MP3 audio is predicted as being the original MP3 audio, FP means that the original MP3 audio is predicted as being the stego MP3 audio, TP means that the stego MP3 audio is predicted as being the stego MP3 audio and TN means that the original MP3 audio is predicted as being the original MP3 audio. Finally, the true accuracy rate is computed as Equation (6), and the false accuracy rate is computed as Equation (7):
Table 6 presents the results for all MP3 files embedded with 10%, 20%, 50%, 80% and 100% secret messages using 1 LSB, 2 LSB and 4 LSB.
The accuracy is defined as the percentage of cases that are correctly classified from the total number of cases in the dataset.
Figure 9 shows the results for all MP3 files embedded with 10%, 20%, 50%, 80% and 100% secret messages with different LSBs. It can be observed from
Figure 9 that the more information is hidden, the easier the detection of MP3 files after the steganography operation. The detection results for ERs of 20%, 50%, 80% and 100% achieve an accuracy of more than 90%. The overall accuracy can be calculated as:
The error rate is defined as the percentage of cases that are incorrectly classified over the total number of cases in the dataset.
Figure 10 shows the results for all MP3 files embedded with 10%, 20%, 50%, 80% and 100% secret messages using different LSBs. The detection results for ERs of 50%, 80% and 100% have error rates of less than 5%. The overall error rate can be calculated as:
5. Discussion
The use of multimedia technology has expanded to such an extent over the past two decades that it now encompasses a wide range of applications, with an increasing focus on digital audio data security and safe communications. This study examined the steganalysis of MP3 files using statistical tools for analysis. The major contribution of this research lies in offering an efficient model for the detection of stego-objects in MP3 files based on the LSB technique using an enhanced ANN that was developed and implemented. An improved performance in the detection of embedded messages in MP3 files was achieved. This study used a statistical analysis by extracting the features (THD, PSD, energy of sound, correlation coefficient, mean, standard deviation and SSE) of MP3 file use as the input of artificial neural networks.
An improved LSB steganography technique was implemented. The model proposed in this study successfully detected messages embedded by steganography in the one, two, and four LSBs based on ANN with various inputs and hidden messages to detect possible stego-objects inside MP3 files. Finally, this study used benchmark and standard datasets to measure the quality of the proposed detection algorithm and compared the results with those achieved by previous techniques in the same area. The goal of this study was to generate stego MP3 audio files as the carrier for hidden messages with different compression ratios, different genres, different file sizes and different sampling frequencies. Based on this research, one of the most important recommendations for future work is to examine file sizes of greater than 14.2 MB to achieve better PSNR values and, also, use other bit rates to obtain higher average PSNRs.
The finding of this research is compared to the findings of previous studies (see
Table 7). Among the crucial studies involved is the work of Jin et al., who proposed a method that can detect a series of steganography techniques for MP3 audio by analyzing the co-occurrence matrix constructed from the quantized modify discrete cosine transformation (QMDCTs) coefficients of the MP3 audio. The results show that their approach can detect a series of MP3 domain-based steganographic methods effectively.
Table 7 compares the average accuracy of detection achieved by the proposed model for compression rates of 128 kbps against the results given by the models proposed by Yan et al. [
16], Wan et al. [
9], Qiao et al. [
18] and Jin et al. [
20]. The maximum accuracy (97.17%) occurs at a compression rate of 128 kbps.
Figure 11 shows that the new steganalysis model for detecting MP3 files with the use of an ANN and feature extraction (mean, standard deviation, THD, PSD, energy of sound and correlation coefficient) to describe the characteristics of the stego-objects outperforms previous methods.
In
Table 8 and
Table 9, the performance of the model proposed in this study is compared with the methods of Yan et al. (2013) and Qiao et al. (2013) at the same compression rate of 128 kbps. From the results in these tables, it can be seen that the methods of Qiao et al. and Yan et al. can detect MP3Stego steganography in MP3 audio with various bit rates. However, the model proposed in this study is appropriate for the default condition of MP3Stego compression (128 kbps), as it can reliably detect steganography at low embedding rates, as shown in
Figure 12 and
Figure 13.
6. Conclusions and Future Research
Audio steganography is a technique for hiding data in a different medium. The goal is to embed data in an audio cover file that must be robust and resistant to attacks. Steganalysis is the practice of attacking steganography techniques for the detection, extraction and, probably, destruction and manipulation of the hidden data. Detection accuracy by steganalysis methods constitutes a highly efficient and important method. Hidden messages can only be extricated by the intended data recipients. The current study investigated the detection accuracy for MP3 audio files using machine learning. This study fulfils the main objective of evaluating MP3 audio files to identify inconsistencies that indicate an embedded secret message/information. All results were collected in a controlled laboratory environment using the LSB technique with an ANN for feature extraction to detect secret messages. The datasets used in this study consisted of a benchmark dataset. All audio MP3 files were preintegrated and validated for analysis. The experimental results showed that the proposed method offers a significant improvement in detection accuracy at low embedding rates compared with previous works. The proposed approach achieves the highest PSNR values for different genres of music, with the secret messages/information embedded at one, two and four LSB for the dataset under the 128-kbps compression method. The PSNR results of embedding MP3 files where a secret message is embedded at one, two and four LSB for different genres with the benchmark dataset showed that one LSB performs better than two LSB and four LSB. In the detection process using the benchmark dataset, the accuracy result for different payloads showed that four LSB achieved the highest accuracy (97.92%) at 100% ER, with an error rate of less than 5%. Finally, the experimental results show that the method proposed in this study is significantly effective in embedding and detecting stego MP3 files. Overall, the proposed method satisfies the capacity and complexity requirements of steganography. Furthermore, the detection problem in respect to MP3 audio files can be solved using an efficient ANN technique. In future works, we could examine file sizes of greater than 15 MB to achieve better PSNR values and, also, use other bit rates to obtain higher than average PSNRs.

 ,
, 


