Article

Research on Information Fusion for Machine Potential Fault Operation and Maintenance

1
School of Mechanical and Electrical Engineering, Sanjiang University, Nanjing 210012, China
2
School of Environmental Science, NanJing XiaoZhuang University, Nanjing 211171, China
3
Jiangsu Shentong Valve Co. Ltd., Nantong 226232, China
*
Author to whom correspondence should be addressed.
Symmetry 2020, 12(3), 375; https://doi.org/10.3390/sym12030375
Submission received: 8 February 2020 / Revised: 13 February 2020 / Accepted: 14 February 2020 / Published: 3 March 2020

Abstract

:
In recent years, the development of sensor technology in industry has profoundly changed the way of operation and management in manufacturing enterprises. Due to the popularization and promotion of sensors, the maintenance of machines on the production line are also changing from the subjective experience-based machine maintenance to objective data-driven maintenance decision-making. Therefore, more and more data decision model has been developed through AI technology and intelligence algorithms. Equally important, the information fusion between decision results, which got by data decision model, has also received widespread attention. Information fusion is performed on symmetric data structures. The asymmetric data under the symmetric structure leads to the difference in information fusion results. Therefore, fully considering the potential differences of asymmetric data under a symmetric structure is an important content of information fusion. In view of the above, this paper studies how to make information fusion between different decision results through the framework of D-S evidence theory and discusses the deficiency of D-S evidence theory in detail. Based on D-S evidence theory, then a comprehensive evidence method for information fusion is proposed in this paper. We illustrate the rationality and effectiveness of our method through analysis of experiment case. And, this method is applied to a real case from industry. Finally, the irrationality of the traditional D-S method in the comprehensive decision-making results of machine operation and maintenance was solved by our novel method.

1. Introduction

With the promotion of intelligent manufacturing, more and more sensors are being used in the inspection process [1,2]. These collected data are not only conducive to the real-time detection of the machine, but also to the timely detection of potential fault problems of the machine to ensure the safety and reliability of manufacturing. As a new generation of industrial paradigm, industry 4.0 explains the digital competition that industrial enterprises are facing. Vertical integration requires digitalization of the manufacturing process within the enterprise. Horizontal integration requires the enterprise to realize product traceability throughout the supply chain, and end-to-end integration requires seamless connection of the whole industry. Therefore, as the underlying physical technology of digital transformation, sensor technology has achieved unprecedented development in recent years. In particular, it is well known that sensors can bring rich data to manufacturing. Such richness is reflected not only in the quantity of data, but also in the variety of data. Nowadays, through the establishment of a manufacturing execution system (MES) [3], a large number of enterprises have been able to obtain data regarding machine detection, the manufacturing process, and product quality at the speed of seconds.
Furthermore, due to the development of Artificial Intelligence technology, big data analysis has achieved unprecedented progress and expansion [4,5,6]. AI-based decision-making support [7] is also becoming increasingly popular in the operation and maintenance of manufacturing systems such as production scheduling [8], stock management [9], preventive maintenance [10], etc. Although decision-making support systems are more and more popular, it is worth noting that most enterprise support decisions today are mainly based on the analysis results of a single data source. Such decisions result in a large amount of data not actually being used to maintain the manufacturing systems.
In fact, the key issues here include two points. On one hand, the value of big data is not really mined and utilized. Generally, when enterprises implement AI-based support decisions, they always want to cover as much data as possible by deploying a single AI technology to be able to quickly complete the decision system in only one development. This kind of development approach will reduce the development costs, however, this kind of development mode often mixes different types of data, making the data interpretation poor. In some cases, in order to improve the interpretability of data, the development process chooses to consider only part of the data, which the decision system is unable to use. On the other hand, if we develop multiple models for different data in one decision system, due to the one-sided observation of different data on the manufacturing system, different models may give different results. Information fusion and contradiction neutralization between models will soon become a thorny matter. The solution to the first problem is relatively easy. In practice, different data can be sorted according to the manufacturing process, and then multiple models can be built for different data, so the data value can be mined from multiple aspects. Compared with the first problem, there have been few studies on information fusion and contradiction of multiple models for decision support.
Therefore, based on the consideration of the above problems, this paper proposed a multi-source data information fusion method to support maintenance decisions for potential machine failures. By introducing the Dempster–Shafer (D–S) evidence theory and taking the machine as the problem identification framework, we developed an improved D–S evidence method to resolve the contradiction between the decision results generated from the different AI-based decision models to support the machine’s early potential failure maintenance through our comprehensive evaluation.
The remainder of this paper is organized as follows. Section 2 introduces the current mainstream information fusion methods in industrial scenarios and analyzes their advantages and disadvantages. Then, D–S evidence theory and its improvements are introduced in Section 3 to support subsequent information fusion. Section 4 uses a numerical case to carry out specific calculations and demonstrate the effectiveness of the proposed improved D–S method through comparative analysis. A case of a real industrial operation and maintenance is given in Section 5. Through the analysis of the case, the advantages and feasibility of our method are further explained. Finally, the summary is presented in Section 6.

2. Related Work

The main purpose of information fusion is to integrate multi-source homogeneous or heterogeneous information to obtain a comprehensive information evaluation [11]. At present, there are a variety of information fusion strategies and methods developed by scholars including Bayesian inferences [12], fuzzy reasoning [13,14], D–S evidence theory [15,16,17], and the neural network method [18]. The comparison between fusion methods is shown in Table 1 as follow.
Bayesian inferences is a method of reasoning using conditional probability. Generally, Bayesian inferences need to obtain the prior probability distribution to reason on the posterior probability, and then makes a decision. However, for industrial scenarios, especially in the maintenance process, it is usually accompanied by the continuous adjustment and maintenance of the machine. Therefore, the data collected by sensors will change due to the adjustment of the machines. Therefore, the decision results often become inaccurate due to changes in the prior probability distribution.
The core of fuzzy reasoning is the extraction of uncertain information in the process of information fusion, then the analysis is carried out by the uncertainty. How to design the rules of fuzzy reasoning is the key issue of fuzzy reasoning. Different manufacturing systems have different structures and settings, so it is generally necessary to design fuzzy reasoning rules according to specific structural and settings, which limits this kind of reasoning method being applied in many heterogeneous manufacturing systems.
The neural network method establishes input–output relationships based on the connection between nodes. In general, the input of the neural network must be homogeneous, and it needs a lot of data and time for training to guarantee the rationality of its reasoning results. The heterogeneous data in industry severely restricts the application of a neural network as an information fusion strategy.
D–S evidence theory is a classic probability-derived method. Compared with other processing methods, D–S evidence theory can effectively deal with uncertain information in unknown environments. Therefore, it is widely used in fault diagnosis, multi-standard decision-making, and other fields. However, the shortcomings of D–S evidence theory are: (1) it is difficult to handle the fusion of extremely contradictory information; (2) the reliability of the evidence itself is not deeply considered; and (3) the lack of consideration of the consistency between the evidences. This paper will focus on these issues in Section 3 and give an improvement strategy to enhance the rationality of D–S evidence theory in order to apply it to practical industrial problems.

3. Information Fusion Based on D–S Evidence

3.1. D–S Evidence Theory

D–S evidence theory was first proposed by Dempster and then developed by Shafer. The basic elements are: (1) define the problem identification framework θ = { w 1 , w 2 , , w c } , and (2) set the basic probability assignment function (BPA) m : 2 θ [ 0 , 1 ] , which meets the following conditions:
m ( ) = 0   and   A θ m ( A ) = 1
where A is a subset of 2 θ , and m ( A ) represents the support the degree of evidence for proposition A . Each proposition has a corresponding BPA. The problem probability outside the problem recognition framework is 0 , and the sum of the problem probabilities in the framework is 1 . Based on the above, for A θ , A , the multiple evidence fusion rules are defined as:
m ( A ) = 1 K A j = A i = 1 n m i ( A j )
where
K = A j ϕ i = 1 n m i ( A j )
K is the normalization coefficient, which reflects the contradiction degree between multiple evidences. D–S evidence fusion rules can model uncertain and inaccurate data without prior knowledge of the prior probability [45]; and can effectively fuse different evidence from different data sources to obtain a more accurate comprehensive evaluation result.

3.2. Lack of D–S Evidence Theory

D–S evidence theory has at least three serious problems of insufficient evidence fusion.
• 1. The error in the fusion of extreme evidence.
Zadeh et al. questioned D–S evidence theory through an example [46]: There are three suspects A, B, and C in a murder, and Witnesses 1 and 2 give the corresponding BPA, as shown in Table 2.
Table 2 shows the result of information fusion with two witnesses. Through the calculation process of D–S evidence theory, it can be found that if a witness has cast an extreme probability distribution on a certain suspect, no matter how other witnesses make decisions, the overall degree of suspect of this suspect will be very low (even 0 ). Such conflict cannot be resolved in the classic D–S evidence theory.
• 2. The reliability of the evidence itself is not considered.
In many decision-making processes, people will have two subjective tendencies to the decision results based on their self-cognition. People who have a good grasp of the decision-making events usually have an obvious tendency to make a probability distribution, while people who only have a one-sided understanding of the decision-making events usually make a more balanced probability distribution. This leads to differences in reliability between different evidences.
For example, the BPA is presented in Table 3.
Witness 1 clearly believes that C cannot be a suspect. Such a BPA helps to narrow the suspects to A and B. If we assume that Witness 1 is a rational witness, such a BPA would be advantageous for the exclusion of suspect C. For the BPA of Witness 2, although A is also considered to be the most suspicious, it is not helpful for the discrimination between B and C. Similarly, it is assumed that Witness 2 is also a rational person. Due to the thinking habits of a rational person, Witness 2 identified that A had a greater possibility of committing the crime, according to their observations. However, to judge B and C, the lack of observations limited them in being unable to make a judgment, so it was considered to give B and C the same BPA. From the perspective of rational man, we think that the judgment from Witness 1 is more valuable because the BPA of Witness 1 was more targeted, which means that they have more confidence in their result, so the reliability of evidence is stronger. However, in the classical D–S evidence theory, the reliability of evidence is not directly considered.
• 3. The relationship between the evidence is not considered in depth.
D–S evidence theory mainly considers the combination of evidence. Such a combination method is often multiplication and accumulation of evidence without distinction. The disadvantage is that the inherent relationship between the evidence cannot be extracted.
For example, see Table 4.
Intuitively, it can be seen that Witness 1, Witness 2, and Witness 3 all mainly pointed the crime at A, but Witness 4 thought that A was unlikely to commit a crime, and C was most likely to commit a crime. From a rational perspective, the result of information fusion should be A with the highest probability, followed by B and C. Since C has only one piece of evidence, and it is obviously inconsistent with other evidence, the credibility of its evidence should be the lowest and should be eliminated during information fusion. Moreover, in order to ensure the reasonableness of the fusion, A should be guaranteed to obtain the highest possible fusion probability so that A can be identified. However, from the results of the current fusion of D–S evidence, it is impossible to avoid the fusion error caused by the inconsistency of Witness 4.

3.3. Improved Evidence Theory

The following assumes that an information fusion problem with n propositions and m evidences is considered.

3.3.1. Weight of Evidence Reliability Based on Entropy

To address the issue of evidence reliability, we introduced entropy to characterize. Entropy [47,48] can measure the uncertainty of information effectively. Assume that the proposition set A = { A 1 , , A i , , A n } that needs to be evaluated from evidence set E v = { E v 1 , , E v k , , E v m } , and the corresponding BPA function from E v k is m k ( A 1 ) , , m k ( A i ) , , m k ( A n ) , then the entropy of E v k is defined as:
E n t r o p y k = i = 1 n m k ( A i ) l o g   m k ( A i )
Equation (4) indicates that if the E n t r o p y k of evidence k is lower, the dispersion of BPA information is lower, and the reliability of this evidence is higher.
Since entropy is inversely proportional to reliability, Equation (5) can be used to regularize the entropy of all evidence to determine the weights corresponding to m k of different evidences,
ω k = E n t r o p y k 1 k = 1 m E n t r o p y k 1
where ω k is the weight of the evidence m k .

3.3.2. Weight of Evidence Consistency Based on Evidence Correlation Matrix

Considering the relationship between the evidences, the evidence correlation matrix C m m is established by Equation (6).
C = { C i , j } = { p = 1 n m i ( A p ) m j ( A p ) ,   i j 1 , i = j
By Equation (6), the similarity between different evidences can be obtained and the correlation degree between different evidences can be obtained. Furthermore, the consistency between evidence k and other evidences (expect k ) can be obtained by Equation (7).
c o n s k = i = 1 m C k , i
For the sake of normalization, the consistency of all evidence should be normalized. For convenience, the normalized result represented by γ k , that is, the weight of evidence consistency.
γ k = c o n s k k = 1 m c o n s k

3.3.3. Reference Evidence Generation

According to the weights obtained from Section 3.3.1 and Section 3.3.2, the comprehensive reference weight α k is defined as follows:
α k = ω k γ k
The reference evidence is defined as
r ( A ) = k = 1 m α k m k ( A )
The evidence reliability weight and the evidence consistency weight are mainly used for the contradictory evidence with low reliability and poor consistency. However, for the fusion of highly consistent and reliable evidence, D–S evidence theory has its advantages. Therefore, we proposed that D–S evidence theory and reference evidence should be considered together to obtain the comprehensive fusion rule.

3.3.4. Comprehensive Evidence Fusion Rule

In the D–S evidence, the standardization coefficient K   ( 0 K 1 ) is used to judge the degree of contradiction. The contradiction is intense when K approaches 0 , and all evidences are consistent when K approaches 1 . With this coefficient, we designed the comprehensive evidence fusion rule, which is defined as
m ( A ) = K × d ( A ) + ( 1 K ) × r ( A )
where
d ( A ) = 1 K A i = A k = 1 m m k ( A i )
d ( A ) represents the fusion result from the D–S evidence theory, and r ( A ) represents the reference evidence defined by Equation (10). When K 1 , that is, the contradiction is slight, the fusion result is close to the D–S evidence. When K 0 , that is, when the contradiction is serious, the fusion result is close to the reference evidence.

4. Experiments

We used the data in Table 4 as an example for calculation and analysis.

4.1. Reliability Weight Calculation

First, calculate the reliability entropy corresponding to each evidence by Equation (4), as shown in Table 5.
Then, the reliability weights can be obtained by Equation (5), as shown in Table 6.

4.2. Consistency Weight Calculation

Calculate the evidence correlation matrix C by Equation (6).
C = [ 1 0.8587 0.8587 1 0.8579 0.0124 0.9039 0.0109 0.8579 0.9039 0.0124 0.0109 1 0.0203 0.0203 1 ]
Then, use Equations (7) and (8) to calculate the consistency weights of the evidences, which is shown in Table 7.

4.3. Reference Evidence Calculation

The reference evidence has two parts, one is the reliability of a single evidence itself, and the other is the consistency between multiple evidences. For subsequent comparative analysis, here we used Equations (9) and (10) to generate three groups of reference evidence, which is shown in Table 8. The first group was generated only by the reliability weights (set all the consistency weights as 1), denoted as r E . The second group was generated only by the consistency weights (set all the consistency weights as 1), denoted as r C . The third group was generated by the reliability weights and consistency weights, denoted as r .

4.4. Comprehensive Evidence Fusion Generation

The final fusion result can be obtained by comprehensive evidence fusion using Equation (11), as shown in Table 9. For comparative analysis, Table 9 shows the results of D–S evidence, the results generated based on reliability weights, the results generated based on consistency weights, and the results generated based on reliability weights and consistency weights.

4.5. Results Analysis

From Figure 1, we can clearly see that for the D–S method, since Witness4 assigned an extreme probability of 0 to A , regardless of the probability that other people allocate, the criminal suspicion of A will always be excluded. This is contrary to the normal inference logic, which is obviously unreasonable. The final fusion results given in Table 9 show that D S r E , D S r C , and D S r all overcame the problems of D–S evidence theory under extreme contradiction, and they all gave A a larger evaluation weight. Compared with D S r E , D S r C and D S r , it can be seen that D S r E assigned a larger evaluation weight to A . Additionally, D S r E gave a large weight to C compared to B . This is obviously not reasonable. D S r C and D S r both performed better. Both gave A with an absolutely large weight, and in the comparison between B and C , they were more inclined to suppress the distribution changes caused by abnormal evidence. As a result, their probability assignments tended to support more consistent evidence. In addition, D S r assigned a larger weight to A than D S r C , and assigned a smaller weight to C , which shows that this comprehensive method can increase the dispersion of the weight value, producing results that have a greater tendency in discrimination. In particular, for decision makers who do not understand the internal process of fusion, they can make decisions more confidently based on the fusion results.

5. Application and Verification

5.1. Problem Description

Industrial manufacturing lines need to face many important operation and management decisions, among which machine maintenance decision is an important part of product quality assurance in the manufacturing process. Since around 2000, a large number of manufacturing enterprises realized the importance of manufacturing information, so have carried out the transformation of manufacturing system information and digitization. Therefore, more machine information and manufacturing execution information can be quickly captured. In the last decade, the popular AI method has been promoted to provide intelligent methods for the analysis of manufacturing information to improve the effect of decision support. Sun et al. [49] presented the machine importance information and machine alarm information of an electronic manufacturing enterprise analyzed by intelligent methods for 10 different machines. Specifically, the objective alarm data were clustered and mapped to the potential failure probability of the machine, and the machine importance was analyzed by the fuzzy method in [49]. Next, we will conduct information fusion for these 10 different machines with our improved D–S evidence and analyze the fusion results.
The specific methods are as follows:

5.2. Establish Problem Identification Framework

Ten machines in a production line were used as the identification framework of D–S evidence theory, as follows.
θ = { machine _ 1 , machine _ 2 , machine _ 3 ,   machine _ 4 , machine _ 5 , machine _ 6 , machine _ 7 , machine _ 8 , machine _ 9 , machine _ 10 }
Table 10 shows the suspected failure probability of 10 machines derived from machine importance information, and Table 11 shows the suspected failure probability of machines derived from the machine alarm.
According to the probability of machine suspected fault obtained from the machine importance and machine alarm, information fusion is needed to guide the resource allocation under the limited operation and maintenance resources.

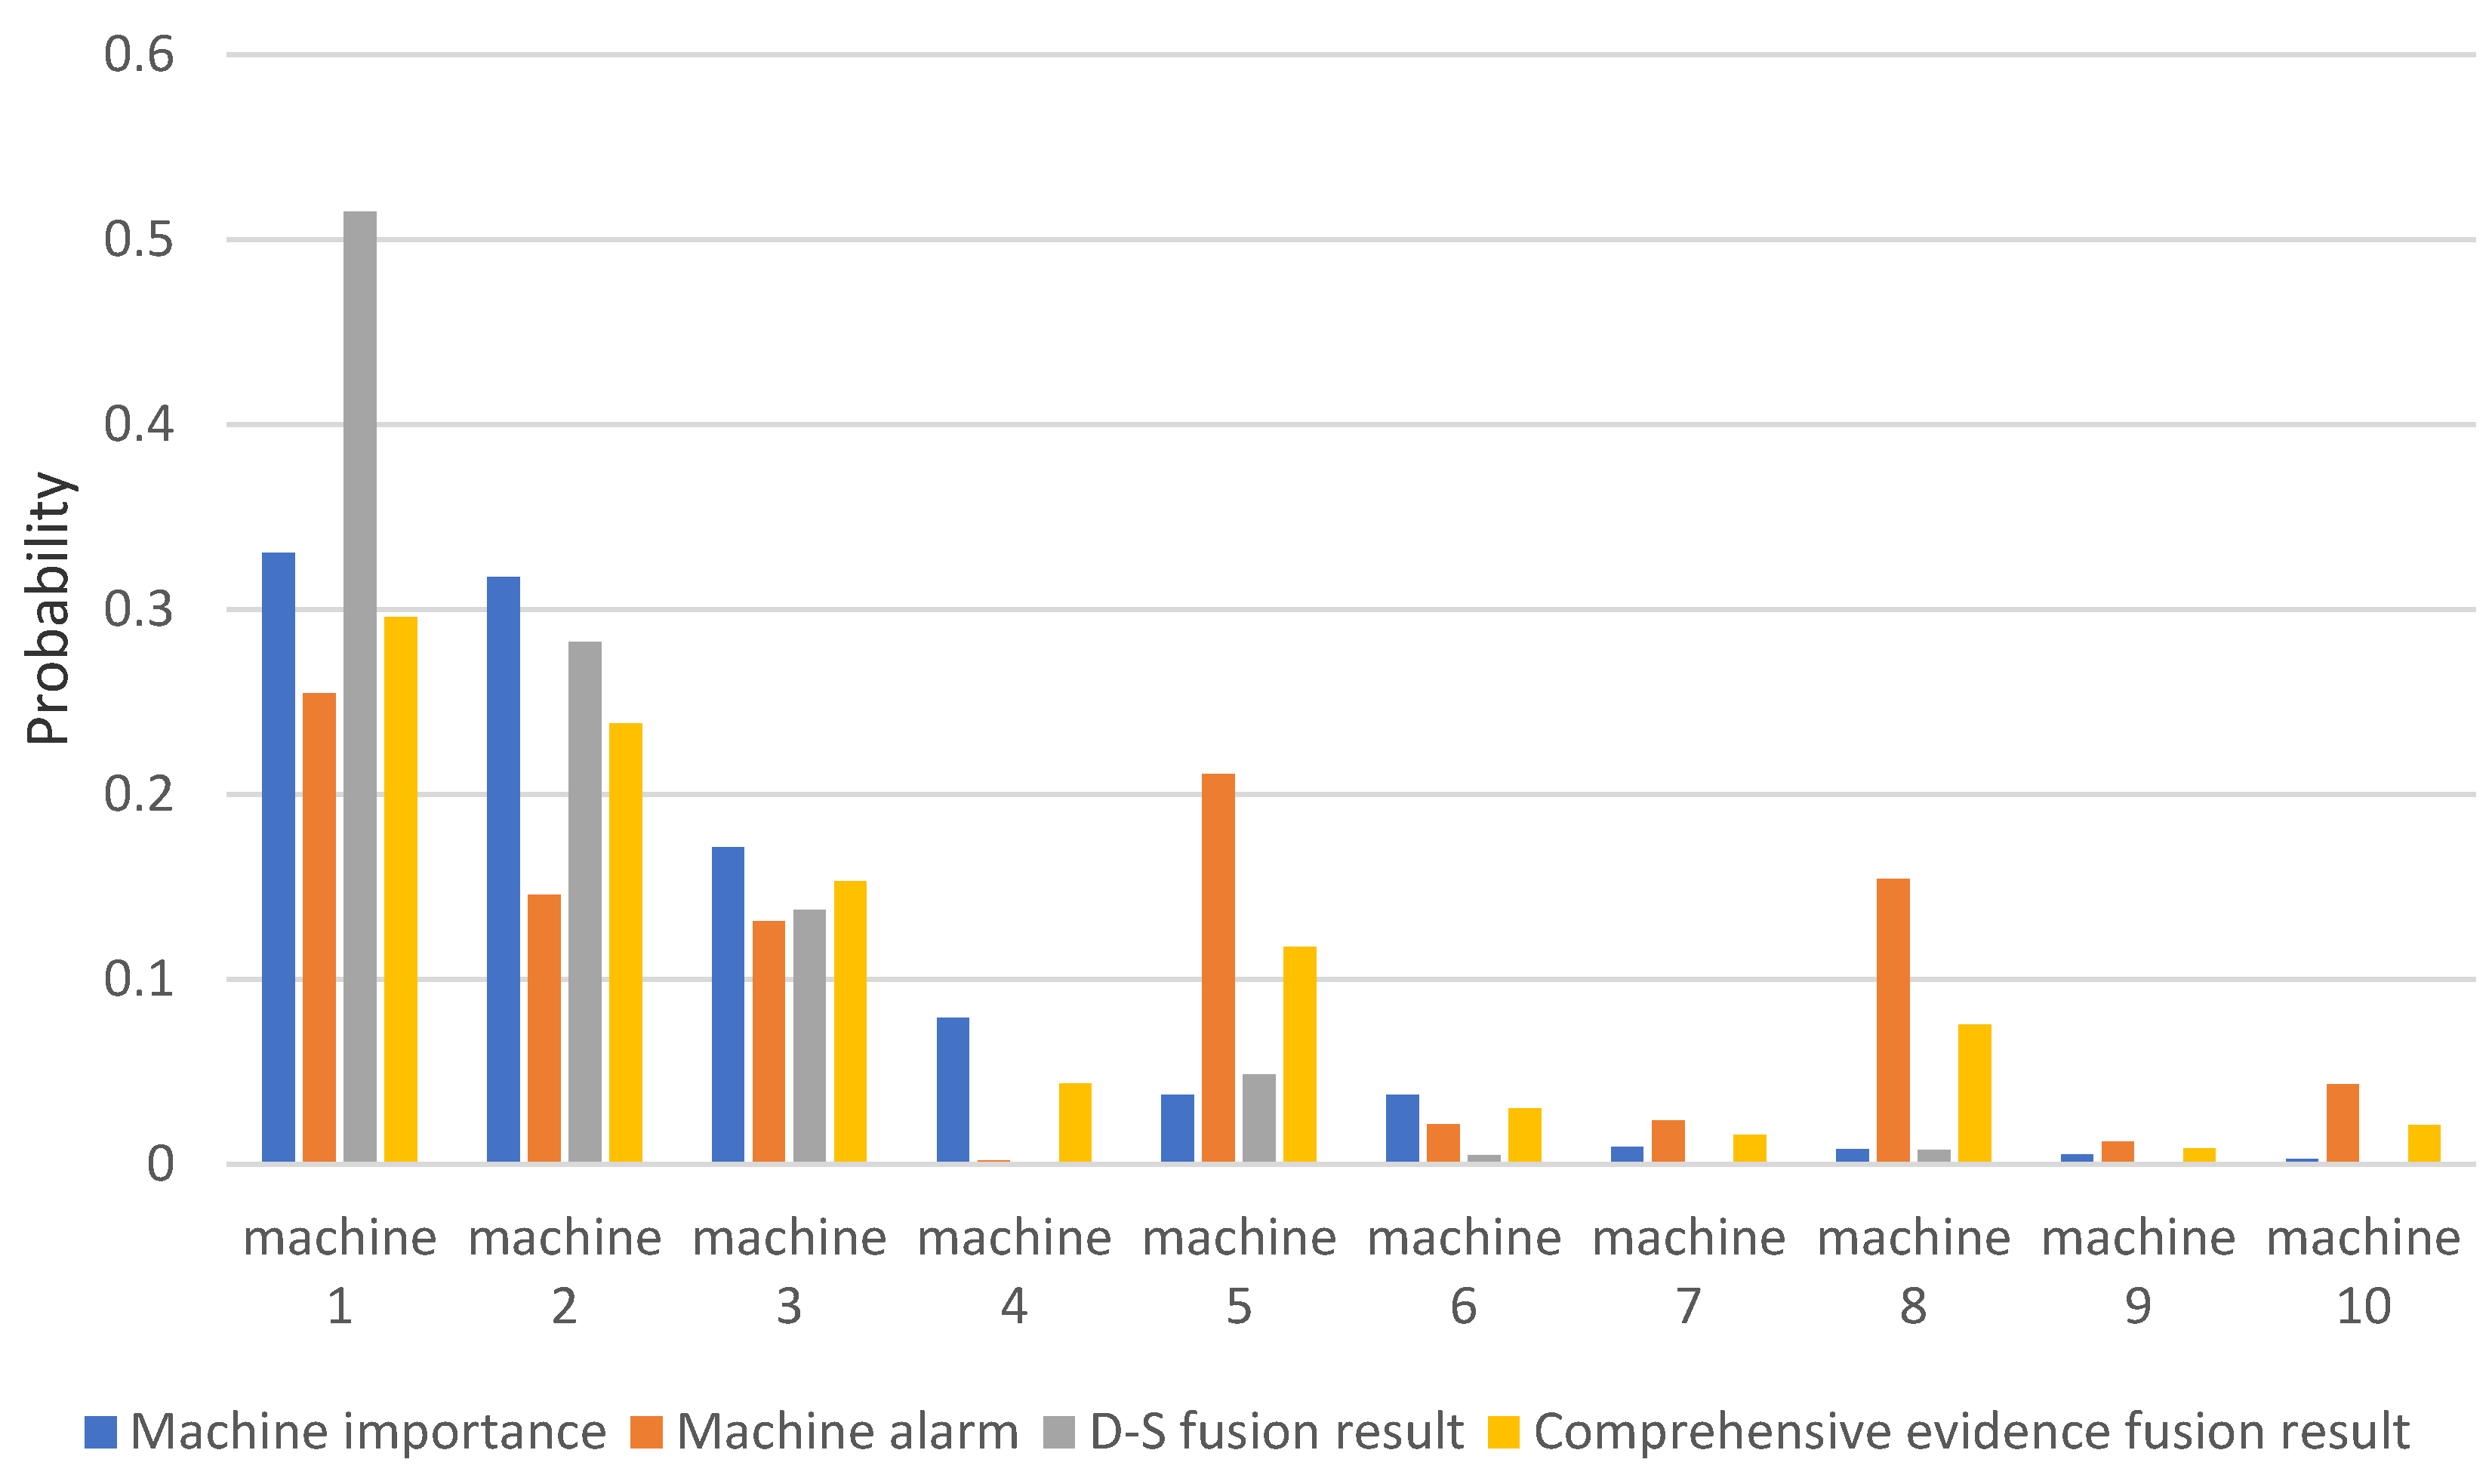
5.3. Suspected Failure Probability Of Machines

According to the comprehensive evidence fusion method proposed in this paper, the suspected failure probability of the comprehensive machine was calculated, as shown in Table 12.
According to the D–S evidence, the suspected failure probability of the machines is shown in Table 13.

5.4. Comparative Analysis

From the perspective of Figure 2, we can see that the first two machines, machine 1 and machine 2, both achieved a large probability in both methods. Therefore, both the D–S evidence and the comprehensive evidence fusion method defined by us could recognize machine 1 and machine 2. However, in the D–S evidence method, there was a great difference between machine 1 and machine 2 with the comprehensive probability values. In absolute terms, the probability of machine 3 was even closer to that of machine 4. For the D–S evidence, the probability value of machine 1 was particularly large. Therefore, from the perspective of maintenance, it will tend to invest more resources on machine 1, which will have an adverse impact on the maintenance of other machines.
Moreover, it can be observed in Figure 2 that the machine alarm probability of machine 5 exceeded 20%, but the probability of machine importance was less than 1%. This contradiction led to the D–S evidence giving a particularly small probability to machine 5. Since there were only two pieces of evidence in this case, the result of using the comprehensive evidence fusion method to calculate the evidence correlation will be that both evidences were 0.5. That is, the importance of the two pieces of evidence cannot be distinguished. Therefore, the comprehensive evidence fusion method tends to guarantee the rationality of the fusion result by means of probability compromise. For the case given in Section 4, the effect of the last piece of evidence was minimized because there were multiple pieces of evidence that contradicted the last piece of evidence. Therefore, it can be seen that our comprehensive evidence fusion method can automatically adjust in the actual calculation, according to the amount of evidence and the contradiction of evidence.
In summary, in this practical case, the comprehensive evidence fusion method overcomes the extreme probability distribution of D–S. Moreover, it fully considers the relationship between multiple evidences.
In Table 14, we also compare our fusion results with those in [49]. First, the sum of the probabilities of the 10 machines in [49] was not 1, but 0.8631. Therefore, we also give the normalization results of [49].
In view of the results of non- normalization, it will lead to a low overall probability, which is not good for intuitive visualization. Additionally, if we look at m a c h i n e   3 , the two probabilities that m a c h i n e   3 needs to fuse are 0.1713 and 0.1315 (see Table 10 and Table 11), respectively. As it is only the fusion of two pieces of evidence, it is impossible to judge the quality of the evidence itself by the correlation between the pieces of evidence, so a reasonable probability result should be between these two probability values. However, the probability given by [49] was 0.1285 (see Table 14), which is lower than the two evidences, which we think is unreasonable.
Considering the results of normalization, there is a similar problem. The two probabilities that observations from m a c h i n e   1 need to fuse were 0.3309 and 0.2547, respectively. The fusion probability results from normalization currently given was 0.3349, which is higher than the two evidences, which is unreasonable.
As we can see from our comprehensive fusion method, as shown in Figure 2, the overall probability sum was normalized, which is good for intuitive visualization. Furthermore, the probability from our fusion method is between the probability values of the two that need to be fused, which is reasonable.

6. Conclusions

This paper compares the advantages and disadvantages of popular information fusion technology in the manufacturing industry, and holds that D–S evidence theory has a broad prospect in manufacturing operation and management. Through the discussion of the shortcomings of D–S evidence theory, an information fusion method was proposed based on D–S evidence theory. Then, through the analysis and comparison of numerical cases, it was verified that the improved method proposed in this paper had a better information fusion effect. Moreover, this paper also applied this method to the real machine operation and maintenance case in the industry, and illustrates the feasibility and practicability of this method through comparative analysis. We noticed that the manufacturing industry is facing the explosive growth of data at present, and manufacturing will also be data driven in the near future. Effective and fast information fusion will be a key work in decision support systems, which deserves to be studied in depth. We also noted that in many industrial cases, information perception exists at different levels of industrial manufacturing and it is difficult to directly integrate. Therefore, information fusion should be carried out at different levels, and it is more necessary to develop corresponding methods to link the analysis results at all levels. Combining the Analytic Hierarchy Process (AHP) with information fusion and improving the interpretability of information will be the focus of future research work.

Author Contributions

All authors contributed equally and significantly in writing this paper. All authors have read and agreed to the published version of the manuscript.

Funding

The author would like to thank the Natural Science Foundation of the Jiangsu Higher Education Institutions of China (Grant Nos. 19KJB460006, 17KJB460011) and the China Postdoctoral Science Foundation (Grant No. 2019M651642) for the funding support to this research.

Acknowledgments

The authors acknowledge Sanjiang University and Nanjing Xiaozhuang University.

Conflicts of Interest

The authors declare no conflict of interest.

References

  1. Mandroli, S.S.; Shrivastava, A.K.; Ding, Y. A survey of inspection strategy and sensor distribution studies in discrete-part manufacturing processes. IIE Trans. 2006, 38, 309–328. [Google Scholar] [CrossRef]
  2. Sun, S.; Lin, H.; Ma, J.; Li, X. Multi-sensor distributed fusion estimation with applications in networked systems: A review paper. Inf. Fusion 2017, 38, 122–134. [Google Scholar] [CrossRef]
  3. Kletti, J. (Ed.) Manufacturing Execution System-MES; Springer Science & Business Media: Berlin/Heidelberg, Germany, 2007. [Google Scholar]
  4. Russell, S.; Norvig, P. Artificial Intelligence: A Modern Approach; Pearson Education Limited: London, UK, 2016. [Google Scholar]
  5. Chen, M.; Mao, S.; Liu, Y. Big data: A survey. Mob. Netw. Appl. 2014, 19, 171–209. [Google Scholar] [CrossRef]
  6. Russom, P. Big data analytics. TDWI Best Practices Report Fourth Quarter 2011, 19, 1–34. [Google Scholar]
  7. Ackson, S.; Brownie, J. AI-based decision support tool for strategic decision making in the factory of the future. Comput. Integr. Manuf. Syst. 1992, 5, 83–90. [Google Scholar] [CrossRef]
  8. Kusiak, A.; Ahn, J. Intelligent scheduling of automated machining systems. Comput. Integr. Manuf. Syst. 1992, 5, 3–14. [Google Scholar] [CrossRef]
  9. Daǧli, C.H. Knowledge-based systems for cutting stock problems. Eur. Ournal Oper. Res. 1990, 44, 160–166. [Google Scholar] [CrossRef]
  10. Confalonieri, M.; Barni, A.; Valente, A.; Cinus, M.; Pedrazzoli, P. An AI based decision support system for preventive maintenance and production optimization in energy intensive manufacturing plants. In Proceedings of the 2015 IEEE International Conference on Engineering, Technology and Innovation/International Technology Management Conference (ICE/ITMC), Belfast, UK, 22–24 June 2015; pp. 1–8. [Google Scholar]
  11. Tang, Y.; Zhou, D.; Xu, S.; He, Z. A Weighted Belief Entropy-Based Uncertainty Measure for Multi-Sensor Data Fusion. Sensors 2017, 17, 928. [Google Scholar] [CrossRef] [Green Version]
  12. Box, G.E.; Tiao, G.C. Bayesian Inference in Statistical Analysis; John Wiley & Sons: Hoboken, NJ, USA, 2011. [Google Scholar]
  13. Takagi, H.; Hayashi, I. NN-driven fuzzy reasoning. Int. Ournal Approx. Reason. 1991, 5, 191–212. [Google Scholar] [CrossRef] [Green Version]
  14. Mizumoto, M.; Zimmermann, H. Comparison of fuzzy reasoning methods. Fuzzy Sets Syst. 1982, 8, 253–283. [Google Scholar] [CrossRef]
  15. Dempster, A.P. Upper and lower probabilities induced by a multivalued mapping. In Classic Works of the Dempster-Shafer Theory of Belief Functions; Springer: Berlin/Heidelberg, Germany, 2008; pp. 57–72. [Google Scholar]
  16. Shafer, G. A Mathematical Theory of Evidence; Princeton University Press: Princeton, NJ, USA, 1976. [Google Scholar]
  17. Barnett, A. Computational methods for a mathematical theory of evidence. In Classic Works of the Dempster-Shafer Theory of Belief Functions; Springer: Berlin/Heidelberg, Germany, 2008; pp. 197–216. [Google Scholar]
  18. Carpenter, G.A.; Martens, S.; Ogas, O. Self-organizing information fusion and hierarchical knowledge discovery: a new framework using ARTMAP neural networks. Neural Netw. 2005, 18, 287–295. [Google Scholar] [CrossRef] [Green Version]
  19. Yuan, T.; Kuo, W. Spatial defect pattern recognition on semiconductor wafers using model-based clustering and Bayesian inference. Eur. Ournal Oper. Res. 2008, 190, 228–240. [Google Scholar] [CrossRef]
  20. Zheng, Y.; Qin, S.; Wang, F. PLS-based similarity analysis for mode identification in multimode manufacturing processes. Ifac-Pap. 2015, 48, 777–782. [Google Scholar] [CrossRef]
  21. Khakifirooz, M.; Chien, C.F.; Chen, Y. Bayesian inference for mining semiconductor manufacturing big data for yield enhancement and smart production to empower industry 4.0. Appl. Soft Comput. 2018, 68, 990–999. [Google Scholar] [CrossRef]
  22. Kozan, E.; Köksoy, O. A bayesian parameter estimation approach to response surface optimization in quality engineering. Sak. Üniversitesi Fen Bilimleri Enstitüsü Derg. 2019, 23, 767–774. [Google Scholar] [CrossRef]
  23. Aminzadeh, M.; Kurfess, T.R. Online quality inspection using Bayesian classification in powder-bed additive manufacturing from high-resolution visual camera images. Ournal Intell. Manuf. 2019, 30, 2505–2523. [Google Scholar] [CrossRef]
  24. Ji, W.; Li, Y.; AbouRizk, S.M. Integrated data-driven approach for analyzing pipe welding operator-quality performance. Autom. Constr. 2019, 106, 102814. [Google Scholar] [CrossRef]
  25. Lin, L.; Lin, C.L. The use of grey-fuzzy logic for the optimization of the manufacturing process. Ournal Mater. Process. Technol. 2005, 160, 9–14. [Google Scholar] [CrossRef]
  26. Scarpelli, H.; Gomide, F. Fuzzy reasoning and fuzzy Petri nets in manufacturing systems modeling. Ournal Intell. Fuzzy Syst. 1993, 1, 225–241. [Google Scholar] [CrossRef]
  27. Liu, N.M.; Horng, T.; Chiang, K.T. The method of grey-fuzzy logic for optimizing multi-response problems during the manufacturing process: a case study of the light guide plate printing process. Int. Ournal Adv. Manuf. Technol. 2009, 41, 200–210. [Google Scholar] [CrossRef]
  28. Zhou, X.; Peng, T. Application of multi-sensor fuzzy information fusion algorithm in industrial safety monitoring system. Saf. Sci. 2020, 122, 104531. [Google Scholar] [CrossRef]
  29. Seiti, H.; Hafezalkotob, A.; Martinez, L. R-sets, Comprehensive Fuzzy Sets Risk Modeling for Risk-based Information Fusion and Decision-making. IEEE Trans. Fuzzy Syst. 2019. [Google Scholar] [CrossRef]
  30. Yuqin, J.; Peixia, W.; Yue, L. Study of manufacturing system based on neural network multi-sensor data fusion and its application. In Proceedings of the IEEE International Conference on Robotics, Intelligent Systems and Signal Processing, Changsha, China, 8–13 October 2003; Volume 2, pp. 1022–1026. [Google Scholar]
  31. Goebel, K.; Badami, V.; Perera, A. Diagnostic information fusion for manufacturing processes. In Proceedings of the Second International Conference on Information Fusion, Sunnyvale, CA, USA; 1999; Volume 99, pp. 331–336. [Google Scholar]
  32. Chen, S.L.; Jen, Y.W. Data fusion neural network for tool condition monitoring in CNC milling machining. Int. J. Mach. Tools Manuf. 2000, 40, 381–400. [Google Scholar] [CrossRef]
  33. Li, Y.; Xiao, Z.; Zhen, X.; Cao, X. Attentional information fusion networks for cross-scene power line detection. Ieee Geosci. Remote Sens. Lett. 2019, 16, 1635–1639. [Google Scholar] [CrossRef]
  34. Liu, Y.; Wang, Z.; Ma, L.; Alsaadi, F.E. A partial-nodes-based information fusion approach to state estimation for discrete-time delayed stochastic complex networks. Inf. Fusion 2019, 49, 240–248. [Google Scholar] [CrossRef]
  35. Jian, X.; Li, W.; Guo, X.; Wang, R. Fault diagnosis of motor bearings based on a one-dimensional fusion neural network. Sensors 2019, 19, 122. [Google Scholar] [CrossRef] [Green Version]
  36. Yuan, K.; Xiao, F.; Fei, L.; Kang, B.; Deng, Y. Modeling Sensor Reliability in Fault Diagnosis Based on Evidence Theory. Sensors 2016, 16, 113. [Google Scholar] [CrossRef] [Green Version]
  37. Gong, Y.; Su, X.; Qian, H.; Yang, N. Research on fault diagnosis methods for the reactor coolant system of nuclear power plant based on DS evidence theory. Ann. Nucl. Energy 2018, 112, 395–399. [Google Scholar] [CrossRef]
  38. Qingdong, D.; Lingyu, X.; Hai, Z. DS evidence theory applied to fault diagnosis of generator based on embedded sensors. In Proceedings of the Third International Conference on Information Fusion, Paris, France, 10–13 July 2000; Volume 1. [Google Scholar]
  39. Ghorabaee, M.K.; Zavadskas, E.K.; Amiri, M.; Antucheviciene, J. A New Method of Assessment Based On Fuzzy Ranking and Aggregated Weights (Afraw) For Mcdm Problems Under Type-2 Fuzzy Environment. Econ. Comput. Econ. Cybern. Stud. Res. 2017, 50, 39–68. [Google Scholar]
  40. Wang, H.; Lin, D.; Qiu, J.; Ao, L.; Du, Z.; He, B. Research on multiobjective group decision-making in condition-based maintenance for transmission and transformation equipment based on DS evidence theory. IEEE Trans. Smart Grid 2015, 6, 1035–1045. [Google Scholar] [CrossRef]
  41. Zhang, Z. Data Fusion Optimization Analysis of Wireless Sensor Networks Based on oint DS Evidence Theory and Matrix Analysis. In Proceedings of the2019 4th International Conference on Mechanical, Control and Computer Engineering (ICMCCE), Hohhot, China, 24–26 October 2019; pp. 689–6894. [Google Scholar]
  42. Shi, J.; Luo, L.; Fan, C. Research on Fusion Method of Fault Diagnosis Based on DBN and Correlation Model for Optimized DS Evidence Theory. In Proceedings of the 2019 Prognostics and System Health Management Conference (PHM-Paris), Paris, France, 2–5 May 2019; pp. 356–361. [Google Scholar]
  43. Jiang, S.; Lian, M.; Lu, C.; Ruan, S.; Wang, Z.; Chen, B. SVM-DS fusion based soft fault detection and diagnosis in solar water heaters. Energy Explor. Exploit. 2019, 37, 1125–1146. [Google Scholar] [CrossRef]
  44. Tang, X.; Gu, X.; Wang, J.; He, Q.; Zhang, F.; Lu, J. A Bearing Fault Diagnosis Method Based On Feature Selection Feedback Network and Improved DS Evidence Fusion. IEEE Access. 2020. [Google Scholar] [CrossRef]
  45. Su, X.; Mahadevan, S.; Xu, P.; Deng, Y. Handling of dependence in Dempster–Shafer theory. Int. Ournal Intell. Syst. 2015, 30, 441–467. [Google Scholar] [CrossRef]
  46. Zadeh, L.A. Review of A Mathematical Theory of Evidence. Ai Mag. 1984, 5, 235–247. [Google Scholar]
  47. Wehrl, A. General properties of entropy. Rev. Mod. Phys. 1978, 50, 221. [Google Scholar] [CrossRef]
  48. Gray, R.M. Entropy and Information Theory; Springer Science & Business Media: Berlin/Heidelberg, Germany, 2011. [Google Scholar]
  49. Sun, Z.H.; Liu, R.; Ming, X. A Fault Diagnosis and Maintenance Decision System for Production Line Based on Human-machine Multi-Information Fusion. In Proceedings of the 2018 Artificial Intelligence and Cloud Computing Conference, Tokyo, Japan, 21–23 December 2018; pp. 151–156. [Google Scholar] [CrossRef]
Figure 1. Comparison of four fusion results based on D–S evidence.
Symmetry 12 00375 g001
Figure 2. Probability comparison before and after information fusion.
Symmetry 12 00375 g002
Table 1. Comparison of different information fusion methods.
Fusion MethodsAdvantageDisadvantageMain Application Scenarios
Bayesian inferencesSimple calculation rules and fast calculation speed.This method should be based on the accurate prior probability.
  • quality control and pattern recognition [19,20,21,22,23,24].
fuzzy reasoningInformation processing is closer to people’s thinking with strong explanatory ability.There are a lot of subjective factors in design of reasoning rule and the standards are not unified.
  • manufacturing process plan and optimization [25,26,27,28,29].
Neural networkHigh data utilization and high accuracy.Poor interpretability and high computational complexity.
D–S evidenceSuitable for the fusion of multi-source information with strong explanatory ability and flexible fusion mode.The serious conflict between evidences is hard to resolve.
Table 2. Zadeh’s Paradox.
Witness 1Witness 2Fusion Result
A0.990.000.00
B0.010.011.00
C0.000.990.00
Table 3. Impact of reliability on evidence.
Witness 1Witness 2
A0.600.60
B0.400.20
C0.000.20
Table 4. Impact of evidence correlation on evidence.
Witness 1Witness 2Witness 3Witness 4D–S Fusion Result
A0.900.950.950.000.00
B0.090.040.030.030.63
C0.010.010.020.970.37
Table 5. Entropy of each evidence.
E 1 E 2 E 3 E 4
0.15530.09710.10080.0585
Table 6. Reliability weight of each evidence.
ω 1 ω 2 ω 3 ω 4
0.20760.25470.25170.2860
Table 7. Consistency weight of each evidence.
ω 1 ω 2 ω 3 ω 4
0.27340.25380.47230.005
Table 8. The calculation results of the three groups of reference evidence.
Reference Evidence A B C
r E 0.66800.04500.2870
r C 0.93620.04900.0148
r 0.93810.04690.0150
Table 9. Comprehensive evidence fusion results.
Evidence Fusion Result A B C
D S 0.00000.62550.3745
D S r E 0.66800.04500.2870
D S r C 0.93620.04900.0148
D S r 0.93810.04690.0150
Table 10. The suspected failure probability of 10 machines derived from machine importance [49].
Machine _ OrderProbability Machine _ OrderProbability
1 0.3309 6 0.0376
2 0.3176 7 0.0092
3 0.1713 8 0.0083
4 0.0793 9 0.0054
5 0.0376 10 0.0027
Table 11. The suspected failure probability of machines derived from the machine alarm [49].
Machine _ OrderProbability Machine _ OrderProbability
1 0.2547 6 0.0217
2 0.1456 7 0.0235
3 0.1315 8 0.1543
4 0.0021 9 0.0122
5 0.2111 10 0.0433
Table 12. The suspected failure probability of machines derived from the comprehensive evidence fusion method.
Machine _ OrderProbability Machine _ OrderProbability
1 0.2958 6 0.0303
2 0.2385 7 0.0158
3 0.1530 8 0.0755
4 0.0438 9 0.0085
5 0.1175 10 0.0214
Table 13. The suspected failure probability of machines derived from D–S evidence method.
Machine _ OrderProbability Machine _ OrderProbability
1 0.5149 6 0.005
2 0.2826 7 0.001
3 0.1377 8 0.008
4 0.0010 9 0.000
5 0.0486 10 0.000
Table 14. Fusion result comparison with [49].
Machine _ OrderComprehensive Evidence FusionResult From [49]Normalization Result Form [49]
1 0.33490.28900.3349
2 0.24130.20830.2413
3 0.14880.12850.1488
4 0.03320.02860.0332
5 0.11000.09500.1100
6 0.02500.02160.0250
7 0.01350.01160.0135
8 0.06740.05820.0674
9 0.00720.00620.0072
10 0.01870.01620.0187

