Abstract
The design and development of a compact square-wave pulse generator for the electroporation of biological cells is presented. This electroporator can generate square-wave pulses with durations from 3 μs up to 10 ms, voltage amplitudes up to 3500 V, and currents up to 250 A. The quantity of the accumulated energy is optimized by means of a variable capacitor bank. The pulse forming unit design uses a crowbar circuit, which gives better control of the pulse form and its duration, independent of the load impedance. In such cases, the square-wave pulse form ensures better control of electroporation efficiency by choosing parameters determined in advance. The device has an integrated graphic LCD screen and measurement modules for the visualization of the current pulse, allowing for express control of the electroporation quality and does not require an external oscilloscope for current pulse recording. This electroporator was tested on suspensions of Saccharomyces cerevisiae yeast cells, during which, it was demonstrated that the application of such square-wave pulses ensured better control of the electroporation efficiency and cell viability after treatment using the pulsed electric field (PEF).
1. Introduction
The use of electroporation in biotechnology and medicine has led to new methods of food pretreatment, gene therapy, drug delivery, and cancer treatment [1,2,3,4,5]. The efficiency of electroporation and its applications strongly depends on the parameters of the pulsed electric field (PEF), namely its amplitude, duration, repetition frequency, number of pulses, and pulse waveforms. Electrical pulses with durations ranging from 10 ns up to 1000 ns are usually used to affect intracellular structures or to create a large number of small pores in the cell plasma membranes [6,7]. Pulses with a microsecond duration (1–1000 μs) are able to induce a non-thermal, irreversible permeabilization of various cells [1,8], while long pulses, having durations of several milliseconds, can enhance the transfer of large charged molecules (proteins, DNA, RNA) into the cells [9].
Two types of devices are usually used for biological cell electroporation. Those used in industrial facilities for the treatment of large amounts of biomass [10,11,12,13,14,15] have fixed parameters of the electrical pulses and multi-purpose setups with variable pulse parameters for the investigation of the electroporation process [16,17,18,19,20,21]. In the latter case, it is preferable that the electroporator would be able to generate pulses with the widest possible range of amplitudes and durations.
Electropermeabilization appears when the electric field exceeds the threshold value of the transmembrane voltage, above which the formation of pores in cells becomes energetically favorable [22]. Moreover, the time during which the pulse amplitude remains higher than this threshold value has a major role in the efficiency of the electropermeabilization [23]. It is therefore very important during such experiments to know the exact pulse amplitudes, waveforms, and durations. The best solution is to use square-wave pulses [24], since in such cases, it is easier to estimate the energetic and time evolution characteristics of the electroporation process. Electroporation setups using square-waveform electrical pulses are usually based on electrical circuits, which exploit a capacitor discharge by means of a high-power switch. For the generation of nanosecond duration pulses, the capacitor can be a coaxial cable [18] or a micro-strip line configuration [16]. The discharge of this capacitor is realized using a mercury-wetted reed relay [25], a spark-gap switch [26], or fast metal-oxide-semiconductor field-effect transistors (MOSFETs) [27]. Electroporators generating longer pulses, whose durations range from μs to ms, do this by means of electronic circuits containing high-power switch units based on reed relays [28], insulated-gate bipolar transistors (IGBTs) [29], or MOSFET transistors [30]. Most of these setups, however, are state-of-the-art laboratory arrangements, which require specific knowledge and adequate experience on the part of the operator. For this reason, several modifications of compact electroporators that generate square waveform pulses have been designed and can be purchased on the market [31,32].
Most of the commercial devices used for electroporation have maximal operating voltages of up to 3 kV [33]. In order to avoid large energy storage, they can operate within two discrete ranges: low-voltage long pulses (up to 500 V) or high-voltage short pulses (up to 3000 V). Unfortunately, the separation of the voltage range cannot prevent the storage of enormous amounts of energy in their capacitor banks and thus devices with more controlled energy output are required.
The application of fast and powerful MOSFETs or IGBT transistors for connecting and disconnecting the charged capacitor to the load in these devices makes it possible to generate pulses with short rise times (less than 0.1 μs). However, after the switch-off of these transistors, a current tail occurs in low-current applications, thus the fall time, and consequently the total pulse duration, cannot be strictly determined and are dependent on the load resistance. This phenomenon is very important when the cells are exposed to pulses of microsecond duration because the pulse waveforms can have a significant impact on the cell viability [23]. The value of the load, which depends on the geometry of the cuvette used for electroporation and electrical conductivity of the cell material mixture with the buffer solution, can range from several tens of ohms to a few kΩ. This means that for a wide range of material applications, the pulse generation circuit needs to be designed such that the generated pulse waveform would be as insensitive as possible to the load value. Moreover, as it was noted in Cukjati et al. [34], it is necessary to control the electric-pulse-induced load resistance changes in real time due to electrical breakdown or Joule heating, making it possible to perform an accurate and safe electroporation process. One of the options for providing continuous quality monitoring of the electroporation process is the visualization of the current pulse shape. This allows for the evaluation of the amplitude, duration, and rise and fall times, as well as the peculiarities of each pulse. To our best knowledge, only one company produces electroporators with a waveform display [35]. Most of them only have an output to an oscilloscope, which is a drawback of most commercially available electroporators.
The main task of this study was to design an easy to use, compact electroporator generating square waveform pulses with a wide range of duration and amplitudes, which could be applicable for different loads (different conductivity of the investigated cell medium), and would be equipped with a simple real-time indicator showing the waveform of the current pulse in the load of the electroporator circuit during the electroporation process.
2. Design of the Generator for Cell Electroporation
In order to develop a universal pulsed power device for the electroporation of biological cells, the required parameters for the output of the device were first determined. The selection of these parameters was influenced by the biological processes that are induced in the biological objects. Therefore, the range of amplitude and duration, repetition frequency, and other output pulse parameters were selected in terms of their applicability in such experiments.
As has already been mentioned above, the microsecond pulse duration range (from 1 μs to 1 ms) is the one that is most widely used for electroporation. Therefore, our aim was to develop a device that could generate pulses with durations from microseconds to milliseconds and would cover a wide range of electric field amplitudes. High-energy pulses cause Joule heating, which takes place due to the high current flow through the investigated substance. Therefore, the pulse duration, voltage drop during the pulse, and the flowing current needed to be optimal as well. Based on these assumptions, the following parameters were selected: maximal pulsed current: 250 A, voltage amplitude: up to 3.5 kV, pulse duration: from 3 μs to 10 ms, and shape of the pulse: square-wave.
2.1. Structure of the Electric Pulse Generator
The concept of the generation of square-wave electrical pulses is based on the connection of the load to the charged capacitor for the limited time representing the pulse width. The basic parameters of such square-wave pulses are the following: the pulse amplitude, the voltage drop during the pulse, the pulse duration, and the rise and fall times of the pulse. A simplified block diagram of the proposed square-wave pulse generator is presented in Figure 1. It consists of the high-power, control, load, and pulse-measuring units. The high-power unit includes the high-voltage (HV) supply, energy storage, and pulse-forming units.
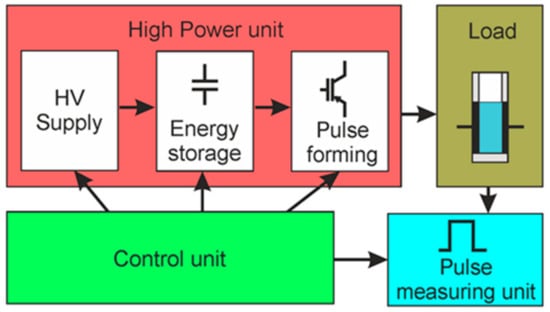
Figure 1.
Simplified block diagram of the square-wave pulse generator. HV: High-voltage.
A more detailed block diagram of the generator is shown in Figure 2. Each part of the proposed device described in more detail below.
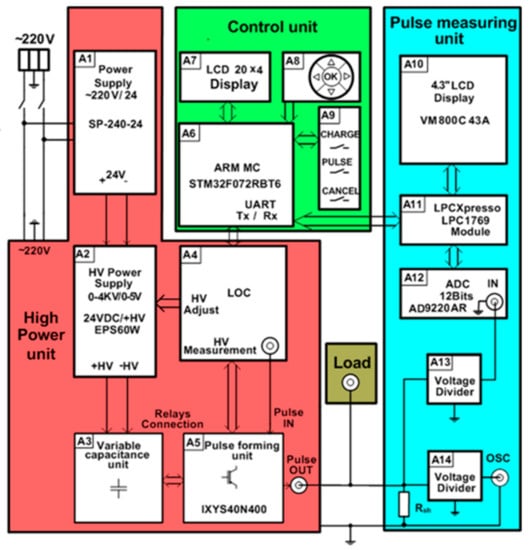
Figure 2.
Block diagram of the pulse generator for cell electroporation. LOC: Linear optocoupler.
2.1.1. The High-Power Unit
The HV supply of the high-power unit consists of AC/DC 220/24 V (model SP-240-24) (A1) and the variable DC/DC 24/4000 V (model ISEG EPX40406) (A2) supply sources (see Figure 2). The output voltage and the current of the variable power supply A2 is controlled using the 0–5 V analog signal of the microcontroller, corresponding to a 0–3.5 kV output.
One of the most important parts of the high-power unit is the energy storage unit. It consists (see Figure 2) of the variable capacitance unit, including capacitor banks with commutation relays (A3), which are controlled by the microcontroller (A6 from the control unit) through the linear optocoupler (LOC) (A4). The capacitors in this generator are used for energy storage because the power of the pulse to be generated is much higher than the power of the HV supply source. However, the use of a single capacitor in order to meet all requirements for the high-voltage and long-duration pulses is not suitable for safety reasons. A possible solution is to divide the whole operation range of the electroporator into separate operation ranges and to define the limits of the maximal energy for each range [29]. Therefore, the capacitor banks in the proposed generator are designed as units of variable capacitance. Moreover, this configuration helps to avoid the undesired Joule heating of the cell suspensions being investigated. The amount of heat dissipating in the cuvette is proportional to the voltage across the cuvette, the current through the medium with the cells, and the pulse duration. During the development of the device, it was specified that the temperature of the cell medium during the pulse could not increase more than 3 °C, and the maximal drop of voltage across the cuvette during the pulse needed to be limited to 10% of the pulse amplitude. The calculations of the maximal pulse duration tmax satisfying the mentioned conditions were performed for a 50 μL cuvette filled with biological medium with a characteristic impedance of 90 Ω.
Based on the calculation results, it was decided that two types of capacitors with different operating voltages and different capacitances were to be used: four high-voltage capacitors CHV = 52 μF × 1400 V and four low-voltage capacitors CLV = 1000 μF × 450 V. The switching of the capacitors in parallel and/or in series allows for coverage of all the ranges of the pulse widths and operating voltages that were determined in advance according to the required conditions.
A detailed circuit of the variable capacitance unit is shown in Figure 3. The switching of the capacitors is implemented by using three high voltage relays. A low-power transistor (BT1–BT3) driven by a respective microcontroller port pin results in a three-transistor/relay structure and controls each relay. The opening of these transistors allows for the coverage of all the capacitor commutation variations required for the setup. Four possible connections are realized: range 1—two by two capacitors CLV connected in series (C5 and C6, and C7 and C8), and then interconnected in parallel; range 2—four capacitors CLV (C5–C8) are connected in series; range 3—two by two capacitors CHV (C1 and C2, and C3 and C4) are connected in series and then interconnected in parallel; and range 4—four capacitors CHV (C1–C4) are connected in series. The total capacitance and the maximal operating voltage of the energy storage unit for the different connection configurations (ranges) is presented in Table 1.
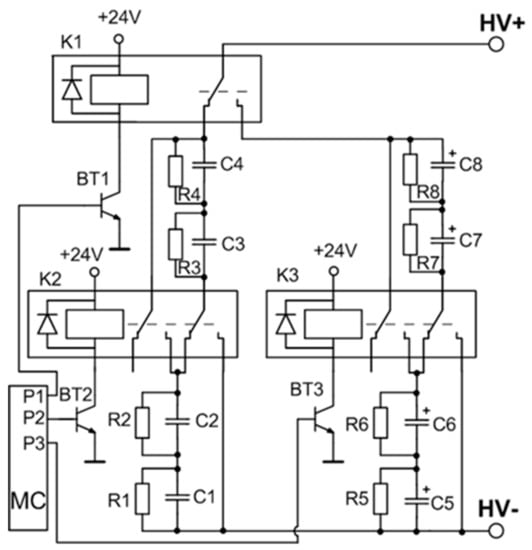
Figure 3.
Variable capacitance unit. MC: Microcontroller.

Table 1.
Main parameters of the operating ranges of the variable capacitance unit.
Furthermore, the maximum possible pulse duration tmax during which the voltage drop across the load will be lower than 10% is given. These calculations for the different capacitor configurations were performed for a total resistance of 150 Ω after taking into account the load resistance of 90 Ω and the internal (ballast) resistance of the device (R = 2 × 30 Ω). For other loads, the dependences of the maximum voltage on the pulse duration need to be recalculated. Thus, by dividing the operation range into four ranges, this meets the requirements and allows for the coverage of many areas of presently known biological applications.
Another very important part of the high-power unit of the proposed electroporator is the pulse-forming unit (see A5 in Figure 2). As was mentioned above, the main problem with the electronic switches, such as the MOSFETs or IGBTs, is the inability to turn them off in a sufficiently short time in order to get a square-shaped pulse.
This problem appears due to the minority carriers of these transistors, which contribute to an internal recombination current called the tail current. One of the possibilities is to cut off this current using a crowbar circuit to produce a sharp fall time for the generated pulse. The simplified circuit of this pulse-forming unit with corresponding control and output waveforms is presented in Figure 4. It consists of the main switch VT1 and crowbar switch VT2 transistors, which are controlled by the same microcontroller (see A6 in Figure 2) through a high-speed optically decoupled driver LOC110 (IXYS). The VT1 switch is employed to connect and then disconnect the load to the charged capacitor and thus to form the square-wave pulse. The controlled crowbar circuit, which is synchronized with the VT1, was implemented to achieve a short pulse fall time independent of the load. The insulated-gate bipolar transistors (model IXYS40N400) and snubber diodes are used for both switches. This transistor model has a high collector–emitter operating voltage up to 4000 V and the maximal allowed collector current in a pulsed regime up to 400 A. The RDCD snubbers are placed across each of these transistors to protect them against damage. They reduce the peak voltage of the turned-off transistors and the power dissipation in the turned-on state. Additionally, the non-inductive capacitor CB is included in the pulse-forming circuit to compensate for the parasitic inductance in the high-power circuit. The main principle of the forming pulse with a short fall time is based on the use of a crowbar circuit: The transistor VT2 is turned on just before the time (see Figure 4) at which the main transistor VT1 is turned off. Such a solution allows for the shortening of the circuit of the load and thus to discharge the remaining electrical charge through the crowbar circuit. This switcher gives the possibility of always having the same fall time of the pulse, independent of the impedance of the load. Such a system allows for the precise generation and evaluation of the pulse in biological loads with highly variable conductivity, thus providing greater control over the treatment procedures and their reproducibility.
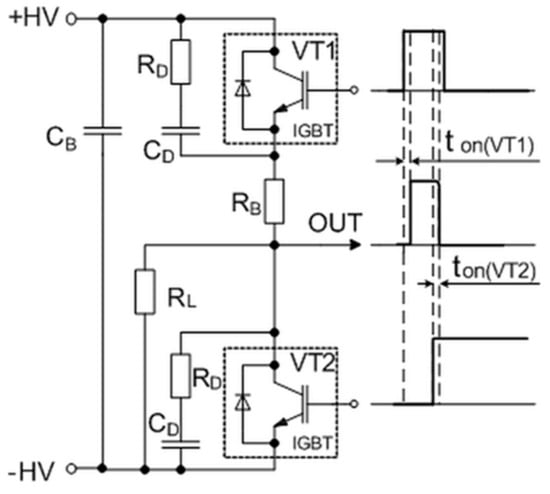
Figure 4.
The simplified circuit of the pulse-forming unit with corresponding control and output waveforms. Here, ton(VT1) and ton(VT2) are the delay times between the control pulses of transistors VT1 and VT2 and the rising and falling edges of the output pulses, respectively. IGBT: Insulated-gate bipolar transistor.
2.1.2. Control Unit
The main part of the control unit is the ARM STM32F072RBT6 microcontroller (A6 in Figure 2). It controls the charging voltage and the connection of the capacitors, forms the control pulse (pulse duration and number of pulses) for the switchers VT1 and VT2, and controls the measuring of the output current of the load. The input parameters of the pulse (voltage, pulse duration, and number of pulses) are set by means of the group of five buttons in block A8. All the set parameters are displayed on the liquid crystal display (LCD) display A7.
2.1.3. Pulse-Measuring Unit
For the visualization of the electric pulse, it was decided to image the current pulse though the load. Compared with the voltage value across the load, this current pulse visualization gives more information about the load resistance, the current through the load, the voltage drop across the load, and the different events that can appear during electroporation (spark, electrical short circuit, liquid evaporation, and others). For this purpose, the voltage drops across the shunt connected in series with the load are measured. The unit that measures and displays the current pulse on the screen includes the precision shunt Rsh = 0.1 Ω, the voltage divider (A13), the 12-bit 10 MSps analog-to-digital converter (ADC) (model AD9220AR) (A12), the LPCXpresso 1769 module (A11) for the storage of the measured signal, and the 4.3” VM800C43A LC graphic display (A10) (see Figure 2). The LPCXpresso module has an ARM microcontroller, which controls the analog–digital converter and the graphic display. For a more precise measurement of the signals, a BNC connector is provided, allowing for a connection to an external oscilloscope. The divider A14 is used for this purpose.
2.2. Operation of the Pulse Generator
The operation of the system can be divided into three stages: (1) the input of the pulse parameters, (2) the pulse generation, and (3) the pulse visualization. During the first stage, the microcontroller A6 (see Figure 2) monitors the input and updates the parameters on the LCD screen A7 (see also left screen in Figure 5). The entry and exit of this stage are carried out by pushing the button “OK” in block A8. There are five main parameters that can be altered: the voltage range, the charging voltage, the pulse width, the number of pulses, and the repetition frequency of the pulses. By default, the capacitors’ relay commutation is based on the continuous check of the two input parameters, namely the voltage and the pulse width, with the voltage being given a higher priority. Therefore, based on the voltage setting entered by the user, the microcontroller identifies the connection of the applicable capacitors, followed by a check of the pulse width that is being used to select the optimal operation range calculated for the load of 90 Ω. This ensures that the decrease of the pulse amplitude during the pulse will be no more than 10% for the selected pulses. The system can be easily reprogrammed for applications with different loads. In addition, the microcontroller checks the capacitor charge level before switching the ranges and the change of ranges occurs only after the capacitors have been discharged to a safe level. This prevents distortion of the relays and capacitors due to high current flow during switching.
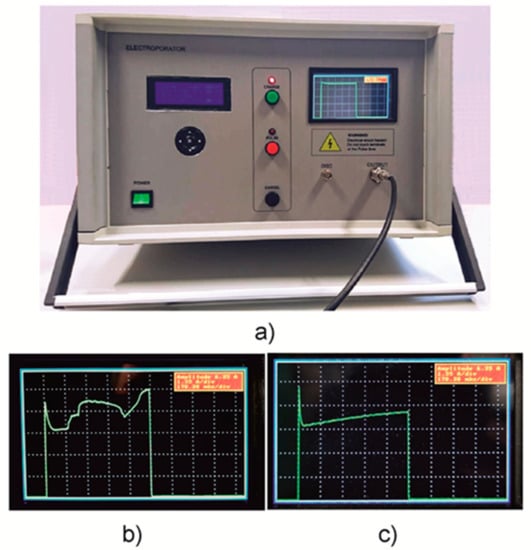
Figure 5.
(a) A photograph of the developed compact square-wave generator for electroporation of biological cells. (b,c) Pictures of the display showing when the sparking in the cuvette takes place (b) and when the current during the pulse increases due to heating of the substance in the cuvette (c).
When the main parameters are set, the capacitors can be charged by pushing the “Charge” button from group A9. Starting at this moment, the system is set to the pulse generation stage. Microcontroller A6, through the optical driver A4, gives the command to the HV power supply A2, which starts to charge the capacitors’ connection inside block A3. During this process, the voltage of the capacitors is monitored in real time in the LCD display A7. This stage is also highlighted by the blinking of the red photodiode until the capacitors are charged up to the set voltage. After the capacitors are charged, the pushing of the button “Pulse” starts the discharge of the capacitors through the load. During this time, the microcontroller sends a command to the driver of transistor VT1 and opens it. Before the end of the pulse (the “turn off” of transistor VT1), the microcontroller sends a command to transistor VT2 and turns it on to create a second path for the high current flow through the crowbar circuit. As a result, the fall time of the pulse is shortened and is dependent only on the type of switches that are used and the parasitic parameters of the circuit. Without the synchronized crowbar circuit, the characteristic tail that depends on the load would appear.
Moreover, when the system is in the pulse generation stage, the ADC A12 in the pulse measuring and imaging unit enters the waiting state, in which the data (voltage drop across the shunt) are being constantly recorded to the buffer until the trigger signal initiates the start of the measurement. After pushing the button “Pulse,” the microcontroller A6, through the universal asynchronous receiver-transmiter (UART) protocol, starts to communicate with this ADC and triggers it. After the signal is sampled, it is stored in the memory of the LPCXpresso module A11 and then is imaged onto the LCD A10. At this time, the system is switched to the visualization stage, and after the end of the pulse generation, the measured current pulse is imaged on the LCD A10. For a better visualization of the pulse, the scale of the current (Y scale) on the LCD is adjusted automatically to show the full amplitude of the pulse. The time scale (X scale) is set during the data input mode. The values of the current and time scales are also shown on the display. After visualization, the system goes back into the pulse generation stage and waits for the next command from the user.
2.3. Safety Considerations
The nodes and individual parts of this device are protected against over-current and over-voltage. The variable high voltage power supply ISEG EPX40406 has this inner current limitation. Therefore, it is connected directly to the capacitor array without limiting resistors. In order to establish the precise control of the electroporation unit, accurate and safe pulse parameter choice selections are required for each operation mode. Therefore, multiple limitations are implemented in the software design and in the hardware. Parameters, such as the maximum charging voltage, the maximum pulse length, and the number of pulses, are limited for each capacitor connection for efficient and safe power accumulation. To avoid voltage breakdowns that may occur during relay switching, the switching of the relays is synchronized with the high-voltage power supply. A separate interrupt event has been implemented in the software for the expectation of a change of an operation mode, which shuts the high-voltage source down. When the user changes the operation mode, the power supply is turned off, and after confirming the status, the relay is switched. Such implementation ensures the safe commutation of the capacitors, thus preventing any voltage breakdowns during the operation mode selection. Furthermore, the priority order of the microcontroller tasks during pulsing are clearly specified in order to avoid errors and delays in the task management. The charged high-voltage capacitors are potentially dangerous. If for some reason they become disconnected after charging, they can hold a lethal charge for a long time. In order to eliminate this possibility, bleeder resistors are connected across the terminals of the capacitors (10 MΩ resistors are connected to CHV and 100 kΩ to CLV). Such a configuration ensures the constant discharge of the capacitors, even when disconnected from the pulsing circuit. Moreover, these resistors ensure a uniform voltage distribution across these capacitors and protect these capacitors against over-voltage. In addition, the device has a forced capacitor discharge regime, where discharge takes place through the discharge circuit. The “Cancel” button is used for this purpose. The switchers are also protected against turn-off over-voltage and over-current. The snubber diode connected in parallel to the transistor protects it against a turn-off opposite voltage, which can appear due to an inductive load. Moreover, two ballast resistors of 30 Ω are connected in series with the cuvette for the limitation of the current flow though the transistors in case an electrical short circuit occurs in the cuvette.
2.4. Design of the Device
A photo of the developed electroporation system is presented in Figure 5a. The designed generator was placed into a 43 × 35 × 25 cm3 plastic case. For ease of use, the front panel of the device was visually divided into three parts corresponding to the three stages of the device operation: the parameter input (left), the pulse generation (middle), and the pulse visualization (right). The input of the pulse parameters of the system is performed via a group of five buttons and the LCD on the left side of the device.
The pulse generation is performed via three buttons in the middle of the device. In addition, this stage of operation is also highlighted by the red photodiode. The LCD is placed on the right side and provides pulse visualization and information. Furthermore, a high-voltage output connector for the load (cuvette with treated substance) and a BNC connector for an external oscilloscope are shown. The current pulse visualization on the display of the device allows for better control of the electroporation process. As an example, two images of the device screen are shown in Figure 5b,c. The first (b) shows the case when some sparking takes place in the cuvette during the experiment. Therefore, one can see the current jumping on the screen. The second picture (c) shows the gradual increase of the current caused by the heating of the contents of the cuvette or the chemical processes in the liquid.
3. Results and Discussion
First, the influence of the operating ranges on the shape of the electric pulse was tested. A cuvette (Lonza, Basel, Switzerland) with electrodes of 2 cm2 placed 1 mm apart and filled with a NaCl solution was used as the load of the generator. The resistance of the solution was about 90 Ω.
The capacitors of the different connection configurations were charged up to 700 V and a pulse with a duration of 3 ms was generated. The current through the cuvette during the pulses is shown in Figure 6.
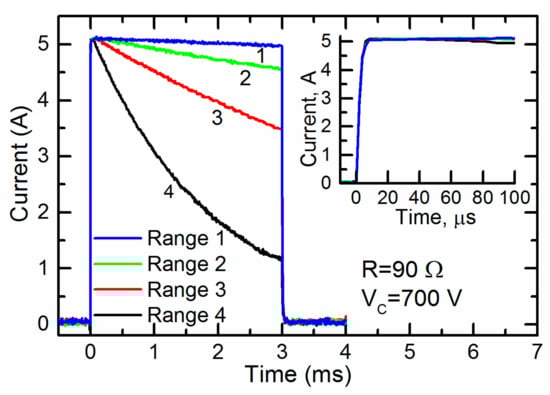
Figure 6.
The current through the cuvette having a resistance of 90 Ω during the 3-ms pulses generated at different ranges of operation. The inset shown the same pulses during the first 100 ms.
One can see that the current through the cuvette was almost constant throughout the whole pulse only in range 1 (see Table 1). For the other ranges 2–4, the current noticeably decreased. Thus, for the generation of a pulse of a given duration for loads with this and lower resistances, range 1 was the most acceptable. At the same time, the inset in Figure 6 shows that the initial part of the same current pulse during the first 100 ms was almost constant at all operating ranges. Thus, all of them could be used for the generation of short pulses. It should be noted that electroporation using short pulses is usually accompanied by a high voltage. Therefore, the fourth range of operation of the generator, in which the maximum charge voltage of the capacitors reached 4 kV, was the most acceptable.
The influence of the crowbar circuit was experimentally investigated using loads with different resistances. For this purpose, a cuvette with various fillings was used. The experiments were done using 1 M sorbitol, a yeast suspension (for more details see below), and a solution of NaCl filling the same cuvette described above. The resistances of these substances were the following: 2000 Ω, 220 Ω, and 65 Ω, respectively. The capacitors were connected according to range 4 and were charged up to a certain voltage, which allowed to produce the same voltage (≈2.6 kV) across the cuvette. The obtained results are presented in Figure 7 for the circuit without a crowbar (curve 1: cuvette filled with sorbitol, curve 2: with yeast suspension, and curve 3: with solution of NaCl) and with the crowbar circuit (curve 1*: with sorbitol and curve 2*: with yeast suspension). As seen from the figure, when the circuit without the crowbar was used, the pulse fall time depended on the load impedance, which is disadvantageous in electroporation. Using this circuit after the switch-off of the transistor, the voltage did not reach zero within 3–10 µs. This is a very significant problem with different biological samples, especially when short pulses are applied. The long fall time means that even during the decay of the pulse, the sample can be uncontrollably affected by the PEF. After connecting the crowbar circuit, the fall part of the pulse was shortened and was the same for all the investigated loads. This is shown in Figure 7 as curves 1* and 2*. Therefore, our proposed circuit with the crowbar allowed for the treatment of biological cells with electric pulses of identical duration, independent of the buffer type (and its conductivity).
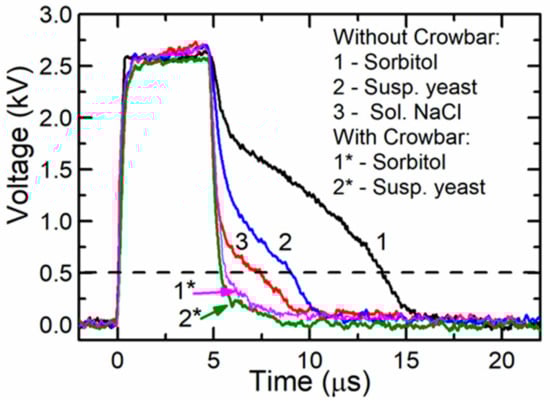
Figure 7.
A voltage across different loads when a single pulse was generated with and without the crowbar circuit. The dashed line represents the voltage level corresponding to the threshold electric field strength for the electroporation of yeast cells.
During the next experiments, we tested whether exposure to the electric field pulses generated by the pulse generator with and without the crowbar circuit could induce different electroporation results. For this purpose, experiments with a yeast cell suspension were performed. The yeast suspension for the experiment was prepared as follows: The Saccharomyces cerevisiae BY4742 (MATα; his3∆1; leu2∆0; lys2∆0; ura3∆0) yeast cells (Euroscarf, Oberursel, Germany) were grown for 24 h in a complete medium (YPD) containing 1% (w/v) yeast extract, 2 % (w/v) peptone, and 2 % (w/v) glucose (Merck, Darmstadt, Germany). Then, the yeast cells 33.3 % (w/v) were re-suspended in a cold (4 °C) electroporation buffer (EPB) containing 1 M sorbitol and a 20 mM Tris-HCl buffer at pH 7.4 (Applichem, Nümbrecht, Germany).
In the experiments, the yeast cell suspension was transferred into the same cuvette and exposed to a single 5-µs pulse with an amplitude up to 2600 V (electric field strength was 26 kV/cm). The resistance of the cuvette filled with the yeast suspension was R ≈ 220 Ω. Experiments were performed with without the crowbar circuit. The pulse shapes for both cases were discussed above and presented in Figure 7 (2 and 2* curves, respectively).
Permeabilization of the membranes was evaluated by exposing the yeast cells to fluorescent SYTOX Green nucleic acid stain (Thermofisher Scientific, Waltham, Mass., USA). During the investigation, the yeast suspension was kept on ice. Fluorescent dye was added into the suspension 10 s after exposure to the PEF. The final concentration of the dye in the suspension was 125 nM. After incubation for one minute, the specimen was placed into a quartz cuvette with a 1-cm light path (Sarstedt, Nümbrecht, Germany) and exposed to 480-nm wavelength light generated using a fluorescence spectrometer LS50B (Perkin Elmer, Waltham, Mass., USA). The permeability of the cell membranes was evaluated by measuring the fluorescence intensity at a peak wavelength equal to 525 nm.
The permeability of the yeast cells after exposure to PEF treatment is presented in Figure 8 as the fluorescence intensity. It was evaluated by employing membrane-impermeable fluorescent dyes intercalated into nucleic acids. Greater amounts of intracellular dye resulted in greater fluorescence intensity (FI), corresponding to the increased permeability [36].
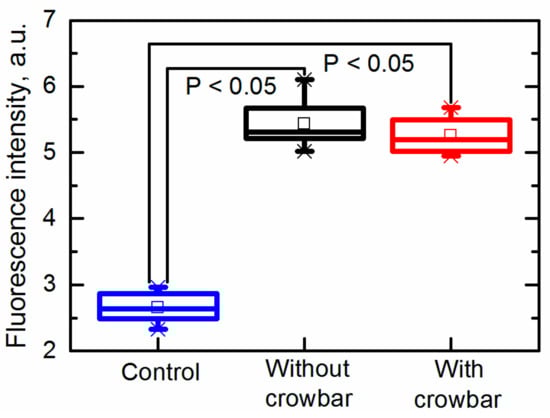
Figure 8.
Permeability of yeast cells after exposure to an electric field pulse.
It was found that both pulses (the electric field strength was 26 kV/cm) generated with and without the crowbar circuit induced electroporation. It was found that the fluorescence intensity (FI) increased from FI = 2.7 ± 0.2 a.u. (untreated sample) up to FI = 5.4 ± 0.4 a.u. and FI = 5.3 ± 0.3 a.u. in samples exposed to pulses generated without and with the crowbar circuit, respectively. Thus, the differences between the induced membrane permeability in both cases was insignificant. It should be noted that the fluorescence was measured when the dye was added into the suspension just 10 s after its exposure to PEF; therefore, no influence of the pulse shape (decay time) on the cell damage or other processes was noticed during such short period.
We further investigated the long-term electroporation effects by evaluating the viability by means of the number of colony forming units (CFUs). The viability of the cells was evaluated by the plate count method using solid YPD media with 1.2% (w/v) agar (Alfa Aesar, Kandel, Germany). Afterward, the plating yeast cells were grown in an incubator for 48 h at 30 °C. The results are presented in Figure 9. The CFUs are expressed as a percentage, where 100 ± 8.2% corresponded to the viability of the yeast cells in an untreated cell suspension. The viability of the yeast cells exposed to the pulses generated without the crowbar circuit was reduced to CFU = 84.1 ± 4.5%, thus confirming that the electroporation was at least partially irreversible. The viability of the yeast cells exposed to the pulses generated with a crowbar circuit was higher (CFU = 96.1 ± 3.3%) and was comparable to untreated cells. This result is very important for performing electroporation and retaining a high viability of the treated cells.
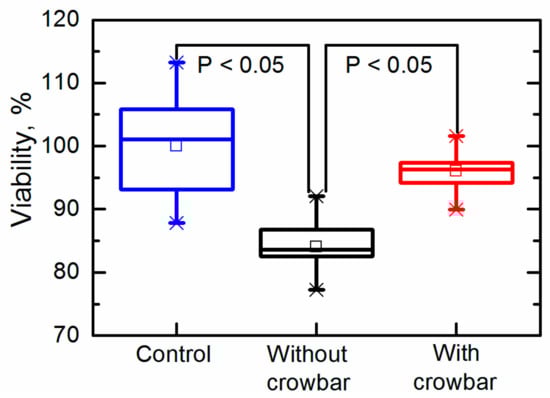
Figure 9.
Viability of yeast cells after exposure to an electric field pulse.
Our previous study showed that the detectable electroporation in yeast cells starts after exposure to 5-µs pulses with an electric field strength of approximately 5 kV/cm [37]. Such an electric field corresponds to a 500-V amplitude (dashed line in Figure 7) and such an electric field strength or higher remained for 8.4 µs and 5.5 µs when generated by systems without and with the crowbar circuit, respectively. The difference in the pulse duration (at the level of the threshold electric field strength) was 3.1 µs, while the energy delivered by such pulses differed by 14%. It was previously shown that the pulse parameters (pulse shape, duration, frequency) could have an effect on the cellular response [23]. In our experiments, the duration of the maximal amplitudes was similar and resulted in similar electroporation. From the viability experiment, however, we can conclude that the total energy input, as well as the pulse shape, could contribute to the reduction of the cell viability and should be accurately reported according to the guidelines [38]. Such a difference in the viability obtained in our experiments was most probably caused by the longer time of exposure during which the voltage exceeded the electroporation threshold.
4. Conclusions
A commercially available, compact, programmable device for high-voltage, square-wave electric pulse generation that is usable for biological cell electroporation has been proposed, designed, and tested. The device has a variable energy storage capacitor bank; thus, the accumulation of high amounts of energy is avoided. The main advantages of such a device are the increased range of possible pulse durations and amplitudes when compared with commercially available electroporators. It can generate a single or a sequence of single electrical pulses with widths from 3 μs to 10 ms and amplitudes up to 3.5 kV. The rise and fall time of the pulses does not depend on the load impedance and is less than 0.1 μs. It is equipped with an LCD screen for the monitoring of the input parameters and an additional LCD screen for the display of the pulse waveform during the experiments. The incorporation of this additional screen into the design of the device significantly improved the quality of the investigation of the processes occurring in the test object by providing the possibility of more precise control of the current pulse shape, indicating the preferable conditions of the experiment (e.g., no sparking or heating of the cell suspension). The proposed device was successfully tested in experiments with biological cells. The design of the generator using a crowbar circuit enabled better control of the pulse parameters (especially the pulse duration), which resulted in the increased effectiveness of electroporation and cell viability.
Author Contributions
Conceptualization, V.S. and N.Z.; methodology, V.S. and S.B.; software, V.B.; validation, V.B. and A.D.; investigation, A.D., P.S., S.K., and A.S.; writing—original draft preparation, V.S., A.S., and P.S.; writing—review and editing, N.Z. and A.S.; project administration, N.Z. All authors have read and agreed to the published version of the manuscript.
Funding
This work was partly funded by “Geozondas” Ltd. Implementing an EU structural investment project 01.2.1-MITA-T-851-02-0004 under measure “Inocekiai.”
Conflicts of Interest
The authors declare no conflict of interest.
References
- Kotnik, T.; Frey, W.; Sack, M.; Haberl Meglič, S.; Peterka, M.; Miklavčič, D. Electroporation-Based Applications in Biotechnology. Trends Biotechnol. 2015, 33, 480–488. [Google Scholar] [CrossRef]
- Yarmush, M.L.; Golberg, A.; Serša, G.; Kotnik, T.; Miklavčič, D. Electroporation-Based Technologies for Medicine: Principles, Applications, and Challenges. Annu. Rev. Biomed. Eng. 2014, 16, 295–320. [Google Scholar] [CrossRef]
- Zhu, Z.; Zhang, R.; Grimi, N.; Vorobiev, E. Effects of Pulsed Electric Field Treatment on Compression Properties and Solutes Diffusion Behaviors of Jerusalem Artichoke. Molecules 2019, 24. [Google Scholar] [CrossRef]
- Brezar, S.K.; Kranjc, M.; Čemažar, M.; Buček, S.; Serša, G. Electrotransfer of SiRNA to Silence Enhanced Green Fluorescent Protein in Tumor Mediated by a High Intensity Pulsed Electromagnetic Field. Vaccines 2020, 8, 49. [Google Scholar] [CrossRef]
- Frandsen, F.; Vissing, V.; Gehl, G. A Comprehensive Review of Calcium Electroporation—A Novel Cancer Treatment Modality. Cancers 2020, 12. [Google Scholar] [CrossRef]
- Beebe, S.J.; Chen, Y.J.; Sain, N.M.; Schoenbach, K.H.; Xiao, S. Transient Features in Nanosecond Pulsed Electric Fields Differentially Modulate Mitochondria and Viability. PLoS ONE 2012, 7, e51349. [Google Scholar] [CrossRef]
- Pakhomov, A.G.; Gianulis, E.; Vernier, P.T.; Semenov, I.; Xiao, S.; Pakhomova, O.N. Multiple Nanosecond Electric Pulses Increase the Number but Not the Size of Long-Lived Nanopores in the Cell Membrane. Biochim. Biophys. Acta Biomembr. 2015, 1848, 958–966. [Google Scholar] [CrossRef]
- Blank, L.M.; Rockenbach, A.; Sudarsan, S.; Berens, J.; Kosubek, M.; Lazar, J.; Demling, P.; Hanke, R.; Mennicken, P.; Ebert, B.E.; et al. Microfluidic Irreversible Electroporation—A Versatile Tool to Extract Intracellular Contents of Bacteria and Yeast. Metabolites 2019, 9. [Google Scholar] [CrossRef]
- Cervia, L.D.; Chang, C.C.; Wang, L.; Mao, M.; Yuan, F. Enhancing Electrotransfection Efficiency through Improvement in Nuclear Entry of Plasmid DNA. Mol. Ther. Nucleic Acids 2018, 11, 263–271. [Google Scholar] [CrossRef]
- Golberg, A.; Sack, M.; Teissie, J.; Pataro, G.; Pliquett, U.; Saulis, G.; Stefan, T.; Miklavcic, D.; Vorobiev, E.; Frey, W. Energy-Efficient Biomass Processing with Pulsed Electric Fields for Bioeconomy and Sustainable Development. Biotechnol. Biofuels 2016, 9, 94. [Google Scholar] [CrossRef]
- Pudasaini, S.; Perera, A.T.K.; Ahmed, S.S.U.; Chong, Y.B.; Ng, S.H.; Yang, C. An Electroporation Device with Microbead-Enhanced Electric Field for Bacterial Inactivation. Inventions 2020, 5. [Google Scholar] [CrossRef]
- Bluhm, H.; Rusch, D. Pulsed Power Systems: Principles and Applications; Springer: Berlin/Heidelberg, Germany, 2006. [Google Scholar]
- Bluhm, H.; Sack, M. Industrial-Scale Treatment of Biological Tissues with Pulsed Electric Fields. In Food Engineering Series; Springer: Berlin/Heidelberg, Germany, 2008; pp. 237–269. [Google Scholar] [CrossRef]
- Sack, M.; Keipert, S.; Hochberg, M.; Greule, M.; Mueller, G. Design Considerations for a Fast Stacked-MOSFET Switch. IEEE Trans. Plasma Sci. 2013, 41, 2630–2636. [Google Scholar] [CrossRef]
- Reberšek, M.; Miklavčič, D.; Bertacchini, C.; Sack, M. Cell Membrane Electroporation-Part 3: The Equipment. IEEE Electr. Insul. Mag. 2014, 30, 8–18. [Google Scholar] [CrossRef]
- Romeo, S.; Sarti, M.; Scarfì, M.R.; Zeni, L. Modified Blumlein Pulse-Forming Networks for Bioelectrical Applications. J. Membr. Biol. 2010, 236, 55–60. [Google Scholar] [CrossRef]
- Eing, C.J.; Bonnet, S.; Pacher, M.; Puchta, H.; Frey, W. Effects of Nanosecond Pulsed Electric Field Exposure on Arabidopsis Thaliana. IEEE Trans. Dielectr. Electr. Insul. 2009, 16, 1322–1328. [Google Scholar] [CrossRef]
- Kolb, J.F.; Kono, S.; Schoenbach, K.H. Nanosecond Pulsed Electric Field Generators for the Study of Subcellular Effects. Bioelectromagnetics 2006, 27, 172–187. [Google Scholar] [CrossRef]
- Kuthi, A.; Gabrielsson, P.; Behrend, M.R.; Vernier, P.T.; Gundersen, M.A. Nanosecond Pulse Generator Using Fast Recovery Diodes for Cell Electromanipulation. IEEE Trans. Plasma Sci. 2005, 33, 1192–1197. [Google Scholar] [CrossRef]
- Puc, M.; Čorović, S.; Flisar, K.; Petkovšek, M.; Nastran, J.; Miklavčič, D. Techniques of Signal Generation Required for Electropermeabilization. Survey of Electropermeabilization Devices. Bioelectrochemistry 2004, 64, 113–124. [Google Scholar] [CrossRef]
- Katsuki, S.; Nomura, N.; Koga, H.; Akiyama, H.; Uchida, I.; Abe, S.I. Biological Effects of Narrow Band Pulsed Electric Fields. IEEE Trans. Dielectr. Electr. Insul. 2007, 14, 663–668. [Google Scholar] [CrossRef]
- Weaver, J.C.; Chizmadzhev, Y.A. Theory of Electroporation: A Review. Bioelectrochem. Bioenerg. 1996, 41, 135–160. [Google Scholar] [CrossRef]
- Kotnik, T.; Pucihar, G.; Rebersek, M.; Miklavcic, D.; Mir, L.M. Role of Pulse Shape in Cell Membrane Electropermeabilization. Biochim. Biophys. Acta 2003, 1614, 193–200. [Google Scholar] [CrossRef]
- Reberšek, M.; Miklavčič, D. Advantages and Disadvantages of Different Concepts of Electroporation Pulse Generation. Automatika 2011, 52, 12–19. [Google Scholar] [CrossRef]
- Saulis, G.; Saule, R.; Bitinaite, A.; Zurauskiene, N.; Stankevic, V.; Balevicius, S. Theoretical Analysis and Experimental Determination of the Relationships between the Parameters of the Electric Field Pulse Required to Electroporate the Cells. IEEE Trans. Plasma Sci. 2013, 41, 2913–2919. [Google Scholar] [CrossRef]
- Balevicius, S.; Stankevic, V.; Zurauskiene, N.; Shatkovskis, E.; Stirke, A.; Bitinaite, A.; Saule, R.; Maciuleviciene, R.; Saulis, G. System for the Nanoporation of Biological Cells Based on an Optically-Triggered High-Voltage Spark-Gap Switch. IEEE Trans. Plasma Sci. 2013, 41, 2706–2711. [Google Scholar] [CrossRef]
- White, J.A.; Pliquett, U.; Blackmore, P.F.; Joshi, R.P.; Schoenbach, K.H.; Kolb, J.F. Plasma Membrane Charging of Jurkat Cells by Nanosecond Pulsed Electric Fields. Eur. Biophys. J. 2011, 40, 947–957. [Google Scholar] [CrossRef]
- Bullmann, T.; Arendt, T.; Frey, U.; Hanashima, C. A Transportable, Inexpensive Electroporator for in Utero Electroporation. Dev. Growth Differ. 2015, 57, 369–377. [Google Scholar] [CrossRef]
- Stankevič, V.; Novickij, V.; Balevičius, S.; Žurauskiene, N.; Baškys, A.; Dervinis, A.; Bleizgys, V. Electroporation System Generating Wide Range Square-Wave Pulses for Biological Applications. In Proceedings of the 2013 IEEE Biomedical Circuits and Systems Conference, BioCAS, Rotterdam, The Netherlands, 31 October–2 November 2013; pp. 33–36. [Google Scholar] [CrossRef]
- Flisar, K.; Meglic, S.H.; Morelj, J.; Golob, J.; Miklavcic, D. Testing a Prototype Pulse Generator for a Continuous Flow System and Its Use for E. Coli Inactivation and Microalgae Lipid Extraction. Bioelectrochemistry 2014, 100, 44–51. [Google Scholar] [CrossRef]
- Gene Pulser XcellTM Electroporation Systems from Bio-Rad|Biocompare.com. Available online: https://www.biocompare.com/11987-Electroporation-Cell-Fusion-Instruments/4231642-Gene-Pulser-Xcell-Electroporation-Systems/ (accessed on 4 November 2019).
- ECM 830 Square Wave Electroporation System. Available online: https://www.btxonline.com/media/wysiwyg/tab_content/BTX-ECM-830-User-Manual-0818.pdf (accessed on 4 November 2019).
- Pakhomov, A.G.; Miklavčič, D.; Markov, M. Advanced Electroporation Techniques in Biology and Medicine; Marko, S., Ed.; CRC Press: Boca Raton, FL, USA, 2010. [Google Scholar]
- Cukjati, D.; Batiuskaite, D.; André, F.; Miklavčič, D.; Mir, L.M. Real Time Electroporation Control for Accurate and Safe in Vivo Non-Viral Gene Therapy. Bioelectrochemistry 2007, 70, 501–507. [Google Scholar] [CrossRef]
- Celetrix Biotechnology. Available online: http://www.celetrix.com/upfile/doc/Celetrix_Brochure.pdf (accessed on 4 November 2019).
- Stirke, A.; Celiesiute-Germaniene, R.; Zimkus, A.; Zurauskiene, N.; Simonis, P.; Dervinis, A.; Ramanavicius, A.; Balevicius, S. The Link between Yeast Cell Wall Porosity and Plasma Membrane Permeability after PEF Treatment. Sci. Rep. 2019, 9, 1–10. [Google Scholar] [CrossRef]
- Stirke, A.; Zimkus, A.; Ramanaviciene, A.; Balevicius, S.; Zurauskiene, N.; Saulis, G.; Chaustova, L.; Stankevic, V.; Ramanavicius, A. Electric Field-Induced Effects on Yeast Cell Wall Permeabilization. Bioelectromagnetics 2014, 35, 136–144. [Google Scholar] [CrossRef]
- Cemazar, M.; Sersa, G.; Frey, W.; Miklavcic, D.; Teissié, J. Recommendations and Requirements for Reporting on Applications of Electric Pulse Delivery for Electroporation of Biological Samples. Bioelectrochemistry 2018, 122, 69–76. [Google Scholar] [CrossRef]


© 2020 by the authors. Licensee MDPI, Basel, Switzerland. This article is an open access article distributed under the terms and conditions of the Creative Commons Attribution (CC BY) license (http://creativecommons.org/licenses/by/4.0/).