Study on the Crystal Structure of Coal Kaolinite and Non-Coal Kaolinite: Insights from Experiments and DFT Simulations


Abstract
:1. Introduction
2. Materials and Methods
2.1. Samples
2.2. Experimental Equipment and Methods
2.3. Computational Methods and Models
2.3.1. Computational Method
2.3.2. Surface Model
2.3.3. The Impurity Substitution Energy
3. Results and Discussion
3.1. Mineralogical Characteristics
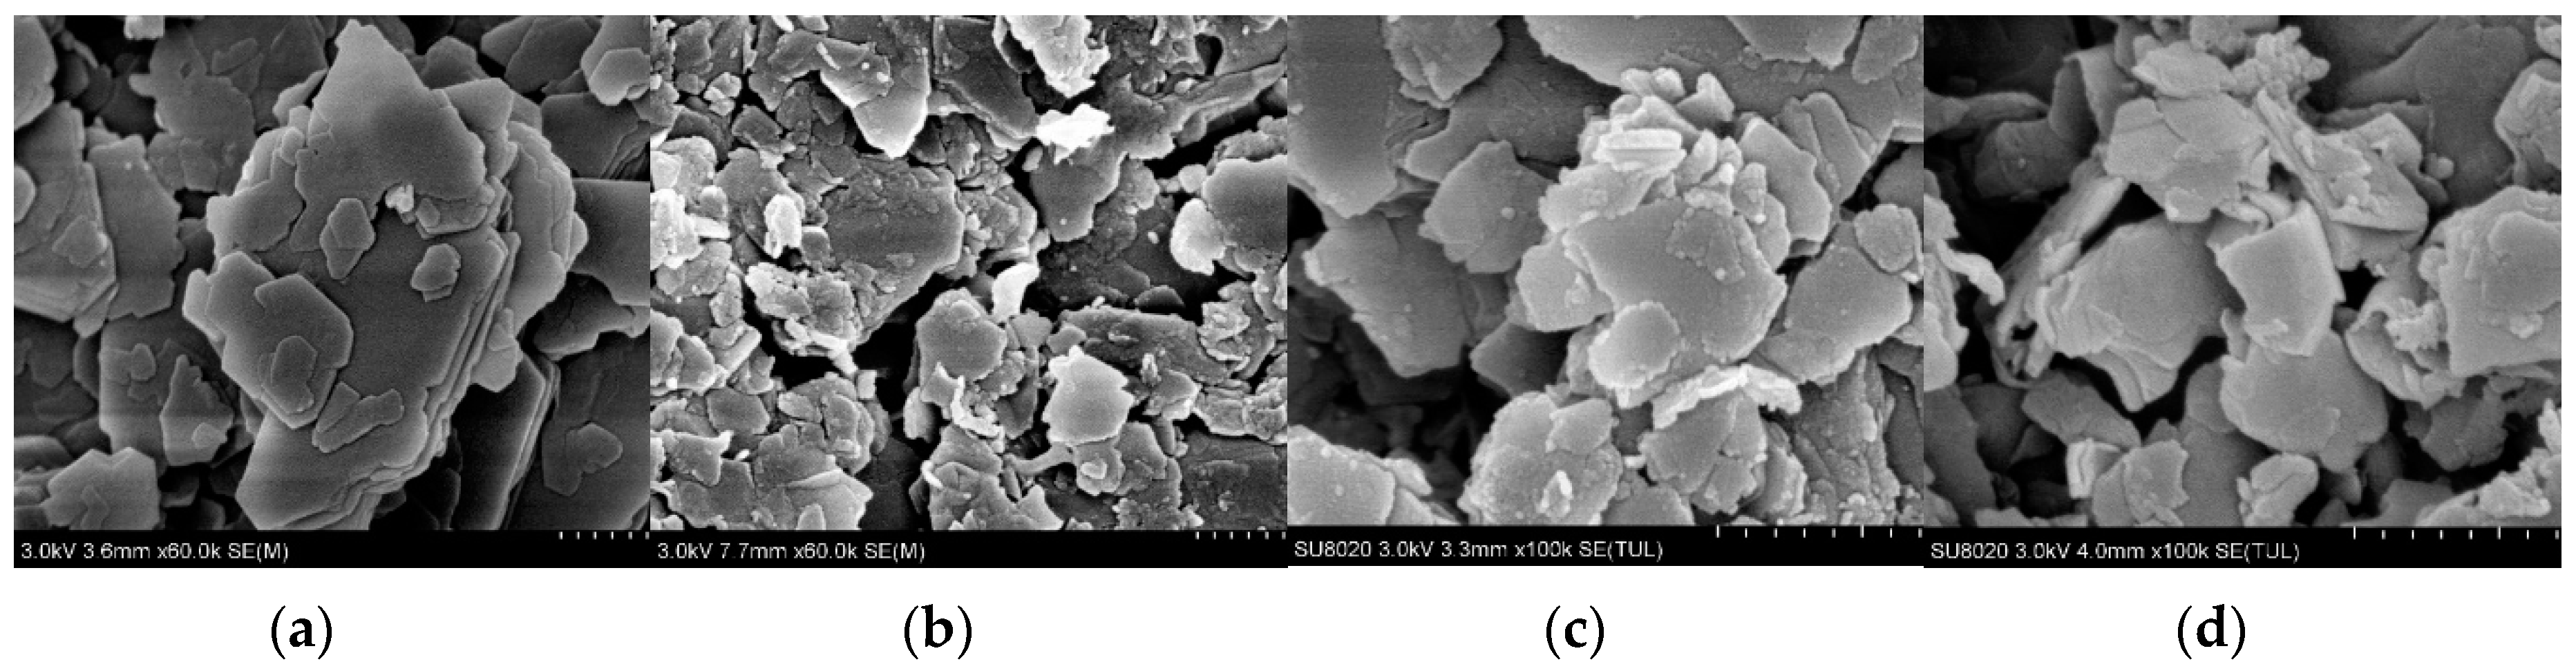
3.1.1. SEM
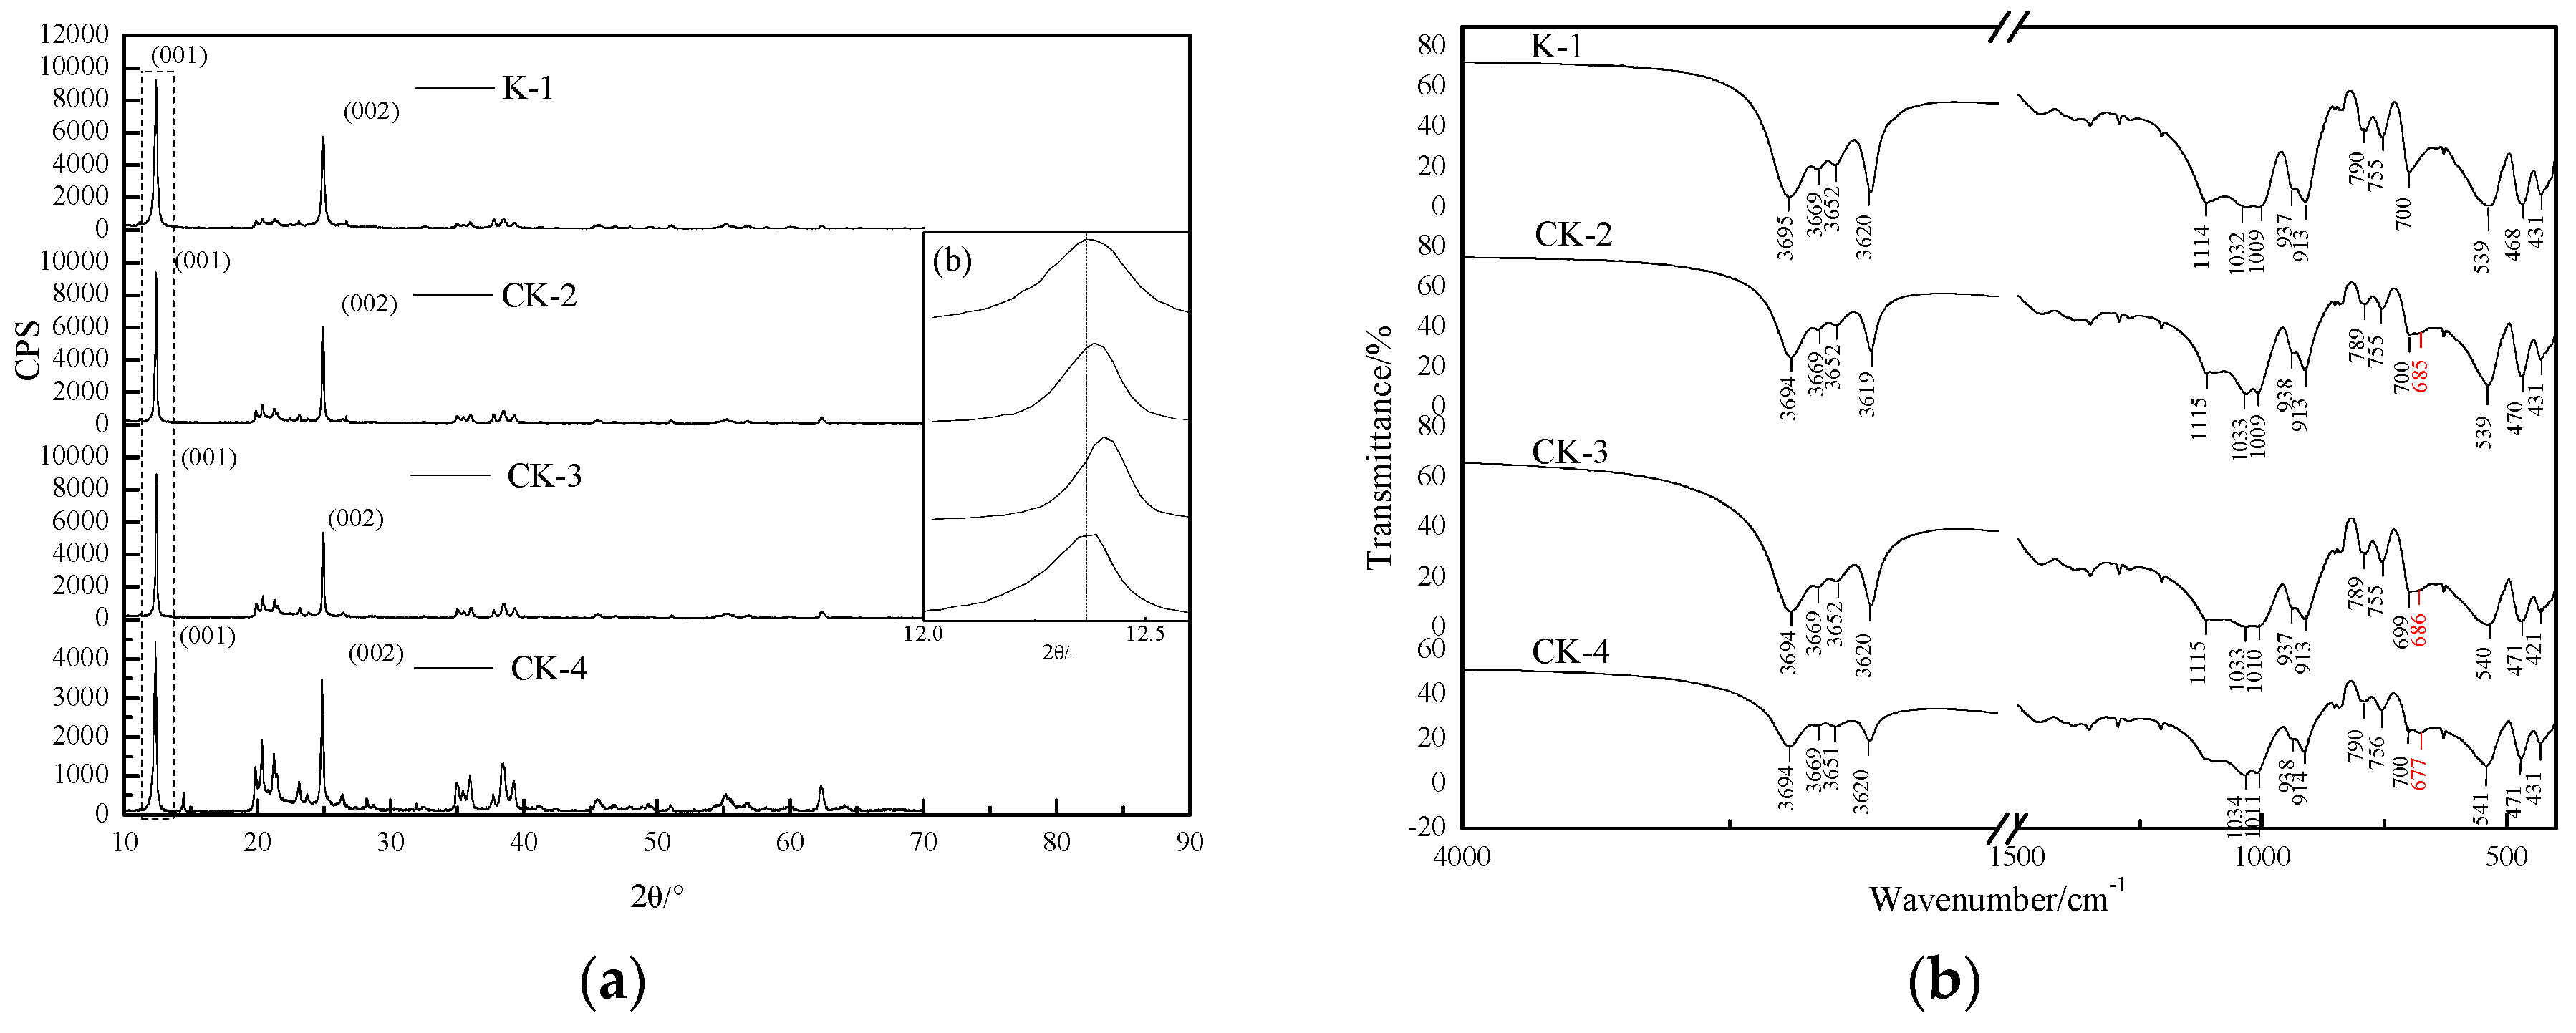
3.1.2. XRD
3.1.3. FTIR
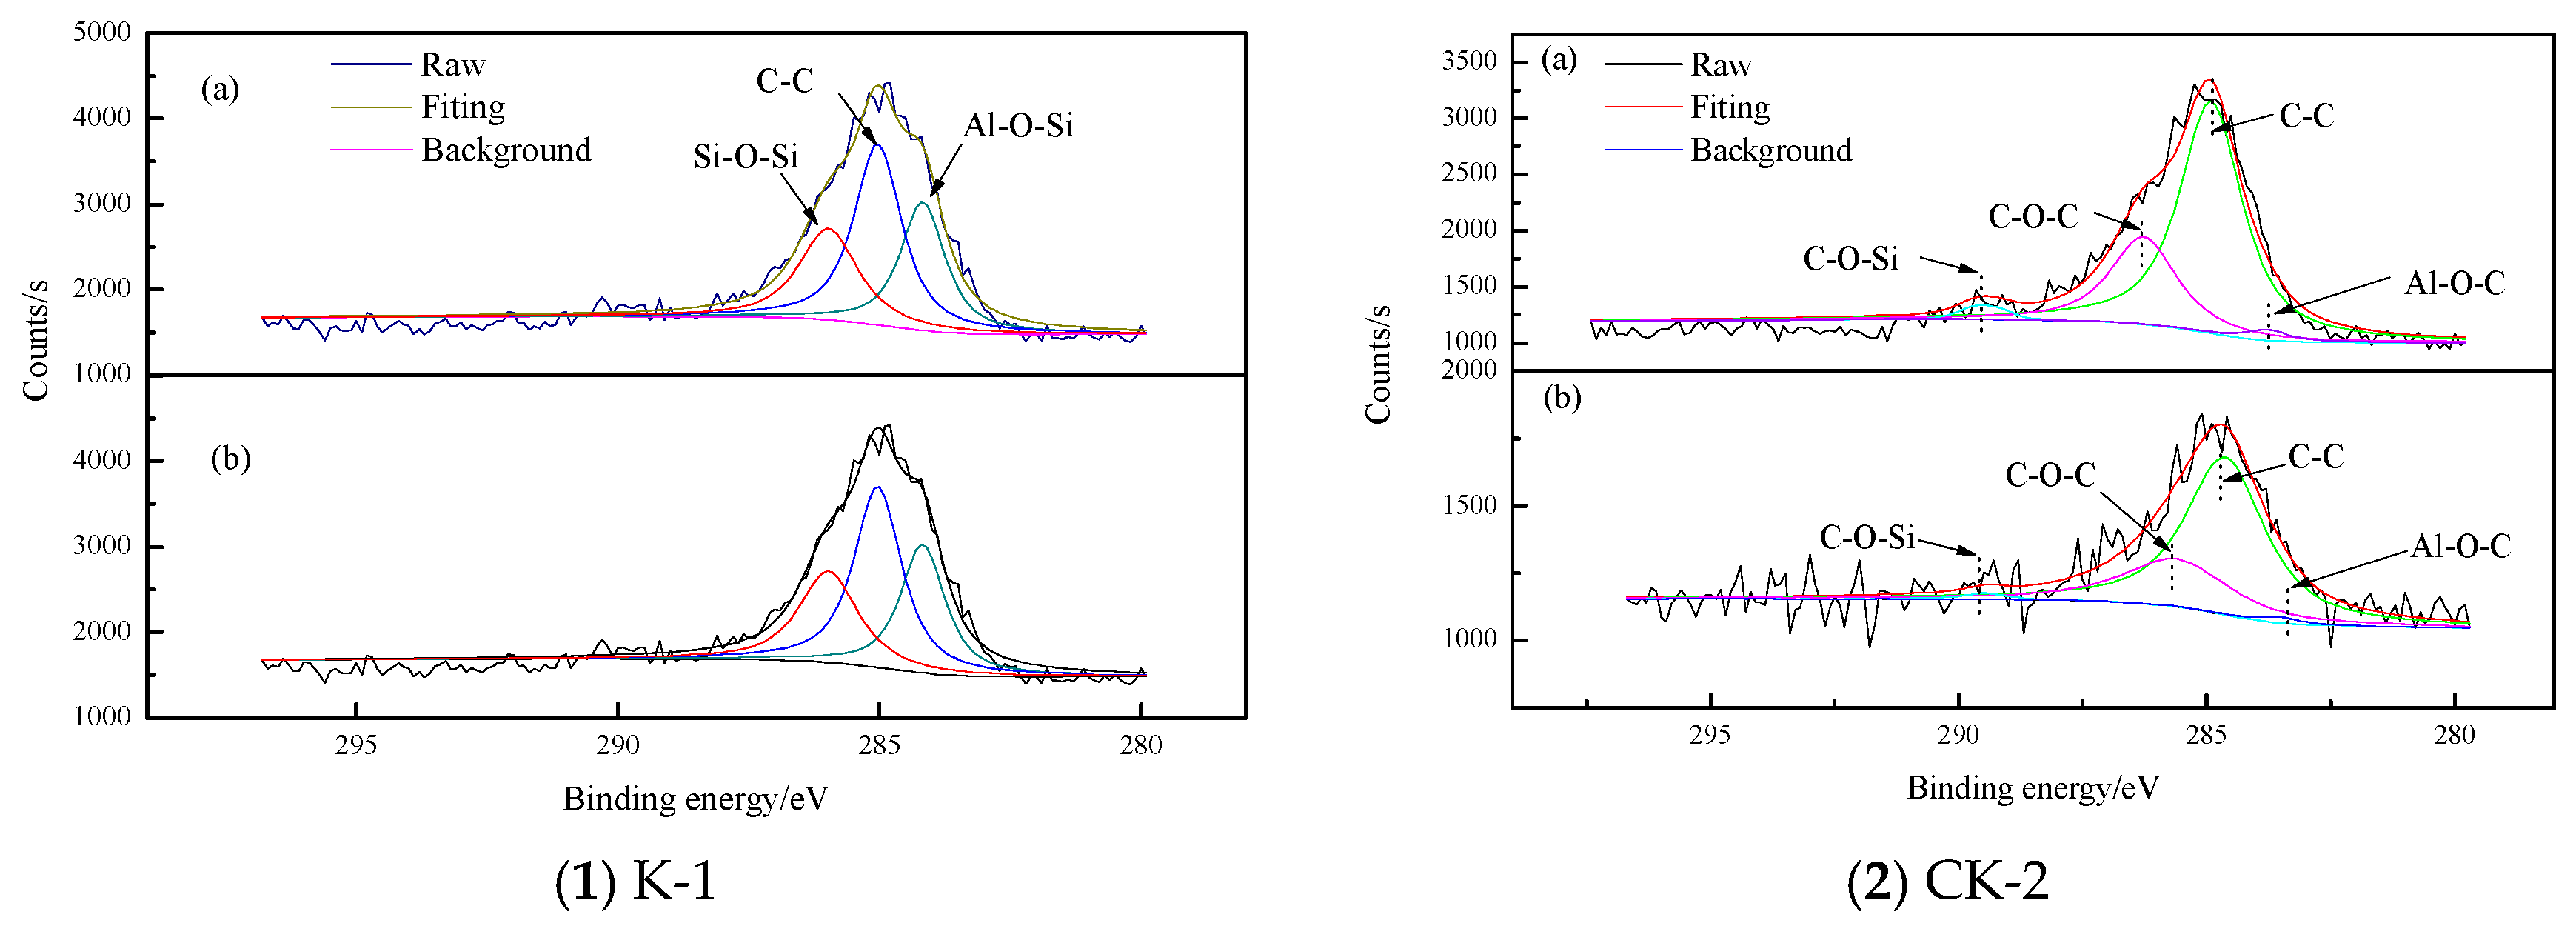
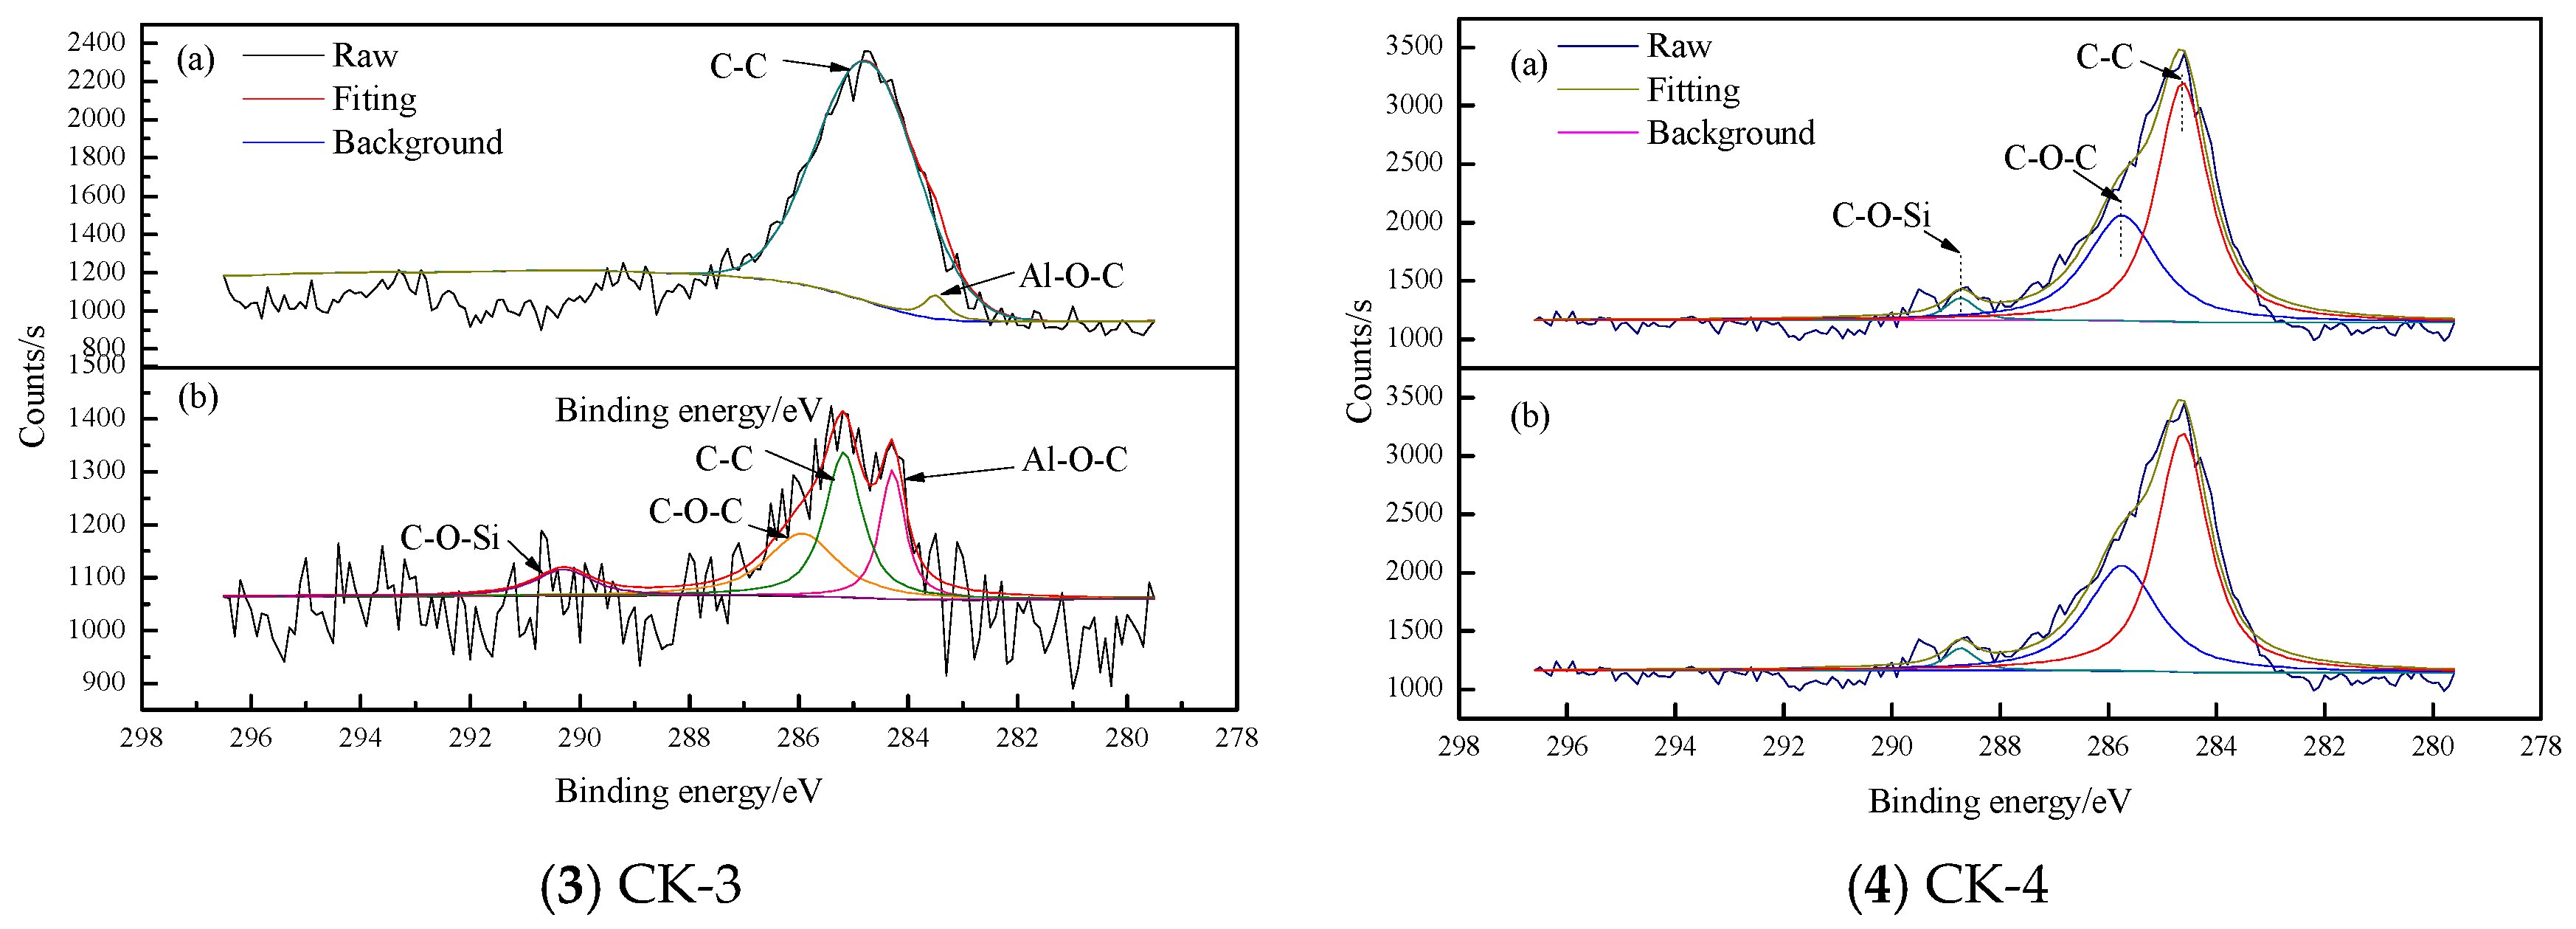
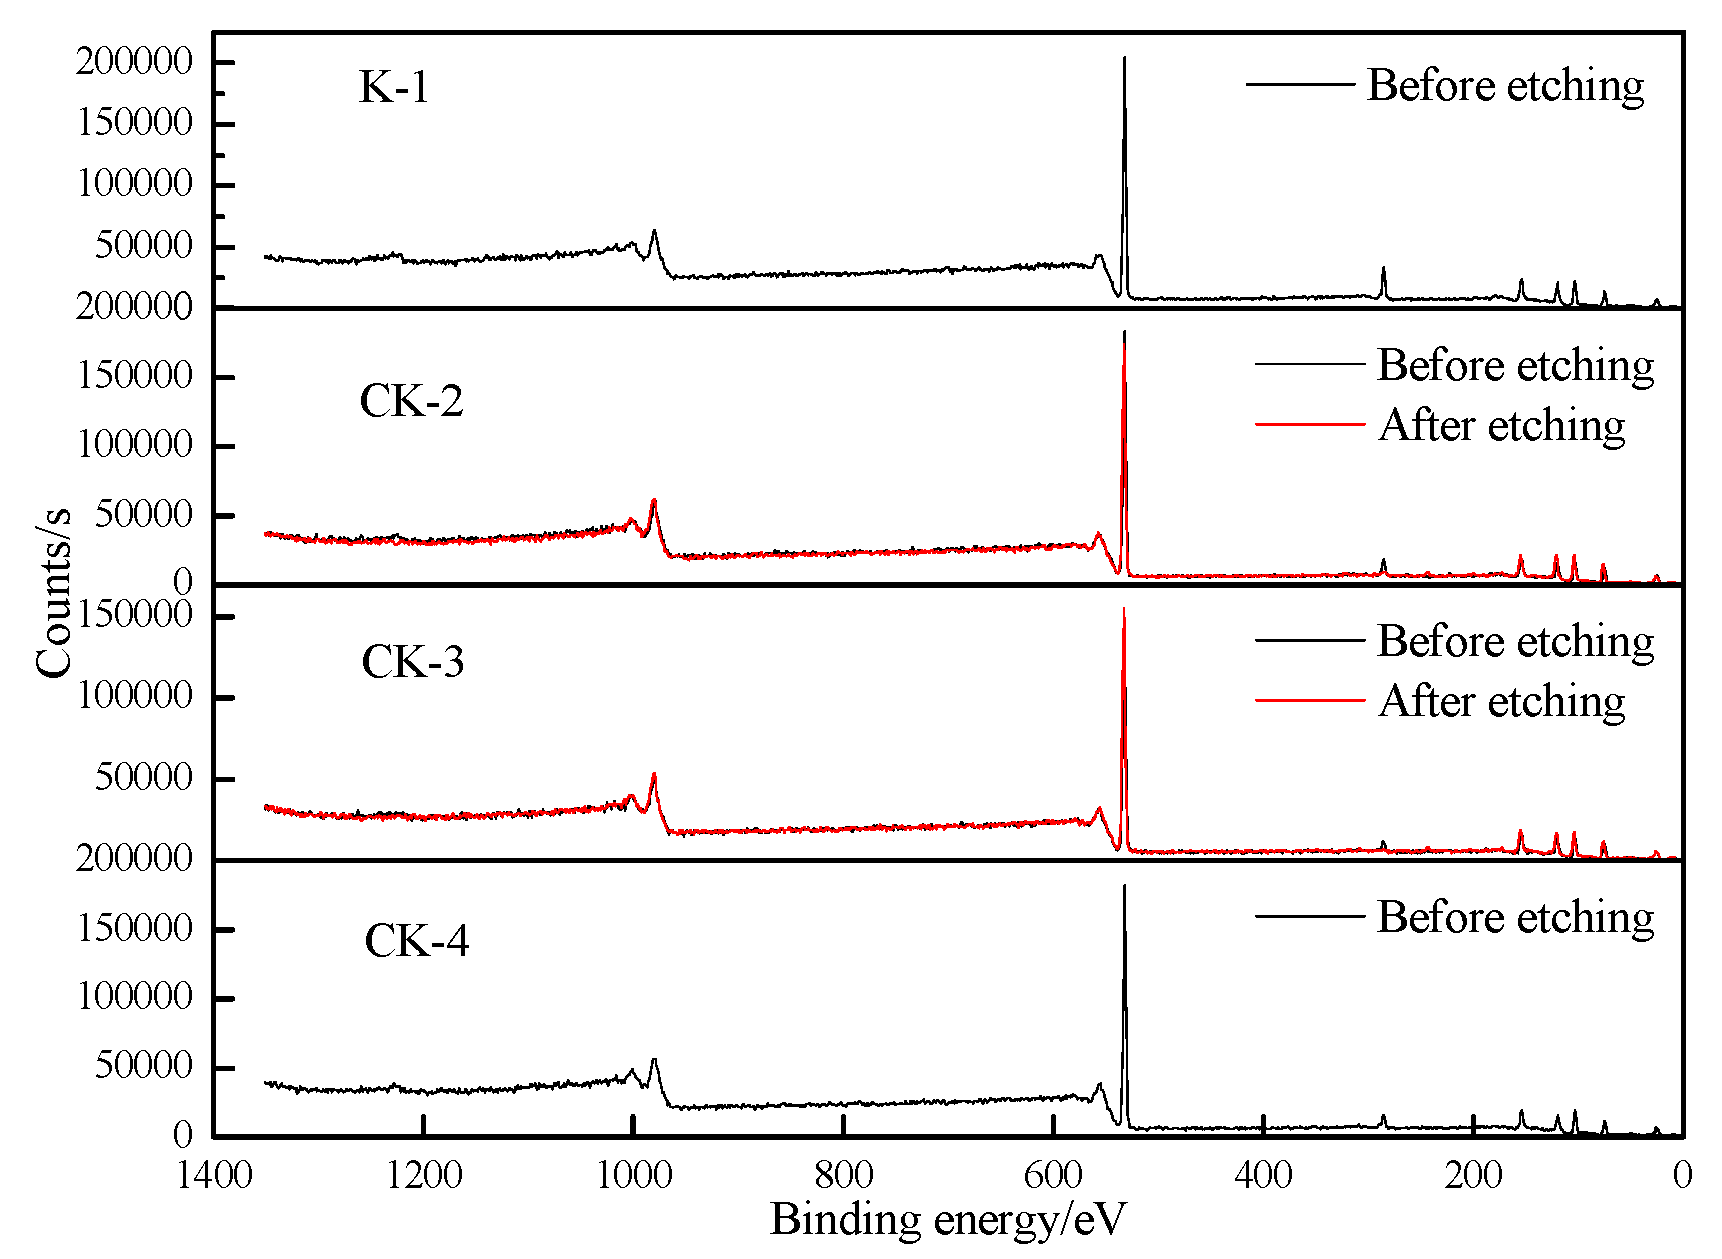
3.1.4. XPS
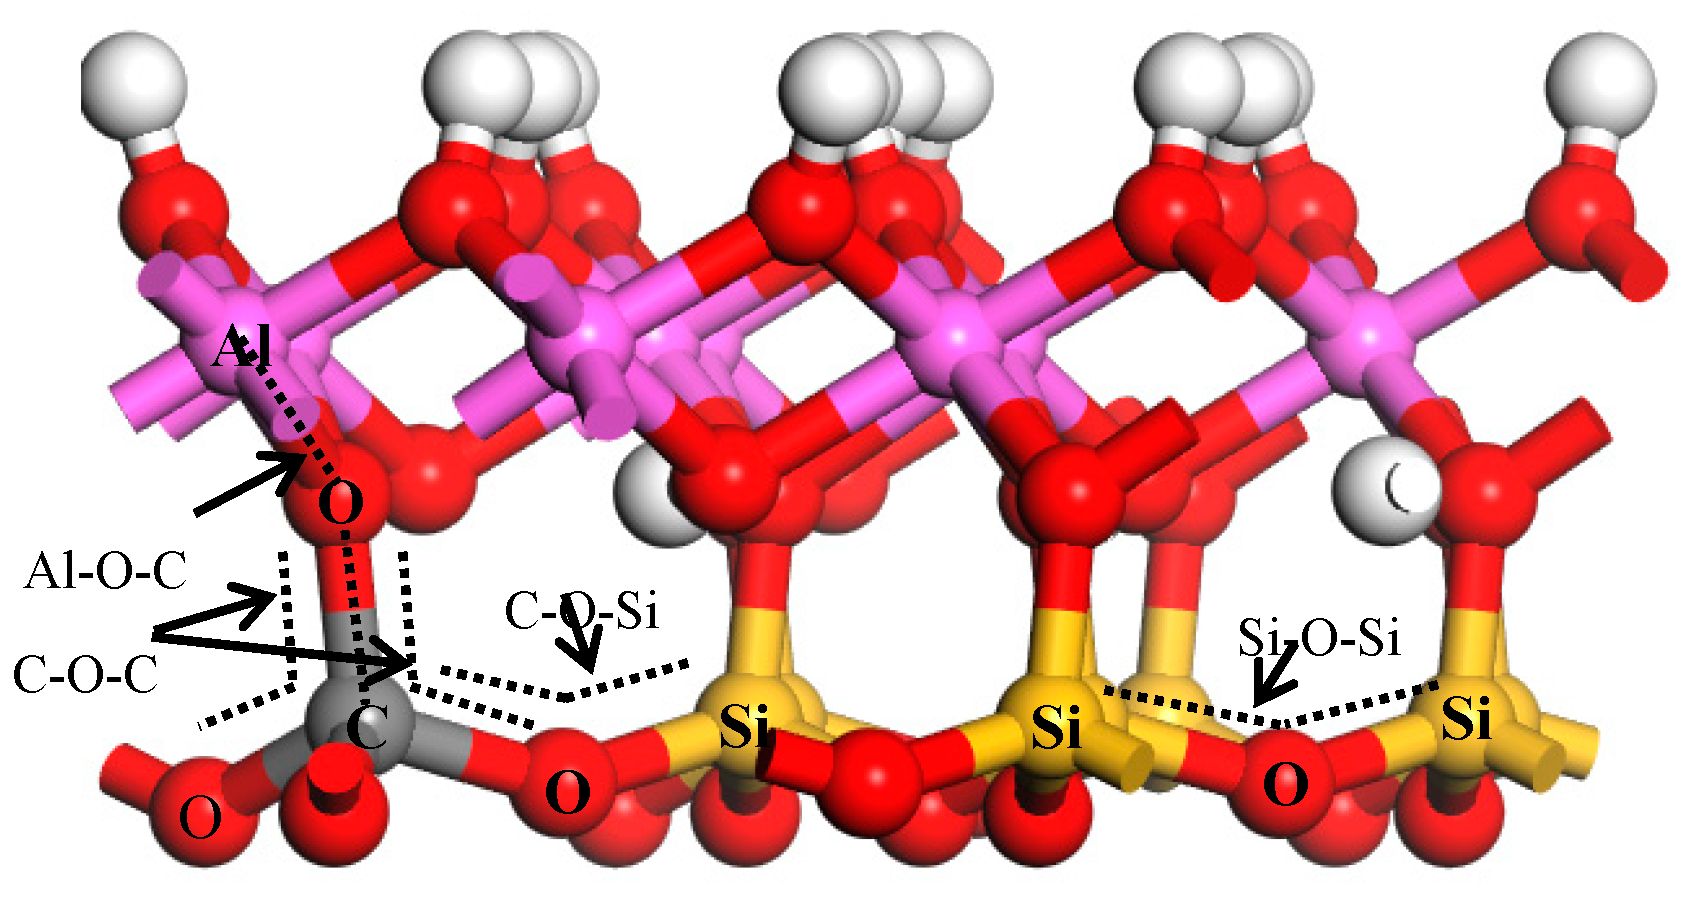
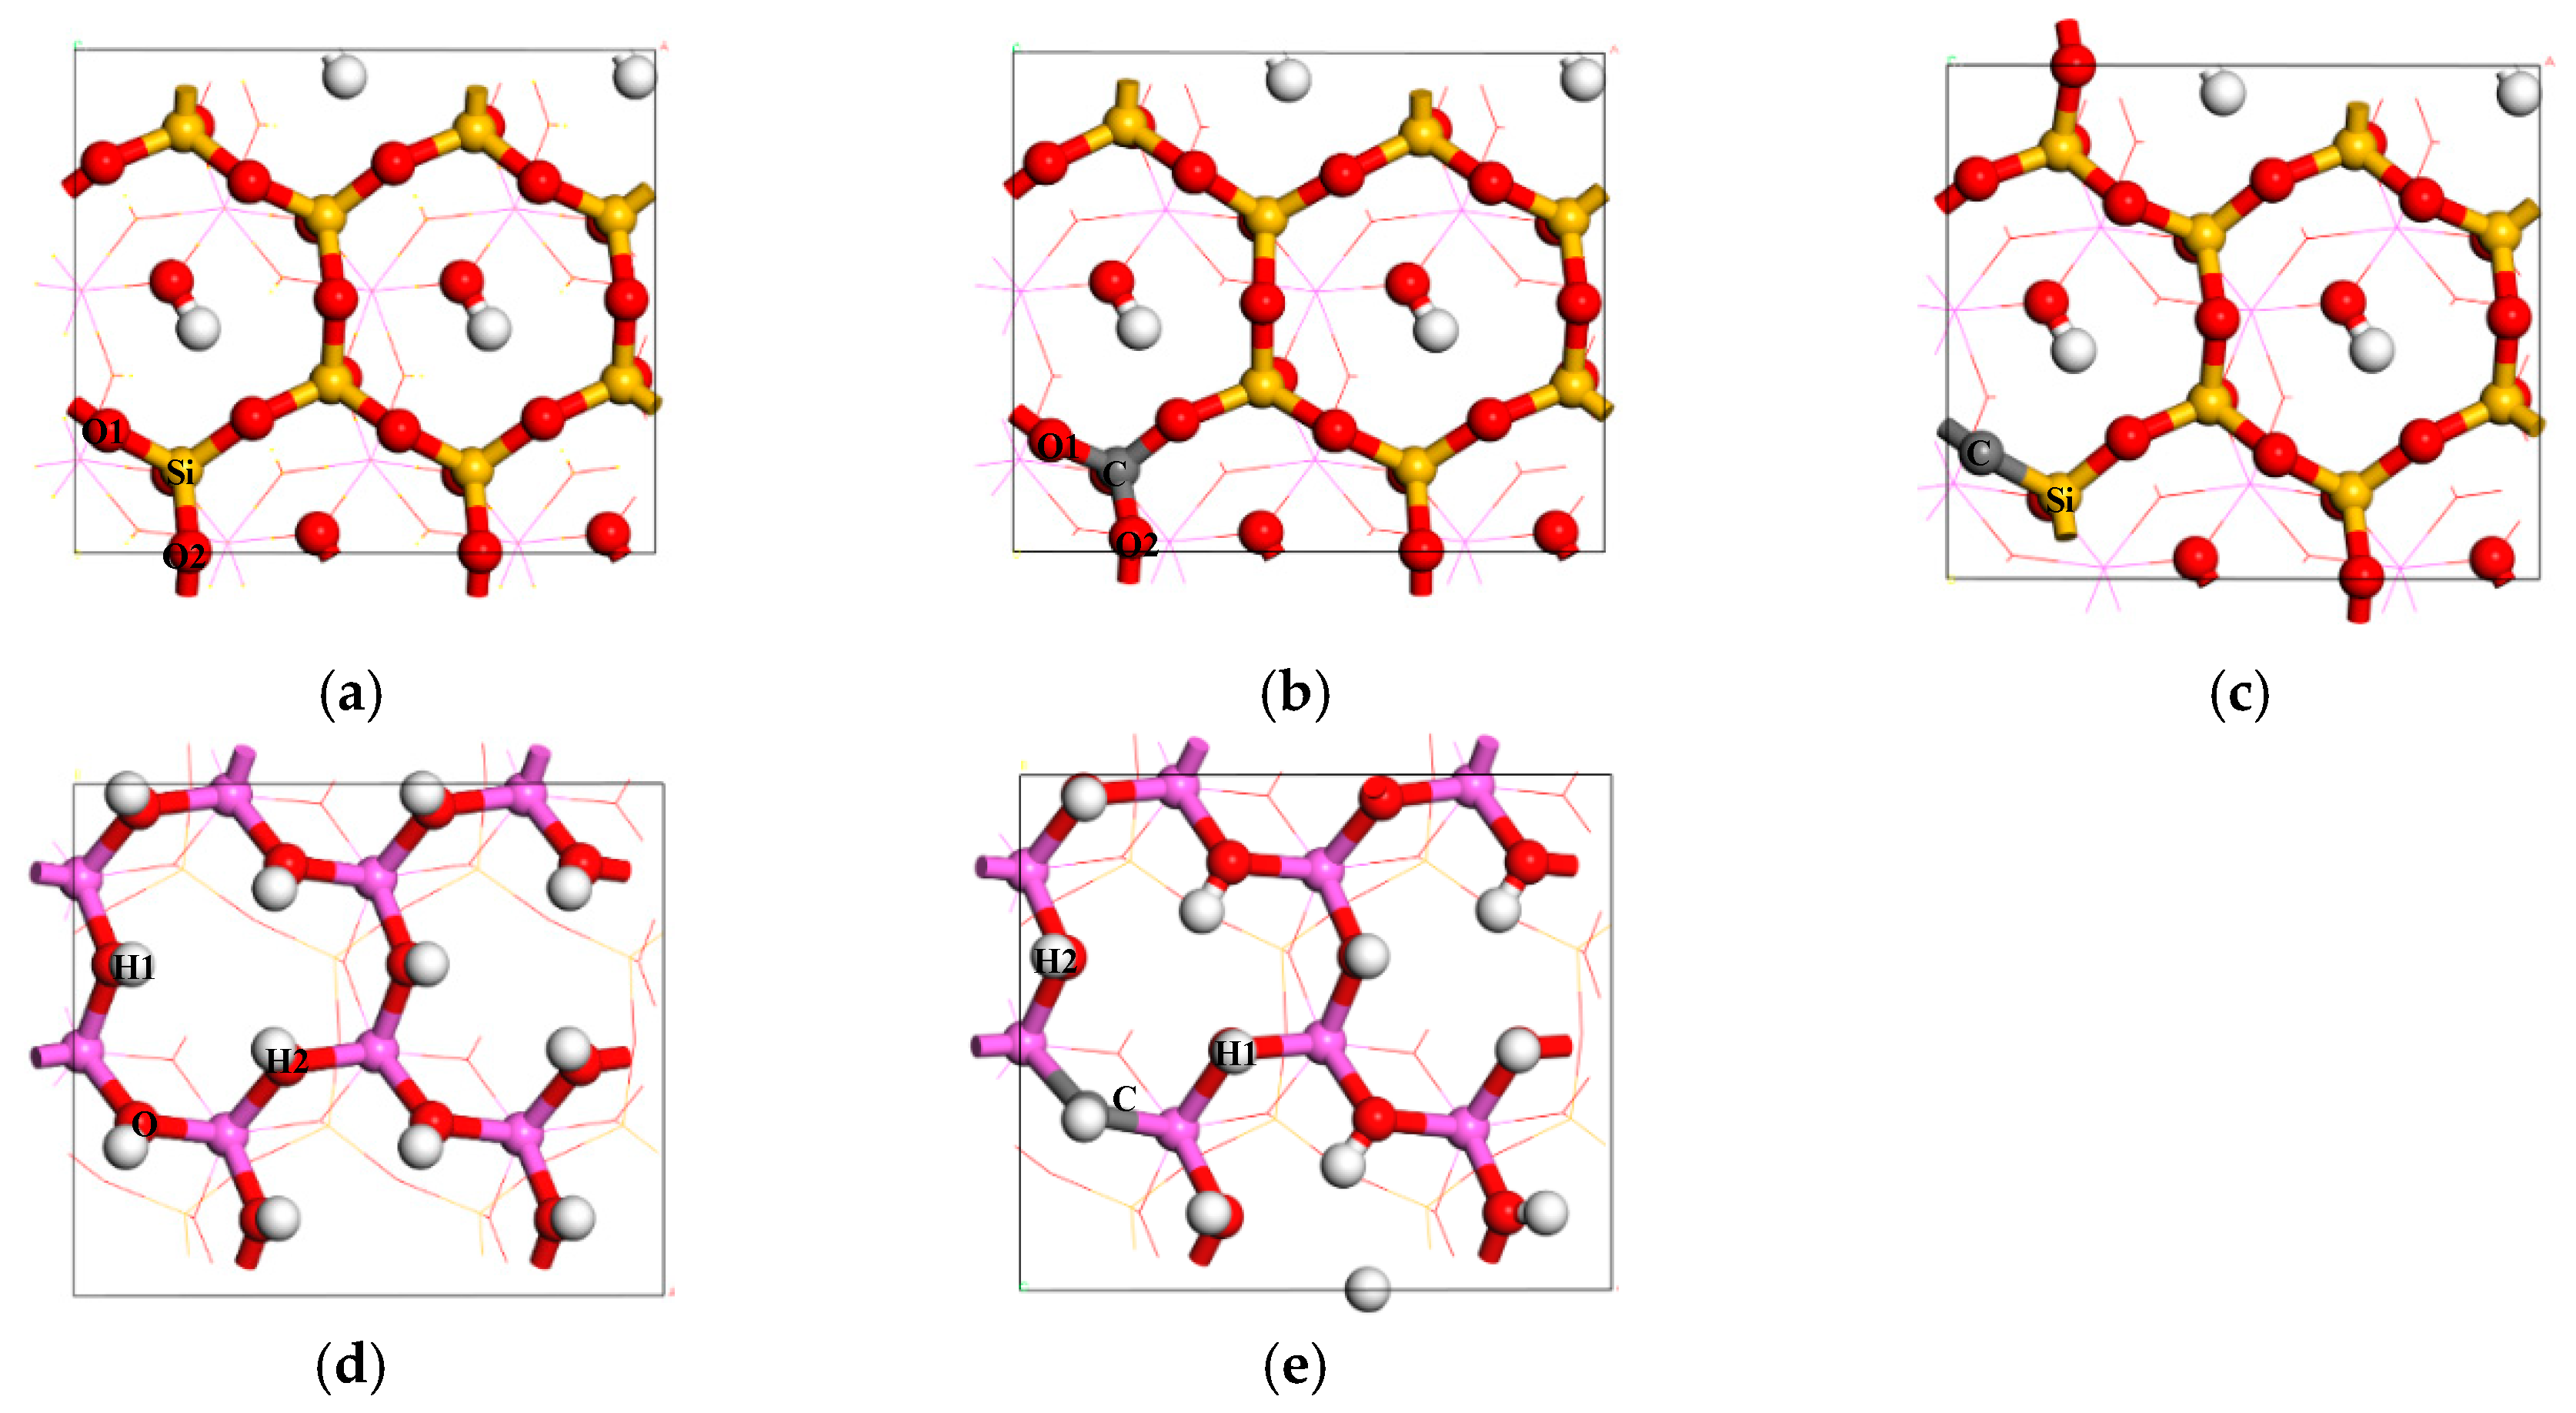
3.2. The Doping Mechanism and Impurity Substitution Energies
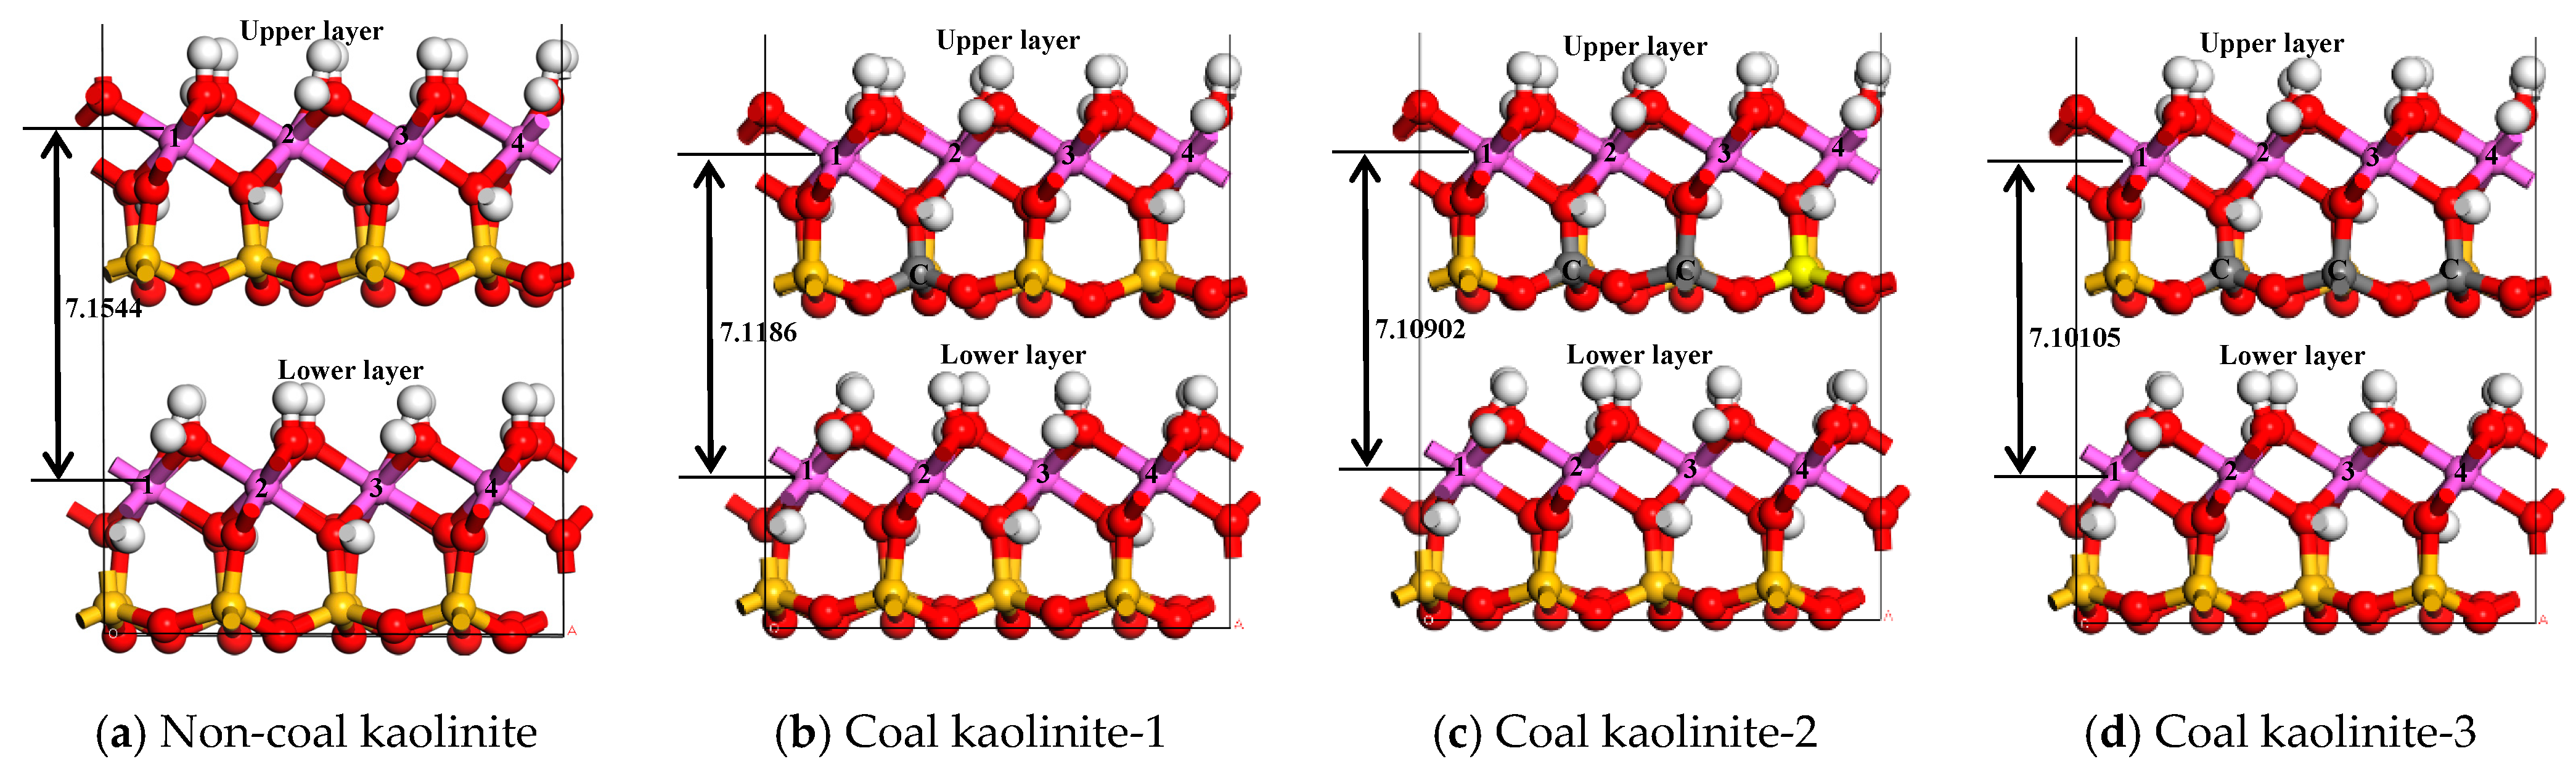
3.3. Interplanar Spacing of Kaolinite
4. Conclusions
Author Contributions
Funding
Acknowledgments
Conflicts of Interest
Abbreviation
| BFGS: | Broyden–Fletcher–Goldfarb–Shanno; |
| CASTEP: | Cambridge Sequential Total Energy Package; |
| DFT: | Density Functional Theory; |
| DFT-D correction: | Density Functional Theory Dispersion correction; |
| FTIR: | Fourier Transform Infrared Spectroscopy; |
| GGA-PBE: | Generalized Gradient Approximation—Perdew–Burke–Ernzerhof; |
| GGA-RPBE: | Generalized Gradient Approximation—Revised Perdew–Burke–Ernzerhof; |
| GGA-PW91: | Generalized Gradient Approximation—Perdew Wang 91; |
| GGA-WC: | Generalized Gradient Approximation—Wu and Cohen; |
| GGA-PBESOL: | Generalized Gradient Approximation—Perdew et al., 2008; |
| HKL: | Crystal surface index, such as (001), (111); LDA-CA-PZ: Local Density Approximation—Ceperley and Alder, 1980; |
| SEM: | Scanning Electron Microscopy; |
| XRD: | X-ray diffraction; |
| XPS: | X-ray Photoelectron Spectroscopy; |
| XRF: | X-ray Fluorescence Spectrometry. |
References
- Qi, X.; Kuang, Y.L. Effects of clay minerals on the surface properties of coal slime. Coal Sci. Technol. 2013, 41, 126–128. [Google Scholar]
- Qi, X.; Kuang, Y.L. Clay Mineral Affected to Treatment of Coal Slurry Water. Coal Eng. 2013, 2, 102–105. [Google Scholar]
- Han, Y.H. Quantum Chemistry Study on the Surface Properties and Dispersion of Kaolinite and Montmorillonite. Ph.D. Thesis, China University of Science and Technology, Beijing, China, 2017. [Google Scholar]
- Yu, Y.X. The Study on Interparticle Interaction and the Effect on Coal Flotation. Ph.D. Thesis, China University of Science and Technology, Beijing, China, 2018. [Google Scholar]
- Xi, P.; Liu, W.L.; Han, Y.H. Study on the mechanism of coal pyrite crystal lattice defects and floatability. J. China Coal Soc. 2016, 41, 997–1003. [Google Scholar]
- Xi, P.; Liu, W.L.; Yang, Z.Y. Quantum chemistry investigation on influence of carbon atom adsorption in carbon material to the coal pyrite hydrophobicity. J. China Coal Soc. 2017, 42, 1290–1296. [Google Scholar]
- Xi, P.; Ma, R.X.; Liu, W.L. Research on the effect of carbon defects on the hydrophilicity of coal pyrite surface from the insight of quantum chemistry. Molecules 2019, 24, 2285. [Google Scholar] [CrossRef] [Green Version]
- Xi, P.; Shi, C.S.; Yan, P.K. DFT study on the influence of sulfur on the hydrophobicity of pyrite surfaces in the process of oxidation. App. Sur. Sci. 2019, 466, 964–969. [Google Scholar] [CrossRef]
- Boussemghoune, M.; Chikhi, M.; Ozay, Y.; Guler, P. The investigation of organic binder effect on morphological structure of ceramic membrane support. Symmetry 2020, 12, 770. [Google Scholar] [CrossRef]
- Hong, H.L.; Tie, L.Y.; Min, X.M. Surface chemistry of kaolinite by quantum chemistry calculations. J. Wuhan Univ. Technol. 2005, 27, 25–29. [Google Scholar]
- Zhang, C.; Song, K.H.; Wang, X. Quantum chemical study of intercalation of water molecules in kaolinite. J. Mol. Sci. 2013, 29, 134–141. [Google Scholar]
- Han, Y.H.; Liu, W.L.; Chen, J.H. DFT simulation of the adsorption of sodium silicate species on kaolinite surfaces. App. Surf. Sci. 2016, 370, 403–409. [Google Scholar] [CrossRef]
- Tunega, D.; Bucko, T.; Zaoui, A. Assessment of ten DFT methods in predicting structure of sheet silicates: Importance of dispersion corrections. J. Chem. Phys. 2012, 137, 1–9. [Google Scholar] [CrossRef] [PubMed]
- Zhang, G.F.; Feng, Q.M.; Lu, Y.P. Relation between crystallography properties and surface characteristics of kaolinite and its floatability. Nonferrous Met. 2001, 2, 22–25. [Google Scholar]
- Han, Y.H.; Liu, W.L.; Zhou, J. Interactions between kaolinite Al-OH surface and sodium hexametaphosphate. App. Surf. Sci. 2016, 387, 759–765. [Google Scholar] [CrossRef]
- Han, Y.H.; Liu, W.L.; Chen, J.H. Adsorption mechanism of hydroxyl calcium on two kaolinite (001) surface. J. China Coal Soc. 2016, 41, 743–750. [Google Scholar]
- Segall, M.D.; Lindan, P.J.D.; Probert, M.J. First-principles simulation: Ideas, illustrations and the CASTEP code. J. Phys. Condens. Matter 2002, 14, 2717–2744. [Google Scholar] [CrossRef]
- Vanderbilt, D. Soft self-consistent pseudopotentials in a generalized eigenvalue formalism. Phys. Rev. B. 1990, 4, 7892–7895. [Google Scholar] [CrossRef]
- Tkatchenko, A.; Scheffler, M. Accurate Molecular Van Der Waals Interactions from Ground-State Electron Density and Free-Atom Reference Data. Phys. Rev. Lett. 2009, 102, 1–4. [Google Scholar] [CrossRef] [Green Version]
- Pfrommer, B.; Côté, M.; Louie, S.; Cohen, M. Relaxation of crystals with the quasi-Newton method. J. Comput. Phys. 1997, 131, 233–240. [Google Scholar] [CrossRef] [Green Version]
- Wang, X.Y.; Huang, Y.J.; Pan, Z.G.; Wang, Y.X.; Liu, C.Q. Theoretical investigation of lead vapor adsorption on kaolinite surfaces with DFT calculation. J. Hazard Matter 2015, 295, 43–54. [Google Scholar] [CrossRef]
- Hu, P.W. Basic Research on Kaolinite based Conductive Mineral Materials. Ph.D. Thesis, Central South University, Changsha, China, 2012. [Google Scholar]
- Chen, W.X. Clay-Stone of Kaolinite in the Perma-Carboniferous of Wester Shandong: Characteristics, Occurrence of Fe and Ti. Master’s Thesis, Shandong University of Science and Technology, Qingdao, China, 2004. [Google Scholar]
- Tian, Y.X.; Huang, S.P.; Wang, W.C. Molecular dynamics simulation of the intercalation of kaolinite with urea and water. J.B. Univ. Chem. Technol. 2007, 34, 599–603. [Google Scholar]
- Cheng, H.F. Study on Intercalation and Exfoliation of Kaolinite and its Application in the Rubber Composite. Ph.D. Thesis, China University of Science and Technology, Beijing, China, 2011. [Google Scholar]
- He, Q. Study of gold-bearing electronic structure and flotation behavior. Master’s Thesis, Guangxi University, Nanning, China, 2015. [Google Scholar]
- Liu, P. Crystal Point Defect; Science Press: Beijing, China, 2010. [Google Scholar]
- Farmer, V.C. Differing effects of particle size and shape in the infrared and Roman spectra of kaolinite. Clay Min. 1998, 33, 601–604. [Google Scholar] [CrossRef]
- Frost, R.L.; Locos, O.B.; Kristóf, J.; Kloprogge, J.T. Infrared spectroscopic study of potassium and cesium acetate-intercalated kaolinite. Vin. Spectrosc. 2001, 26, 33–42. [Google Scholar] [CrossRef]
- Frost, R.L. Combination bands in the infrared spectroscopy of kaolinites-A drift spectroscopic study. Clays Clay Min. 1998, 46, 466–477. [Google Scholar] [CrossRef]
- Yang, Z.Q.; Zhao, X.Y.; Zhang, L. Infra-red spectra analysis for clay minerals of kaolinite. Exp. Pet. Geol. 1988, 10, 60–66. [Google Scholar]
- Wang, Y.G. Study on the degree of crystallinity of kaolinite in gangue. Shanxi Chem. Ind. 2014, 151, 19–22. [Google Scholar]
- Xu, N.C.; Shen, J.L.; Luo, H.Y. Analysis for crystallinity of kaolinites by X-ray diffractometer and infrared spectroscopy. Resour. Surv. Env. 2014, 35, 153–156. [Google Scholar]
- Daniel, B.; Konstantin, S.S.; Ekkehard, G. Vibrational spectra and structure of kaolinite: A computer simulation study. J. Phys. Chem. B. 2000, 104, 9210–9217. [Google Scholar]
- Zhu, B.L.; Qi, C.L.; Zhang, Y.H.; Bisson, T.; Xu, Z.H.; Fan, Y.J.; Sun, Z.X. Synthesis, characterization and acid-base properties of kaolinite and metal (Fe, Mn, Co) doped kaolinite. Appl. Clay Sci. 2019, 179, 105–138. [Google Scholar] [CrossRef]
- Moulder, J.F.; Stickle, W.F.; Sobol, P.E.; Bomben, K.D. Handbook of X-Ray Photo-Electron Spectroscopy; Physical Electronics Inc.: Chanhassen, MN, USA, 1995. [Google Scholar]
- Rumble, J.R., Jr.; Bickham, D.M.; Powell, C.J. The NIST X-ray Photoelectron Spectroscopy Database. Surf. Interface Anal. 1992, 19, 241–246. [Google Scholar] [CrossRef]
- Qin, S.; Wang, C.Q. Basis of Mineralogy; Peking University Press: Beijing, China, 2006. [Google Scholar]


| Compound | K-1 | CK-2 | CK-3 | CK-4 |
|---|---|---|---|---|
| SiO2/% | 54.76 | 54.10 | 54.05 | 52.17 |
| Al2O3/% | 43.16 | 44.60 | 44.41 | 45.32 |
| TiO2/% | 0.69 | 0.43 | 0.46 | 0.68 |
| Fe2O3/% | 0.56 | 0.18 | 0.21 | 0.58 |
| P2O5/% | 0.01 | 0.01 | 0.02 | 0.40 |
| CaO/% | 0.03 | 0.09 | 0.37 | 0.26 |
| Na2O/% | 0.09 | 0.02 | 0.06 | 0.19 |
| MgO/% | 0.16 | 0.04 | 0.09 | 0.13 |
| Exchange–Correlation Function | Cutoff Energy/eV | Interplanar Spacing | Error Ratio/% |
|---|---|---|---|
| GGA-PBE | 400 | 7.0503 | 1.45 |
| GGA-RPBE | 400 | 7.1544 | 0.00 |
| GGA-PW91 | 400 | 7.4109 | 3.59 |
| GGA-WC | 400 | 7.4250 | 3.78 |
| GGA-PBESOL | 400 | 7.3457 | 2.67 |
| LDA-CA-PZ | 400 | 6.8943 | 3.63 |
| GGA-RPBE | 300 | 7.2197 | 0.91 |
| GGA-RPBE | 350 | 7.1974 | 0.60 |
| GGA-RPBE | 450 | 7.1224 | 0.45 |
| GGA-RPBE | 500 | 7.1074 | 0.65 |
| Experimental value | 7.1543 | ||
| Reference Value/cm−1 [35,36] | Vibrational Frequencies/cm−1 | Proposed Assignment | |||
|---|---|---|---|---|---|
| K-1 | CK-2 | CK-3 | CK-4 | ||
| 3695 | 3695 | 3694 | 3694 | 3694 | OH stretching vibration |
| 3670 | 3669 | 3669 | 3669 | 3669 | OH stretching vibration |
| 3651 | 3652 | 3652 | 3652 | 3651 | OH stretching vibration |
| 3621 | 3620 | 3619 | 3620 | 3620 | OH stretching vibration |
| 1114 | 1114 | 1115 | 1115 | 1114 | Si-O-Si symmetric stretch |
| 1034 | 1032 | 1033 | 1033 | 1034 | Si-O-Si antisymmetric stretch |
| 1012 | 1009 | 1009 | 1010 | 1011 | Si-O-Si antisymmetric stretch |
| 937 | 937 | 938 | 937 | 938 | OH bending vibration |
| 915 | 913 | 913 | 913 | 914 | OH bending vibration |
| 794 | 790 | 789 | 789 | 790 | Si translation |
| 755 | 755 | 755 | 755 | 756 | Si-O stretching vibration |
| 697 | 700 | 700 | 699 | 700 | Si-O stretching vibration |
| 685 | 685 | 685 | 686 | 677 | Al-OH vertical vibration |
| 540 | 539 | 539 | 540 | 541 | O-Si-O bend + CO stretch |
| 473 | 468 | 470 | 471 | 471 | O-C-O bend + CO stretch |
| 432 | 431 | 431 | 431 | 431 | O-Al-O bend |
| Surface | The Substituted Atom | ΔE/kJ/mol |
|---|---|---|
| Si-O-(001) | Si | 258.12 |
| O | 660.01 | |
| Al-O-(001) | O | 469.92 |
| Aluminum Atomic Number | Aluminum Atomic Coordinates | Non-Coal Kaolinite | Coal Kaolinite-1 | Coal Kaolinite-2 | Coal Kaolinite-3 |
|---|---|---|---|---|---|
| 1 | ZU/Å | −2.64081 | −2.66453 | −2.71756 | −2.55374 |
| ZL/Å | −9.78855 | −9.77141 | −9.77409 | −9.70512 | |
| ΔZ1/Å | 7.14774 | 7.10688 | 7.05653 | 7.15138 | |
| 2 | ZU/Å | −2.63644 | −2.69702 | −2.75039 | −2.64026 |
| ZL/Å | −9.79749 | −9.80136 | −9.79238 | −9.76588 | |
| ΔZ2/Å | 7.16105 | 7.10434 | 7.04199 | 7.12562 | |
| 3 | ZU/Å | −2.64081 | −2.65630 | −2.63457 | −2.83543 |
| ZL/Å | −9.78855 | −9.78368 | −9.78957 | −9.78204 | |
| ΔZ3/Å | 7.14774 | 7.12738 | 7.15500 | 6.94661 | |
| 4 | ZU/Å | −2.63644 | −2.63728 | −2.60317 | −2.59814 |
| ZL/Å | −9.79749 | −9.77303 | −9.78574 | −9.77874 | |
| ΔZ4/Å | 7.16105 | 7.13575 | 7.18257 | 7.18060 | |
| ΔZ | 7.15440 | 7.11859 | 7.10902 | 7.10105 | |
© 2020 by the authors. Licensee MDPI, Basel, Switzerland. This article is an open access article distributed under the terms and conditions of the Creative Commons Attribution (CC BY) license (http://creativecommons.org/licenses/by/4.0/).
Share and Cite
Xi, P.; Ma, R.; Liu, W. Study on the Crystal Structure of Coal Kaolinite and Non-Coal Kaolinite: Insights from Experiments and DFT Simulations. Symmetry 2020, 12, 1125. https://doi.org/10.3390/sym12071125
Xi P, Ma R, Liu W. Study on the Crystal Structure of Coal Kaolinite and Non-Coal Kaolinite: Insights from Experiments and DFT Simulations. Symmetry. 2020; 12(7):1125. https://doi.org/10.3390/sym12071125
Chicago/Turabian StyleXi, Peng, Ruixin Ma, and Wenli Liu. 2020. "Study on the Crystal Structure of Coal Kaolinite and Non-Coal Kaolinite: Insights from Experiments and DFT Simulations" Symmetry 12, no. 7: 1125. https://doi.org/10.3390/sym12071125