3.2. FA of Betula Pendula in Urban Territories
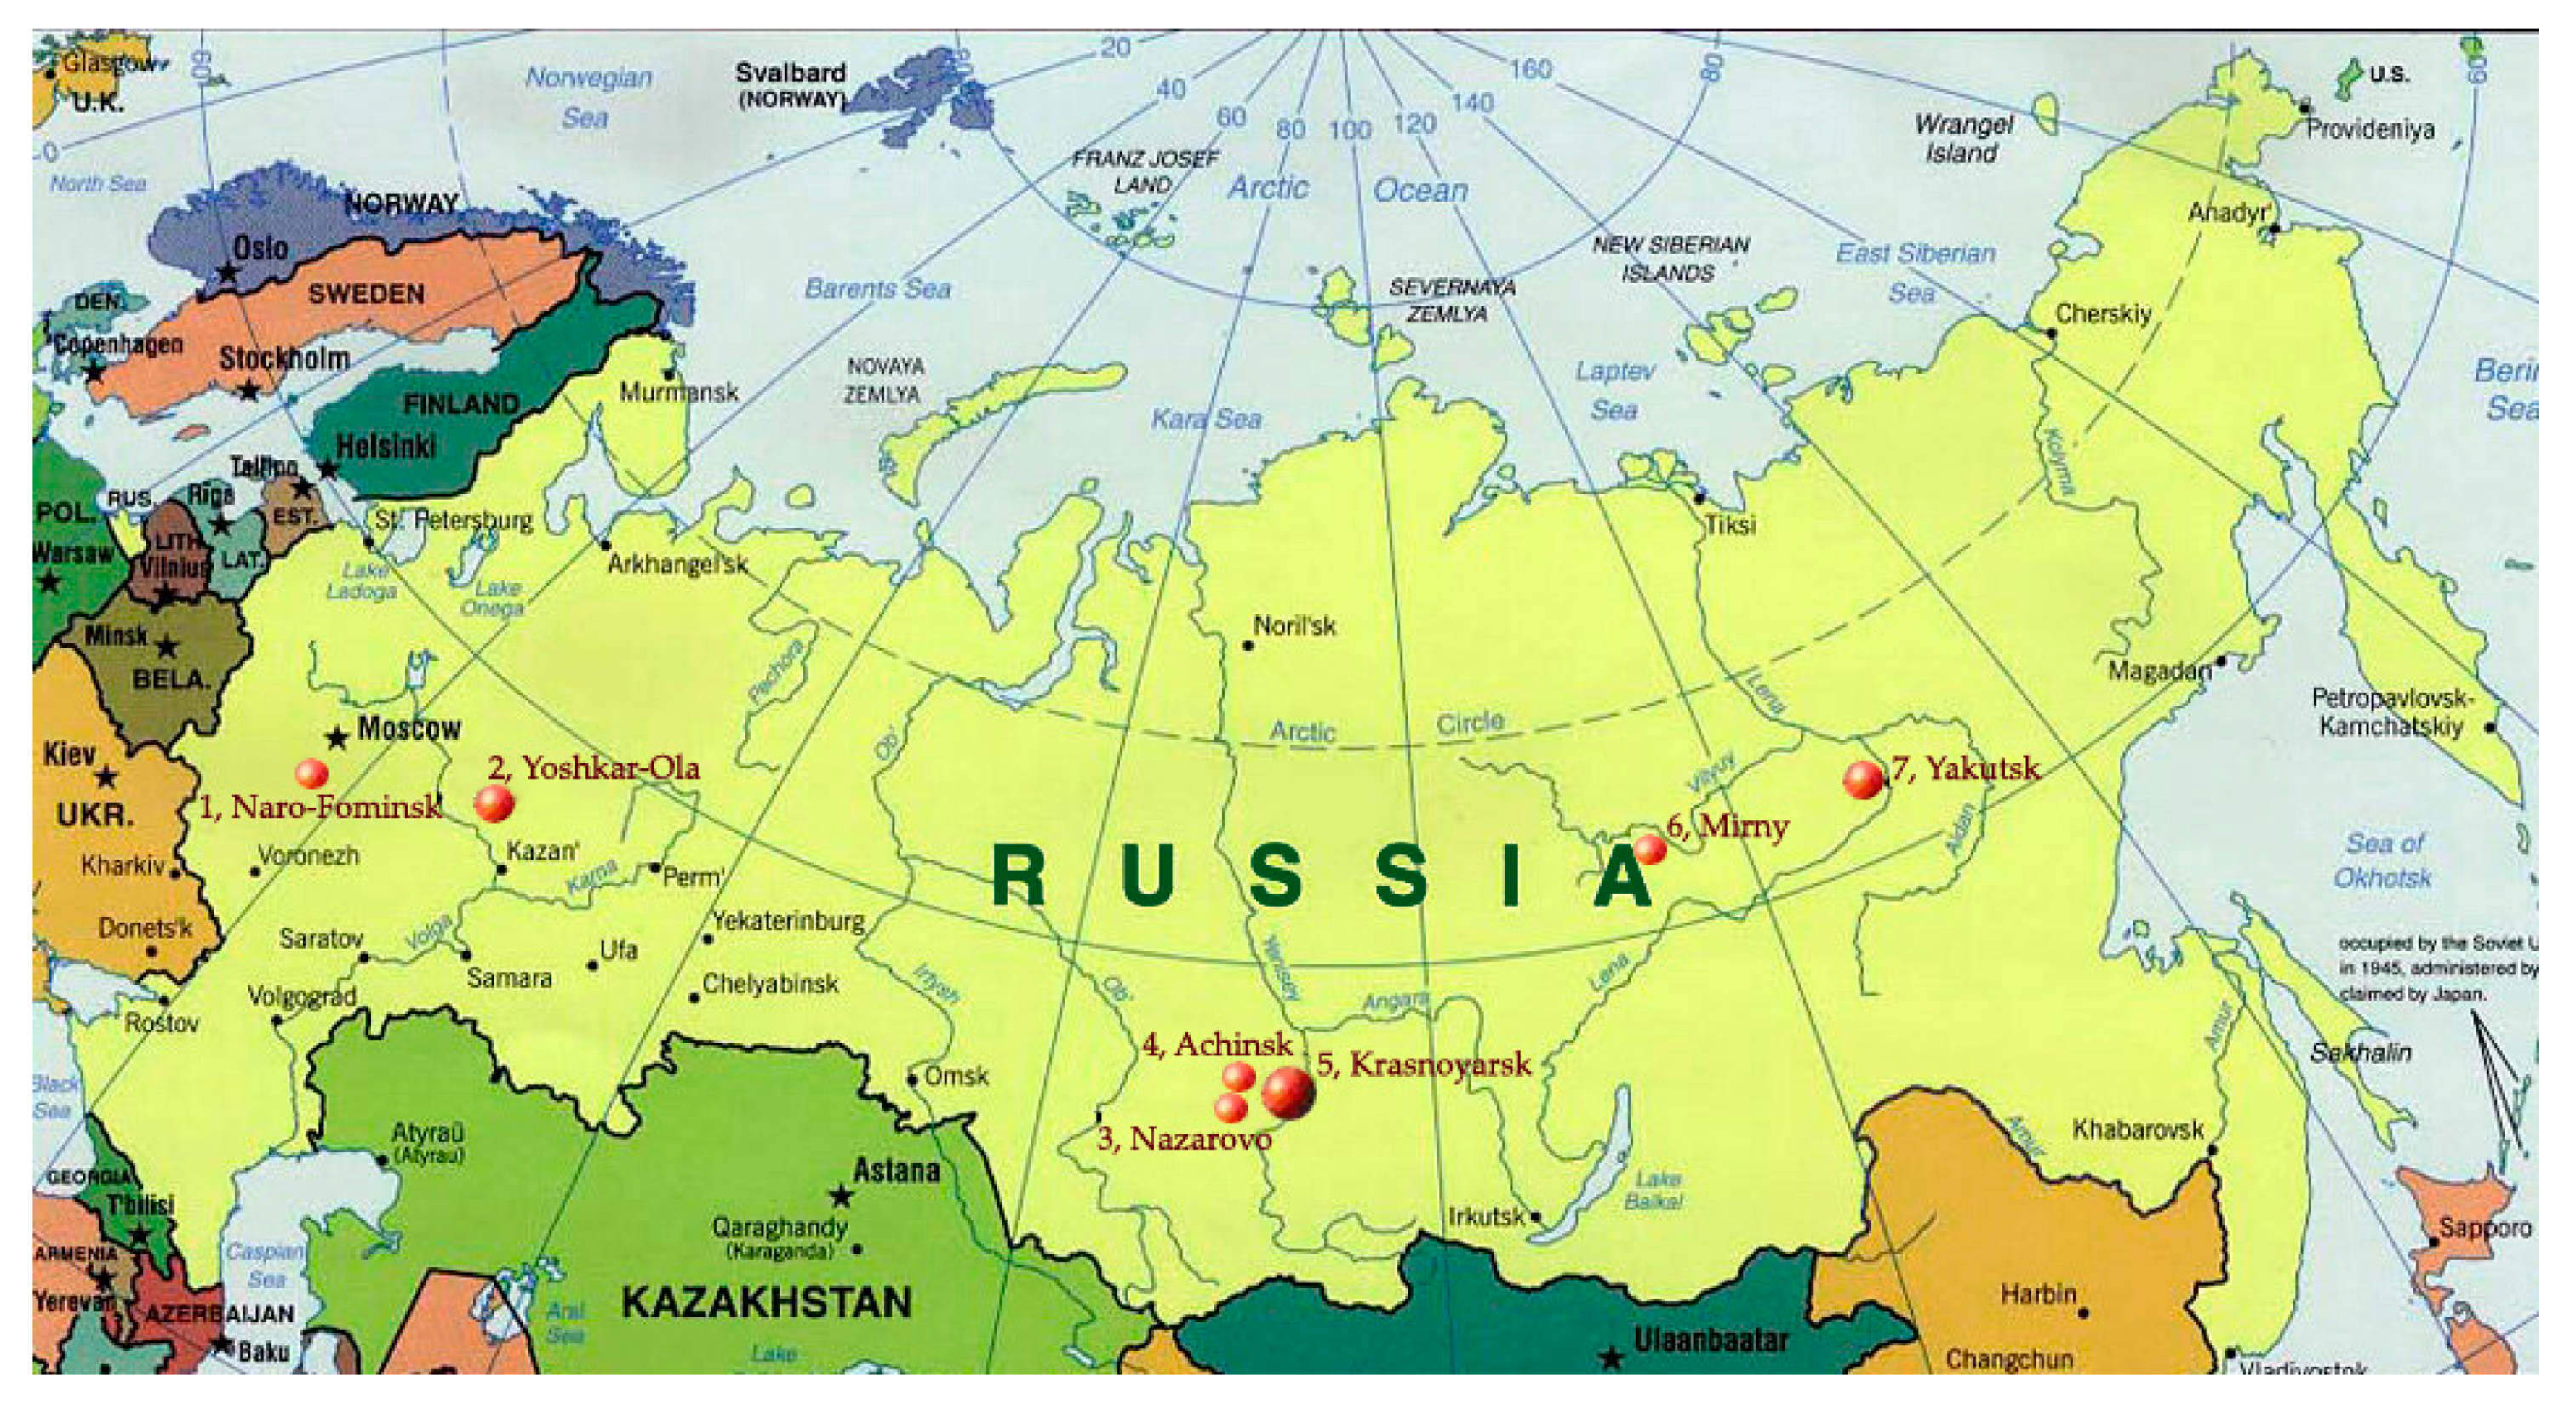
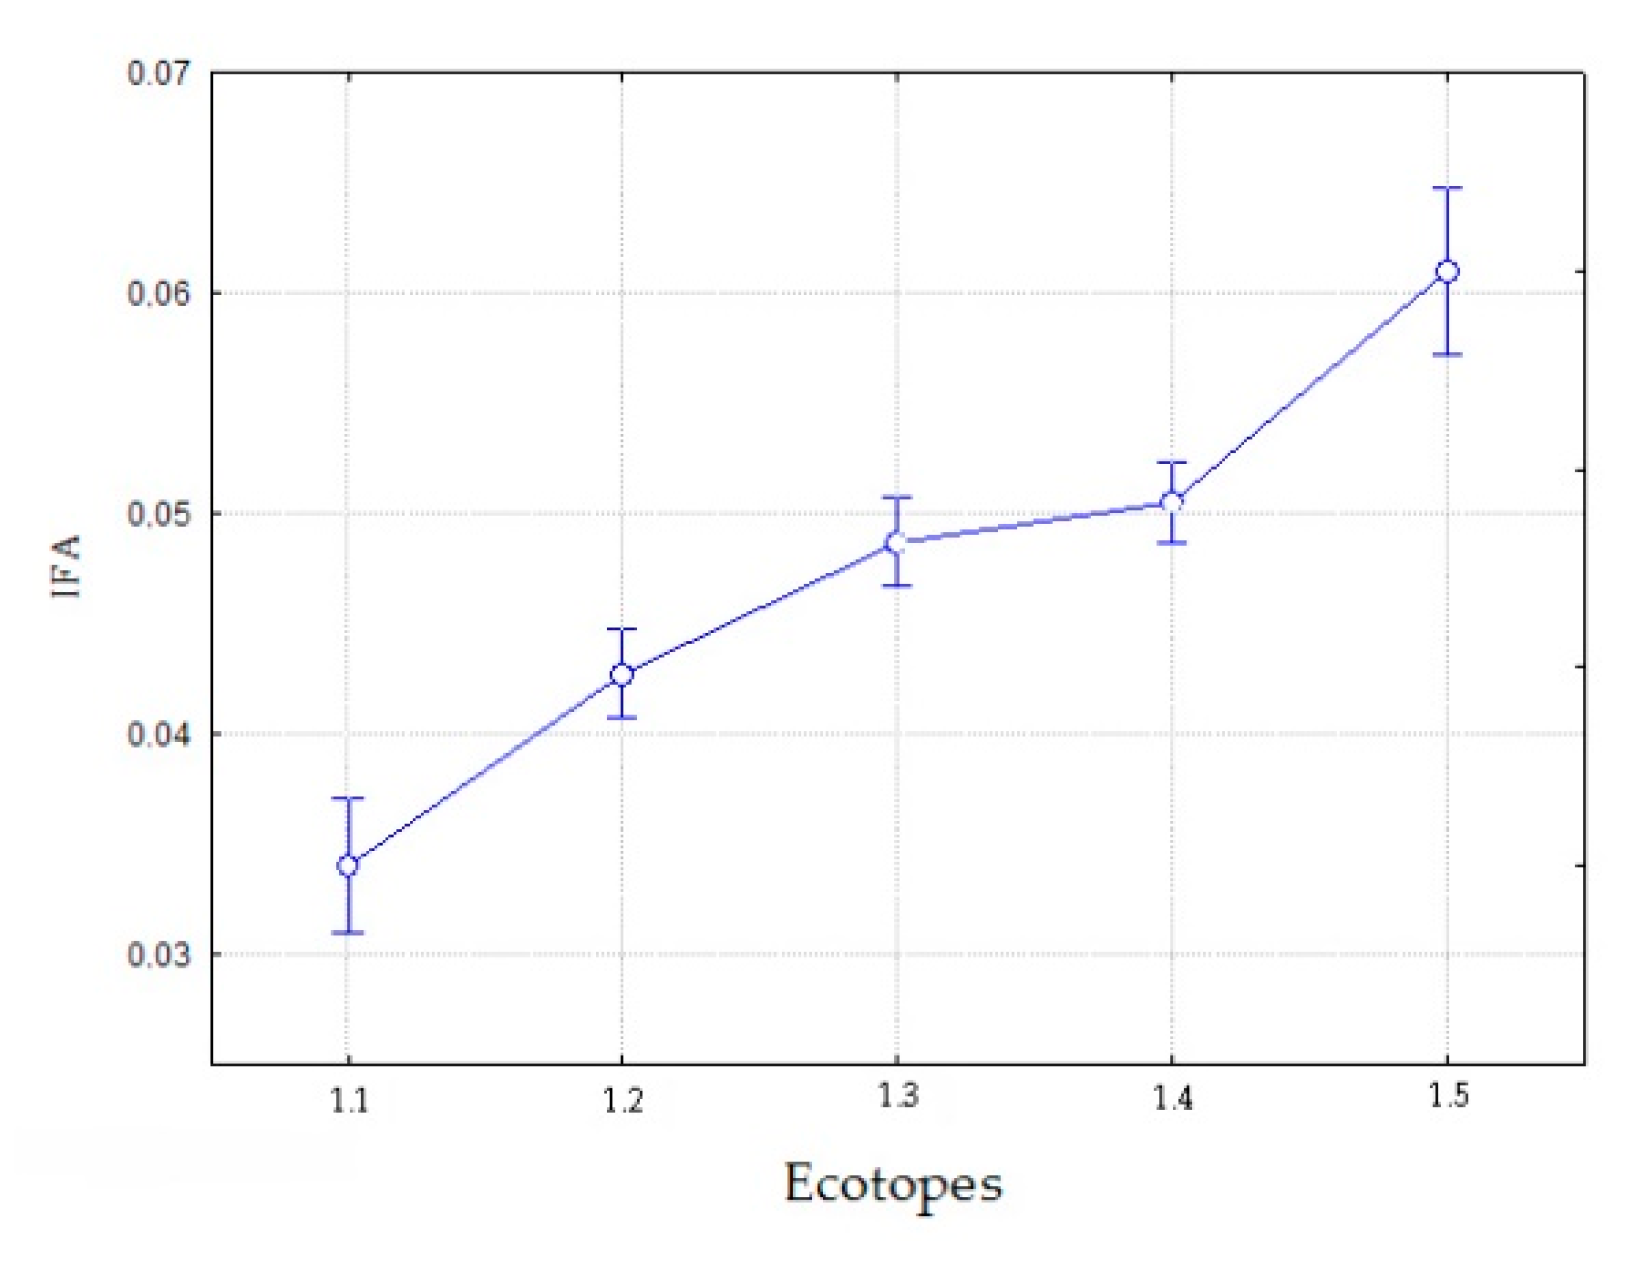
City 1: On the territory of Naro-Fominsk, a total of 2800 leaves of
B. pendula from 28 sites were analyzed. These sites can be divided into five locations with respect to the nature of anthropogenic impact. The lowest IFA of 0.038 was recorded in the recreation area of the city (location 1.1); a somewhat higher IFA was noted in the old center of the city at some distance from the roadway (location 1.2). Significantly higher IFA figures were noted at locations 1.3–1.4, in proximity of industrial enterprises (
Figure 4,
Table 2). The least satisfactory condition was observed in the south-eastern part of the city, where the main industrial facilities are concentrated and there is a high traffic load; the average IFA there was 0.050, varying within the location in the range of 0.049–0.054. The highest figures were observed in
B. pendula trees growing along the federal highway (location 1.5). One-way ANOVA showed significance of the ecotope factor, F = 4.22,
p < 0.001, with the Scheffe test giving significant differences between the studied areas of the city (
Table 2). Thus,
B. pendula growing in the center of the city had relatively low IFA figures, while the greatest degree of ontogeny destabilization is observed in the south-eastern part of the city, due to a high traffic load and location of the most of industrial enterprises; also, it can be associated with the predominance of north-westerly winds.
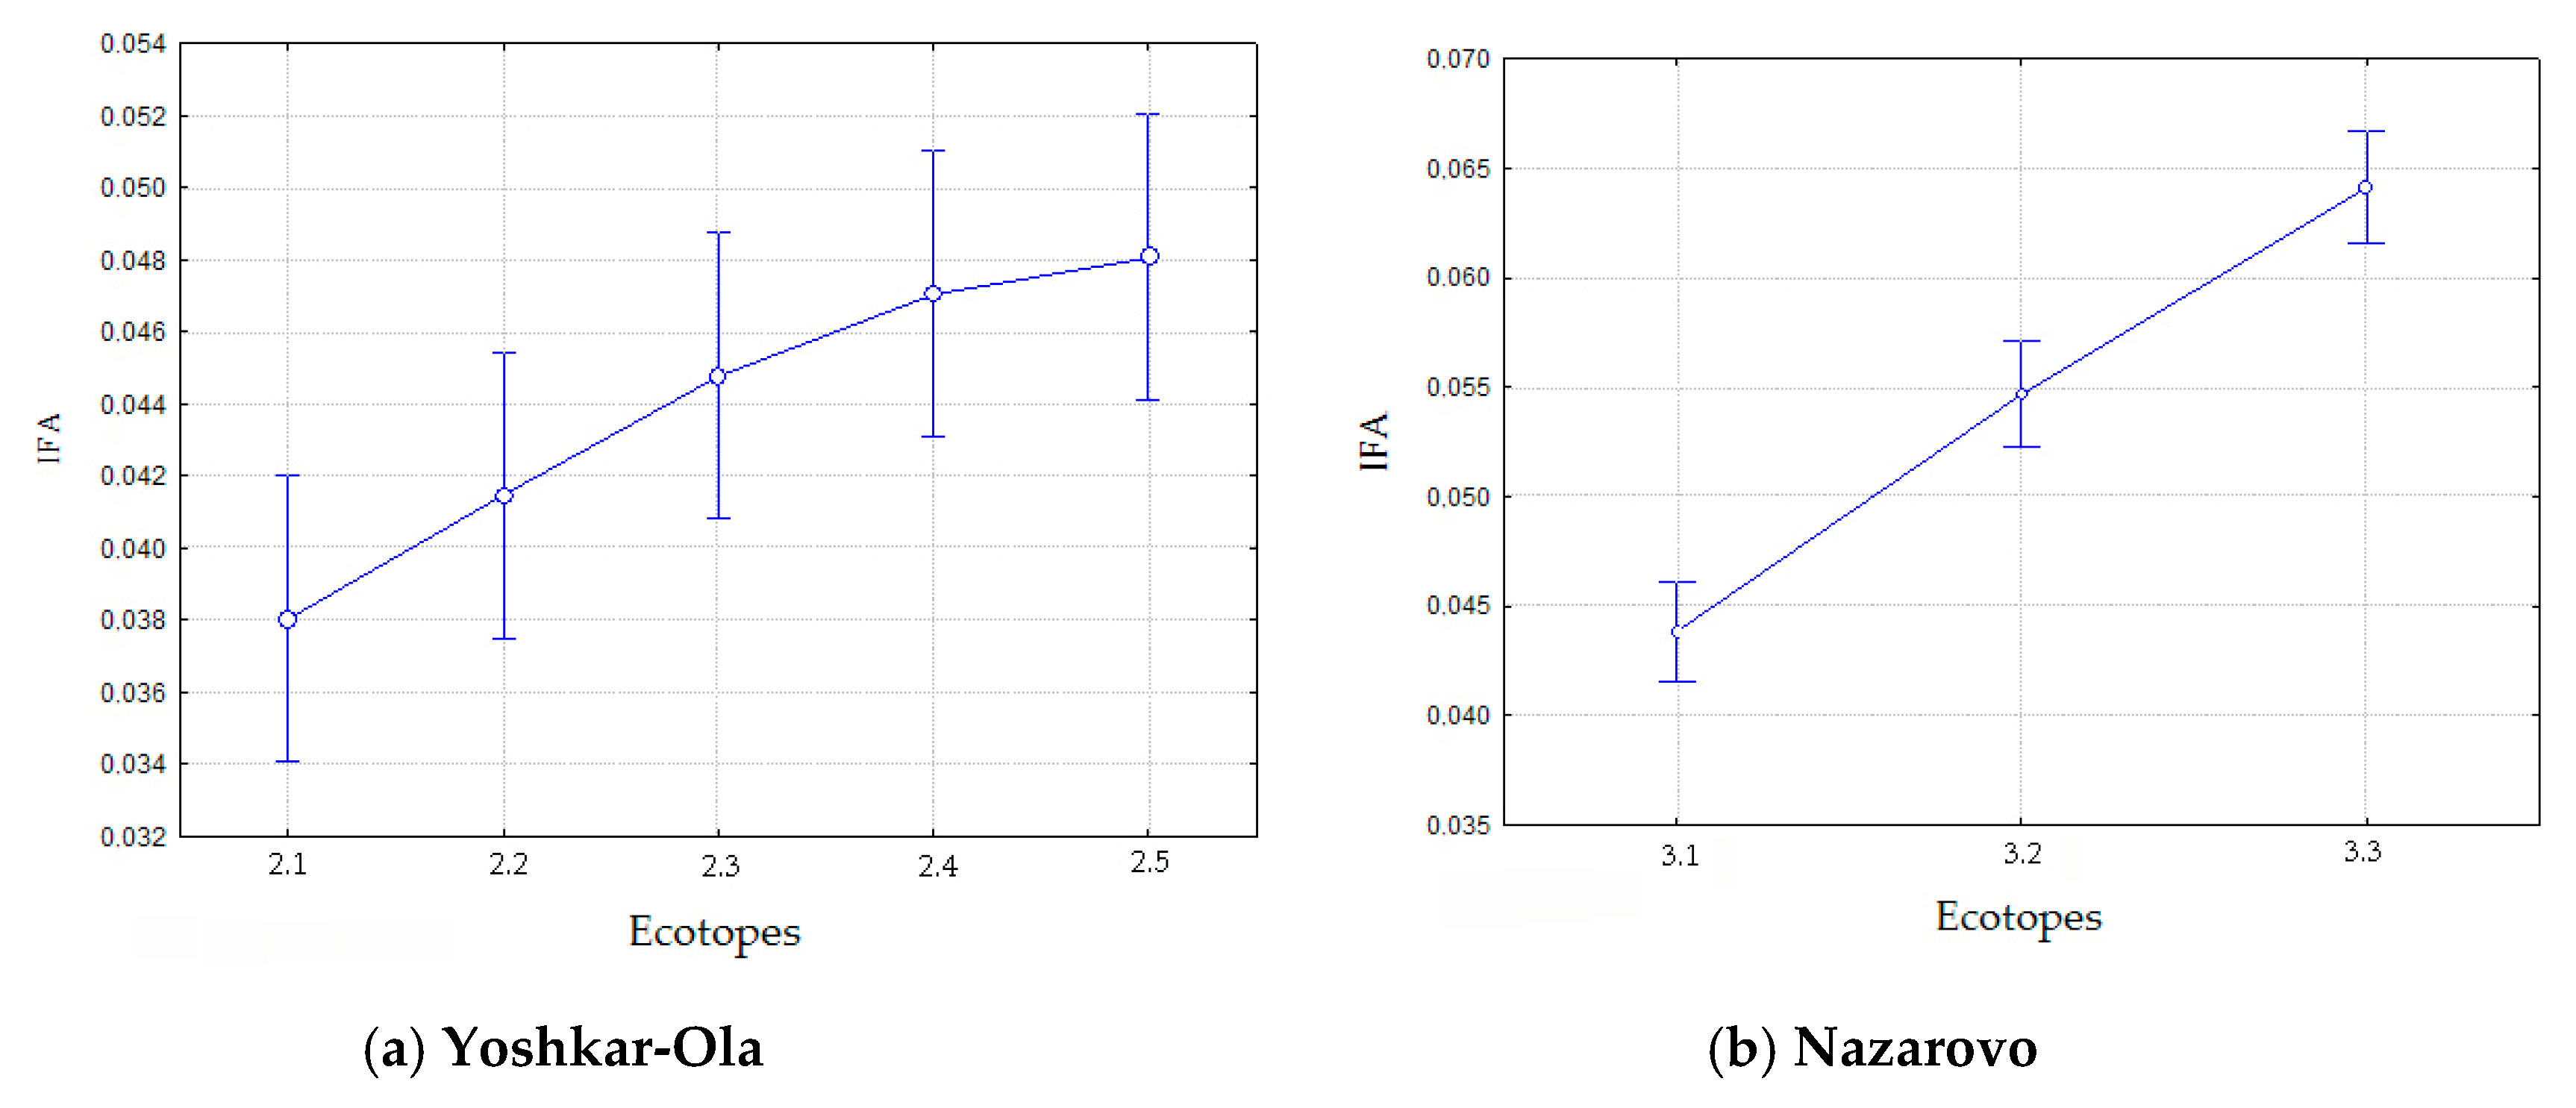
City 2: The analysis of IFA of
B. pendula in Yoshkar-Ola in 2019 revealed a dependence of its increase on the increase in anthropogenic pressure (F = 4.42,
p < 0.01) (
Table 2 and
Table 3). During the four years of the study, IFA of
B. pendula in the site 2.1 varied within 0.036–0.039. These trees grow in a protected recreational forest within the city limits, but the level of pollution from motor vehicles and industrial plants is minor [
88]. IFA of the trees found in a residential area in conditions of a weak traffic load and at a distance of 1 km from an enterprise in construction materials manufacture (site 2.2) varies within 0.037–0.041. IFA of the trees found in recreation areas (sites 2.3 and 2.4) indicate moderate developmental abnormalities in
B. pendula. These ecotopes are in the area moderately polluted with industrial and transport emissions. Despite being located in the area affected by an industrial enterprise and surrounding roads, the level of air pollution in the site 2.3 remains low, which was revealed by direct monitoring of the atmosphere [
89]. Judging by IFA,
B. pendula in the site 2.5 has moderate to significant developmental abnormalities. The registered maximal IFA most likely indicates a continuous impact of emissions not only of a chemical plant but also of motor vehicles.
The performed three-factor ANOVA revealed that the influence of environmental parameters on the developmental stability of the marked trees of
B. pendula in different years of the research is significant (
p < 0.001). Despite the weather fluctuations, we did not find a statistically significant effect of such a factor as the year of research on IFA (
p > 0.05). Note that the “tree” factor was not found to be significant in the marked trees, i.e., the FA level is not an individual characteristic but varies over years. Therefore, in 20 years, the environmental quality as determined by the value of the integrated index of the developmental stability of
B. pendula remained at the same level. The Scheffe test revealed significant differences between the groups in IFA of
B. pendula of the sites 2.1, 2.2, and 2.4, 2.5 (
p < 0.001). The analyses of atmosphere pollution by stationary posts (sites 2.1–2.4) also indicated minor fluctuations in toxicant emissions by year [
84,
85].
The assessment of the developmental stability of
B. pendula by its IFA in different districts of Yoshkar-Ola agrees with the data of the chemical analysis of the atmosphere [
88,
89] and other bioindication parameters of
B. pendula [
47].
City 3: On the territory of Nazarovo, we registered a significant variation in IFA of
B. pendula: 0.044–0.064 (
Table 2). The lowest IFA was registered in the site 3.1, which is characterized by a relatively low anthropogenic load; it is situated in the Chulym River valley, approximately 0.5–1 km from a housing estate and a road with a low traffic load. Significant abnormalities are registered on the site 3.2, which is associated with increased exposure to motor transport: At a distance of less than 800 m, there is a highway of regional importance and a garage block; besides, approximately 1.5 km away, a GRES (regional power station) is located, which also contributes to the deterioration of environmental quality. Samples collected at the edge of the industrial zone in the site 3.3 indicate a significant anthropogenic impact on the trees. IFA of
B. pendula in this case is 0.064, which is due not only to the impact of motor transport but also to emissions of adjacent industries. One-way ANOVA has shown that the F-test for ecotope was 74.9 with a high level of significance (
p < 0.001); the Scheffe test revealed significant differences between all three sites (
p < 0.001). Thus, the territory of Nazarovo in general is characterized by elevated levels of IFA. Presumably, it is connected with the long-term negative impact of anthropogenic sources of pollution and the fact that the GRES is operating on lignite.
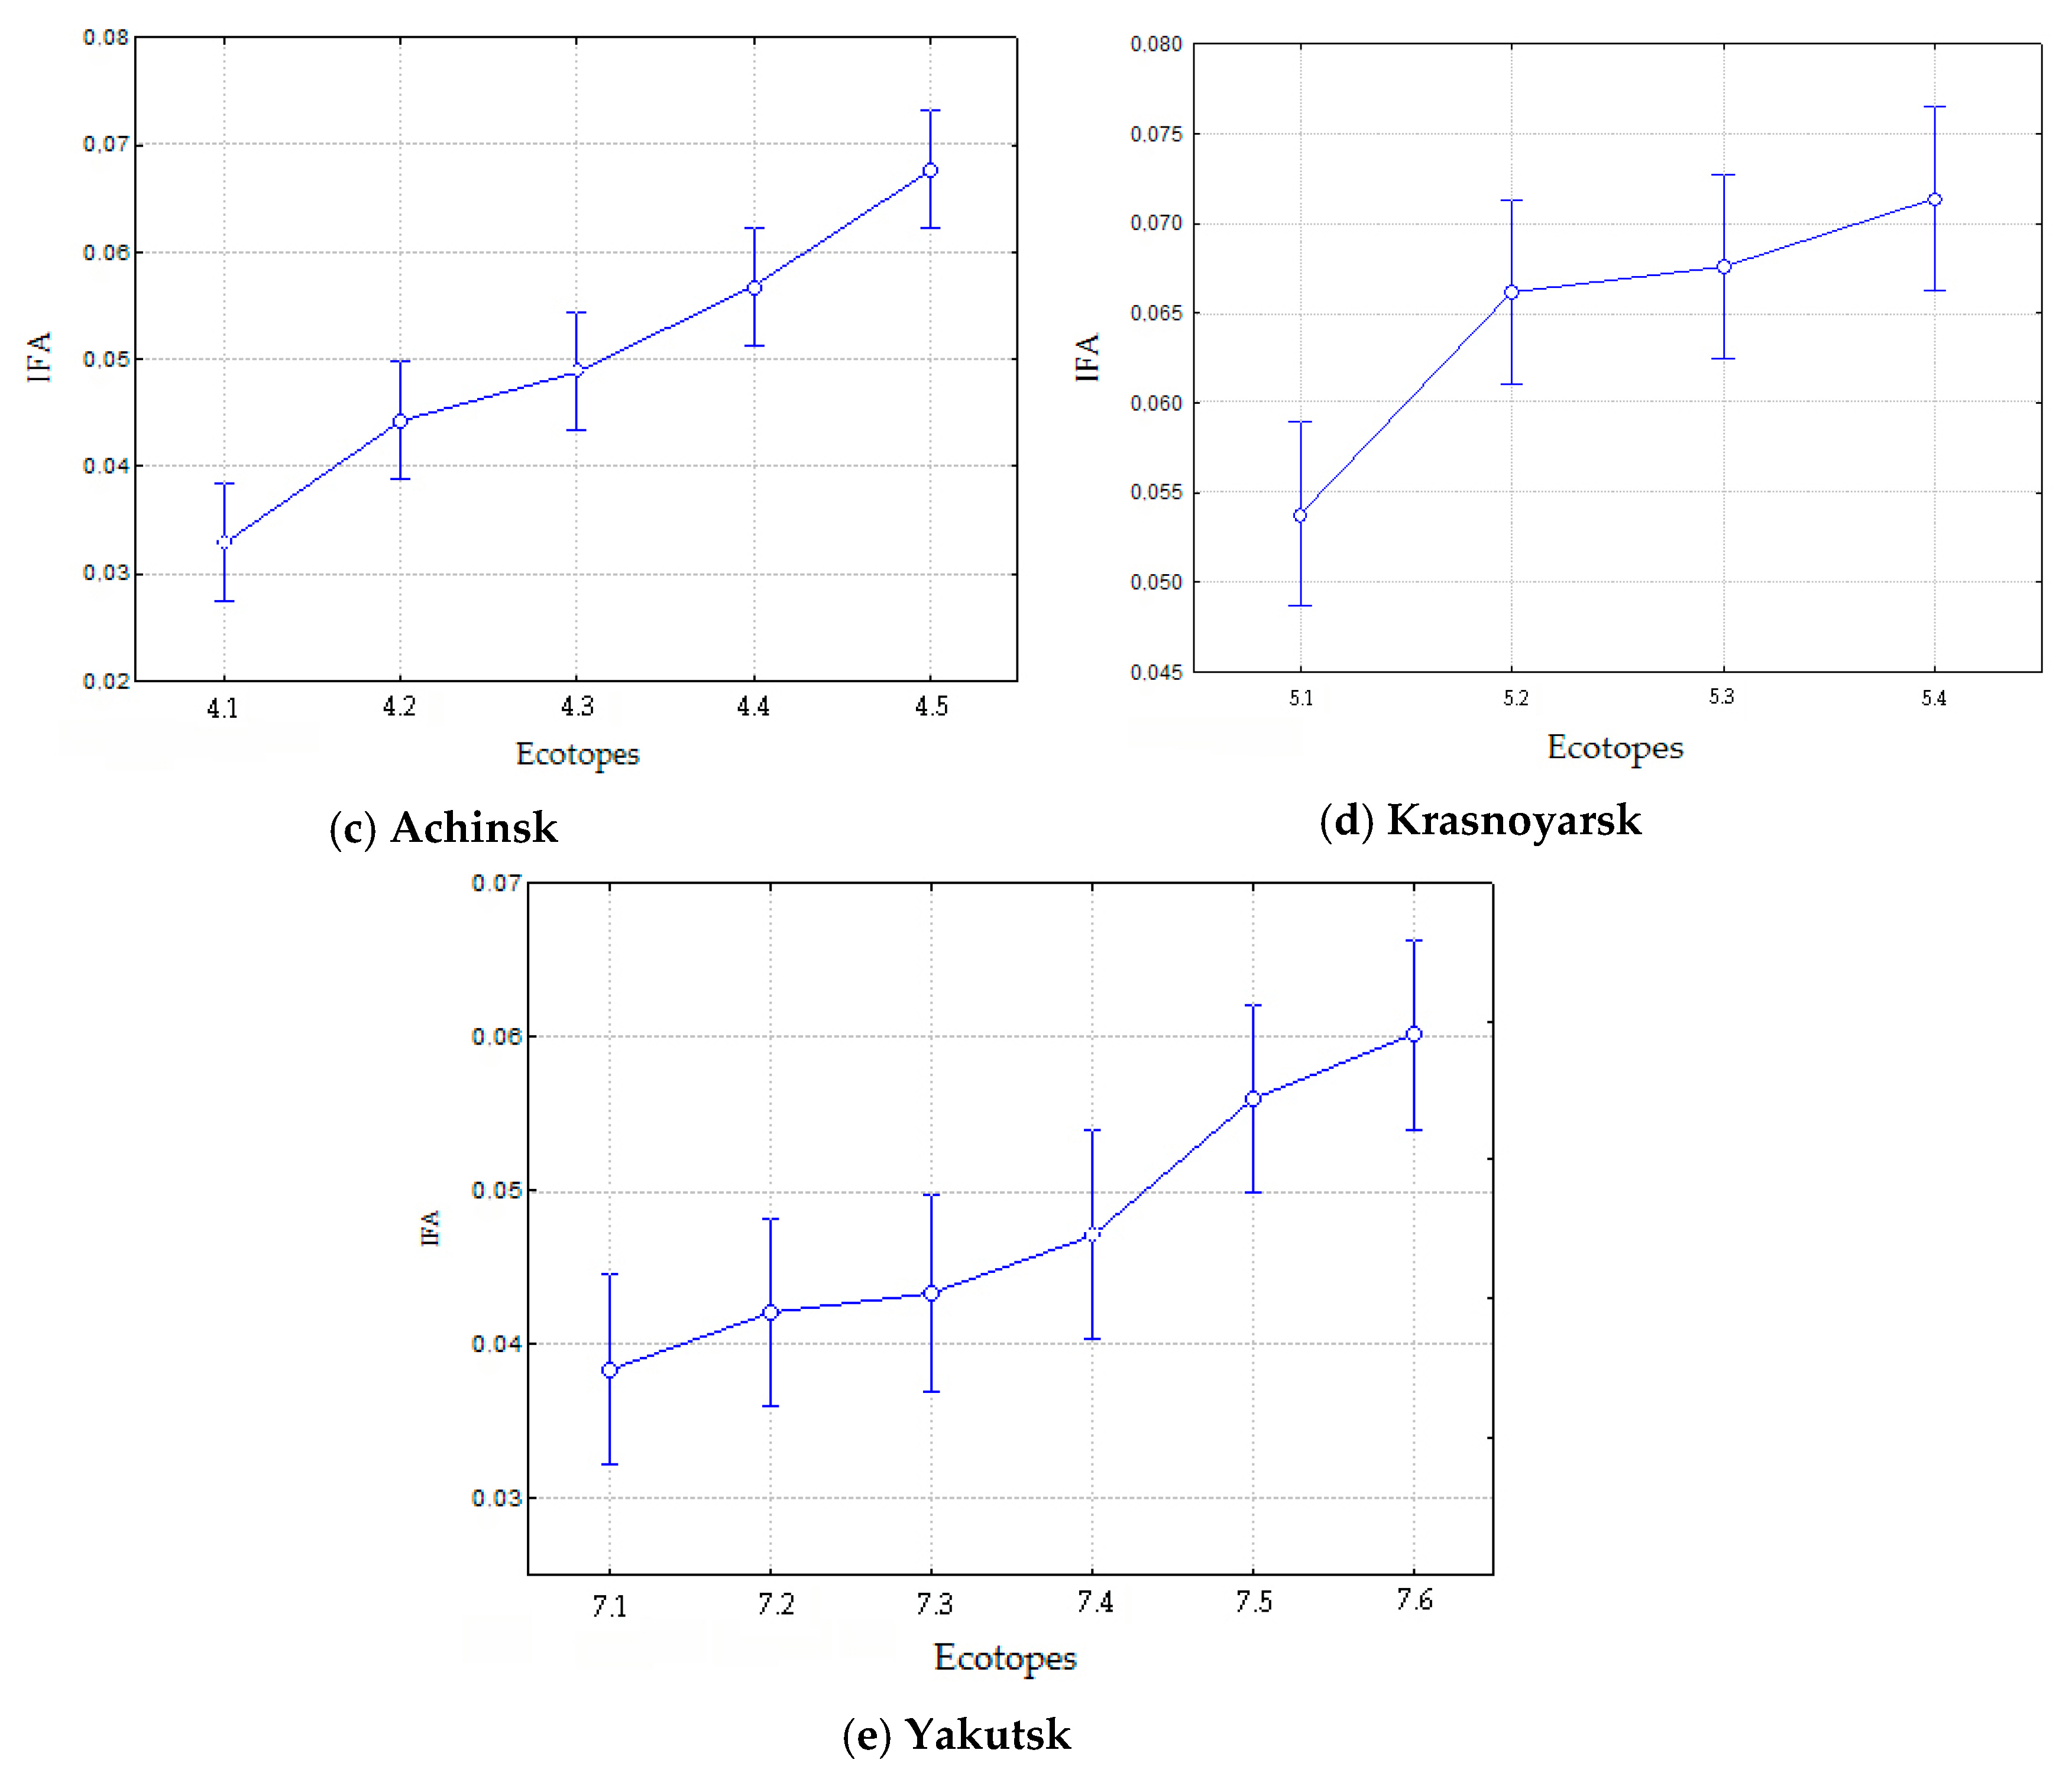
City 4: In the natural and anthropogenically transformed ecotopes of Achinsk, significant differences in IFA of
B. pendula leaves were found (
Table 2). For instance, in the background site (in a forest near Ozero Bol’shoe village), IFA was 0.032, and in individuals, it varied within 0.022–0.046. In the recreation area of Achinsk, IFA of
B. pendula leaves was 0.044, which indicates minor deviations in the development stability of the birch. In the residential area (site 4.3) of Achinsk, IFA is affected by the motor transport and the food industry enterprise. The IFA of
B. pendula leaves there is 0.049, and it is significantly higher than in the natural biotope. In the ecotope 4.4, IFA was 0.057, which is probably due to the heavier traffic and a close proximity to the southern industrial zone. The highest figures of IFA (0.068) were found in the area affected by the southern industrial zone of Achinsk (ecotope 4.5), where several heavy industry enterprises are operating. One-factor ANOVA showed, the same as with Yoshkar-Ola and Nazarovo, a high significance of the ecotope factor (F = 23.2,
p < 0.001), but the Scheffe test revealed that the differences between the sites 6.1 and 6.4 (
p < 0.05), 6.1 and 6.5 (
p < 0.001), and 6.2 and 6.5 (
p < 0.01) were statistically significant. Thus, on the territory of Achinsk, the IFA of
B. pendula in the areas of heavy traffic and industrial loads is significantly higher than in the natural biotope and recreation area. In general, in all the studied ecotopes of Achinsk, a negative effect of various environmental factors was found, mostly of the anthropogenic factor, because a large number of industrial enterprises are concentrated in a city with an area of 103 km
2.
City 5: In Krasnoyarsk, the IFA of
B. pendula leaves in the studied areas varied within 0.054–0.071. Even in the control site, which lies within the recreation area of the city, the IFA of
B. pendula was 0.054, which is significantly higher than in the natural habitats of the region, for example, in the vicinity of Ozero Bol’shoe village, which is located 140 km away (
Table 2). Site 5.1 (Tatyshev Island) is located within the city limits and is actively used by the Krasnoyarsk residents for sporting events, dog competitions, picnics, driving lessons, etc. Thus, the flora of the island experiences a heavy anthropogenic load, and the presence of motor vehicles increases general and gas pollution [
104].
Three other sites within Krasnoyarsk are arranged along the gradient of increasing traffic and industrial load, from low (site 5.2) to high (5.4). No significant differences were found between them, and all three points are characterized by the highest IFA figures among the examined cities. One-way ANOVA showed the significance of the ecotope factor (p < 0.001). Note that all three sites in the residential areas of the city were different from the recreation area, but with varying degrees of statistical significance, which rose from site 5.2 to site 5.4 (Scheffe test respectively: p < 0.05, p < 0.01, p < 0.001).
City 6: On the territory of Mirny (Western Yakutia), the leaves were collected in five sites: In the city recreation area, in the city center (in the yards and in wooden building quarters), and also in the northern and southern outskirts. The IFA ranged from 0.042 to 0.053, with differences between the sites both in separate years and in average data, in most cases, not reaching statistical significance, except for sites 6.4 and 6.5 (
Table 4,
Figure 5). In the northern part of the city, near the ore processing plant, IFA was significantly higher than in the recreation area (
p < 0.05), and in the southern part of the city it differed significantly from the sites 6.1 and 6.2 (
p < 0.001 and
p < 0.05, respectively). Multi-factor ANOVA revealed the significance of the effect of the ecotope factor at IFA (F = 4.13,
p < 0.001), and no significant differences between the years of research (
Table 2).
City 7: For assessment of the impact of the anthropogenic factor on the territory of Yakutsk,
B. pendula leaves collected in 5 sites in 2019 were examined; as a control, an undisturbed birch forest was chosen, where IFA was 0.038. The condition of
B. pendula in the recreation area of the city was studied on the territory of the Botanical Garden (site 7.2); the IFA there was somewhat higher than in the natural biotope, 0.042 (
Table 5). Perhaps, this is due to the fact that in the botanical garden, the birch experienced a negative impact of pests and diseases due to the proximity of cultivated plants infected by them. Previously, we analyzed the developmental stability figures of
B. pendula on the territory of Yakutsk and used IFA to divide the territory of the city into three zones. On this basis, in the present study, we selected four sites in the residential areas of Yakutsk from different zones of the city. Site 7.3 is in the zone of minor impact; there is a forest and some exurban plots nearby; traffic load is low; and the IFA in this zone was 0.043. Site 7.4 is in the zone of moderate impact; the IFA there was 0.047. Site 7.5 is in the central area of the city, with a high traffic load and near food industry enterprises; this is a zone of major negative impact, where the IFA was 0.056, which differs significantly from the natural habitat (
p < 0.01). The highest level of developmental instability in
B. pendula (0.060) was observed in an area that is being actively built up with high-rise apartment buildings. This area is characterized with a high traffic load, including trucks, and contamination with construction dust. This site significantly differs by IFA from the sites 7.1–7.3 (Scheffe test with
p < 0.05, 0.01, and 0.001, respectively). One-factor ANOVA showed significant differences in IFA by ecotopes (F = 7.72,
p < 0.001) (
Table 2).
To carry out a three-factor ANOVA of the long-term data, four sites from different zones of the city were selected (
Table 2); a significant effect of the environmental parameters on the developmental stability of
B. pendula in different years of the research was revealed (F = 19.6,
p < 0.001). Note that the generalized data for 3 years showed an even higher significance of differences: Site 7.5 was significantly different in IFA from sites 7.2–7.4 (
p < 0.001), and site 7.4 had a significantly higher IFA than the recreation area (
p < 0.001).
For Yakutsk, just as for Yoshkar-Ola and Mirny, no significant effect of the factor of year at IFA of
B. pendula was found (
p > 0.05). Data on atmosphere pollution from stationary posts also indicate minor fluctuations in the toxicant emissions by year [
94]. On the whole, it should be noted that on the territory of the city, a significantly increased IFA was registered only in the areas with a high density of traffic, but even the recreation area was characterized by a higher IFA than the natural habitat. Multi-factor ANOVA revealed no significant effect of the factor of the year at IFA of
B. pendula for the 4-year study period in two cities, so we decided to involve in the analysis the data from the two cities on the territory of which the material was collected not in 2019 but in other years.
Thus, multi-factor ANOVA revealed no significant effect of the factor of the year on IFA of
B. pendula in the 3–4-year study period in the three cities. Erofeeva [
42], on the basis of a 5-year study, also came to the conclusion that in the urban territory, in conditions of intensive impact, the main factor affecting the birch FA is not weather conditions but the anthropogenic factor. We believe that it makes it possible to use IFA as a universal criterion of developmental stability and of urban environment health when data collected in different seasons are analyzed.
Comparison of the IFA levels of the birch within one growing season on the territory of five cities has shown that there is a trend of FA increasing with the anthropogenic load, but the degree of manifestation of these differences varies: On the territory of Yoshkar-Ola and Yakutsk, a gradual increase is observed, and some of the urban sites are comparable in FA to undisturbed biotopes. However, the cities of the Central Siberia are characterized by a sharp increase in FA and significant differences with the natural biotopes and the recreation areas (
Figure 6).
3.3. Ranking Environmental Quality Based on FA Level of Betula Pendula
In most case studies of urban territories, we deal with a complex of factors affecting the environment and developmental stability of plants [
5,
10,
20,
46,
47,
63]. In
Section 3.2, we already mentioned that the
B. pendula IFA ranged widely from 0.033 to 0.072 (
Table 2). Low IFA values (0.033-0.038) were recorded at the provisional control sites: Natural biotopes or ecotopes with a slight recreational load in the cities 1-2, 4, and 7 (Naro-Fominsk, Yoshkar-Ola, Achinsk, and Yakutsk). The control sites in the cities 3 and 6 (Nazarovo and Mirny) showed some higher IFA values (0.043-0.044). Only city 5 (Krasnoyarsk) stands apart for its unfavorable conditions even at the provisional control site (recreation area) due to significant background pollution, yielding an FA increase up to 0.054 (
Figure 6,
Table 2). All the studied cities tend to an FA increase from the natural biotopes towards the most polluted areas. This was also noted before by Zakharov et al. [
46,
62]. This gives rise to the task of environmental assessment and ranking of the studied cities and ecotopes.
Environmental assessment using the FA rank coefficient (IFAR) implies that IFA of less than 0.040 indicates high developmental stability, being indirect proof of the well-being of both internal and ambient environments, i.e., characterizing this environment as favorable for living. Further increments of 0.05 indicate increasing ontogenesis destabilization and may serve as a measure of environmental disturbance. Correlation between the absolute values of IFA and IFAR made up 0.98 (Spearman’s
t = 25.8,
p < 0.001), and score averaging for various biotopes showed that the developmental stability of trees in natural biotopes was ranked as I-II, with the average score of 1.2 (
Table 6). For recreational areas, including parks, gardens, and city outskirts, developmental stability could vary within ranks II-IV, while for residential areas beyond the industrial and traffic impact within II-V. The most significant deviations at the level of IV-V were recorded in trees growing in the territories affected by traffic and industrial enterprises. The dispersion analysis showed significant FA differences among the ecotopes (Scheffe test
p < 0.001). As a whole, IFAR mirrors the results of IFA analysis, though it more clearly demonstrates an increase in tree ontogenesis destabilization in deteriorated urban ecosystems.
As judged by the IFA values and IFAR rank scale, the most ecologically unharmed city is Yoshkar-Ola. Its background index falls under rank I of environmental health, while even the most troubled ecotopes fall under rank IV. In Mirny, the IFA values also do not exceed rank IV, while the background ecotope is ranked II, and the residential area is within ranks III-IV. This may prove the general ill-being of the environment. Yakutsk, Naro-Fominsk, and Achinsk display the whole range of the rank scale from safe natural biotopes through to a critical situation in separate urban ecotopes. Nazarovo features an even worse environment as assessed within ranks II-V. Extremely high IFA values for Krasnoyarsk state the worst environmental quality there: The recreational area is ranked IV, while the remainding three sites are ranked V.
3.4. Influence of the Traffic Load and Petroleum-Based Emissions on FA in the Silver Birch
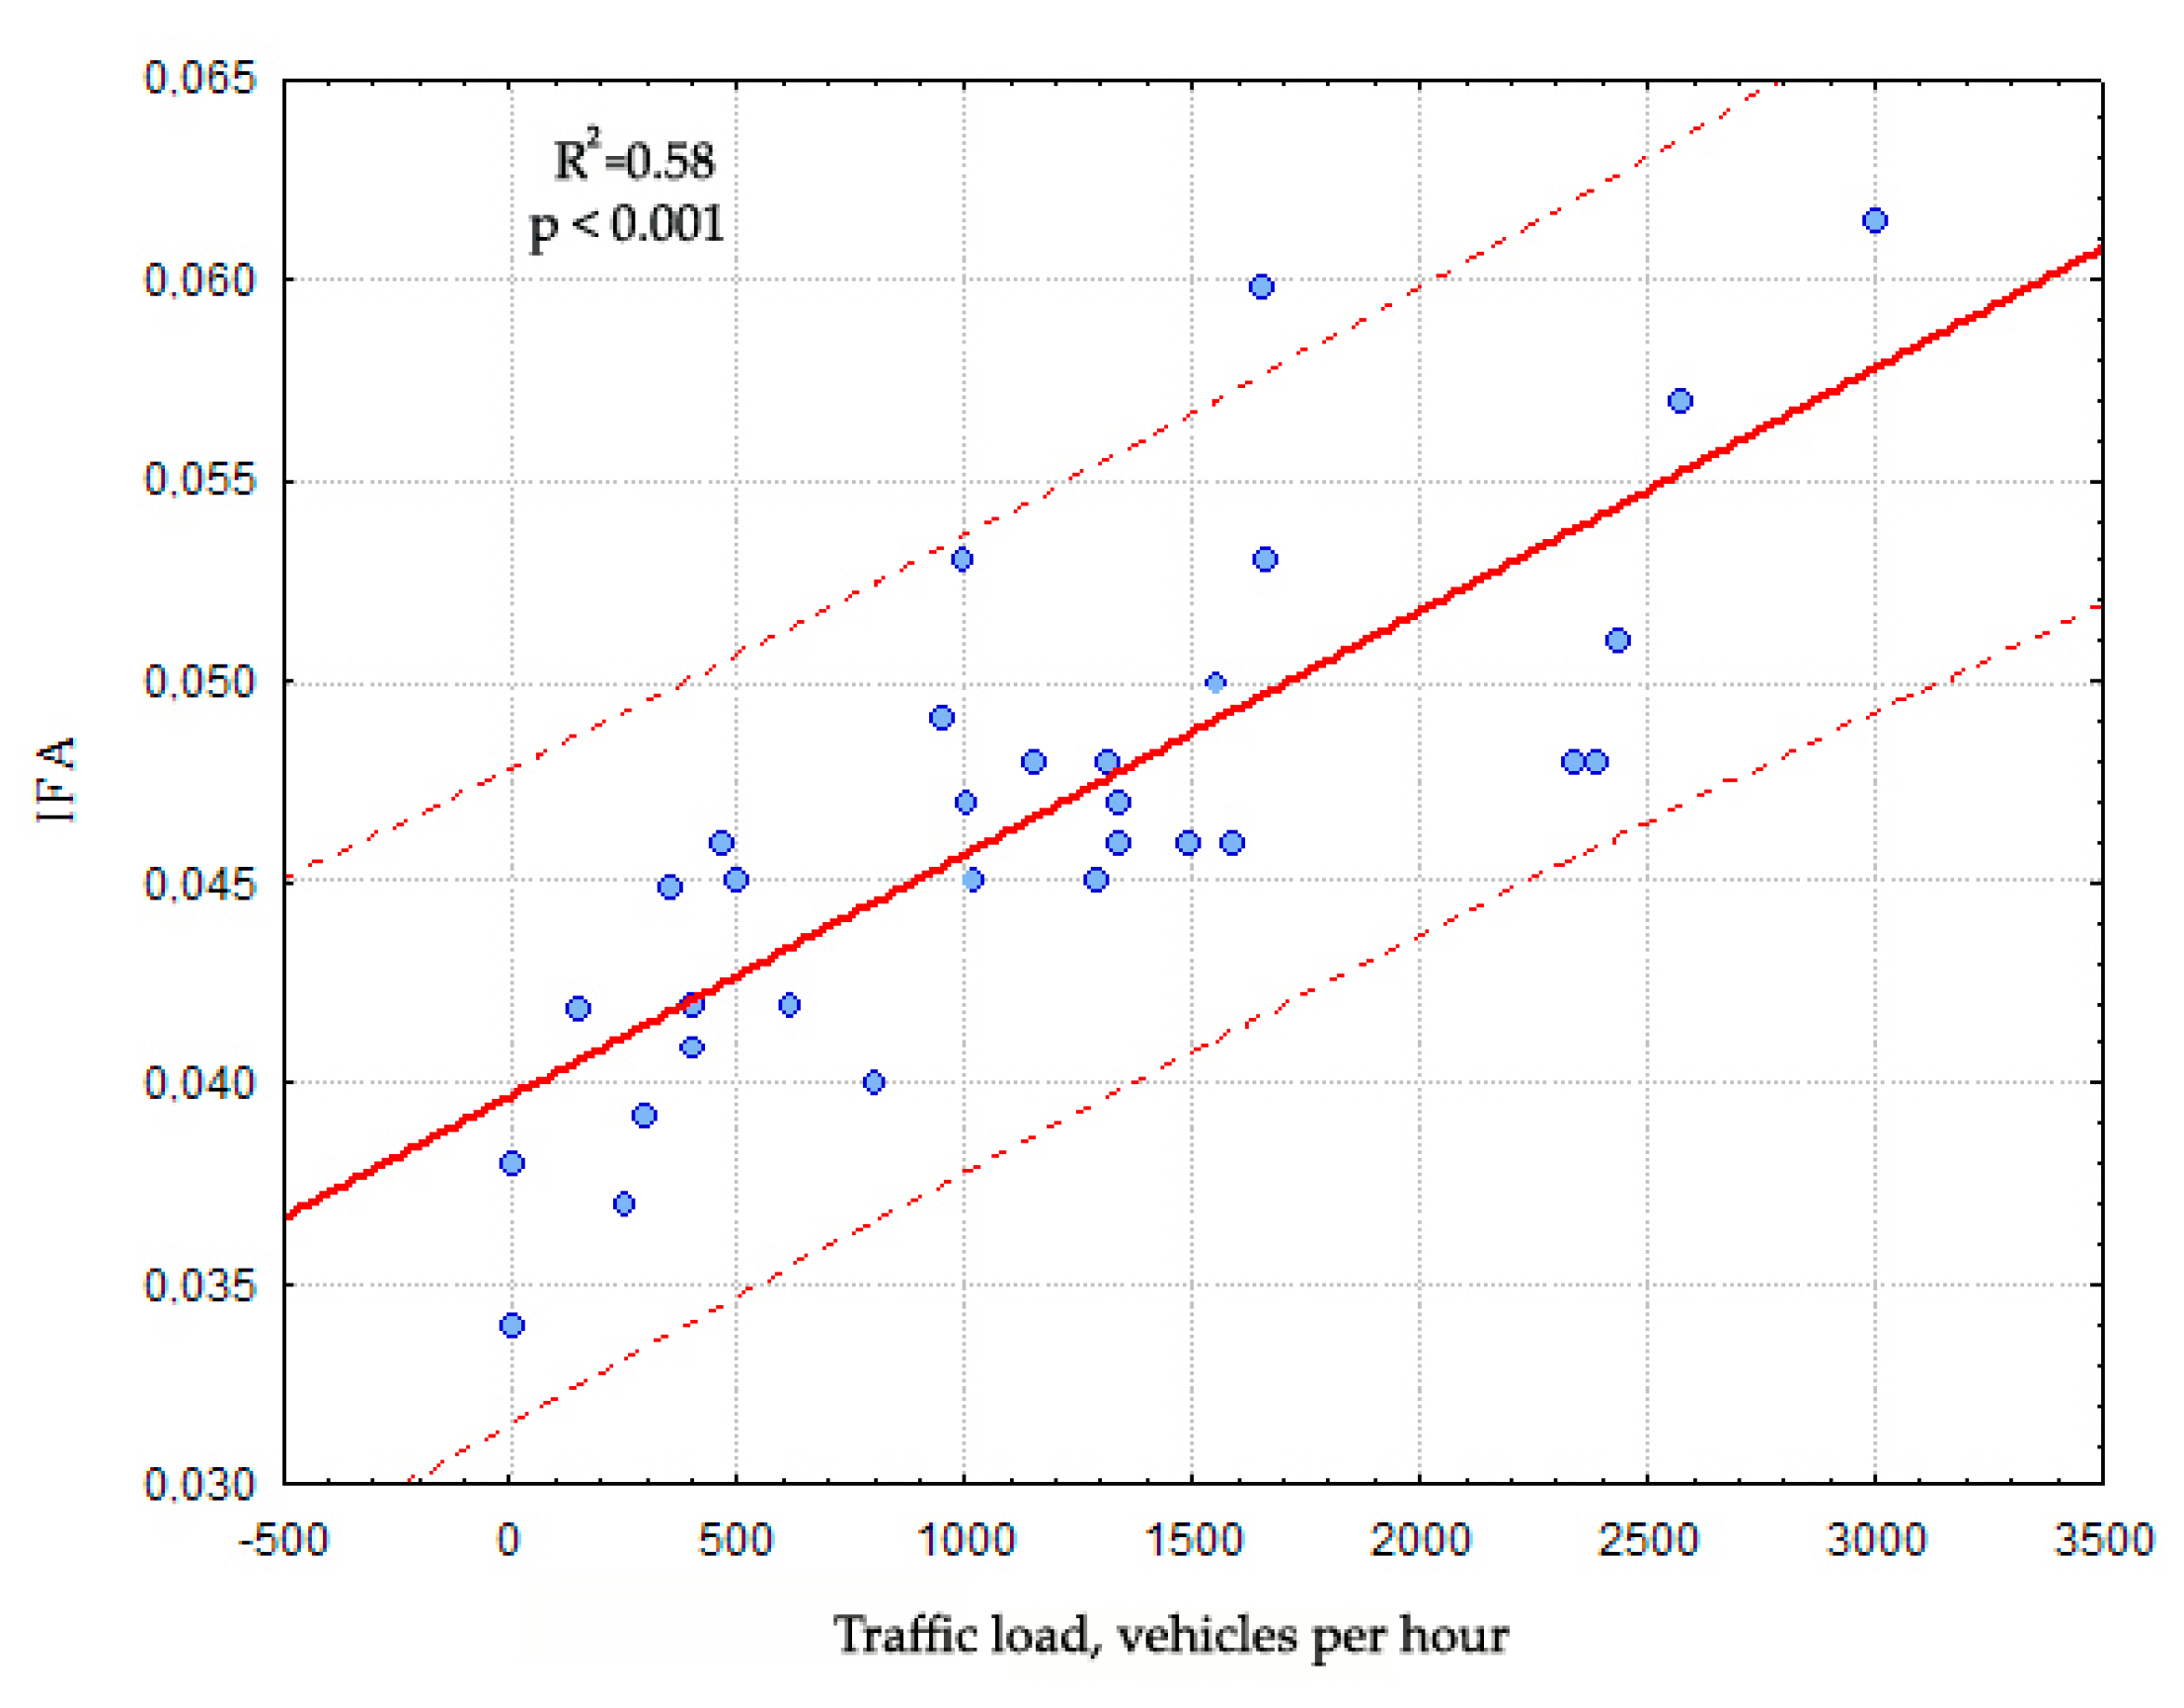
We analyzed
B. pendula’s developmental stability in terms of traffic density in direct proximity to the road at 20 sites in Yakutsk and 10 sites in Naro-Fominsk. The vehicles were counted during the peak-activity hours. In Yakutsk, traffic density ranged from 463 to 2570, while in Naro-Fominsk, from 100 to 3000 vehicles per hour. In both cases, the correlation between IFA and traffic load (TL) appeared to be statistically significant. Spearman’s test made up 3.14 (
p < 0.01) for Yakutsk and 2.96 (
p < 0.05) for Naro-Fominsk. The regression analysis of the combined data showed insignificant differences between the cities and the significant impact of TL on IFA (t = 37.4,
p < 0.001) (
Figure 7). As a rule, increased FA in the areas with a high traffic density comes from the aerotechnogenic pollution. It is well known that exhaust gases carry into the atmosphere of the city particulate matter of elements, such as Cr, Mn, Ni, Cu, Zn, Cd, and Pb [
105]. Erofeeva [
42] noted that the traffic load has a strong positive correlation (r = 0.80–0.90;
p < 0.05) with the peak emissions of the major pollutants contained in vehicle exhaust gases (oxides of sulphur, nitrogen, and carbon; hydrocarbons, formaldehyde, soot). Thus, the road-side dust in Yakutsk is stated to have a 3.4 times increase in Mo, 2.7 times increase in Zn, and 2 times in Pb as compared to the control dust sample [
106]. There are records of heavy metals, such as Pb, Zn, and Cu, in the soil of the traffic zone. The 5 m-wide roadside zone is exposed to severe dusting: Up to 184 g dust per 1 m
2 contain 6.13 mg Pb, 37.47 mg Zn, 8.12 mg Cu, and no less than 0.02 mg Cd. At the distance of 20–50 m from the road, the dust and heavy metal load are decreased approximately 10 times; and at the distance of 100–250 m, 100 times [
107]. The dependence of the FA level of the birch on the traffic load and technogenic air pollution was noted before by us and other authors [
29,
42,
44,
45,
63].
The data obtained by studying
Betula pendula are confirmed by data on other tree species. The factor analysis we performed earlier showed that developmental instability in the Scots pine
Pinus sylvestris on the territory of Krasnoyarsk is also associated with traffic emissions. As a result of the accumulation of heavy metals in the soil cover and in plant tissues, a change in the morphometric characteristics (IFA) of the needles of the Scots pine takes place in the ecotopes of Krasnoyarsk with a high traffic load [
108].
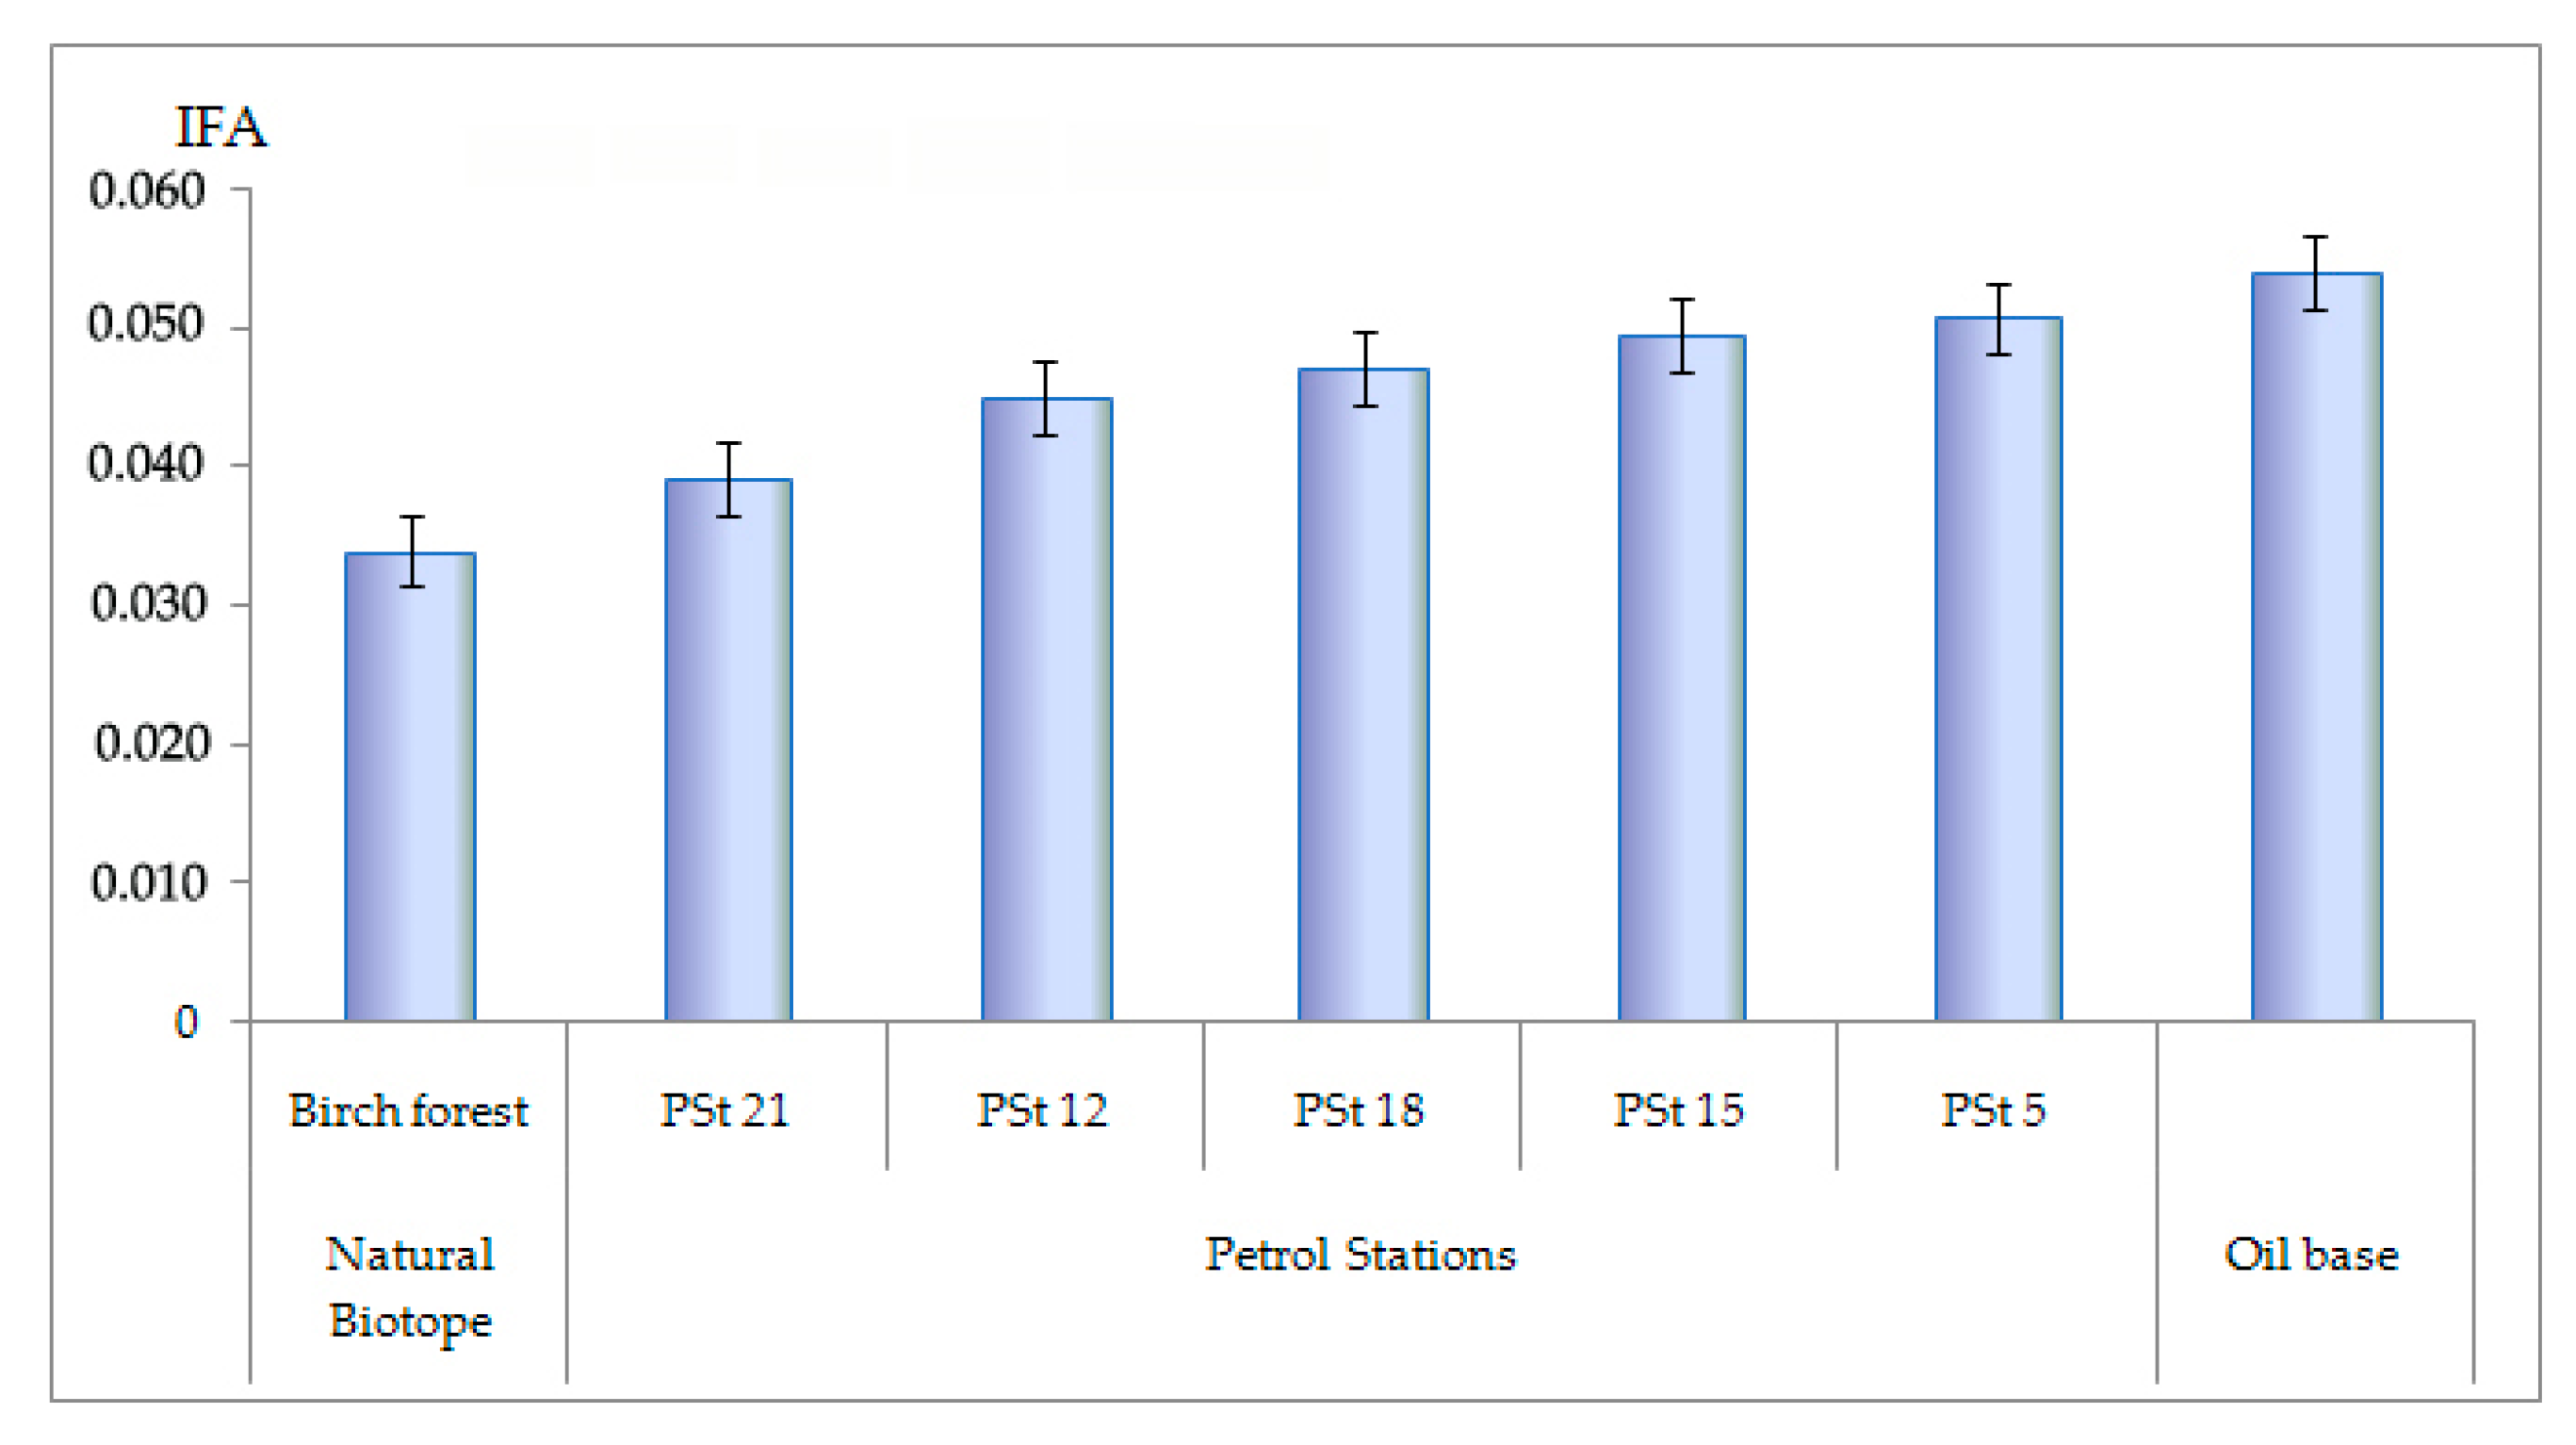
Some sites within the urban territories differed from the background by the developmental instability of plants. This could be the result of some specific pollution types. It is well known that gas stations are one of the sources of air pollution in city limits [
109]. Within Naro-Fominsk, an increase of
B. pendula IFA was recorded at the sites exposed to oil-product pollution (
Figure 8). Differences between the natural biotope and the ecotopes confined to fuel filling stations appeared to be statistically significant (Scheffe test
p < 0.05). Earlier, we already recorded an FA increase in birch at the sites severely exposed to oil hydrocarbons. The results were proved by the bioassay and chemical analyses data [
64].
3.5. Assessment of the Combined Influence and Contribution of Different Environmental Factors to FA Variability
As we mentioned before, the ability of FA to respond to stress factors of various nature is of great interest for bioindication studies since it can be used for an estimation of the total negative impact. However, this method suffers from one flaw: Under conditions of multiple impacts, it is hard to distinguish the leading factor. In some cases, it is possible to trace FA’s change along the gradient of some environmental factor, like the radiation background or dust pollution at open coal mining [
22,
28,
29]. FA of
B. pendula is also known to be dependent on atmospheric pollution; among other kinds, on pollution caused by traffic load and mining industry [
42,
44,
63]. However, in most cases, on the territory of a contemporary city, with multiple factors affecting the picture, it is difficult or impossible to isolate the leading factor that has the most negative effect on developmental stability. This is why we attempted to assess the combined anthropogenic impact.
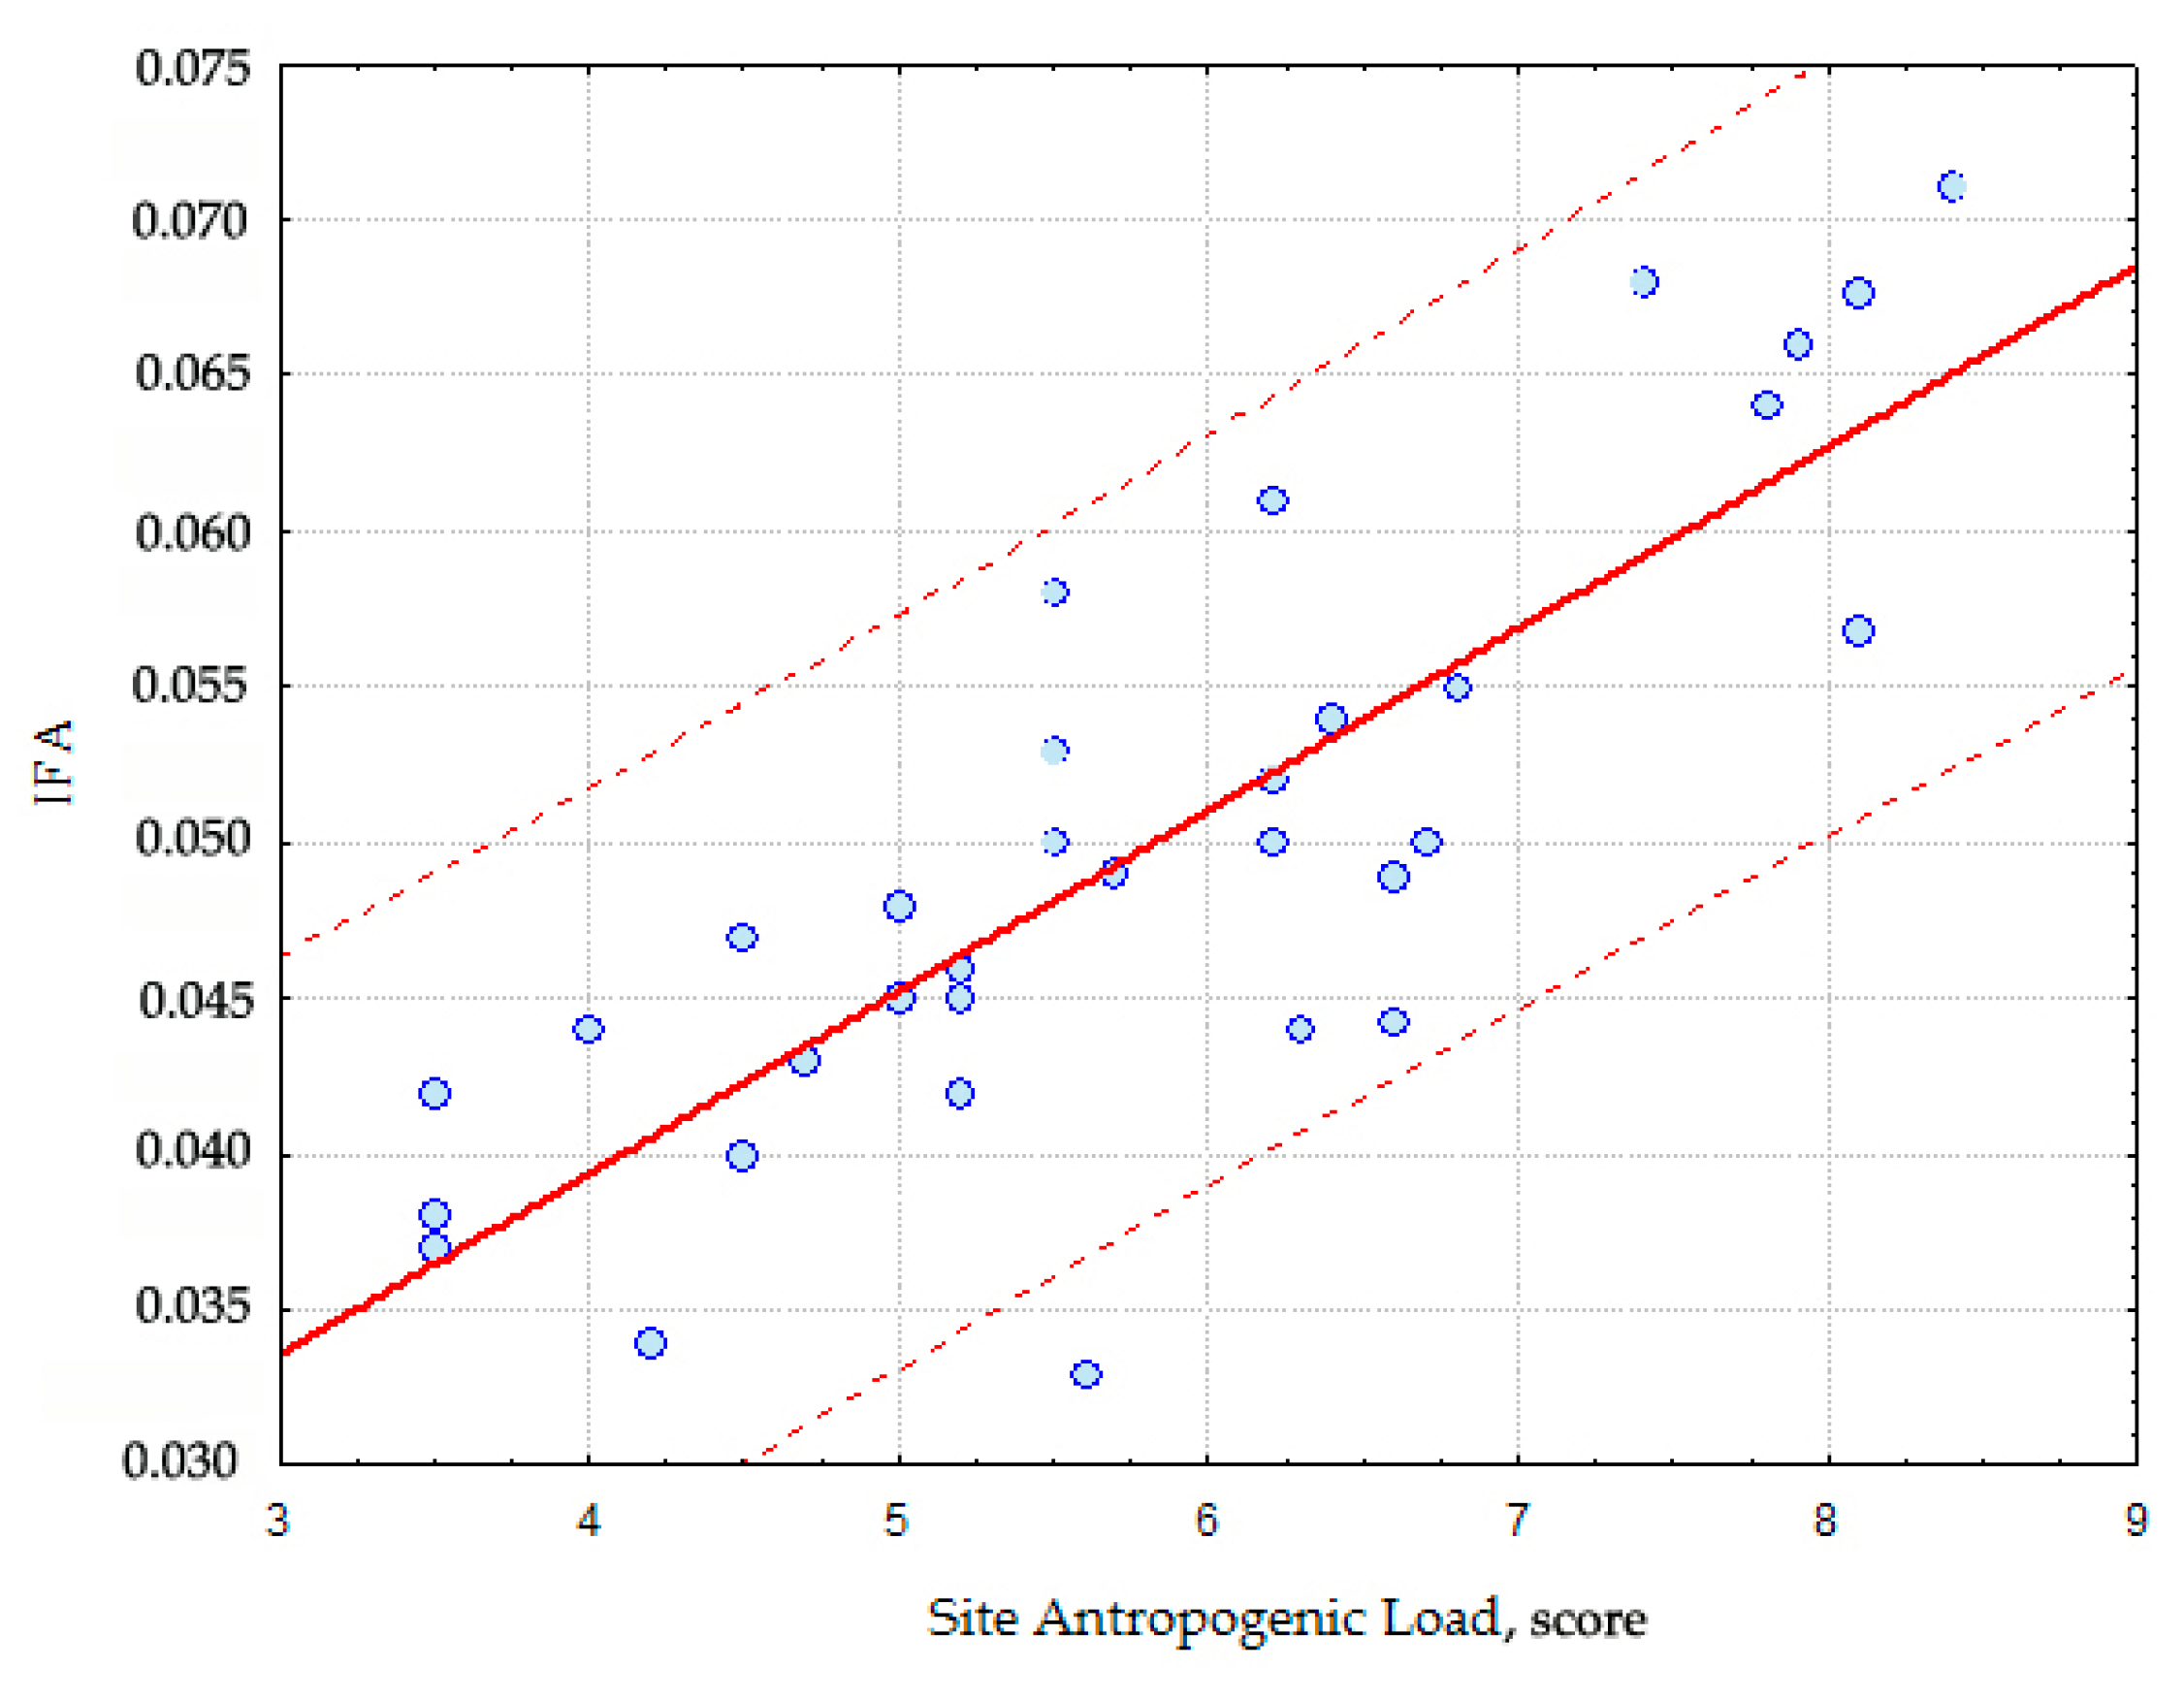
The complex anthropogenic impact on birch growing in various ecotopes of seven cities was estimated based on the variables described in
Table A5. A statistically significant correlation was revealed between IFA, TL, and industrial load (IL), as well as between complex parameters: Traffic and industrial load (TIL), environmental pollution (EP), city anthropogenic load (CAL), site anthropogenic load (SAL) (Spearmen’s rank correlation coefficient = 0.46–0.75, significance from
p < 0.05 to
p < 0.001). IFAR displayed a higher correlation with TL and IL, and some weaker relations with the complex parameters CAL and SAL. The correlation with EP was not statistically significant. The closest relationships were revealed of IFA with SAL (
Figure 9) and IFAR with TIL, though general variance trends and similar significance levels remained.
Subsequent regression analysis justified the correlation results. Of the six anthropogenic variables involved, the most satisfactory appeared to be the model of the IFA and SAL relationship (R2 = 0.647, p < 0.001). The anthropogenic load increase yielded a 0.0046 times growth of IFA: y = 0.0141 + 0.0046x. This regression analysis model proves 65% of the variance caused by SAL.
The multivariate dispersion analysis was conducted, involving various climatic and anthropogenic factors and ecotopes as variables. A statistically significant variability of
B. pendula IFA was revealed in terms of the climatic characteristics of the cities (
p < 0.001), except for one variable, the average July temperature (
p > 0.05). As to the anthropogenic factors, IFA was proved to increase with the growth of TL, IL, TIL, EP, CAL, and SAL (
p < 0.001). As it was stated in
Section 4, a statistically significant positive correlation was revealed between IFA and all the listed variables of anthropogenic load (
p < 0.05), while no significant correlation was recorded between IFA and climatic variables (
p > 0.05).
To understand the contribution and estimate the significance of the studied anthropogenic and climatic variables for different 33 ecotopes of seven cities, a principal component analysis (PCA) was applied. First, all 27 variables were analyzed: IFA, IFAR, and 10 anthropogenic and 15 climatic variables. However, this produced a degenerate matrix, so residual correlations were removed to leave nine variables for further analysis. Hereunder, the results are given without factor rotation.
The covariation analysis of IFA, climatic, and anthropogenic variables for various urban ecotopes revealed the influence of three groups of factors that together explained 93% of the variance in the studied 33 ecotopes of 7 cities. PC I has the highest weight and reflects anthropogenic factors. It accounts for 41% of the variance and has a negative correlation with
B. pendula IFA, EP, CAL, and SAL. PC II accounts for 31% of the dispersion reflecting climatic characteristics. It is correlated positively with the sum of active temperatures, duration of the growing season, and average annual precipitation. These variables are considered when the seasonal development of plants and their productivity are characterized [
110]. PC III has a positive correlation with TL, explaining 21% of the variance (
Table 7).
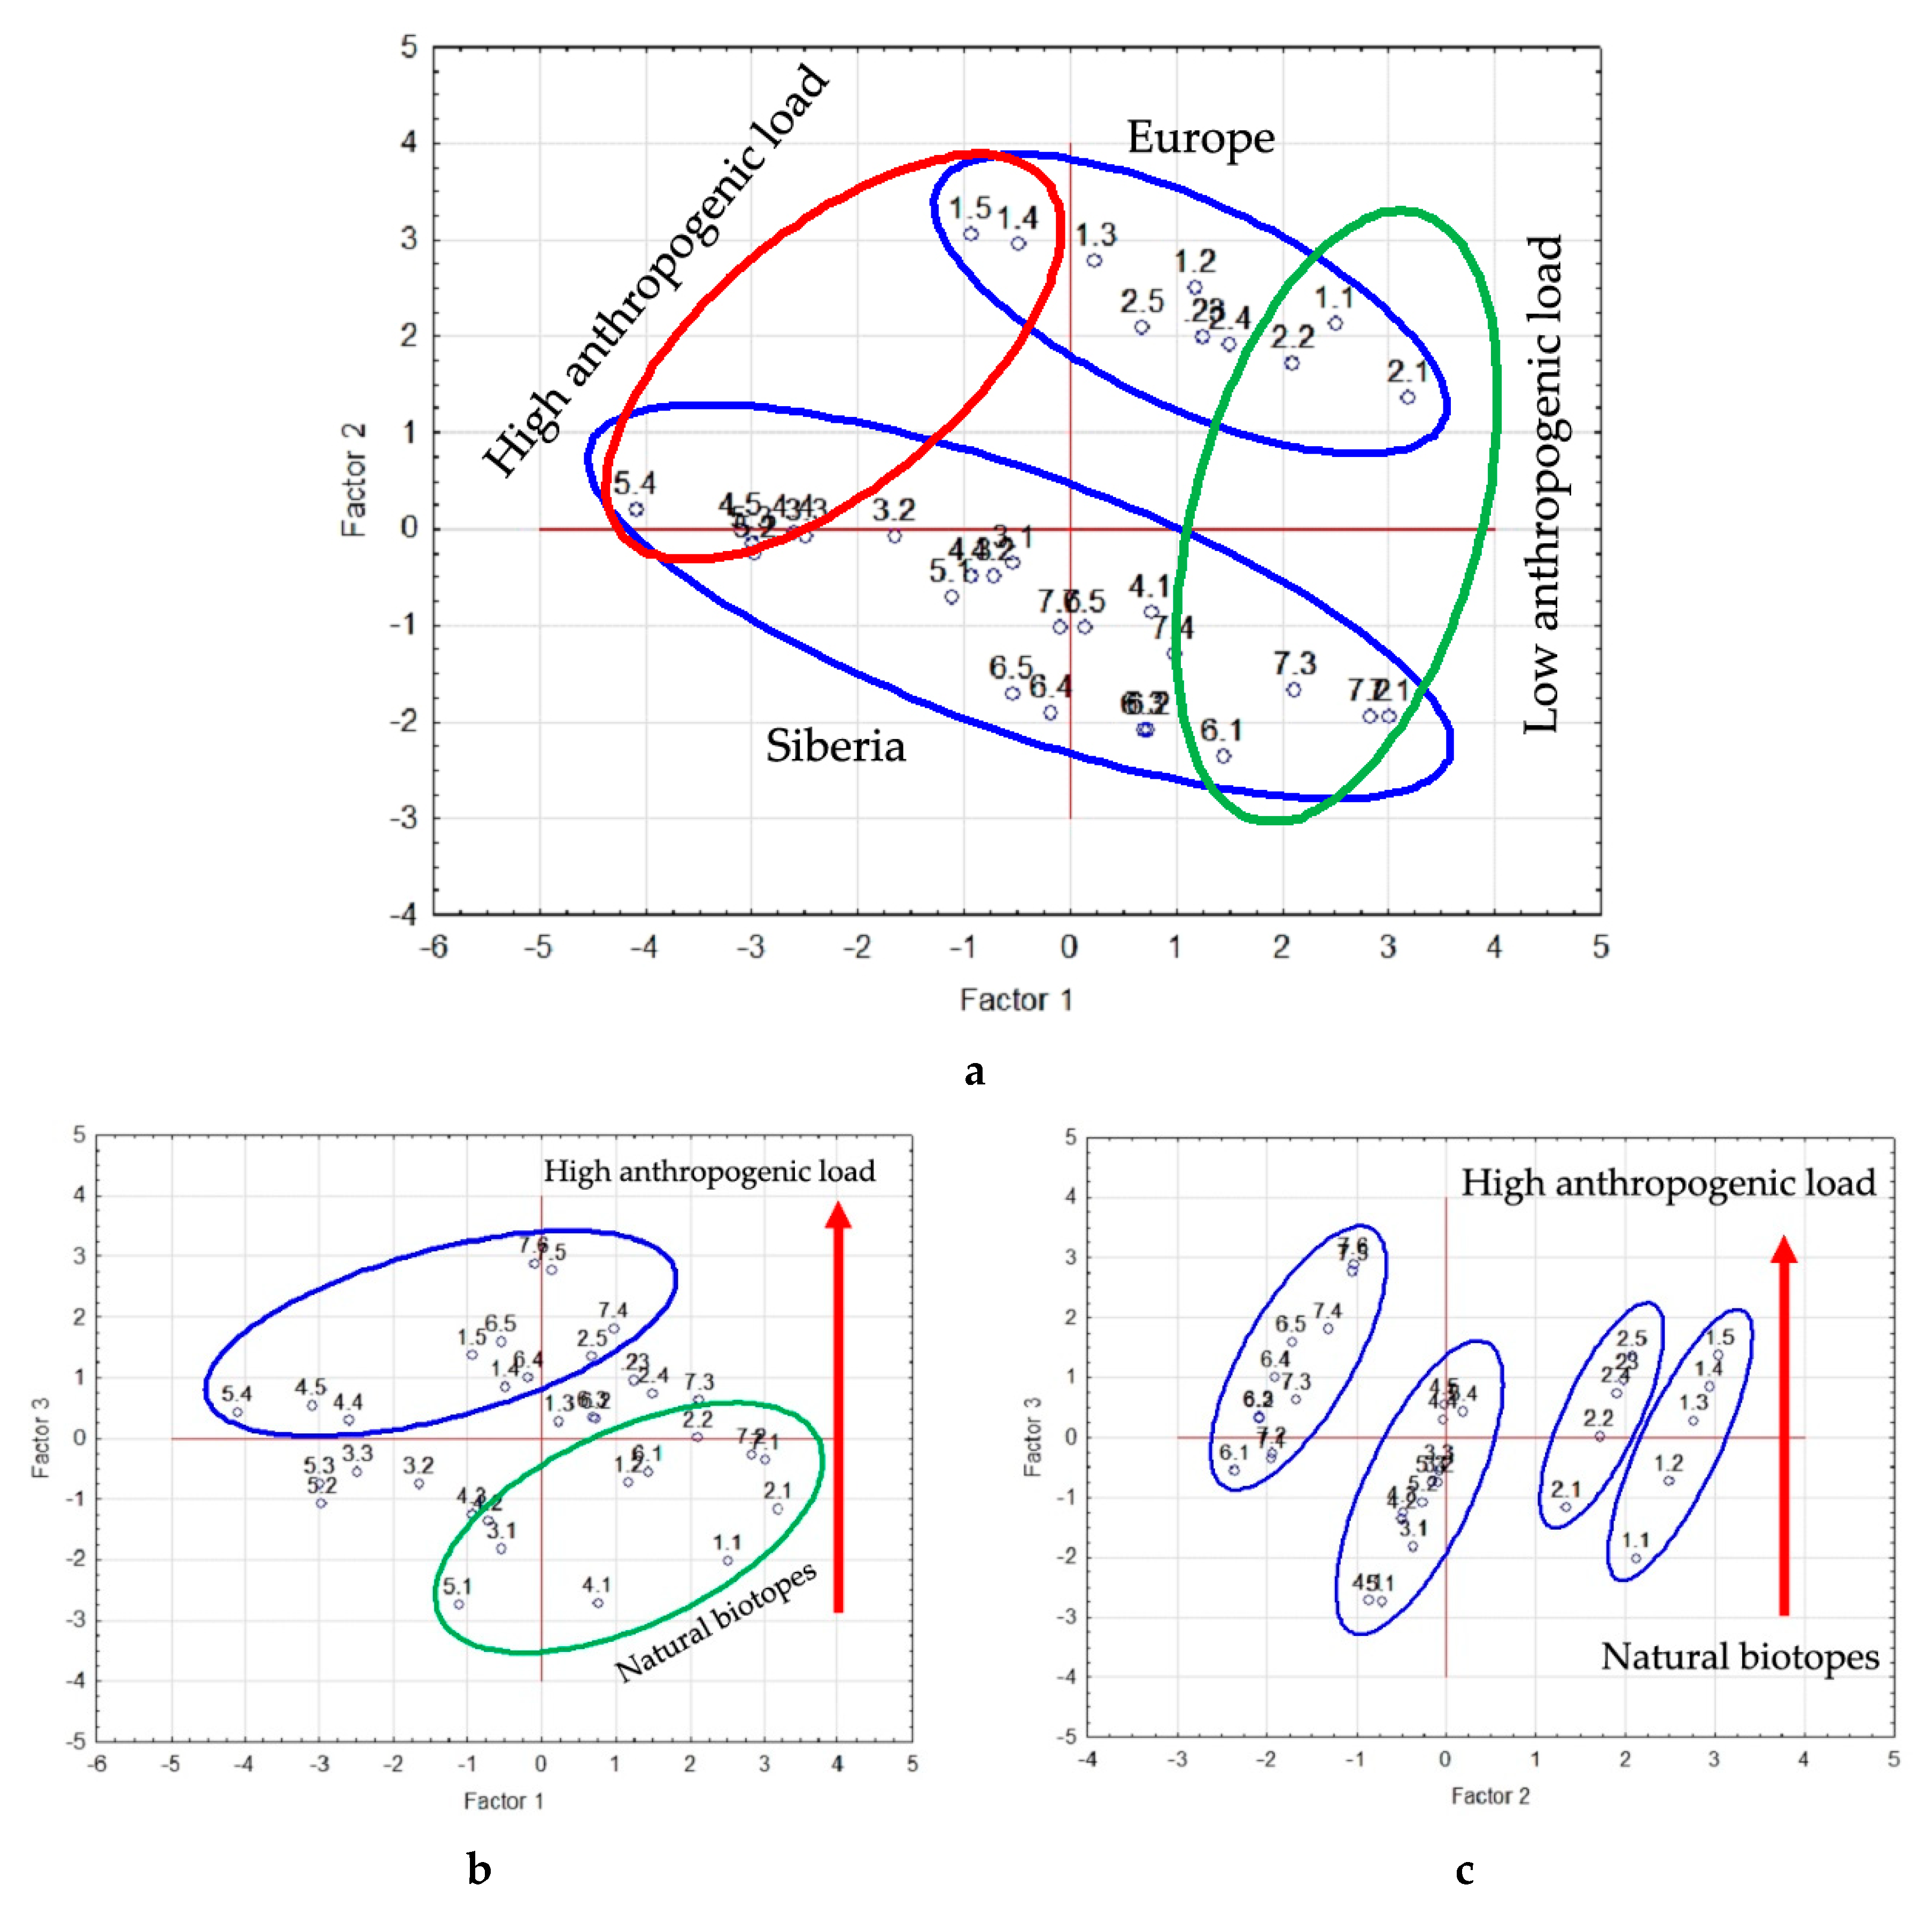
The scatterplots on
Figure 10 depict the ordination of the studied ecotopes along the significant factor gradients. Now, it is possible to estimate visually how similar or distinct the ecotopes are with respect to
B. pendula’s IFA, anthropogenic, and climatic factors. For PC I, the ecotopes of seven cities are situated along the decreasing values of IFA and anthropogenic load, from left to right: From urban ecotopes to natural biotopes (
Figure 10a). A distinct group is formed by the most polluted urban ecotopes of Krasnoyarsk Krai. They are situated on the left along the factor 1 (F1) axis. In terms of factor 2 (F2), the ecotopes are clustered by climatic characteristics (
Figure 10a). The ecotopes of a moderately continental climate of the European part of Russia (cities 1-2, Naro-Fominsk, Yoshkar-Ola) are grouped in the upper part of the F2 axis. The ecotopes of the continental climate of Central Siberia (cities 3-5, Krasnoyarsk Krai) are in the middle of the axis, while the ecotopes of the sharply continental climate of East Siberia (cities 6-7, Mirny, Yakutsk) are scattered down the axis.
F1 and factor 3 (F3) represent the variables of anthropogenic load. In this scatterplot, the ecotopes are also clustered into two separate groups. From right to left along the F1 axis, the pollution level and anthropogenic load on the city and ecotope are increased. Bottom-upwards along the F3 axis, the traffic load is increased (
Figure 10b).
The studied ecotopes also form three groups along the F2 and F3 axes (
Figure 10c). From right to left along the F2 axis, the ecotopes of the cities of the European part of Russia, and Central and East Siberia are located sequentially with increasing continentality. Bottom-upwards along the F3 axis, the ecotopes are located with the increase of the traffic load.
Thus, the complex analysis clearly grouped the studied ecotopes with B. pendula according to various ecological factors. Anthropogenic factors play the primary role in FA variability, whereas climatic characteristics have no significant impact on the studied measure of developmental stability of plants in the urban environment.
3.6. Analysis of the Possible Causes of the Increased FA in Plants in Urbanized Territories
The data we obtained indicate significant differences in the developmental stability of B. pendula, both between regions and within each city, which can be explained by the geographic location and population and local industry of these cities.
First of all, the cities in question differ significantly in the air pollution level. In Krasnoyarsk city, it was estimated as very high, with an atmospheric pollution index (API) of over 14.0, and high in Achinsk and Nazarovo (API over 7). Besides, sulphur oxides and heavy metals were recorded in the air of Krasnoyarsk Krai cities, whereas no records of these pollutants were made in other cities [
92,
93]. Only Mirny had a comparable pollution level (API 7.0) due to its hydrogen sulphate content [
111]. In Yakutsk, API was about 5–6 [
94], while in Yoshkar-Ola, it was less than 1.0 [
88,
89].
The increased
B. pendula FA values in the three cities of Central Siberia are due to the high anthropogenic load over the region. Krasnoyarsk Krai is one of the oldest industrial regions of Siberia. Major ecosystem polluters are the enterprises of non-ferrous metallurgy, the regional power station (RPS), and the combined heat and power plant (CHP). The strong negative impact of RPS and CHP on the cities of Krasnoyarsk Krai is explained by the wide use of brown coal, while other studied cities use natural gas. Brown coal is characterized by a high ash and sulphur content. Bottom ash and boiler slag produced by the combustion of brown coal from the Kansk-Achinsk basin have high concentrations of Mn, Cu, Ni, Co, Cr, Pb, Zn, and polycyclic aromatic hydrocarbons [
112], and the content of alcaline metals leads to a pH increase to 12.0 [
108]. The ash and slag of brown coal are toxic for warm-blooded animals, and have a mutagenic effect on assay microorganisms, toxic effect on hydrobionts, and phytotoxic action on crop plants [
113]. Nazarovo Power Plant belongs to hazardous enterprises that produce large amounts of emissions. In Achinsk, the main contribution to air pollution from stationary sources comes from the Achinsk Alumina Refinery, whose emissions contain Al
2O
3, CaO, Na
2CO
3, SiO
2, NaOH, and benzpyrene [
87]. High values of IFA of
B. pendula in Krasnoyarsk are caused by multicomponent anthropogenic pressure created by motor transport, the metallurgy, wood chemical industry, and heat-and-power plants. In Krasnoyarsk, the highest total concentration of heavy metals is observed on the territories adjacent to the heat station [
114]. The studies conducted earlier determined a heterogeneous content of heavy metals (Pb, Cd, Cu, Ni, Mn, Zn, Co) in the soil cover of Krasnoyarsk, which is associated with local sources of their emission [
114].
Mirny is an industrial city, but it has its specifics associated with open pit mining: The main sources of pollution, i.e., open pits, waste rock dumps, and tailings ponds, are located on the outskirts of the city [
111,
115]. On the posttechnogenic territories, significant deviations in the developmental stability of the birch and other trees can be observed [
63,
115], while on the territory of the city, the main negative technogenic impact, i.e., dust from disturbed territories, is most noticeable in the outskirts. For a long time, diamond mining was conducted with open pits, and waste rock was deposited in dumps in the immediate vicinity of the city. Mirny is on three sides surrounded by these rock dumps of up to 100 m in height, which despite the reclamation efforts continue to be a source of dust. Immediately to the south of the city lies the giant pit “Mir”; it has not been functioning since 2001 but was not reclaimed (due to its size), and due to prevailing winds (mostly easterly), the south of the city is exposed to dust to a greater extent. This is why on the territory of Mirny, pollution spreads from technogenically disturbed lands to residential areas, with the least disturbed areas being the center with high-rise buildings, and most disturbed the northern and southern outskirts [
63,
115]. Naro-Fominsk is also an industrial city, though it has reduced industrial production over the past decades, gradually turning into a satellite city and striving to improved living standards. Naro-Fominsk is also an industrial city, but in recent decades, it has seen a gradual decline in industrial activity and is turning into a satellite town with an increasing life quality [
81]; the industrial impact there is concentrated mainly in the southeastern part of the city, and motor transport is associated with the federal highway [
81,
84]. Rather high FA values in Yakutsk are explained first by heavy traffic together with the specific landscape and city planning: Insufficient ventilation of the city, a large number of vehicles per capita along with old planning, narrow roadways, and scanty greenery [
29,
63,
65,
66]. Yoshkar-Ola, as it was mentioned before, features a more favorable ecological situation due to the specific location, while small industrial enterprises do not emit significant amounts of toxic substances [
47,
88,
89].
Similar results were obtained by other authors assessing the condition of urban territories with the same methods. For example, the high IFA figures in
Betula pendula on the territory of Krasnoyarsk, even in recreational areas, are comparable with those obtained in another city with a population exceeding one million people: Moscow [
46]. On the territory of Tolyatti (industrial center, Middle Volga region), an increase in IFA from 0.035 in a natural biotope to 0.056 in urbanized ecotopes was registered [
116]. Similar trends were observed in other cities where FA of
Betula pendula was studied [
42,
117,
118,
119,
120,
121,
122,
123]. An increase in FA of vegetative organs on the territory of a city and along the roads is characteristic of many species of trees and shrubs, including:
Populus nigra [
124,
125],
Tilia cordata [
126],
Armeniaca vulgaris [
127],
Pinus sylvestris [
108,
128,
129],
Pinus eldarica [
130],
Olea europea,
Quercus ilex,
Eucalyptus cameldulensis,
Platanus orientalis [
125]
Aser pseudoplatanus [
45,
131],
Ficus elastica Syzygium jambolanum and
Guarea Guidonia [
132],
Cecropia pachystachya [
44],
Ligustrum japonicum и Olea europea [
133],
Syringa josikaea [
134],
Ulmus pumila [
135],
Sorbus aucuparia [
136], and
Fragaria vesca [
118].
The correlation between an increasing FA in trees and shrubs and indicators of environmental pollution in industrial zones and roadside areas in cities has been proven both experimentally and by parallel studies of plants themselves and geochemical parameters of their environment. Ivanov et al. [
43] showed that an excess background content in birch leaves of Ni (18.5 times), lead (16.0 times), Mn (5.8 times), and Cu (3.0 times) was accompanied by an increase in the integrated FA index by 20.0%, and chronic exposure of the leaves to ionizing radiation caused an increase in IFA by 29.8% and in the content of chlorophyll a (by 50.3%), and chlorophyll b (by 82.9%). Environmental pollution by sulfur compounds causes deviations in the growth and development of the silver birch [
122]. A direct dependence of the FA level of the leaf on air pollution, especially by benzpyrene, has been found [
120]. The FA level is affected by the distance from the plant to the source of pollution, e.g., with the increase in the distance from the plant to the roadway, a decrease in the FA level is observed [
117,
121]. For the Scots pine, a distinct pattern of needle asymmetry increasing depending on the dust load has been found [
129]. Skripal’shchikova et al. [
137] registered a correlation between the FA level of the pine and the content of Al, F, and heavy metals in the pine needles.
The FA level increase is not the only indicator of a plant’s negative response to environmental pollution. Parallel changes in pine FA and such parameters as the length of physiologically active needles, needle cross-section, and the cross-section of the central cylinder and conducting bundles have been recorded, as well as negative relations between all anatomical and morphological parameters of needles and the content of Pb and F in them [
137]. Air pollution leads to an increase in the metal content in the leaves of
Tilia cordata, displacement in the ion balance, and changes in the size and asymmetry of the leaves [
138]. Hassan et al. [
139] noted in plants in industrial and urban areas, a decrease in the length of shoots, but it is possible that changes in the dimensional characteristics of the organs, anatomy, and morphology depend on the intensity of the impact. On the territory of Yoshkar-Ola, an opposite trend has been noted in
Betula pendula under conditions of increasing anthropogenic load: The shoot length as well as the leaf area increased [
47]. At the same time, some parameters of the lamina anatomical structure decreased: Lamina thickness, height of the upper and lower epidermis, and height of the spongy and palisade parenchyma. We attribute this to the development of an adaptive compensatory response to moderate-force impacts, while strong stress-inducing effects may cause a transition from adaptive to destructive changes as a result of deadaptation.
Hassan et al. [
139] reported a decrease in chlorophyll content; changes in other physiological and biochemical parameters correlated with the concentrations of air pollutants. In urban conditions,
Ligustrum japonicum and
Olea europea demonstrate not only an increase in the leaf FA but changes in the morphological structure, as well as an inhibition of catalase and superoxide dismutase activity as compared with the control [
133]. Changes in such important biochemical parameters as the content of chlorophyll and ascorbic acid, activity of nitrate reductase, superoxide dismutase, and peroxidase in the leaves of
Mangifera indica,
Cassia fistula, and a
Eucalyptus hybrid depend on air pollution [
140].
An intensive negative impact can lead to serious abnormalities and cell death. For example, in three species of plants found close to an iron ore pelletizing plant in Brazil, necrotic areas on the leaves, cuticle erosion, stomata obliteration, breakage, and plasmolysis of trichomes were observed, and anatomical cell collapse and hypertrophy and the formation of wound tissue were found [
141]. Decreases in the leaf area, petiole length, thickness of the palisade and spongy parenchyma layers, dry weight of the leaves, stomatal density, cuticle thickness, and size of the epidermis cells were observed in the leaves of the castor bean
Ricinus communis from heavily polluted stretches of Kathmandu roadsides [
142]. In Turkey, in the area affected by highway, concentrations of Zn, Fe, Pb, and Cd, as well as soluble sugar and proline in the leaves of
Eucalyptus camaldulensis affected by pollution were significantly increased as compared with the plants cultivated in the control conditions [
143]. A study of a transect of a busy road within the London city limits and analysis of exhaust gases’ impact on 12 plant species from different functional groups showed a wide range of effects, including stimulation and inhibition of growth, change in gas exchange, and premature aging of leaves. The authors of the study believe that the key phytotoxic component of the exhaust gases was NO(x) [
144]. Khalid et al. [
145] found a significant impact of vehicle emissions on four species of herbaceous plants; a manifold increase in the concentrations of Cd, Ni, Pb, and Zn in the leaves in vicinity of roads, as well as a change in C:N ratio were registered.
Salt stress in the area affected by roads has a negative impact on
Tilia x euchlora, leading to changes in the chemical composition of the cell wall and increased synthesis of prenyl lipids [
146]. A study of the response of
Robinia pseudoacacia to air pollutants SO
2, NO
2, and O
3 in Tehran showed that in response to urban air pollution, the spongy mesophyll layer becomes thinner, the upper cuticle of the leaf thicker, and the stomatal density and the ratio of the palisade to spongy parenchyma increase [
147].
These dependencies are not always direct and unambiguous. For example, Erofeeva et al. [
148] noted a two-phase dependence (a biphasic pattern) of the photosynthetic pigment (PP) content, lipid peroxidation (LPO) rate, and fluctuating asymmetry (FA) of the leaf plate on the level of motor traffic pollution, which was studied in the
Betula pendula. At the first phase, an increase in pollution pressure leads to disturbances in the homeostasis of trees, manifested as a reduction of the PP content, intensification of LPO, and increase in the FA index. At the second phase, a further increase in pollution pressure has an opposite effect, normalizing homeostasis (LPO rate and FA index decrease, while PP content increases). However, in any case, plants on the territory of the city respond to environmental pollution with changes in morphological, anatomical, and biochemical parameters.
Along with the changes in the morphological, anatomical, physiological, and biochemical parameters of plants, in conditions of anthropogenic pollution, abnormalities in the reproductive sphere can be observed. In
Pinus sylvestris, an increase in the percentage of cytogenetic abnormalities in pollen tubes and seedlings [
149], germination capacity of the seeds, and survival rate of seedlings [
150] was observed. We noted that in urban conditions, not only an increase in deviations from the developmental stability of the birch but also a decrease in the germination capacity, as well as an increase in the occurrence of abnormalities in pollen grains can be observed [
65,
66,
151].
Thus, the observed increase in FA of the birch leaf is just one of the manifestations of the plant’s response to less suitable environmental conditions in cities. In practical terms, FA has a certain advantage in assessment of the environmental quality since it makes it possible to carry out a reasonably accurate assessment of the state of the environment without expensive equipment.

 ,
, 
