Abstract
When threatened with catastrophic political or economic fluctuations, a firm might be forced to consider relocating their supply chain to reduce the risk. Such a relocation necessitates a series of changes, so making the right decision is crucial for sustainable development of the company. In the past, various models have been developed to help managers to select the optimal location. However, most of these considered the factors independently but in the real world, these factors have a mutually influential relationship. This study purposes a hybrid multiple criteria decision making (MCDM) model to provide decision makers with a comprehensive framework to evaluate the best strategies to solve relocation problems, which also considers the interdependency between criteria. The model incorporates the DANP (Decision Making Trial and Evaluation Laboratory-based Analytic Network Process) model (subjective weight) and entropy method (objective weight) to determine the weights of the criteria. Then, the modified VIKOR (VIšekriterijumsko Kompromisno Rangiranje) method is applied to select the optimal alternative for relocation. The usefulness of the model is demonstrated by taking an electronics manufacturing company with a global supply chain as an example. The results indicate that the proposed hybrid model can assist companies in choosing the best locations for their supply chains for sustained development.
1. Introduction
With the development of globalization, the establishment of a stable supply chain has become one of the important strategies for the sustained development of an enterprise. However, sometimes, due to the catastrophic economic or political fluctuations, some county or region will lose its original advantages, forcing companies to transfer their supply chain to other countries to reduce the possible risk. Faced with these types of disruptive challenges, companies need to respond rapidly and in a timely manner to retain their competitive advantages. How to transfer the original supply chain and select the best alternatives are critical decisions for managers. In the past, it has been suggested that production processes and supply chains can be adjusted to respond with decentralized production [,,,]. Some researchers believe that relocating the supply chain can strengthen an enterprise’s competitive advantage [,]. Many studies have confirmed that the choice of production line is one of the most important strategic decisions for corporate development, directly affecting the costs and benefits of corporate operations [,,]. The choice of supply chain also plays a very important role in building a company’s competitive advantage and ensuring its sustainable development. The relocation of production lines plays a key in sustainable supply chain management in today’s competitive markets.
In prior research on manufacturing, considerations for location selection include economies and markets, government and governance, business efficiency, infrastructure, human capital and education in the evaluation framework [,,,]. However, few studies have incorporated the concepts of sustainability and innovation as criteria in the evaluation system or systematically discussed the entire evaluation framework. Wang et al. [] pointed out that environmental regulations will certainly have an impact on some locations and will have different effects on different types of industries. Mudambi et al. [] found that site selection decisions are related to creative activities and the resources required to carry these out, which can create new assets and lay the ground work for a competitive advantage. Therefore, it is necessary to include the dimensions of sustainability and innovation in the study of location selection.
Many studies have used statistical models to explore the issues of location selection. For example, Ye et al. [] surveyed 3558 new foreign manufacturing enterprises in China’s Pearl River Delta and found that the heterogeneity of the enterprise interacts with location selection. Zheng and Shi [] found that industrial land supply and allocation policies interact with corporate site selection. Industrial land allocation policies have positive effects on corporate site selection. On the other hand, multiple criteria decision making (MCDM) models have already been used to explore the issue of location selection. For example, Liu [] used a fuzzy Delphi method combined with a Decision Making Trial and Evaluation Laboratory (DEMATEL) method to evaluate the choice of investment location and output an impact diagram. Marinković et al. [] used the two round Delphi method to confirm decision indicators combined with an Analytic Hierarchy Process (AHP) method to facilitate location selection for new sectors in the Information and Communication Technology (ICT) industry. Although qualitative or quantitative methods have been used in many studies to confirm the relationship between the factors or criteria, the applied models often overlook the interdependency between criteria [,,,,]. The DANP-mV (DEMATEL-based ANP- modified VIKOR) model is very appropriate for handling the problem of interdependency and easy to operate compared with the original DANP model []. However, decisions on location selection, due to the complexity and interaction of the evaluation criteria, often involve lead to a dilemma between rationality and sensitivity. Chang and Lin [] pointed out that location selection is usually based solely on the subjective preferences of senior managers, so decisions are normally biased. To avoid the subjective weight problem of the DANP-mV model, this study incorporates the entropy method to obtain objective weights for inclusion in the model. Then, the modified VIKOR (VIšekriterijumsko Kompromisno Rangiranje) method is applied to select the optimal alternatives for the relocation of a production line [,,,]. Finally, an empirical analysis by implementing the proposed DANP-mV model is conducted onto an electronic product manufacturer that is suffering from the impact of international economics and trade. The company’s supply chain has a global layout and has 175 service spots. The company has a goal of being sustainability. For this vision, this study focuses on the relocation of manufacturing plants for the sustainable development.
The contribution of this study is that the method should help managers to evaluate possible locations, solving the problem through a comprehensive and scientific process, so the results can be closer to reality. The following improvements are made:
- A complete innovative evaluation framework is proposed, which differs from those used in the past because it integrates the dimensions of sustainability and innovation into the evaluation.
- The proposed model considers the evaluation framework as an integrated system and transforms the causality of a complex evaluation system into a visualization analysis. In also integrates both subjective and objective weights obtained by the DANP and entropy method, which remedies the reliance in prior models on the experts’ subjective opinions.
The rest of the paper is organized as follows—a systematic review of the research on location selection problems is given in Section 2. The revised DANP-mV model is introduced in Section 3. An empirical example is illustrated in Section 4 and the results and management implications are presented in Section 5. Finally, Section 6 provides the findings and future research directions.
2. Literature Review on Location Selection
The sustainable development of supply chains has been a hot topic in recent years. In the past, a lot of research has focused on the discussion of supply chain management framework and evaluation methods [,,,]. Kusi-Sarpong et al. [] raised the viewpoints of sustainable innovation to discuss supply chain management and believed that the sustainability of supply chain management will depend on innovation. Other scholars held different opinions, discussing the location and sustainability of production plants and finally determined that environmental, social and economic perspectives are important factors influencing location decisions [,,]. The choice of location is an important company level decision-making problem. It can be divided into two parts—“how” (ownership and governance strategies) and “where” (location strategy) []. This study will focus on the analysis of the “where” part, specifically by design in a framework for the “selection of the best geographical location” for manufacturing plants. Past methods used for analyzing location selection can roughly be divided into two categories—qualitative and quantitative models. Most of the quantitative models are based on statistical or economic models. For example, Reference [] used an economic model to analyze the factors affecting location selection. They found that per capita gross domestic product (GDP), GDP growth rate, agglomeration and government spending have a significant influence on location selection. Some studies argue that institutional quality and natural resources are also important factors influencing location selection []. Shuyan and Fabuš [] used the spatial economic model to analyze the problem of location selection and found that market size and investment freedom were the most important factors for Chinese companies investing in the EU. In addition, the market size, technical level and investment freedom of the host country all have significant influences on location selection for China’s foreign direct investment in the EU. He and Romanos [] used regional taxation as the basis of analysis via regression models of the companies’ location preferences and explored influence relationships in vertical and horizontal industrial linkages. The results indicate that both types of links have significant positive impacts. They also found that high taxation will hinder companies from choosing locations in these areas. Wyrwa [] constructed a theoretical model based on structural equation modeling to explore influence of market size, labor costs, workforce quality and workforce availability on site selection. In contrast, the number of studies using qualitative methods have been relatively few. Wang et al. [] used triangulation data collection combined with a qualitative research method to explore the determinants of location selection for enterprises in the biotechnology industry from the perspective of market expansion. Rahman and Kabir [] used the Geographic Information System (GIS) to analyze the location pattern, then applied qualitative analysis to discuss the causes of forming clusters or localization for the manufacturing industry.
The above quantitative models which rely upon data collection, economic or statistical model analysis and hypothesis testing need long term and massive data collection, which might not be practical or reflective of rapid changes in the markets. In the past few decades, the MCDM method has been applied in the location selection problems. The advantages of MCDM are that it is—(1) simple to operate and suitable for complex practical problems; (2) can provide decision makers with clear information for reference; (3) more comprehensive in relation to the level of consideration and criteria, which is helpful to recognize the problem status; (4) supports the evaluation of multiple alternatives with qualitative or quantitative data [,,,].
The most popular MCDM method is Satty’s AHP. Marinković et al. [] used a two stage Delphi and AHP methodology to analyze and formulate the determinants for location selection for the ICT industry and confirmed the relative significance of these factors. They found human resource availability to be the primary factor, followed by the political and economic environment. Some have used the Delphi, AHP, Preference ranking organization method for enrichment evaluation (PROMETHEE) methods to select the location of manufacturing factories, with consideration of factors such as skilled workers, expansion possibilities, availability of required materials, investment costs and on-site risk assessment []. Wang et al. [] given the consideration of human semantic ambiguity, used fuzzy Analytic Network Process (ANP) to explore the issue of location selection and found that small and medium-sized enterprises give priority to costs over regulations and communities, while large enterprises give priority to regulations over costs and community.
AHP and ANP are quite mature in the application of MCDM field. Although these methods can evaluate a complicate system based on the pairwise comparisons between the criteria, it is a time-consuming process and not easy to obtain the consistent results. Therefore, in recent years, there have been many advantages by using Best-worst method (BWM) [,]. This method selects the best and worst criteria first and then compares them with other criteria in pairs, effectively reducing the number of pairwise comparisons and obtaining better consistent results. In addition, some scholars use different methods. For example, Rocha et al. [] used evolutionary game theory and input–output analysis to evaluate a company’s strategic location selection. They considered many exogenous factors—potential markets, local productive interdependence, tax incentives and macroeconomic stability. Studies have found that a location in a tax-free market is not necessarily the best choice and that there is a direct relationship between government incentives and regional attractiveness. Liu [] applied the DEMATEL technology to analyze the causality and discuss the key factors for location selection. Their results showed production costs to be the most influential and industry characteristics to be the least influential factor.
Although the methods discussed above perform well, most of them ignore the fact that the criteria are actually interactive in the real world [,]. The DANP-mV model is suitable for improving this weakness and has been applied in many fields [,,,,,]. However, the DANP-mV is based on the subjective opinions of decision-makers. To remedy this shortcoming, the entropy method can be combined with the DANP method, thereby effectively reducing the limitation of subjective weighting in the DANP method. In practice, one also can adjust the ratio between subjective and objective weights based on decision needs. Therefore, the new model has the merit of being closer to the real environment.
3. Proposed Model
This section introduces the advantages of the DANP-mV model, its limitations and the calculation steps, for a detailed list of symbols, see Table A1 in Appendix A.
3.1. Advantages of the Hybrid Weights
The DANP-mV model is derived from the integration of DEMATEL, DANP and modified VIKOR, three models. It has a strong comprehensive effect due to the synergy of these three methods. Recently, the effectiveness of the DANP-mV model has been proven in many studies in different fields [,,,,,]. The model has several advantages such as consideration of the interdependencies between the criteria, needing fewer pairwise comparisons and ease of calculation. The DANP-mV model can be applied to solve decision problems in the real world, treating the process of decision-making as a whole evaluation system and focusing on the fundamental cause of the problem. Although the DANP-mV model has some advantages, it still relies on the subjective opinions of experts. Zavadskas and Podvezko [] pointed out that the criterion weight is critical in MCDM problems. If the criterion weights are only dependent on expert judgements, there will be potential uncertainty which affects the results [,]. Therefore, some have proposed the use of objective weights in the decision models [,,,].
Among the methods for determining objective weights, the entropy method has a solid theoretical foundation and has proven to be suitable for decision-making problems in different fields. The criterion weight is mainly determined based on the relationship between the original data and does not need decision-maker opinions [,,,].
During the process of decision-making, if only relies on subjective preferences of make decisions, the final decision-making results are easily influenced by subjective preferences and lose objectivity []. The empirical case of this study is to choose the manufacturing location of the factory. In the past, the company only relied on the subjective preferences of senior management to make decisions.
Thus, in this study, the entropy method is combined with the DANP method, to effectively reduce the limitation of subjective weighting in the DANP method. In practice, we can also adjust the ratio between subjective and objective weights based on decision needs.
The DANP-mV model proposed in this study retains the characteristics and advantages of the original DANP-mV model and at the same time considers the objective weights into the system. Therefore, the proposed model will be applicable to real-world decision-making. However, this study assumes that the integrated strategy coefficient of the combined weight is 0.5, which means that subjective and objective preferences are considered equally important.
3.2. Proposed DANP-mV Model
The proposed DANP-mV model is a hybrid research tool that contains the followed methods—DANP, entropy and modified VIKOR. DANP is used to evaluate the network relationship between the criteria and the influential weights of the criteria. The entropy method is mainly used for confirmation of the objective weights and the modified VIKOR method is applied for alternative selection. The complete operating process illustrated in Figure 1 can be divided into four phases:
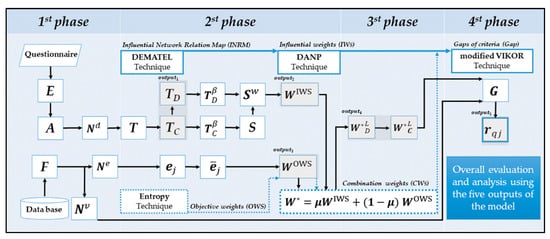
Figure 1.
Analytical processes.
- Pairwise comparisons between criteria through experts’ judgements for constructing the network relationship by the DEMATEL method to draw the influential network relationship map (INRM).
- Application of the DANP model to derive subjective weights and calculation of the objective weights based on the entropy method.
- Decide upon the coefficient, then combine the subjective and objective weights.
- Use the modified VIKOR method to select the best alternative.
3.2.1. Phase 1: Construct the Network Relationship
Step 1: Establish the initial direct influence relationship matrix
This step encodes the data obtained from the questionnaire responses of the K experts to get an initial direct influence relationship matrix E (Equation (1)) for each expert. Data collection is conducted through interviews with experts. The questionnaire scale is evaluated using scores from 0 to 4—(0) no influence, 1 (low influence), 2 (medium influence), 3 (high influence), 4 (extremely high influence). Experts are asked to specify the degree of influence between all criteria through pairwise comparisons.
The initial direct influence matrix is expressed as :
Step 2: Calculate the average direct influence relationship matrix
The direct influence relationship matrixes for the K experts are aggregated and divided by K to obtain the average direct influence relationship matrix as shown in Equation (2).
Step 3: Calculate the normalized directly influence relationship matrix
The average direct influence relationship matrix is normalized to obtain the normalized direct influence relationship matrix as shown in Equation (3).
Step 4: Derive total influence relationship matrix
Use the normalized direct influence relationship matrix to obtain the total influence relationship matrix (Equation (5)). The total influence relation matrix is an n by n matrix,
Step 5: Build (criteria/dimension) total influence relationship matrix and
From the total influence relationship matrix , the total influence relationship matrix of the criterion and the total influence relationship matrix of the dimensions can be obtained. The calculation of the total influence relationship matrix for criterion is expressed as in Equation (6), where is the m-th dimension (cluster); is the m-th criterion in the m-th dimension; is the sub-matrix of the criterion influence relationship obtained by comparing the i-th dimension with the j-th dimension.
The total influence relationship matrix of the dimension TD is shown in Equation (7).
Step 6: Degree of influence and the degree it is influenced between systems
The total influence relationship matrix is summed up to obtain the degree of influence and the degree it is influenced between systems. As shown in Equations (8) and (9), ri represents the sum of the rows on the i-th row of matrix T, which means the sum of the direct and indirect effects of criterion i on the other criteria; cj represents the sum of the columns in the j-th column of matrix T which means the sum of the direct and indirect influence on criterion j of the other criteria.
Finally, the degree of influence to and from the dimensions are calculated for the total influence relation matrix ().
Step 7: Draw the influence relationship map INRM
The degree of influence to and from are marked in coordinates to obtain the influence relationship map. Here, represents the sum of the influence of the criterion and the influence, which is also called the total influence degree which represents the importance of criterion i in the entire system. The represents the difference between the degree of influence of the criteria minus the degree it is influenced or the degree of net influence. This index represents the causal relationship between the criteria. Taking as the x axis and as the y axis, we can draw the INRM.
3.2.2. Phase 2: Derive the Subjective and Objective Weights
Step 1: Define the unweighted super matrix
The total influence relationship matrix of the criterion is normalized and transposed to generate an unweighted super matrix S. The normalization is expressed as in Equation (10) and the unweighted super matrix S is shown in Equation (11).
Step 2: Construct a weighted super matrix
First, normalize the total influence relationship matrix of the dimensions. Normalization is done by dividing each element by , as shown in Equation (12).
Next, calculate the weighted super matrix sw (Equation (13)).
Step 3: Derive the influence weight of the entire system
Limit the derivation of the weighted super matrix to obtain the overall influence weight as shown in Equation (14). The matrix will eventually become stable and a set of overall priority vectors obtained, which is called the influential weight .
Step 4: Establish the performance evaluation matrix
Extract performance data from the database to obtain a performance evaluation matrix as shown in Equation (15).
Step 5: Calculate the normalized performance evaluation matrix
Normalize the performance evaluation matrix to obtain the normalized performance evaluation matrix as shown in Equation (16).
Step 6: Derive the variation degree of the criterion
The normalized performance evaluation matrix is deduced from the variation degree to obtain the entropy value for the degree of variation for each criterion (Equation (17). The is a constant. Let be used to ensure that belongs from 0 to 1.
Step 7: Calculate the degree of the divergence coefficient
The entropy vector is used to calculate the degree of deviation and each degree of the divergence coefficient is obtained, as shown in Equation (18). The represents the inherent intensity of contrast between j criteria. The higher the value of in the criteria, the greater the relative importance of the role it plays in the whole system.
Step 8: Derive the objective weight of the entire system
The divergence coefficient is deduced by simple additive normalization to obtain the objective weight of the entire system as shown in Equation (19).
3.2.3. Phase 3: Integrate the Subjective and Objective Weight
The influential weight and the objective weight are combined to obtain the integrated weight of the entire system. As shown in Equation (20), the μ is a strategic coefficient which can be adjusted according to different cases. The preset value is 0.5, which indicates equal importance between the subjective and objective weights.
3.2.4. Phase 4: Use the Modified VIKOR to Perform the Evaluation
The concept of VIKOR originated from the problem of multi-objective planning []. Opricovic [] applied it to the research of civil engineering. Opricovic and Tzeng [] made a comparison between VIKOR and TOPSIS and their results showed that performance evaluation using VIKOR would be more reasonable and effective. For the detailed operation processes of original VIKOR, please refer to References [,,]. In this study, modified VIKOR will be used as the following steps:
Step 1: Define the aspiration level and the worst value
Decision-makers define the aspiration level and the worst value based on their expectations. In past performance evaluation methods using the positive and negative ideal solutions as the basis for evaluation, one may be caught in the dilemma of finding a good apple in a barrel of rotten apples. Therefore, it is better to replace those “ideal” solutions with the aspiration level and the worst value. In this study, the scales range from 0 to 100, where = 100 indicates the aspiration level and the is set as the worst value.
Step 2: Calculate the normalized performance evaluation matrix
Normalize the performance evaluation matrix to obtain the normalized performance evaluation matrix as shown in Equation (21). Normalize the performance of j criteria in q alternatives and calculate the distance between each performance and the aspiration level at the same time.
Step 3: Evaluate the overall performance of each alternative
The normalized performance evaluation matrix is weighted to obtain the overall benefit evaluation matrix G and the average group utility vector as shown in Equations (22) and (23). Hence, the normalized performance evaluation matrix means the difference between each criterion and the aspiration level for each alternative. The is the integrated weight and the overall performance evaluation will be generated through the interaction of the two matrices.
The original VIKOR considers two types of differences, the average group utility and the maximum regret. Since the purpose of the DANP-mV model is to focus on the decision-making process it can incorporate more references. The model uses the mean group utility only. Here, means the comprehensive difference between the various alternatives and the aspiration level, this difference will be based on the average group utility.
4. Empirical Example
The data collected and the analytical process are introduced below. Furthermore, based on the INRM and performance evaluation results, we provide some strategic suggestions for supply chain layout.
4.1. Description of the Problem
The case company is one of the world’s leading manufacturers of electronics. Its products include energy-saving equipment, hardware for automation facilities and ICT infrastructure. The company has long been concerned with environmental protection, so continues to develop innovative energy-saving products and solutions and constantly strives to improve the energy conversion efficiency of its products. Headquartered in Taiwan, it is committed to innovation and research and development. It has locations all over the world including China, Japan, Singapore, Thailand, the United States and Europe. It has 175 operating locations, 37 production locations and 69 research and development centers.
In March 2018, US President Trump signed the “Section 301 Investigation” officially launching the China-US trade war, which has caused a lot of turbulence and had a major impact on manufacturing in Asia and around the world []. Shocked companies have had to consider countermeasures in advance, to strategically adjust the layout of their global supply chain, speed up automation, accelerate mergers and acquisitions and supply chain transfers and strengthen cross-border management capabilities in order to reduce the negative impact of trade friction []. The major production lines of the case company have been heavily influenced by the impact of international economics and trade. To respond to the rapidly changing international trade situation and keep its core competitive advantage, the company set up a relevant project working group to conduct an evaluation and selection of possible transfer locations. The company has some experience and certain standards for the evaluation of such locations. First, global competitiveness indexes were used to evaluate the possible alternatives. After several rounds of discussion and field surveys, five potential locations for final decision were made, which included Croatia (HRV), India (IND), Taiwan (TWN), Uganda (UGA) and Vietnam (VNM). The company is now faced with how to make the choice of a new location that will affect the business performance of the enterprise and ultimately whether development can be sustained. It should be noted that the selected five possible locations were based on the needs of the case company. The other company might have other alternatives due to their specified requirements and operational environments.
4.2. Identification Criteria for Location Selection
The criteria for location selection have been discussed in many studies. They mainly depend on the characteristics of the enterprise and the operational environment. Therefore, the working group of the case company considered its needs and situation and identified 16 evaluation criteria. The evaluation criteria are summarized and divided into 5 dimensions, which include Economy and Market, Government and Governance, Business Dynamism, Infrastructure, Sustainability and Innovation (Table 1).

Table 1.
Dimensions and criteria for the evaluation system.
The “economic and market” dimension refers to the local economy, prices, exchange rates, financial system, market share and market openness. We will evaluate the macroeconomic stability, financial system and product market of the country or region. The “government and governance” dimension refers to the evaluation of the political stability and local security of the country or region. The assessment of the “business dynamism” dimension refers to the assessment of the administrative costs of the country, local administrative efficiency, operational risks, regulatory systems and corporate culture. “Infrastructure” refers to the assessment of the completeness of infrastructure construction, which includes local transportation infrastructure, water and electricity supply systems, ICT communications and labor adequacy. “Sustainability and innovation” refers to the attitude of the country or region dedicated to sustainable development and leading innovation development. Local sustainability policies/regulations and the cultivation of innovative resources have a significant impact on the sustainable development of enterprises.
4.3. Data Collection, Analysis and Results
The data were collected in two parts from expert opinions and public databases. Since the importance of the evaluating criteria reflects the company’s needs, the opinions of the working group must be included in the survey to obtain the influential weights. In the survey, experts were asked to make pairwise comparisons of the degree of influence from criterion i to j. After the survey, a 16 by 16 matrix was obtained based on each expert’s opinions, called the direct relationship matrix E. All the experts’ results were calculated using Equation (2) to obtain the average direct impact relationship matrix EAVG. Table 2 shows the average direct-influence relationship matrix. It can be found that C4 and C5 have a maximum impact (4 points) on C1, which shows that Security and Institutions have a high degree of impact on Macroeconomic stability.
Table 2.
Average direct-influence relation matrix of each criteria.
In the second part of the data collection process, data for the five potential locations were collected from the public database of the World Economic Forum (see Table 3). The data shows that Taiwan has the highest score on Macroeconomic. Prior studies have also found that Macroeconomic stability has significant impact on foreign investment []. Therefore, Macroeconomic stability is one of Taiwan’s important advantages in attracting foreign investment.
Table 3.
Performance of five potential alternatives.
Table 3 and Table 4 show the input data of analysis used by the proposed DANP-mV model. Following the steps outlined in Section 3, five outputs are obtained—(1) the INRM; (2) influential weights (IWs); (3) objective weights (OWs); (4) combination weights (CWs); (5) comparison and ranking of alternatives. DEMATEL can be used to derive the INRM (Figure 2) which provides a visual basis to help decision makers formulate sustainable development strategies for improvement. An examination of Figure 2 shows that Sustainability and Innovation (D5) and Business dynamism (D3) are causal factors in the whole system, whereas Government and Governance (D2), Infrastructure (D4) and Economy and Market (D1) are affected factors. In addition, this study finds that Government and Governance (D2) has the greatest influence on the entire evaluation system, which is similar to the results of Janssen and Van Der Voort []. This also shows that the quality of local governance plays an important role. A stable, more credible and effective and less corrupt system will affect the choice of this location for foreign investors.
Table 4.
Combination weights based on influence weights and objective weights.
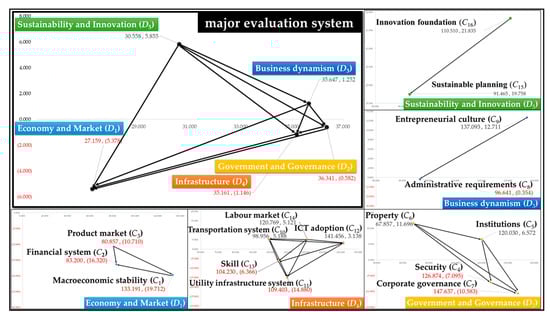
Figure 2.
Overall INRM (Influential Network Relation Map).
From the Sustainability and Innovation (D5) and Business dynamism (D3) dimensions, Sustainable planning (C15), Innovation foundation (C16) and Entrepreneurial culture (C9) are the causal criteria, whereas Administrative requirements (C8) is the affected criteria. Given that factors have an interactive relationship, managers should first focus attention on the causal dimensions such as Sustainability and Innovation and Business dynamism. Improving these causal factors will eventually remedy problems with the affected factors. Similarly, at the criterion level, manager should focus on Planning (C15), Innovation foundation (C16) and Entrepreneurial culture (C9) for improvement.
The proposed DANP model integrates the objective weights to avoid reliance upon the subjective preferences of decision-makers. The entropy method is used to calculate the objective weights. The calculation is based on the performance of alternatives. The objective weights of the criteria can be calculated based on the deviation of performance among alternatives using Equations (15)–(19). The combined weights are then found using Equation (20) as indicated in Table 4. It is worth noting that the ratio between the subjective and objective weights can be adjusted according to the needs of the company. After discussion with the working group of the case company, this study proposes setting the strategy coefficient μ to 0.5, indicating equal importance between the subjective and objective weights.
To visualize the results, the dimension and criterion weights are shown in Figure 3. The order of the dimensions found is Infrastructure (D4) (0.344), Government and Governance (D2) (0.253), Economy and Market (D1) (0.142), Business dynamism (D3) (0.140), Sustainability and Innovation (D5) (0.121). In other words, if the company wants to effectively grasp the geographical advantages, it must give priority to the local Infrastructure followed by Government and Governance (D2), Economy and Market (D1), Business dynamism (D3), Sustainability and Innovation (D5). At the criterion level, the top three criteria are ICT adoption (C12) (0.149), Entrepreneurial culture (C9) (0.078) and Property (C6) (0.077). This result is consistent with the results of expert interviews. The ICT adoption and Entrepreneurial culture are essential factors for selection the manufacturing location because these are necessary infrastructures for sustainable development.
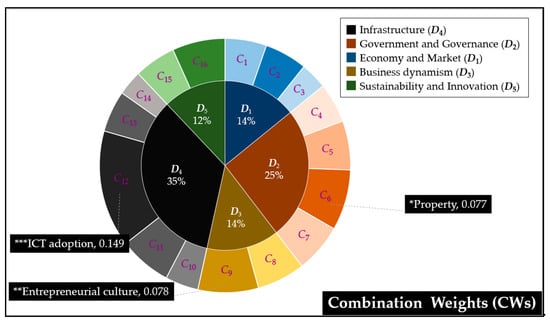
Figure 3.
Local Weights for Dimensions and Global Weights for Criteria.
Table 5 lists the gaps for each alternative as determined by Equations (21)–(23). The results show that TWN’s has a total gap 0.217, followed by HRV at 0.391, VNM at 0.398, IND at 0.421 and UGA at 0.519. In other words, the optimal location is Taiwan, followed by Croatia, Viet Nam, India and finally Uganda. It is worth noting that TWN performs best in the Economy and Market (D1) dimension at 0.006, followed by Infrastructure (D4) at 0.012, Government and Governance (D2) at 0.015, Business dynamism (D3) at 0.020 and Sustainability and Innovation (D5) at 0.021. Taiwan has better macroeconomic stability and financial system and relatively good transportation system, utility infrastructure system and labor market. Although Taiwan is the best choice, more attention should be paid to the performance of Entrepreneurial culture, ICT adoption and Innovation foundation, which have larger aspiration gaps. The foundation of Taiwan’s economics is dominated by small and medium-sized enterprises. The decentralization of power by individual businesses and family-owned businesses is often insufficient. In recent years, the international community has been continuously committed to the promotion of 5G communication technology but Taiwan’s population and market size restrictions will not be conducive to the development of ICT adoption. Therefore, Taiwan still has limited disruptive ideas, so Innovation foundation still has much room for improvement.
Table 5.
Gap analysis for the possible alternatives.
Croatia is another feasible choice if improvements can be made to the local Entrepreneurial culture and ICT adoption. For Viet Nam, the local Entrepreneurial culture and ICT adoption are the two critical items which need to be improved. India has good performance in the Economy and Market dimension but needs to pay attention to local ICT adoption and Entrepreneurial culture. Uganda should improve its innovation foundation.
5. Discussion
The proposed DANP mV model adds a combination weight assessment to the traditional model foundation. The combination weights (CWs) are set according to different strategic requirements and will eventually produce different assessment results. The influential weights (IWs), objective weights (OWs) and combination weights (CWs) for each dimension are shown on the left side of Table 6, while the results of the evaluation based on the different weights are shown on the right-hand side. The order of the influential weights, from highest to lowest, is Government and Governance (D2), Infrastructure (D4), Business dynamism (D3), Economy and Market (D1) and finally Sustainability and Innovation (D5). The order of the objective weights (OWs) from highest to lowest is Infrastructure (D4), Government and Governance (D2), Economy and Market (D1), Sustainability and Innovation (D5) and Business dynamism (D3). The order of the combination weights (CWs) from highest to lowest is Infrastructure (D4), Government and Governance (D2), Economy and Market (D1), Business dynamism (D3) and Sustainability and Innovation (D5).
Table 6.
Comparison of weights and ranking.
As indicated in Table 6, the final selection order is TWN, HRV, VNM, IND, UGA based on the combined weights. However, if only the DANP weight is considered, the final selection order will become TWN, IND, HRV, VNM and UGA. The results reveal that adding the objective weights to the model has a significant effect on the results. This is consistent with the study of Chang and Lin []. If the final evaluation decision is only dependent on subjective weights, the results will be easily influenced by the subjective preferences of senior managers.
Figure 4 shows the weight distribution among the dimensions and criteria and the gaps from the aspiration level for each alternative. From the DANP weight distribution, we can see that the most important dimension is Government and Governance (D2) and Infrastructure (D4), which is consistent with the opinions of the experts as given during the interview process. The greatest incentives for the case company to invest in China would be the various policy subsidies in the Hercynian Special Economic Zone and the large amount of cheap labor and the stable water and electricity supply. However, the greatest risk would be the uncertainty of the government’s authoritarian regime and regulations.
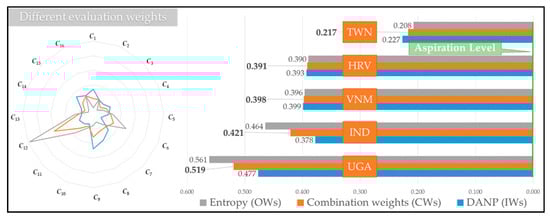
Figure 4.
Overall ranking and performance of each alternative.
It is worth noting that Infrastructure (D4) dominates the importance of the dimensions, regardless of whether for DANP or entropy analysis, where ICT adoption is the most important criterion in the Infrastructure dimension. The development of ICT infrastructure is essential for the governments of various countries who have been actively promoting Industry 4.0 and smart manufacturing in recent years. This results also show that the levels of ICT adoption have a critical effect on firms considering relocation of their production lines. Although the results indicate that TWN should be given the first priority, various gaps to the aspiration level remain in each dimension or criterion.
This study compares the original and modified VIKOR and the results are shown in Figure 5. The left side of the panel is the total gap of five countries. Orange is the modified calculation result and black is the original calculation result. It can be found that if using the original VIKOR, Taiwan’s total Gap is only 0.008, which means almost perfect performance. From the right side of the panel, the results of original VIKOR have zero gap in each criterion except in C5 Institutions with 0.008. This result might not reflect the real situation. Our proposed model can fix this problem. There are different gaps in each criterion to reach the aspiration level.
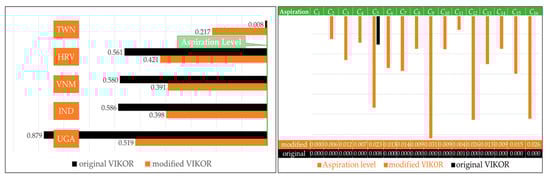
Figure 5.
VIKOR (VIšekriterijumsko Kompromisno Rangiranje) method Comparative that from to original and modification.
The case company should formulate and choose the supply chain layout in a more systematic way, to move towards the goal of sustainable operations. Based on the analysis, the assessed sites can be divided into a primary group (TWN, HRV) and a secondary group (VNM, IND, UGA). Although the countries in the primary group have the higher priority, there is still much room for improvement in their entrepreneurial culture, foundations of innovation and ICT adoption (Table 5). Based on the INRM (Figure 2), one can see that ICT adoption belongs in the Infrastructure dimension, which will be influenced by the Government and Governance, Business dynamism, Sustainability and Innovation dimensions. In addition, entrepreneurial culture belongs to the dimension of Business Dynamism, which is also influenced by the Sustainability and Innovation dimensions. Therefore, the Sustainability and Innovation dimensions are causal, being the driving force in the whole system. It is worth noting that the Sustainability and Innovation dimensions include innovation foundation and sustainable planning. Also, from the INRM, it can be seen that innovation foundation is causal and is the key item that the case company needs to develop and prepare for in advance. It is suggested that the case company set up an in-house innovation department and keep an eye on international economic trends and industry dynamics, to get first-hand information, to enable it to respond to rapid market changes. In summary, this study not only provides the optimal location for relocation of the production line but also offers suggested directions for improvement directions for the case company.
6. Conclusions
This paper explores a method based on the DANP-mV model for the location selection of production lines which have to be moved due to economic fluctuations and trade wars, which is for sustainable development. We propose a hybrid model that considers both subjective and objective weights thereby avoiding the shortcomings of the original DANP model. The model can help companies determine the optimal location for relocation and provide directions for improvement based on the INRM and gap analysis. We conducted an empirical study to demonstrate the usefulness of the proposed model. The following findings are derived:
- The proposed DANP-mV model has been verified by real cases, which can fix the shortcomings of original VIKOR method.
- The entrepreneurial culture, innovation foundation and ICT adoption are the three items that most possible alternatives need to strengthen to attract foreign investment.
- Sustainability and Innovation is the driving dimension in the system for the company’s sustainable development.
- Setting up an in-house innovation department could be an effective way in cope with deficiencies of the innovation foundation in the potential countries.
Although this study makes some contributions to the location selection problem, there are some suggestions for future study. First, the survey method is a time-consuming process. How to reduce the number of questions and still obtain reliable results could be the subject of further study. Second, different subjective and objective assessment methods can be compared with those used in the current study. Third, the current study used an average to represent the various experts’ opinions. Other techniques such as rough number or fuzzy theory could be considered to integrate the different opinions. Fourth, an electronics manufacturing company was used for the case study. The model can be applied in different industries for comparison. Finally, this study finds that sustainable development and innovation is an important factor driving the sustainable development of enterprises. It is suggested that follow-up research can be directed towards discussing how to effectively improve national policies based on the viewpoint of sustainable development and innovation.
Author Contributions
S.-W.H. literature review, article writing, analyzed the data and formatting. W.T. collected the data and article writing. J.J.H.L. writing—Review and editing. Finally, G.-H.T. writing—Review. All authors have read and agreed to the published version of the manuscript.
Funding
This research was funded by the Ministry of Science and Technology, Taiwan, grant number MOST 107-2410-H-305 -038 -MY3, MOST 108-2221-E-305 -002 -MY3 and MOST 109-2410-H-305-056.
Acknowledgments
The authors are extremely grateful for the symmetry editorial team’s valuable comments on improving the quality of this article.
Conflicts of Interest
The authors declare no conflict of interest.
Appendix A
Table A1.
List of symbols for this study.
Table A1.
List of symbols for this study.
| Term | Definition |
|---|---|
| Initial direct influence relationship matrix | |
| Number of experts | |
| Average direct influence relationship matrix | |
| Normalized directly influence relationship matrix | |
| Normalized performance evaluation matrix of entropy | |
| Normalized performance evaluation matrix of modified VIKOR | |
| Total influence relationship matrix | |
| Total influence relationship matrix of the dimensions | |
| Total influence relationship matrix of the criterion | |
| Degree of influence | |
| Degree of to be influenced | |
| Total influence degree | |
| The degree of net influence | |
| Unweighted super matrix | |
| Weighted super matrix | |
| Influence weight of the entire system | |
| Performance evaluation matrix | |
| Variation degree of the criterion | |
| Constant | |
| Degree of the divergence coefficient | |
| Objective weight of the entire system | |
| Combination weights | |
| Aspiration level | |
| Worst value | |
| Overall benefit evaluation matrix | |
| Average group utility |
Table A2.
List of abbreviations for this study.
Table A2.
List of abbreviations for this study.
| Term | Definition |
|---|---|
| MCDM | Multiple criteria decision making |
| DEMATEL | Decision Making Trial and Evaluation Laboratory |
| AHP | Analytic hierarchy process |
| ANP | Analytic network process |
| BWM | Best-worst multi-criteria decision-making method |
| DANP | DEMATEL-based ANP |
| modified VIKOR | Modified višekriterijumsko Kompromisno Rangiranje |
| DANP-mV | DEMATEL-based ANP- modified VIKOR |
| ICT | Information and Communication Technology |
| GDP | Gross domestic product |
| GIS | Geographic information system |
| INRM | Influential network relationship map |
| IWs | Influential weights |
| OWs | Objective weights |
| CWs | Combination weights |
References
- Lin, F. Fragmented production in east Asia: What are their implications for the Sino-U.S. trade. In Proceedings of the 13th Global Congress on Manufacturing and Management (GCMM 2016), Zhengzhou, China, 28–30 November 2016. [Google Scholar]
- Olhager, J.; Pashaei, S.; Sternberg, H. Design of global production and distribution networks: A literature review and research agenda. Int. J. Phys. Distrib. Logist. Manag. 2015, 45, 138–158. [Google Scholar] [CrossRef]
- Akkermans, H.; Van Wassenhove, L.N. Supply chain tsunamis: Research on low-probability, high-impact disruptions. J. Supply Chain Manag. 2018, 54, 64–76. [Google Scholar] [CrossRef]
- Maswood, S.J. Revisiting Globalization and the Rise of Global Production Networks, 1st ed.; Palgrave Macmillan: London, UK, 2018; pp. 81–112. [Google Scholar]
- Partovi, F.Y. An analytic model for locating facilities strategically. Omega 2006, 34, 41–55. [Google Scholar] [CrossRef]
- Liu, W.K. Using FDM and DEMATEL approaches to evaluate the location selection of investment. Int. J. Inf. Educ. Technol. 2015, 5, 732–739. [Google Scholar] [CrossRef]
- Mousavi, S.M.; Tavakkoli-Moghaddam, R.; Heydar, M.; Ebrahimnejad, S. Multi-criteria decision making for plant location selection: An integrated Delphi–AHP–PROMETHEE methodology. Arab. J. Sci. Eng. 2013, 38, 1255–1268. [Google Scholar] [CrossRef]
- Tavakkoli, M.R.; Mousavi, S.M.; Heydar, M. An integrated AHP-VIKOR methodology for plant location selection. Int. J. Eng. 2011, 24, 127–137. [Google Scholar]
- Liou, J.J.; Chuang, Y.C.; Tzeng, G.H. A fuzzy integral-based model for supplier evaluation and improvement. Inf. Sci. 2014, 266, 199–217. [Google Scholar] [CrossRef]
- Jain, N.K.; Kothari, T.; Kumar, V. Location choice research: Proposing new agenda. Manag. Int. Rev. 2016, 56, 303–324. [Google Scholar] [CrossRef]
- Marinković, S.; Nikolić, I.; Rakićević, J. Selecting location for a new business unit in ICT industry. Čas. Ekon. Teor. Praksu 2018, 36, 801–825. [Google Scholar]
- Wang, X.; Zhang, C.; Zhang, Z. Pollution haven or porter? The impact of environmental regulation on location choices of pollution-intensive firms in China. J. Environ. Manag. 2019, 248, 109248. [Google Scholar] [CrossRef]
- Mudambi, R.; Narula, R.; Santangelo, G.D. Location, collocation and innovation by multinational enterprises: A research agenda. Ind. Innov. 2018, 25, 229–241. [Google Scholar] [CrossRef]
- Ye, Y.; Wu, K.; Xie, Y.; Huang, G.; Wang, C.; Chen, J. How firm heterogeneity affects foreign direct investment location choice: Micro-evidence from new foreign manufacturing firms in the Pearl River Delta. Appl. Geogr. 2019, 106, 11–21. [Google Scholar] [CrossRef]
- Zheng, D.; Shi, M. Industrial land policy, firm heterogeneity and firm location choice: Evidence from China. Land Use Policy 2018, 76, 58–67. [Google Scholar] [CrossRef]
- Chou, C.C. Application of a fuzzy MCDM model to the evaluation of plant location. Int. J. Innov. Comput. Inf. Control 2010, 6, 2581–2594. [Google Scholar]
- Chen, C.T. A fuzzy MCDM method based on interval analysis for solving plant location selection problem. J. Chin. Inst. Ind. Eng. 2000, 17, 111–120. [Google Scholar] [CrossRef]
- Qu, G.B.; Zhao, T.Y.; Zhu, B.W.; Tzeng, G.H.; Huang, S.L. Use of a modified DANP-mV model to improve quality of life in rural residents: The empirical case of Xingshisi village, China. Int. J. Environ. Res. Public Health 2019, 16, 153. [Google Scholar] [CrossRef]
- Chang, P.Y.; Lin, H.Y. Manufacturing plant location selection in logistics network using Analytic Hierarchy Process. J. Ind. Eng. Manag. 2015, 8, 1547–1575. [Google Scholar] [CrossRef]
- Yang, K.; Zhu, N.; Chang, C.; Wang, D.; Yang, S.; Ma, S. A methodological concept for phase change material selection based on multi-criteria decision making (MCDM): A case study. Energy 2018, 165, 1085–1096. [Google Scholar] [CrossRef]
- Qin, Q.; Liang, F.; Li, L.; Wei, Y.M. Selection of energy performance contracting business models: A behavioral decision-making approach. Renew. Sustain. Energy Rev. 2017, 72, 422–433. [Google Scholar] [CrossRef]
- Lotfi, F.H.; Fallahnejad, R. Imprecise Shannon’s entropy and multi attribute decision making. Entropy 2010, 12, 53–62. [Google Scholar] [CrossRef]
- Lee, H.C.; Chang, C.T. Comparative analysis of MCDM methods for ranking renewable energy sources in Taiwan. Renew. Sustain. Energy Rev. 2018, 92, 883–896. [Google Scholar] [CrossRef]
- Mathivathanan, D.; Kannan, D.; Haq, A.N. Sustainable supply chain management practices in Indian automotive industry: A multi-stakeholder view. Resour. Conserv. Recycl. 2018, 128, 284–305. [Google Scholar] [CrossRef]
- Kusi-Sarpong, S.; Gupta, H.; Sarkis, J. A supply chain sustainability innovation framework and evaluation methodology. Int. J. Prod. Res. 2019, 57, 1990–2008. [Google Scholar] [CrossRef]
- Li, Y.; Mathiyazhagan, K. Application of DEMATEL approach to identify the influential indicators towards sustainable supply chain adoption in the auto components manufacturing sector. J. Clean. Prod. 2018, 172, 2931–2941. [Google Scholar] [CrossRef]
- Sauer, P.C.; Seuring, S. Sustainable supply chain management for minerals. J. Clean. Prod. 2017, 151, 235–249. [Google Scholar] [CrossRef]
- Chen, L.; Olhager, J.; Tang, O. Manufacturing facility location and sustainability: A literature review and research agenda. Int. J. Prod. Econ. 2014, 149, 154–163. [Google Scholar] [CrossRef]
- Anvari, S.; Turkay, M. The facility location problem from the perspective of triple bottom line accounting of sustainability. Int. J. Prod. Res. 2017, 55, 6266–6287. [Google Scholar] [CrossRef]
- Zandiatashbar, A.; Hamidi, S.; Foster, N. High-tech business location, transportation accessibility, and implications for sustainability: Evaluating the differences between high-tech specializations using empirical evidence from US booming regions. Sustain. Cities Soc. 2019, 50, 101648. [Google Scholar] [CrossRef]
- Kim, J.U.; Aguilera, R.V. Foreign location choice: Review and extensions. Int. J. Manag. Rev. 2016, 18, 133–159. [Google Scholar] [CrossRef]
- Kurtović, S.; Maxhuni, N.; Halili, B.; Talović, S. The determinants of FDI location choice in the Western Balkan countries. Post Communist Econ. 2020, 1–22. [Google Scholar] [CrossRef]
- Kamal, M.A.; Hasanat Shah, S.; Jing, W.; Hasnat, H. Does the quality of institutions in host countries affect the location choice of Chinese OFDI: Evidence from Asia and Africa. Emerg. Mark. Financ. Trade 2020, 56, 208–227. [Google Scholar] [CrossRef]
- Shuyan, L.; Fabuš, M. Study on the spatial distribution of China’s Outward Foreign Direct Investment in EU and its influencing factors. Entrep. Sustain. Issues 2019, 6, 1080–1096. [Google Scholar] [CrossRef]
- He, Z.; Romanos, M. Spatial agglomeration and location determinants: Evidence from the US communications equipment manufacturing industry. Urban Stud. 2016, 53, 2154–2174. [Google Scholar] [CrossRef]
- Wyrwa, J. Analysis of determinants of the inflow of foreign direct investment to Poland. Part I—Theoretical considerations. Management 2019, 23, 238–262. [Google Scholar] [CrossRef]
- Wang, K.J.; Lestari, Y.D.; Yang, T.T. Location determinants of market expansion in China’s second-tier cities: A case study of the biotechnology industry. J. Bus. Ind. Mark. 2015, 3, 139–152. [Google Scholar] [CrossRef]
- Rahman, S.T.; Kabir, A. Factors influencing location choice and cluster pattern of manufacturing small and medium enterprises in cities: Evidence from Khulna city of Bangladesh. J. Glob. Entrep. Res. 2019, 9, 61. [Google Scholar] [CrossRef]
- Breedveld, S.; Craft, D.; Van Haveren, R.; Heijmen, B. Multi-criteria optimization and decision-making in radiotherapy. Eur. J. Oper. Res. 2019, 277, 1–19. [Google Scholar] [CrossRef]
- Cinelli, M.; Kadziński, M.; Gonzalez, M.; Słowiński, R. How to support the application of multiple criteria decision analysis? let Us Start with a comprehensive taxonomy. Omega 2020, 96, 102261. [Google Scholar] [CrossRef]
- Katsikopoulos, K.V.; Durbach, I.N.; Stewart, T.J. When should we use simple decision models? A synthesis of various research strands. Omega 2018, 81, 17–25. [Google Scholar] [CrossRef]
- Tzeng, G.H.; Shen, K.Y. New Concepts and Trends of Hybrid Multiple Criteria Decision Making, 1st ed.; CRC Press: London, UK, 2017. [Google Scholar]
- Wang, K.J.; Lestari, Y.D.; Tran, V.N.B. Location selection of high-tech manufacturing firms by a fuzzy analytic network process: A case study of Taiwan high-tech industry. Int. J. Fuzzy Syst. 2017, 19, 1560–1584. [Google Scholar] [CrossRef]
- Khokhar, M.; Hou, Y.; Rafique, M.A.; Iqbal, W. Evaluating the Social Sustainability Criteria of Supply Chain Management in Manufacturing Industries: A Role of BWM in MCDM. Probl. Ekorozw. Probl. Sustain. Dev. 2020, 15, 185–194. [Google Scholar]
- Rocha, A.; Silveira, D.; Perobelli, F.; Vasconcelos, S. Modelling the location choice: Evidence from an evolutionary game based on regional input-output analysis. Reg. Stud. 2019, 53, 1734–1746. [Google Scholar] [CrossRef]
- Liou, J.J. New concepts and trends of MCDM for tomorrow–in honor of Professor Gwo-Hshiung Tzeng on the occasion of his 70th birthday. Technol. Econ. Dev. Econ. 2013, 19, 367–375. [Google Scholar] [CrossRef]
- Liou, J.J.; Lu, M.T.; Hu, S.K.; Cheng, C.H.; Chuang, Y.C. A hybrid MCDM model for improving the electronic health record to better serve client needs. Sustainability 2017, 9, 1819. [Google Scholar] [CrossRef]
- Lin, S.H.; Wang, D.; Huang, X.; Zhao, X.; Hsieh, J.C.; Tzeng, G.H.; Chen, J.T. A multi-attribute decision-making model for improving inefficient industrial parks. Environ. Dev. Sustain. 2020, 1–35. [Google Scholar] [CrossRef]
- Tsuei, H.J.; Tsai, W.H.; Pan, F.T.; Tzeng, G.H. Improving search engine optimization (SEO) by using hybrid modified MCDM models. Artif. Intell. Rev. 2020, 53, 1–16. [Google Scholar] [CrossRef]
- Lin, P.J.; Shiue, Y.C.; Tzeng, G.H.; Huang, S.L. Developing a sustainable long-term ageing health care system using the DANP-mV model: Empirical case of Taiwan. Int. J. Environ. Res. Public Health 2019, 16, 1349. [Google Scholar] [CrossRef]
- Peng, K.H.; Tzeng, G.H. Exploring heritage tourism performance improvement for making sustainable development strategies using the hybrid-modified MADM model. Curr. Issues Tour. 2019, 22, 921–947. [Google Scholar] [CrossRef]
- Huang, J.Y.; Shen, K.Y.; Shieh, J.C.; Tzeng, G.H. Strengthen financial holding companies’ business sustainability by using a hybrid corporate governance evaluation model. Sustainability 2019, 11, 582. [Google Scholar] [CrossRef]
- Zavadskas, E.K.; Podvezko, V. Integrated determination of objective criteria weights in MCDM. Int. J. Inf. Technol. Decis. Mak. 2016, 15, 267–283. [Google Scholar] [CrossRef]
- Zhao, J.; Ji, G.; Tian, Y.; Chen, Y.; Wang, Z. Environmental vulnerability assessment for mainland China based on entropy method. Ecol. Indic. 2018, 91, 410–422. [Google Scholar] [CrossRef]
- Vujičić, M.D.; Papić, M.Z.; Blagojević, M.D. Comparative analysis of objective techniques for criteria weighing in two MCDM methods on example of an air conditioner selection. Tehnika 2017, 72, 422–429. [Google Scholar] [CrossRef]
- Duckstein, L.; Opricovic, S. Multiobjective optimization in river basin development. Water Resour. Res. 1980, 16, 14–20. [Google Scholar] [CrossRef]
- Opricovic, S. Multicriteria Optimization of Civil Engineering Systems. Ph.D. Thesis, Faculty of Civil Engineering, University of Belgrade, Belgrade, Serbia, 1998. [Google Scholar]
- Opricovic, S.; Tzeng, G.H. Compromise solution by MCDM methods: A comparative analysis of VIKOR and TOPSIS. Eur. J. Oper. Res. 2004, 156, 445–455. [Google Scholar] [CrossRef]
- Tzeng, G.H.; Huang, J.J. Multiple Attribute Decision Making: Methods and Applications, 1st ed.; CRC Press: London, UK, 2011. [Google Scholar]
- Liou, J.J.; Chuang, Y.T. Developing a hybrid multi-criteria model for selection of outsourcing providers. Expert Syst. Appl. 2010, 37, 3755–3761. [Google Scholar] [CrossRef]
- Kao, R.S. Sino-US trade war and its possible impact on Taiwan’s industries. J. Strateg. Secur. Anal. 2018, 150, 59–68. [Google Scholar]
- Chen, J.L. Discussion on the impact of Sino-US trade war on Taiwanese manufacturing. Int. J. Bus. Manag. 2019, 14, 70–76. [Google Scholar] [CrossRef]
- Ray, A.; De, A.; Dan, P.K. Facility location selection using complete and partial ranking MCDM methods. Int. J. Ind. Syst. Eng. 2015, 19, 262–276. [Google Scholar] [CrossRef]
- Gupta, P.; Mehlawat, M.K.; Grover, N. Intuitionistic fuzzy multi-attribute group decision-making with an application to plant location selection based on a new extended VIKOR method. Inf. Sci. 2016, 370, 184–203. [Google Scholar] [CrossRef]
- Tabari, M.; Kaboli, A.; Aryanezhad, M.B.; Shahanaghi, K.; Siadat, A. A new method for location selection: A hybrid analysis. Appl. Math. Comput. 2008, 206, 598–606. [Google Scholar] [CrossRef]
- Shah, M.H. The effect of macroeconomic stability on inward FDI in African developing countries. International. J. Bus. Stud. Rev. 2016, 1, 1–11. [Google Scholar]
- Janssen, M.; Van Der Voort, H. Adaptive governance: Towards a stable, accountable and responsive government. Gov. Inf. Quart. 2016, 33, 1–5. [Google Scholar] [CrossRef]
- Global Competitiveness Index 4.0. Available online: www.weforum.org/gcr/rankings (accessed on 15 November 2019).
© 2020 by the authors. Licensee MDPI, Basel, Switzerland. This article is an open access article distributed under the terms and conditions of the Creative Commons Attribution (CC BY) license (http://creativecommons.org/licenses/by/4.0/).