Article

High-Sensitivity Capsule-Shaped Sensor Based on 2D Photonic Crystals

1
Laboratoire d’Analyse des Signaux et Systèmes, Université Mohamed Boudiaf-M’sila, BP.166, Route Ichebilia, M’sila 28000, Algeria
2
Internetworks Research Laboratory, School of Computing, Universiti Utara Malaysia, Sitok 06010, Malaysia
3
Department of Computer Science and Cybersecurity, Metropolitan State University, 700 East Seventh Street, Saint Paul, MN 55106, USA
4
Institute of Sustainable Energy (ISE), Universiti Tenaga Nasional (UNITEN), Selangor 43000, Malaysia
5
Department of Information Technology, The University of Haripur, Haripur 22620, Pakistan
*
Author to whom correspondence should be addressed.
Symmetry 2020, 12(9), 1480; https://doi.org/10.3390/sym12091480
Submission received: 18 August 2020 / Revised: 1 September 2020 / Accepted: 5 September 2020 / Published: 9 September 2020
(This article belongs to the Section Computer)

Abstract

:
This paper presents a new capsule-shaped sensor to detect the glucose concentration in the human body. The model under study was formulated by relying on the index change in the refractive index (RI) because of the change in the sample that infiltrated the cavity. The index of refraction change is accompanied by modifying the resonant wavelength. The recommended model has considered the simple shape and ease of manufacture, along with other characteristics such as sensitivity and a low detection limit. The results report a high sensitivity of S = 546.72 nm/RI unit (RIU), a high quality factor of Q = 2066.24, a low detection limit of DL = 1.44 × 10⁻⁴ RIU, and a high value of transmission of 97%, which are considered to be sufficient and efficient in detecting measured material. This proposed model provides many opportunities and is promising for the manufacture of different types of sensing detection devices.

1. Introduction

Due to the constant advancement of sensing applications, optical sensors have gained remarkable attention and popularity as promising sensors because of their exclusive characteristics, such as immunity to electromagnetic interference, quick and fast response, high speed and remote sensing capability. The relentless demand for optical sensors has prompted researchers worldwide to look beyond optical sensors in the domain of pharmaceutical and food quality management and towards the field of sensing and the healthcare sensing domain, as in [1,2,3]. A recent approach garnering remarkable attention is photonic crystal (PhC)-based sensors, whereby cylindrical air holes with a given lattice constant in a thin silicon membrane are capable of engineering the light emitted and bringing it to exactly where it is required to get the measurement difference and variant refractive index (RI) configuration by manipulating the air hole diameters and pitches (distance between air holes) to guide the light. The key to PhC technology is in the magnitude of the arrangement of the air holes, whereby an array of air holes encompass a silica core section. This reduces the average refractive index of that core part. Moreover, light is restricted to the core without the use of dopants. In the fabrication process, three modules are gathered to develop a jacketing tube, a silica core rod, and preformed silica capillaries. The capillaries in the rod are bundled and injected into the jacketing tube. By drawing and heating the assembly, the capillaries in the rod fuse to form a photonic crystal fiber. Therefore, various procedures and formations are persistently being proposed to optimize and upsurge the microcavity detection efficiency [1,2,3,4,5], ring resonators [6] waveguides [7,8], slot waveguides [9] and heterostructures [10]. All the aforementioned studies have exploited extreme sensitivity-resonant conditions in PhC concerning the refractive index changes. Thus, this paper addresses the sensitivity and the transmission limit in proportional relation, unlike previous studies that reported decent quality factor values at the expense of transmission. Safia et al., in [11], reported a sensitivity of 462 nm/RI unit (RIU), and a high quality factor of 1.11 × 10⁵; however, the transmission was less than 80%. Lijun Huang et al., in [12], proposed a design based on the ring–slot resonator, the quality factor achieved is 11,477.3 and achieving a sensitivity of 160 nm/RIU; however, the transmission rate was 80% as well. Another technique is based on surface plasmon polaritons (SPPs) exploited for the design of plasmonic RI sensors with high sensitivity [13,14]. In PhC design, high quality factor values must be accompanied by an increase in transmission rate in order to manufacture imperfections. Thus, the inverse relationship between quality factor and transmission parameter greatly limits the potential for practical applications [15]. This paper proposes a new sensor with a capsule-shaped cavity coupled to an input waveguide to excite the cavity resonance, and an output waveguide to measure the transmission spectrum through the capsule-shaped cavity. In addition, the ability of the presented cavity to achieve a higher sensitivity, a high quality factor and a low detection limit (DL) are considered to reflect an increase in the transmission rate, which is important for practical applications. The proposed design is not considered complicated in its form or shape. In fact, it is easy to fabricate with less manufacturing imperfections.

2. Materials and Methods

The sensor consists of a 2D hexagonal lattice of air holes fixed in a silicon slab, where nsi = 3.48. The period (lattice constant) is a = 400 nm, the radius of air holes is r = 0.33∗a and the height extends infinity along the vertical axis, as shown in Figure 1. The cavity was created to take on a capsule shape on both sides in the middle of the device, which was coupled with two waveguides formed by presenting line defects. For analyzing the proposed sensor, two approaches, the plane wave expansion (PWE) and the Finite Difference Time Domain Method (FDTD) were used. To ensure the accuracy of the computed results, the spatial grid should be trivial for resolving the minimum characteristic of the field to be simulated. Thus, we chose Δx = Δy = 0.01 µm. For constant computations, it is essential to assure an association between the space increment and time increment Δt. To attain a firm model, one should follow the specifications that relate the temporal and spatial step sizes [16]:
c Δ t < 1 ( 1 / Δ x 2 + 1 / Δ y 2
where c is represents the light velocity.
The borderline settings used at the spatial edges use the perfectly matched layer a perfectly matched layer (PML) technique; using PML allows us to obtain a better accuracy in which both electric and magnetic energy are absorbed without inducing reflections. The thickness of the PML used was equal to 0.5 µm [17].
The PhC sensor’s basic elements and structure are shown in Figure 2a. The hexagonal unit cell, translated by the primitive lattice vector to fill the whole 2D space, is shown in Figure 2b. A hexagonal (triangular) PhC structure necessitates a lower index contrast to create a larger bandgap than other lattices. Therefore, we selected the hexagonal unit cell.
Figure 2b demonstrates the Brillouin zone (BZ) and k-path for a 2D triangular lattice as well, where k represents the wave vector in the BZ. This structure exhibits a wide transverse electric (“TE”) bandgap in the diagram dispersion in the normalized frequency between 0.2137 (ωa/2πc) and 0.3044 (ωa/2πc), as presented in Figure 3.

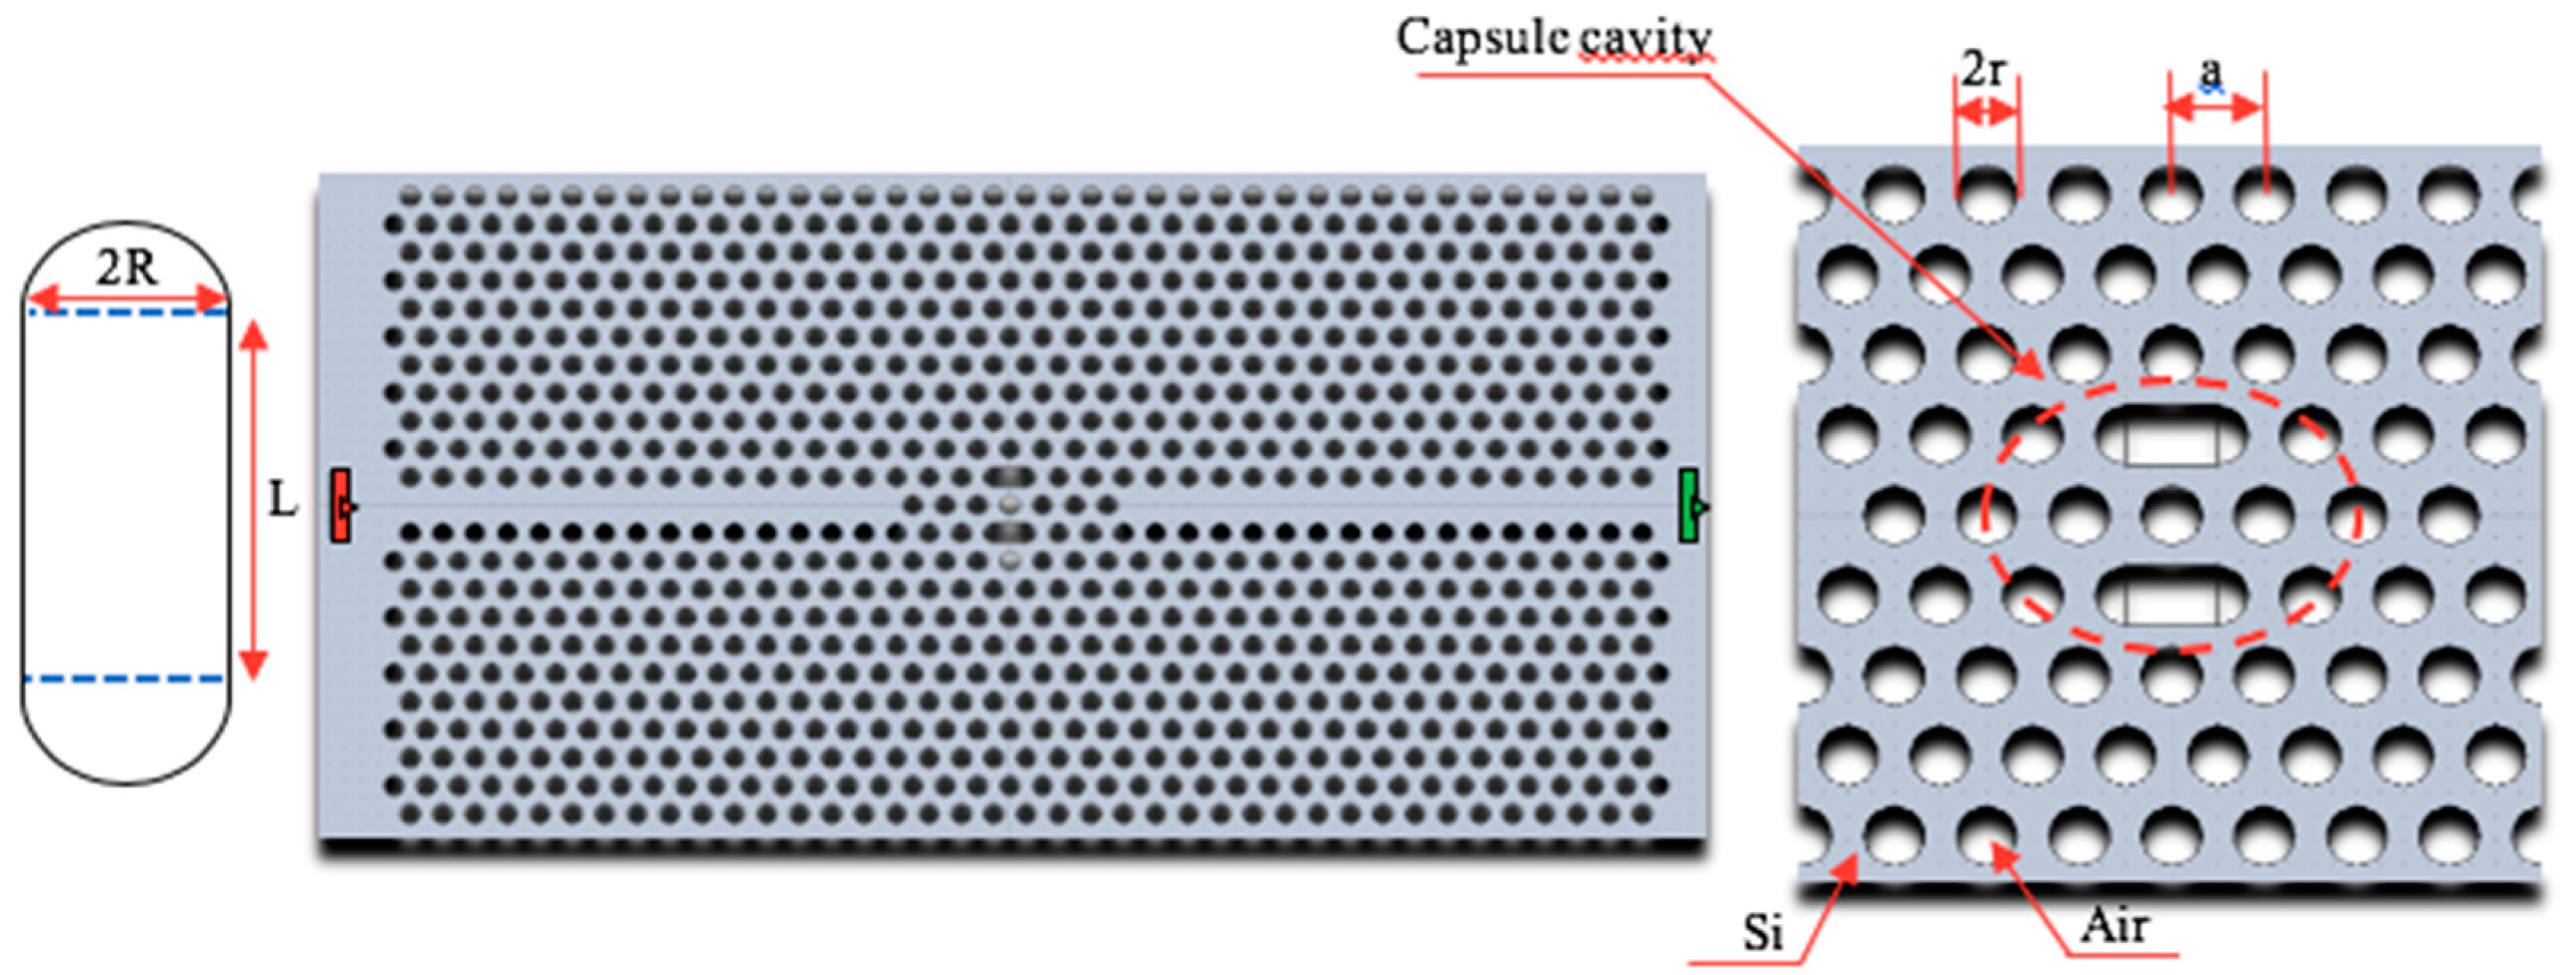
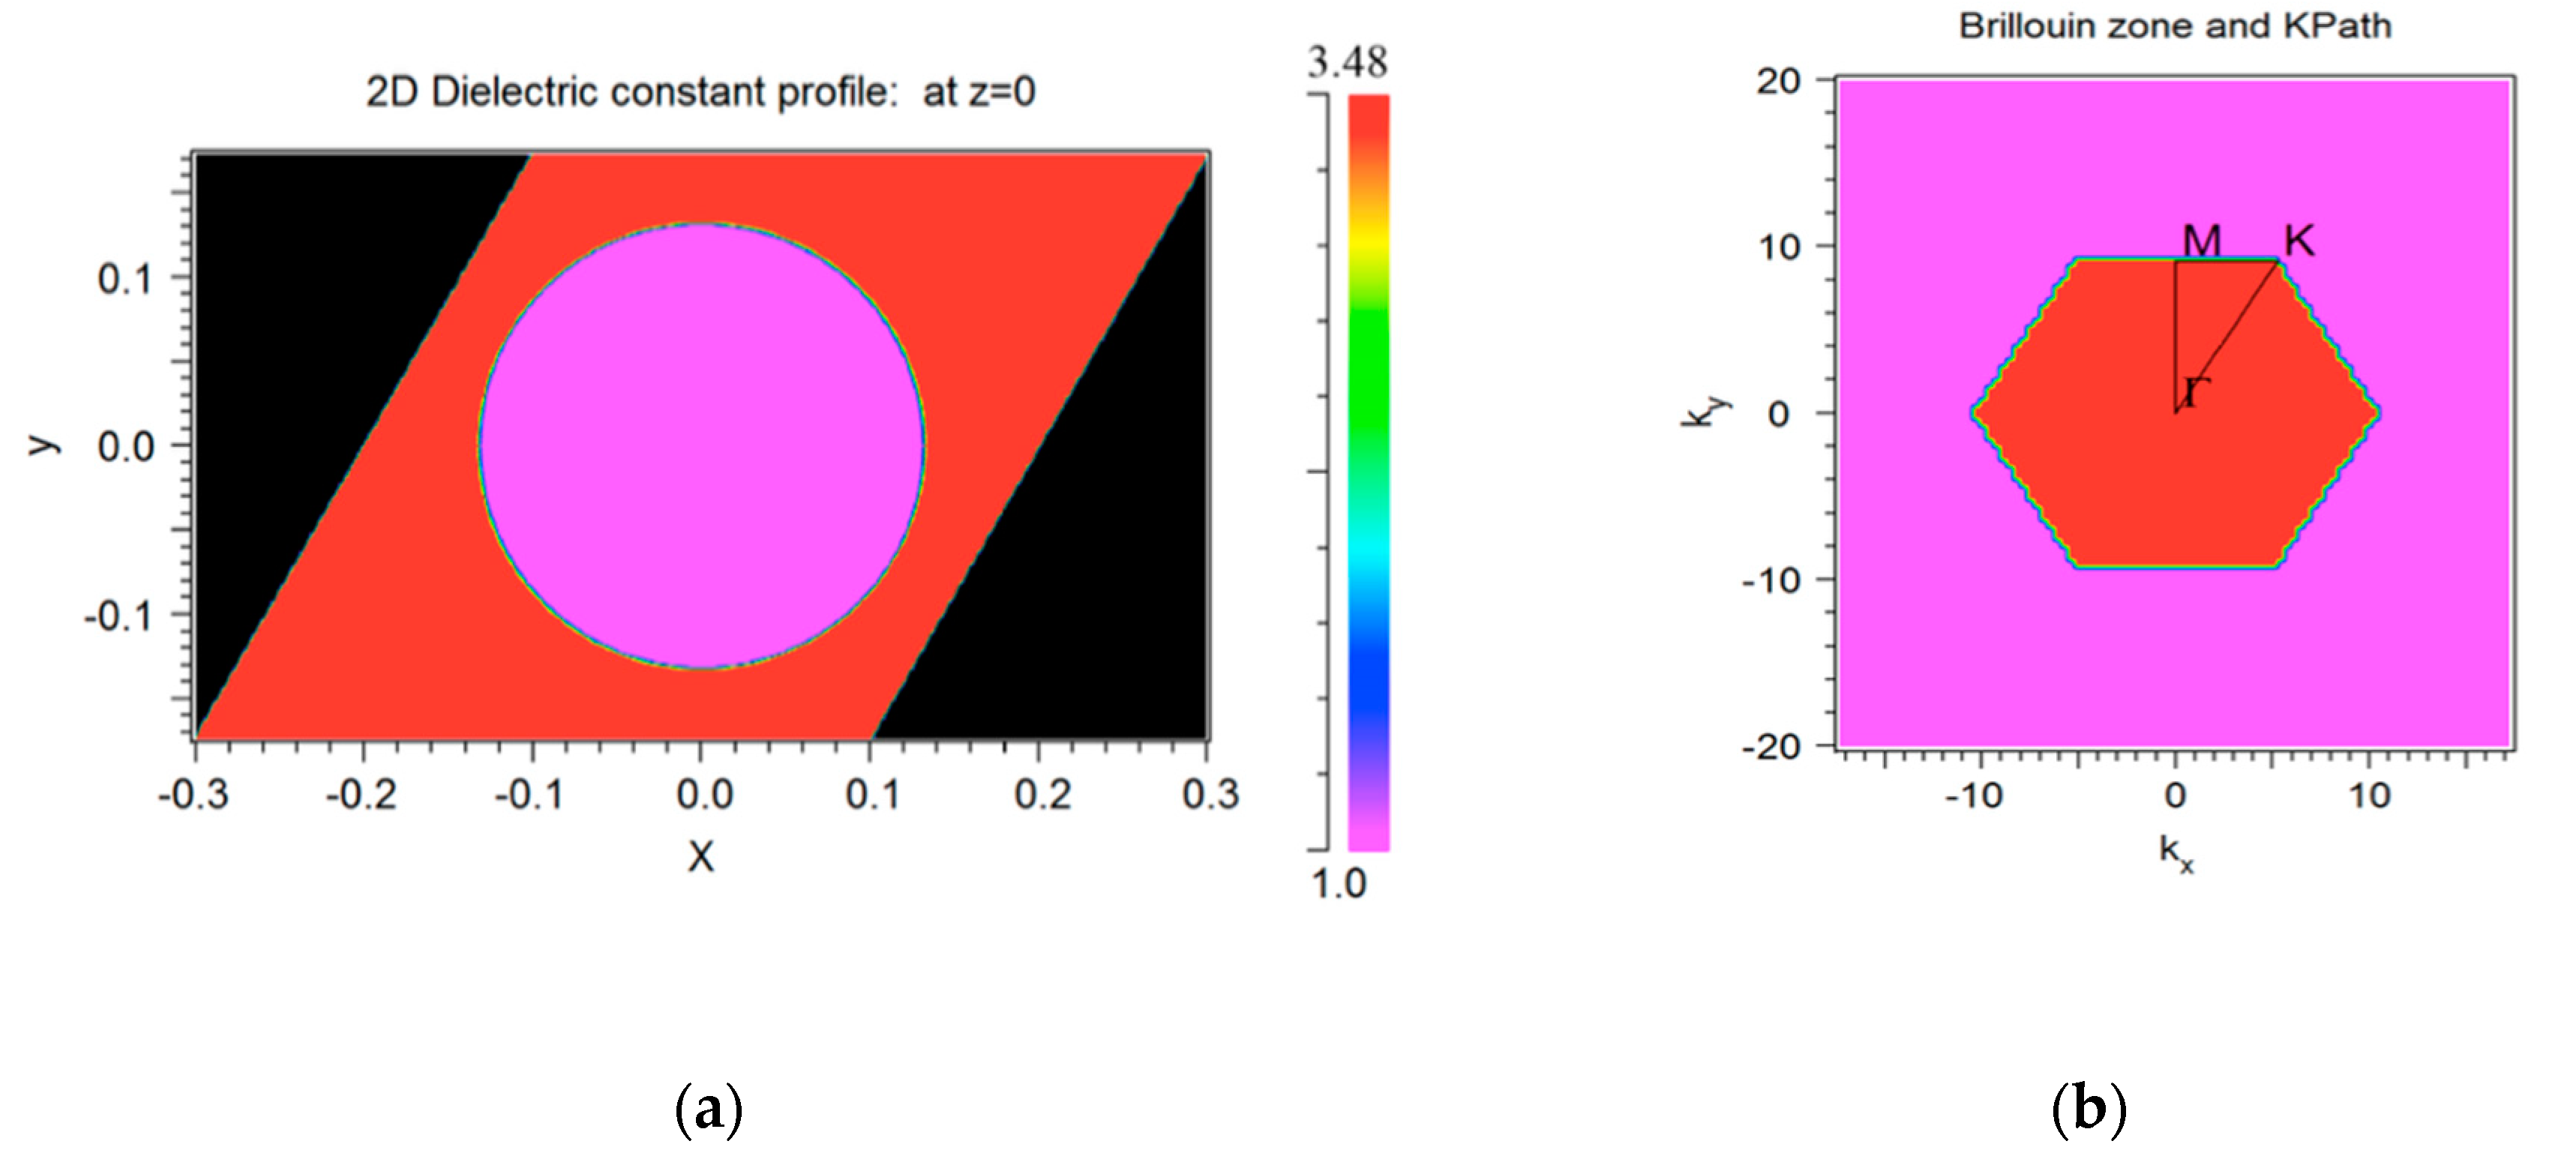
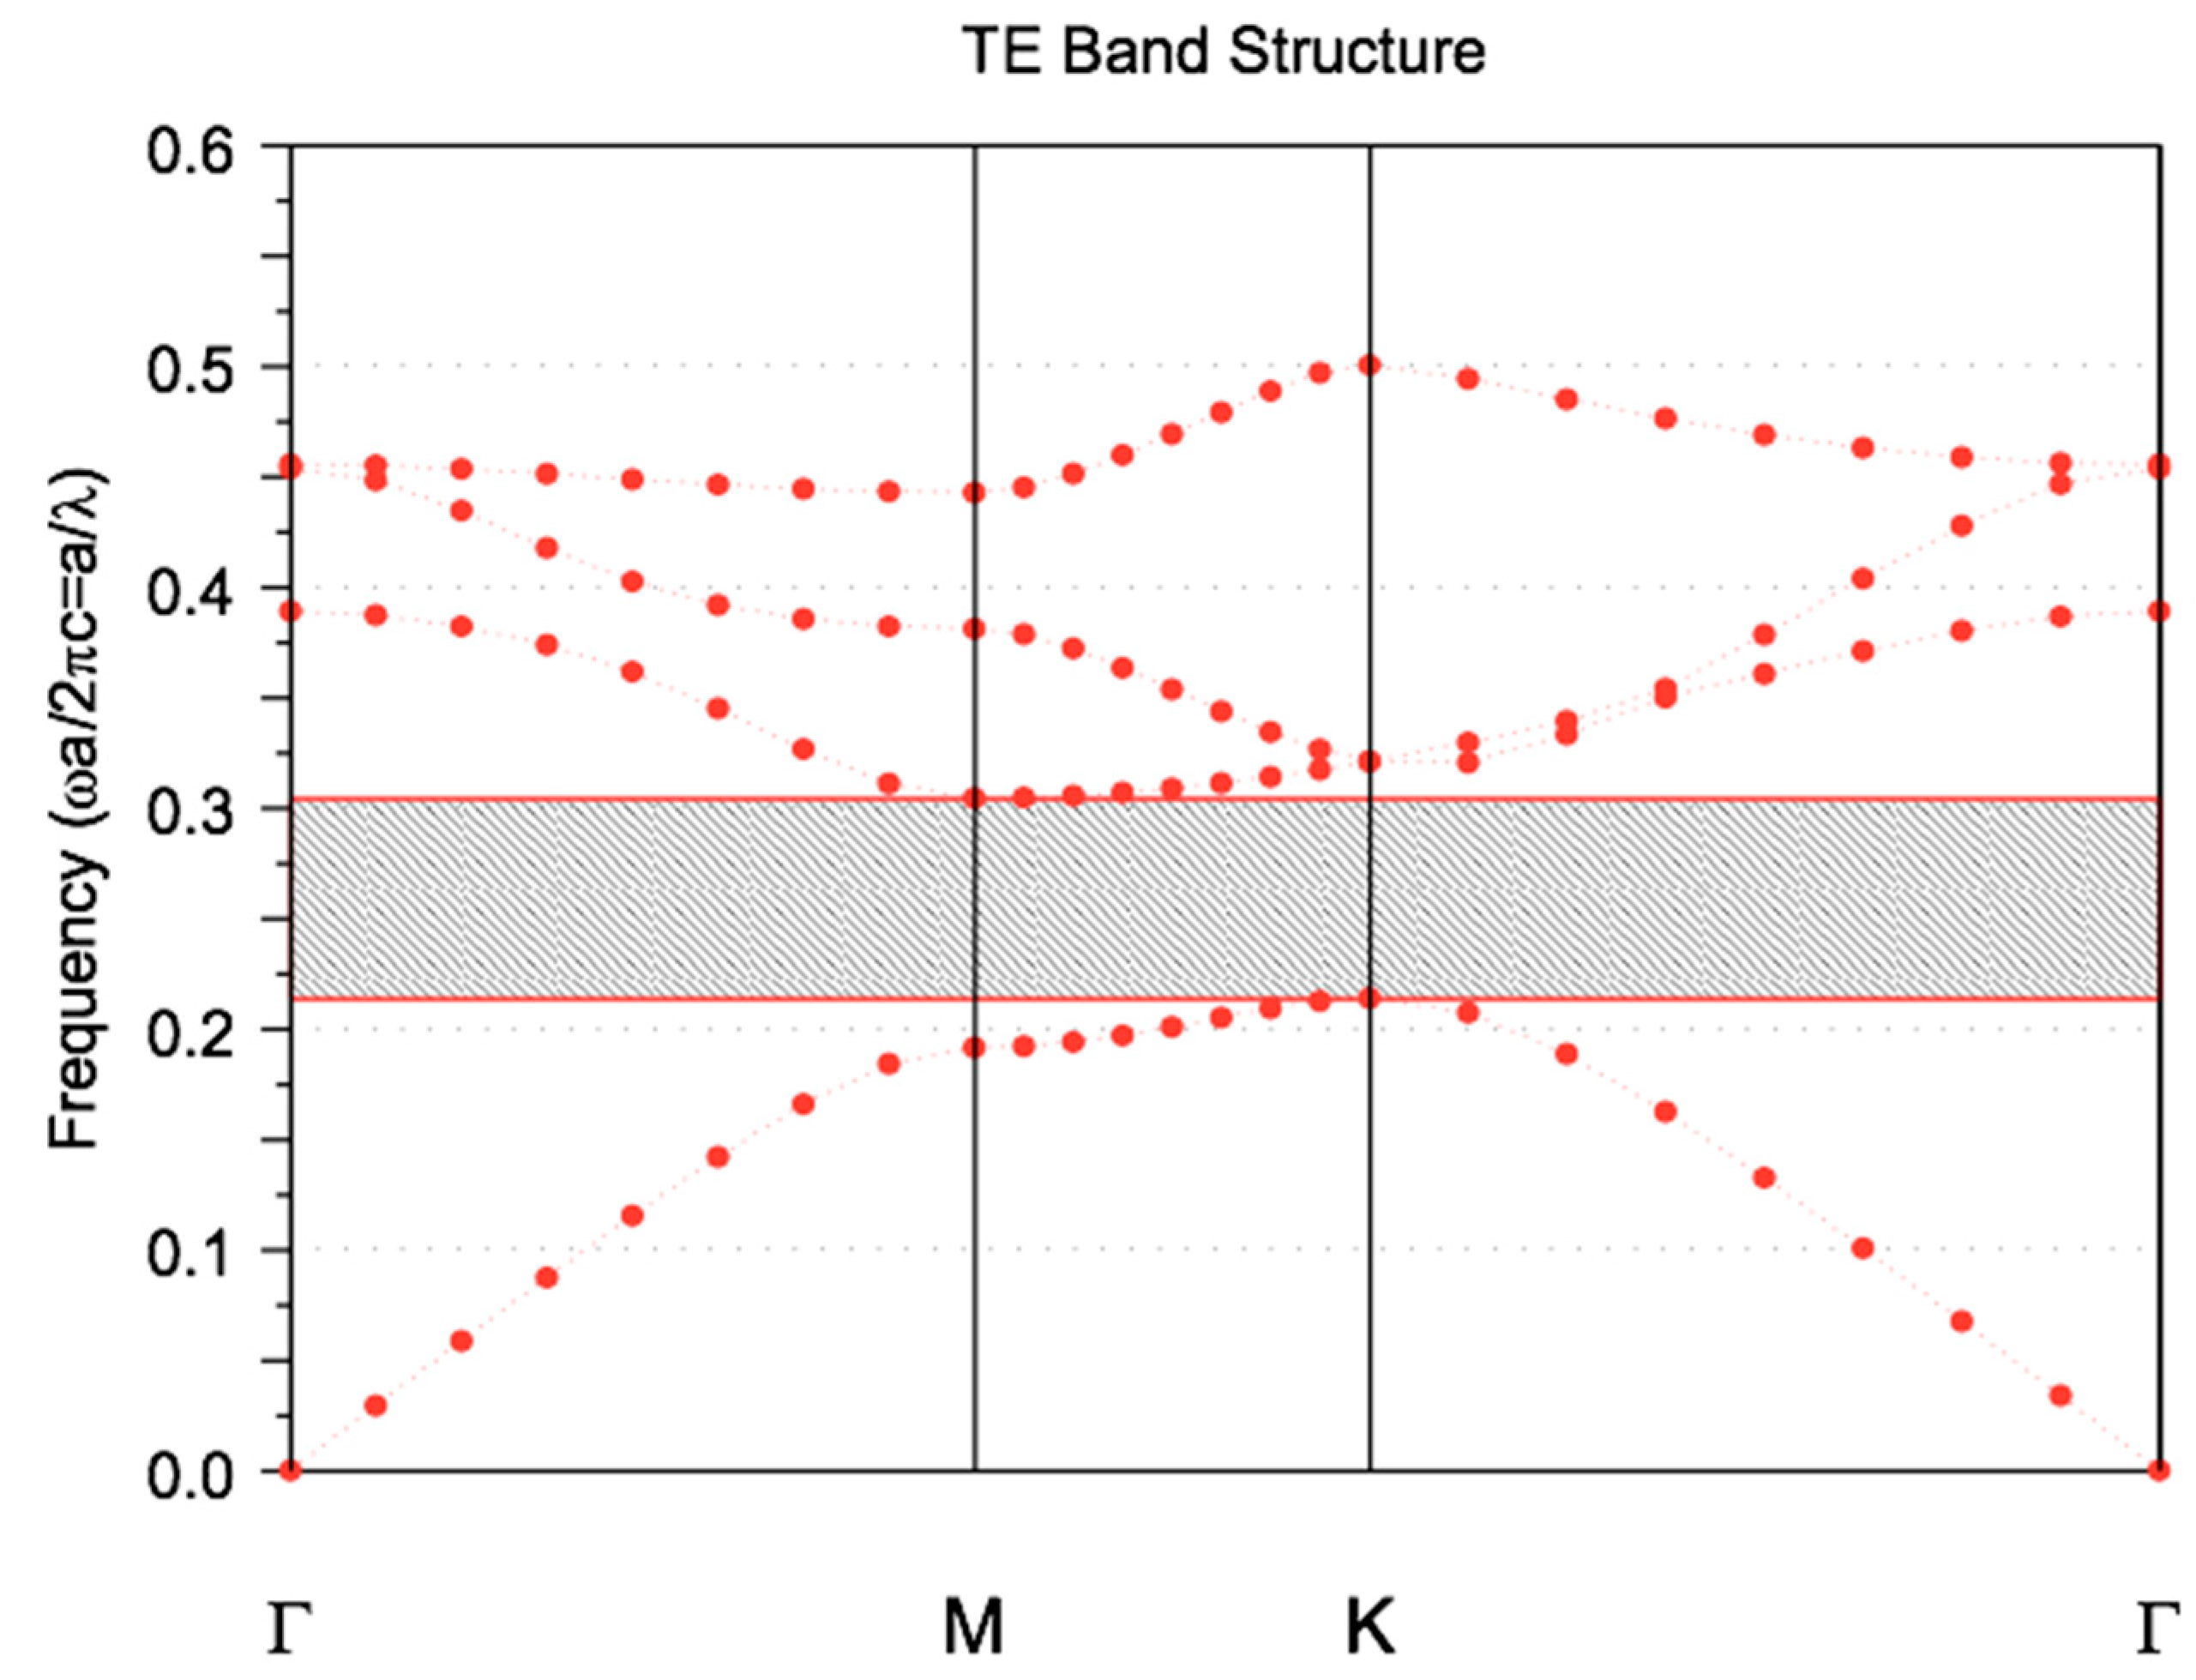
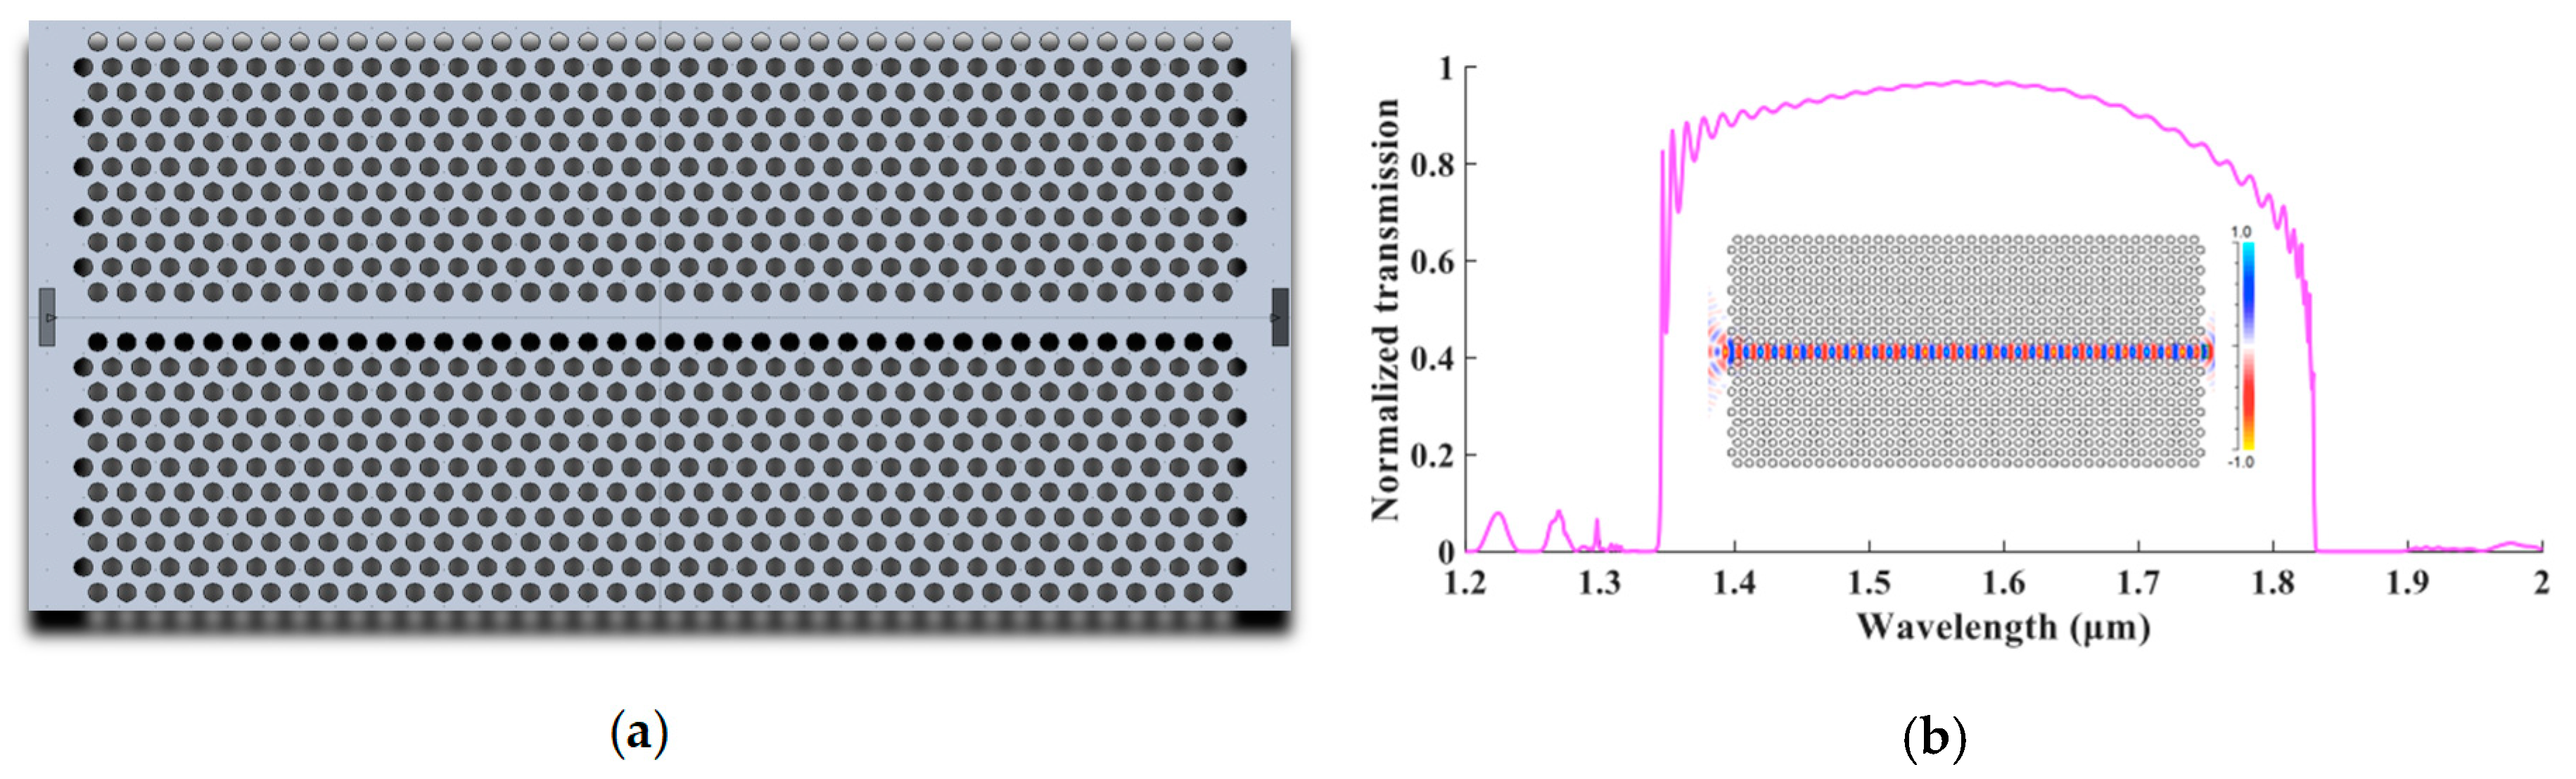
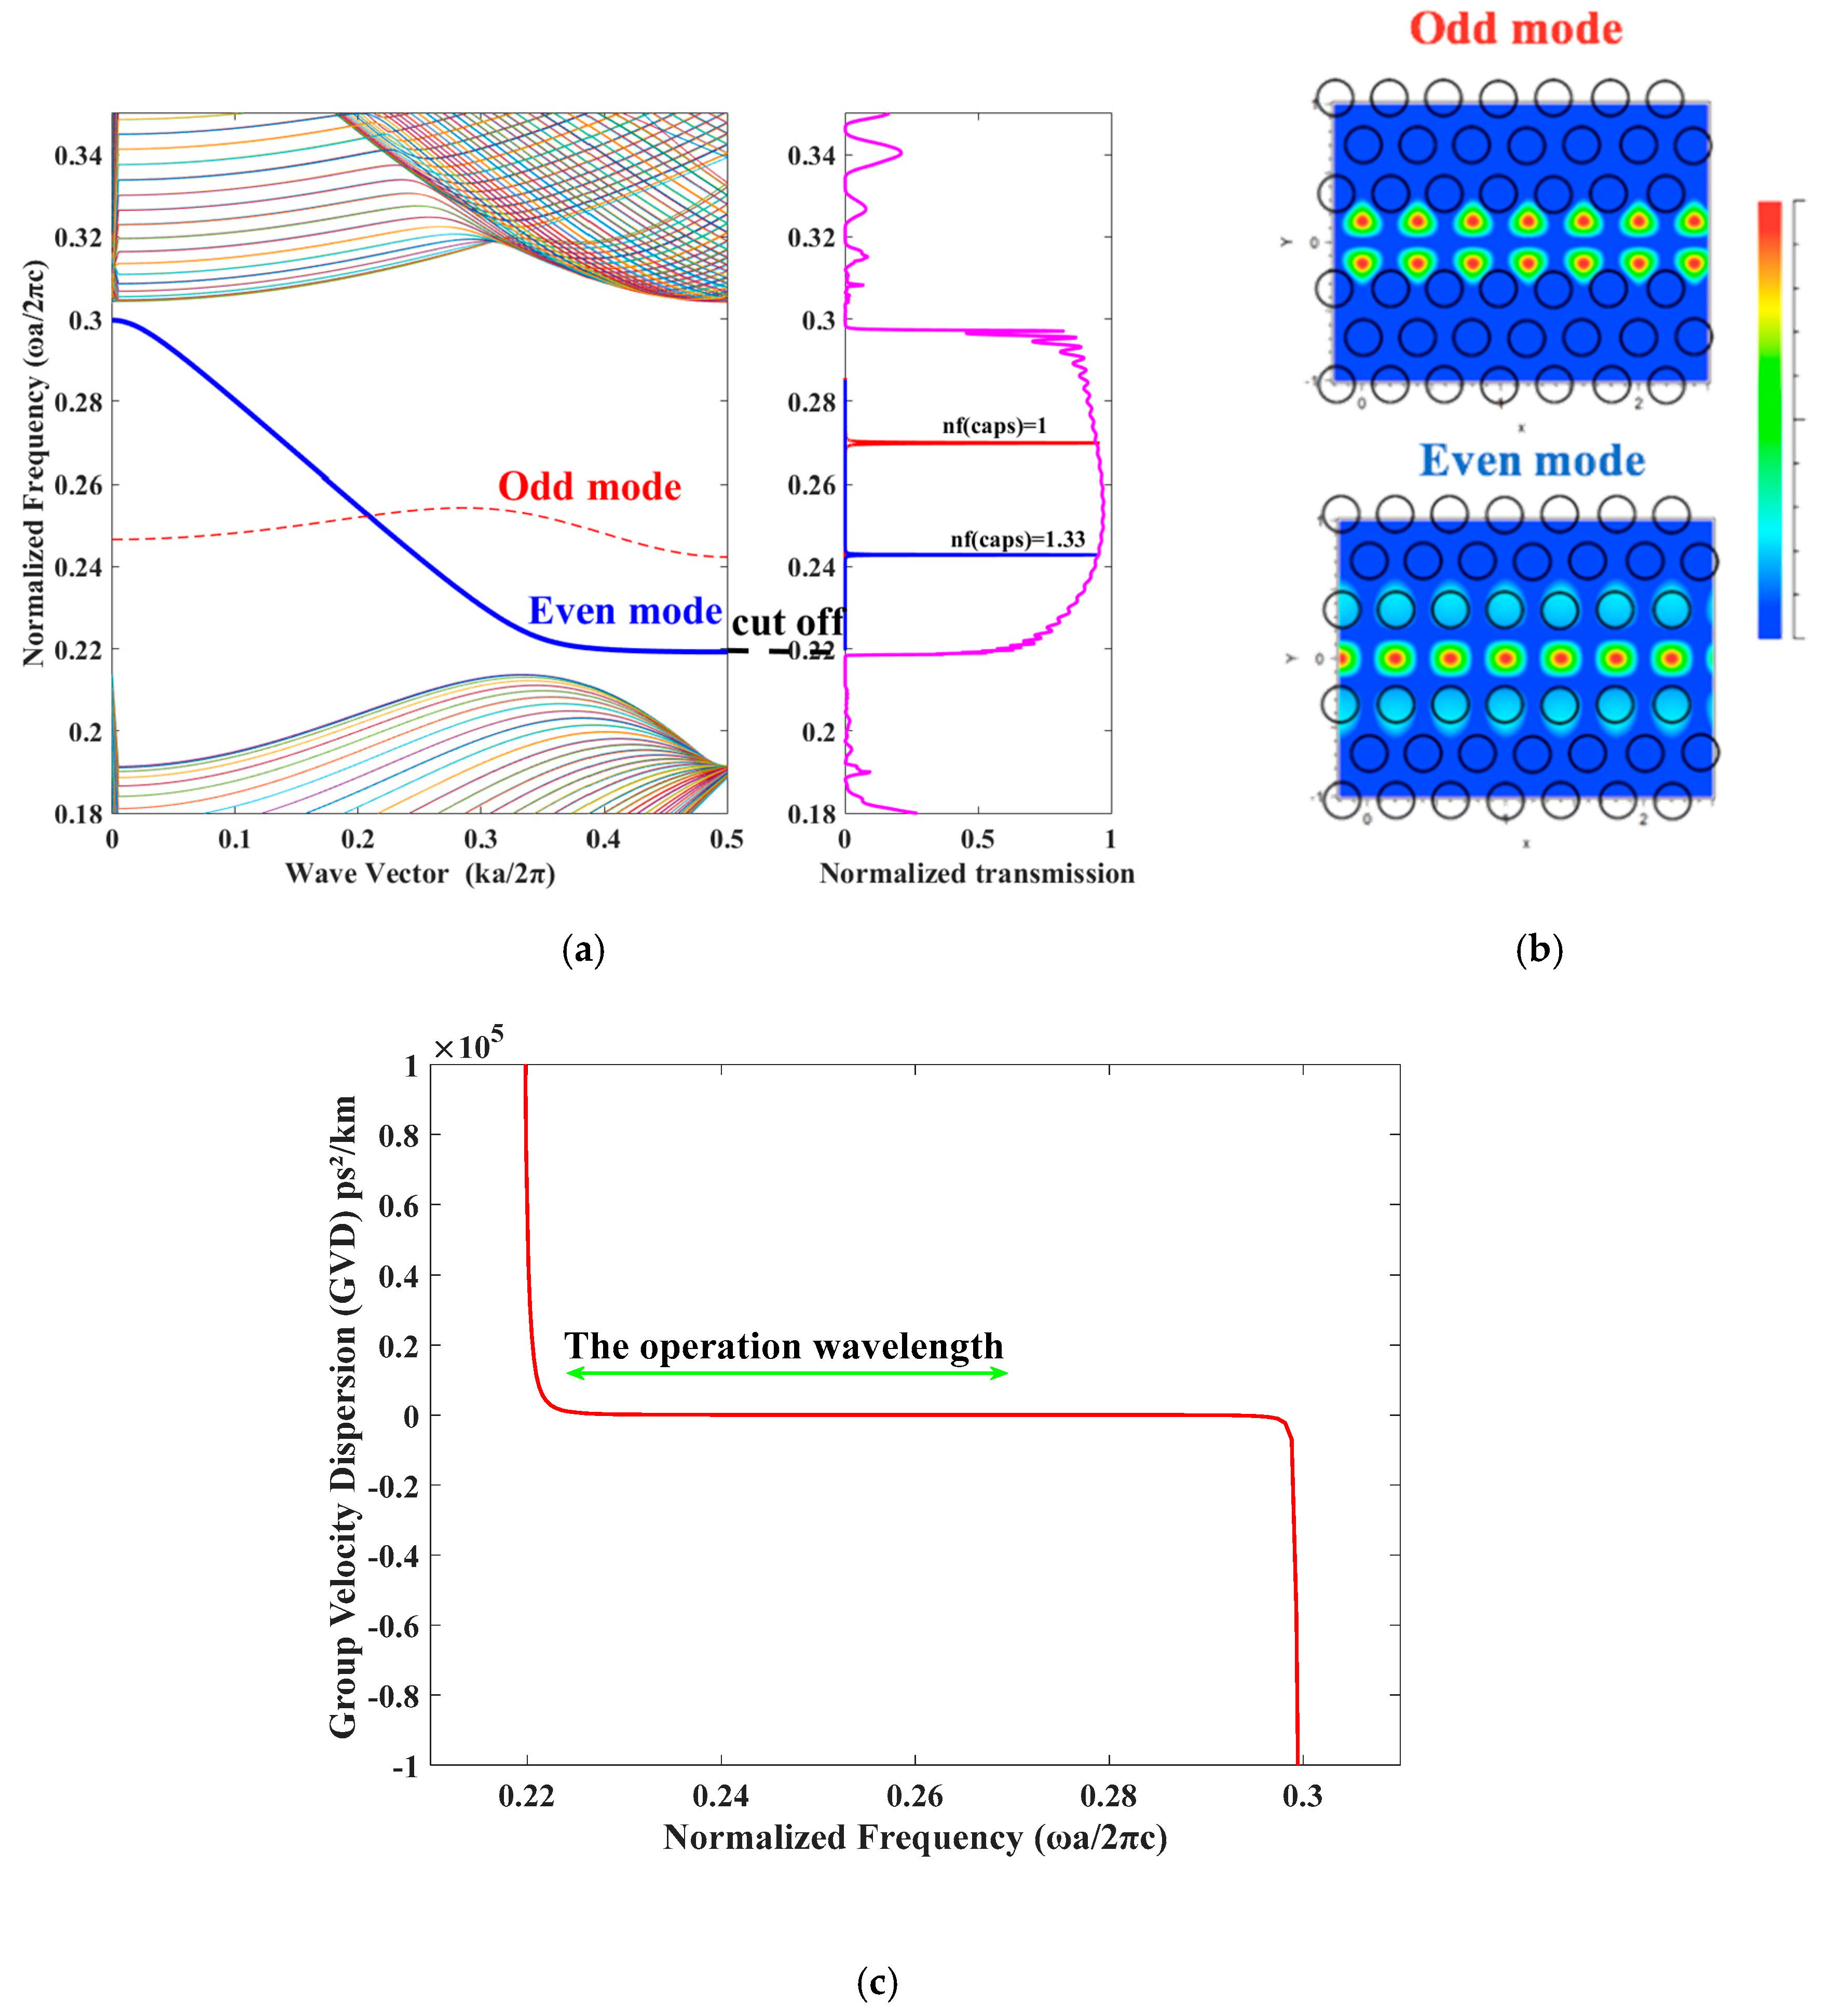
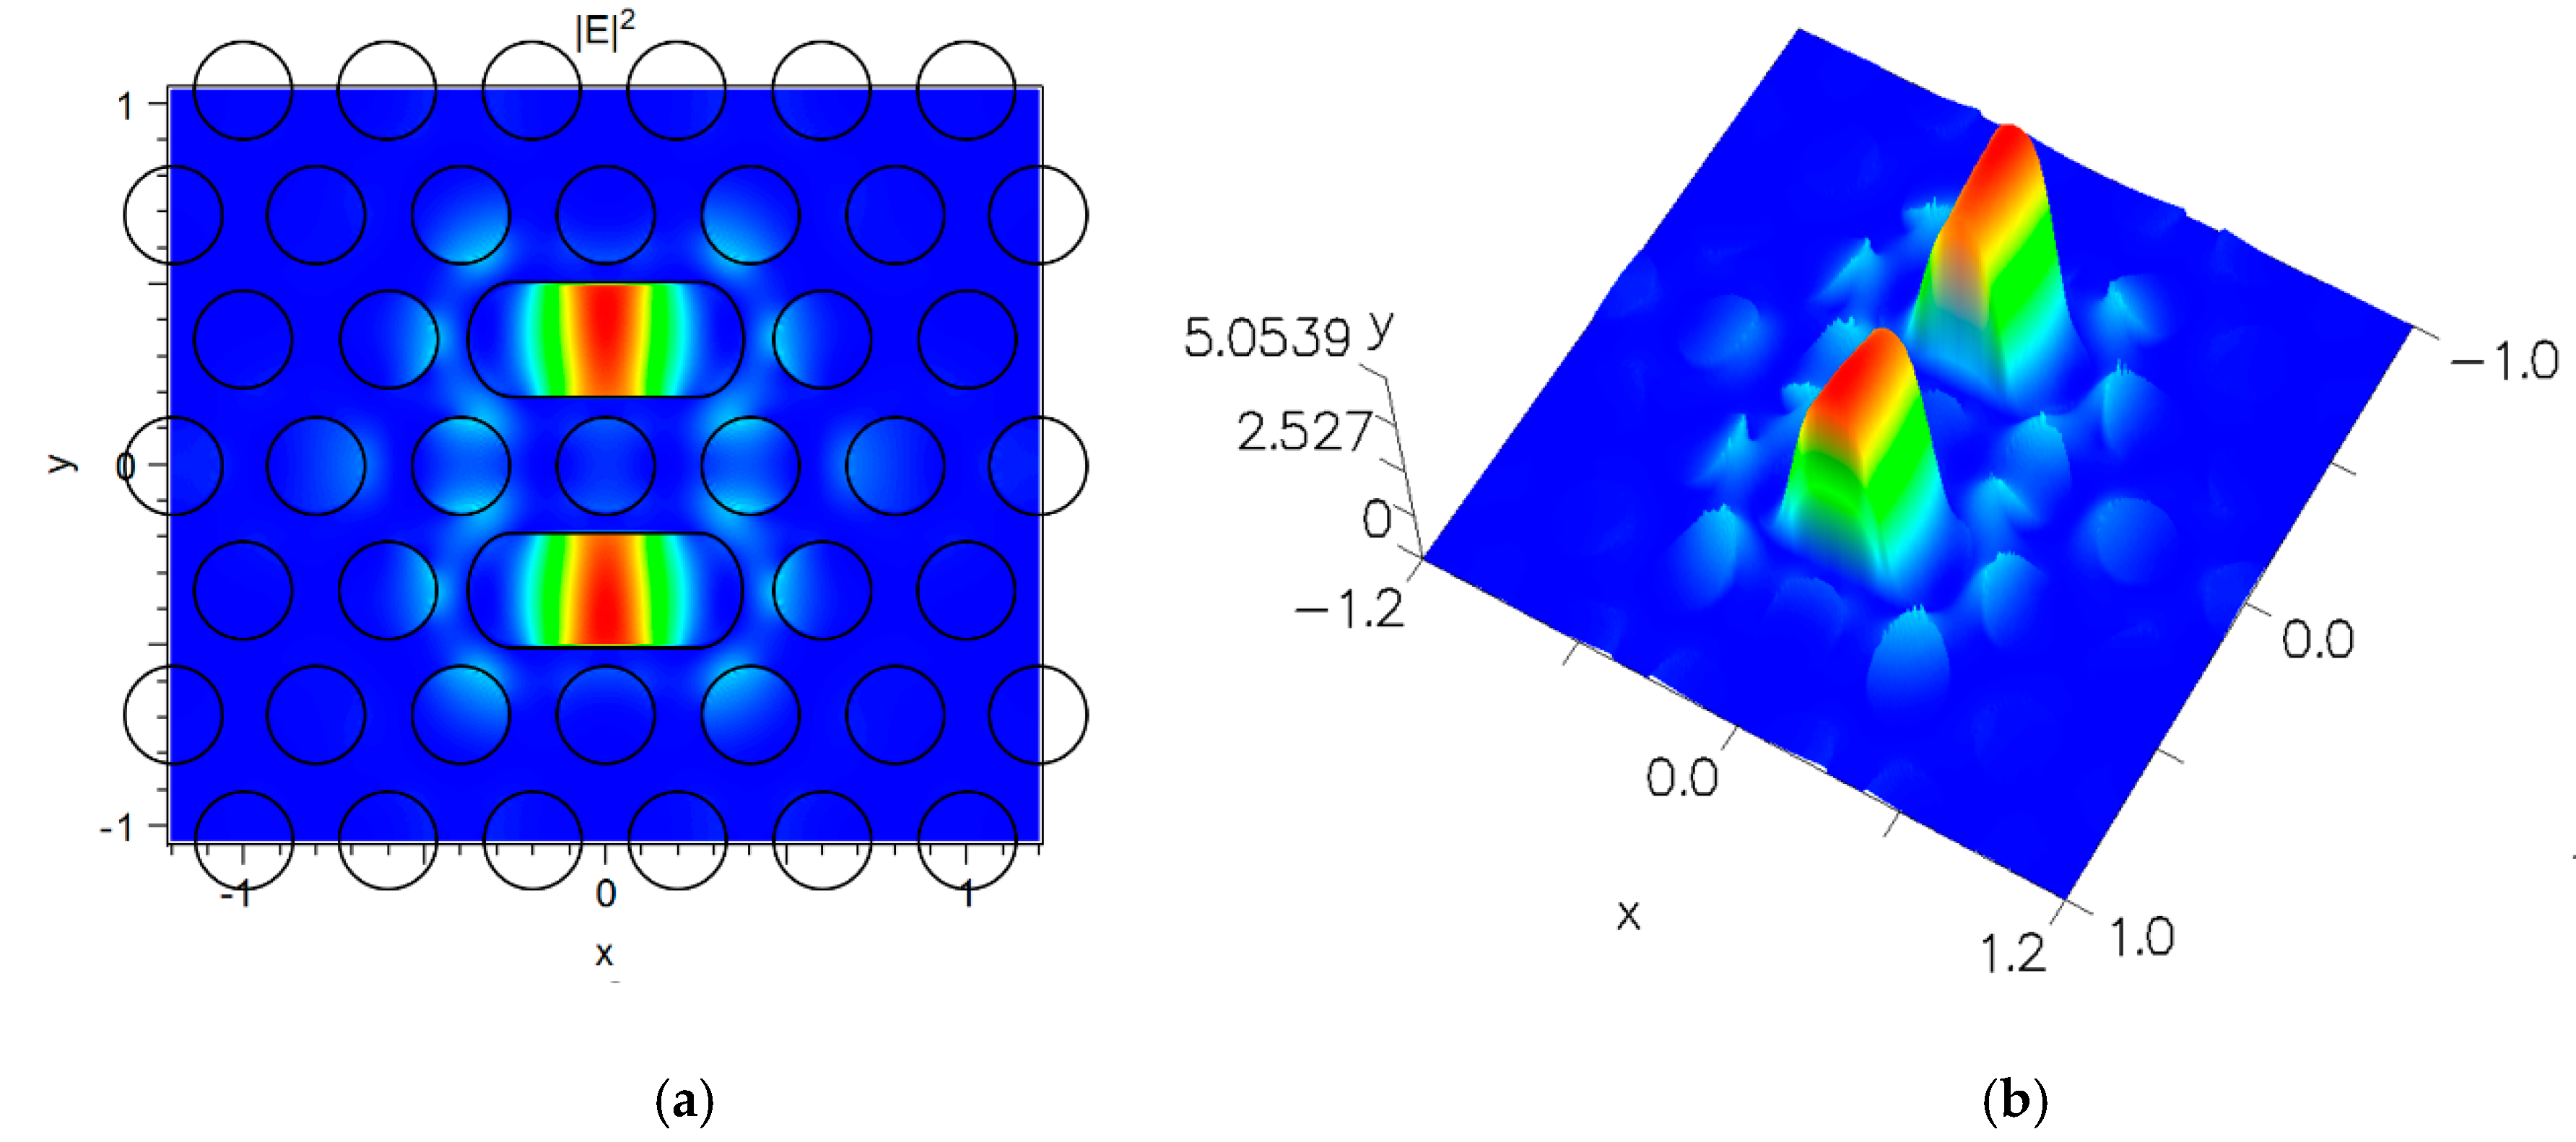
2.1. The Waveguide Characteristics

The line defect waveguide produced by confiscating the main row of air holes along the x-axis of the photonic crystal structure is presented in Figure 4a. This line defect in our structure creates a localized band, which lies within and is guided by the photonic bandgap (PBG). A Gaussian pulse with transverse electric field (TE) mode is driven into the input of the waveguide, and the signal obtained from the output is the transmission spectrum of the photonic crystal waveguide W1. It is clear that the light intensity narrows in the main part of the waveguide, as exhibited in Figure 4b.
The dispersion diagram for the PhC waveguide is shown in Figure 5a. The waveguide has two guided modes; we put the transmission curve beside the dispersion curve of the waveguide to show the coupling between the cavity employing the function and the waveguides that carry the optical signals from the input to the output of the device, as we see the coupling is highly efficient away from the band edge where the field becomes evanescent.
The modes inside the photonic bandgap (PBG) are separated by the lateral symmetry of the magnetic field to even and odd modes, as shown in Figure 5b, where the even and odd forms are represented by red and blue solid curves, respectively.
Group velocity dispersion (GVD) is an important issue for such devices; a high GVD will be accompanied by severe loss or pulse expansion, for which we should have a low GVD to keep the transmission signal stable and undistorted. The GVD is quantified by parameter β [18]:
β = d 2 k d w 2 = 1 c d n g d w
where k is the wave vector, w represents the frequency, c is the light velocity in a vacuum, and n g is the group index.
As shown in Figure 5c, the GVD in the order of 105 ps2/km and along the operation wavelength (from the first peak when nf(caps) = 1 λ1 = 1482.22 nm and λ2 = 1780 nm near the band edge) has a very low value, around 103 ps2/km.

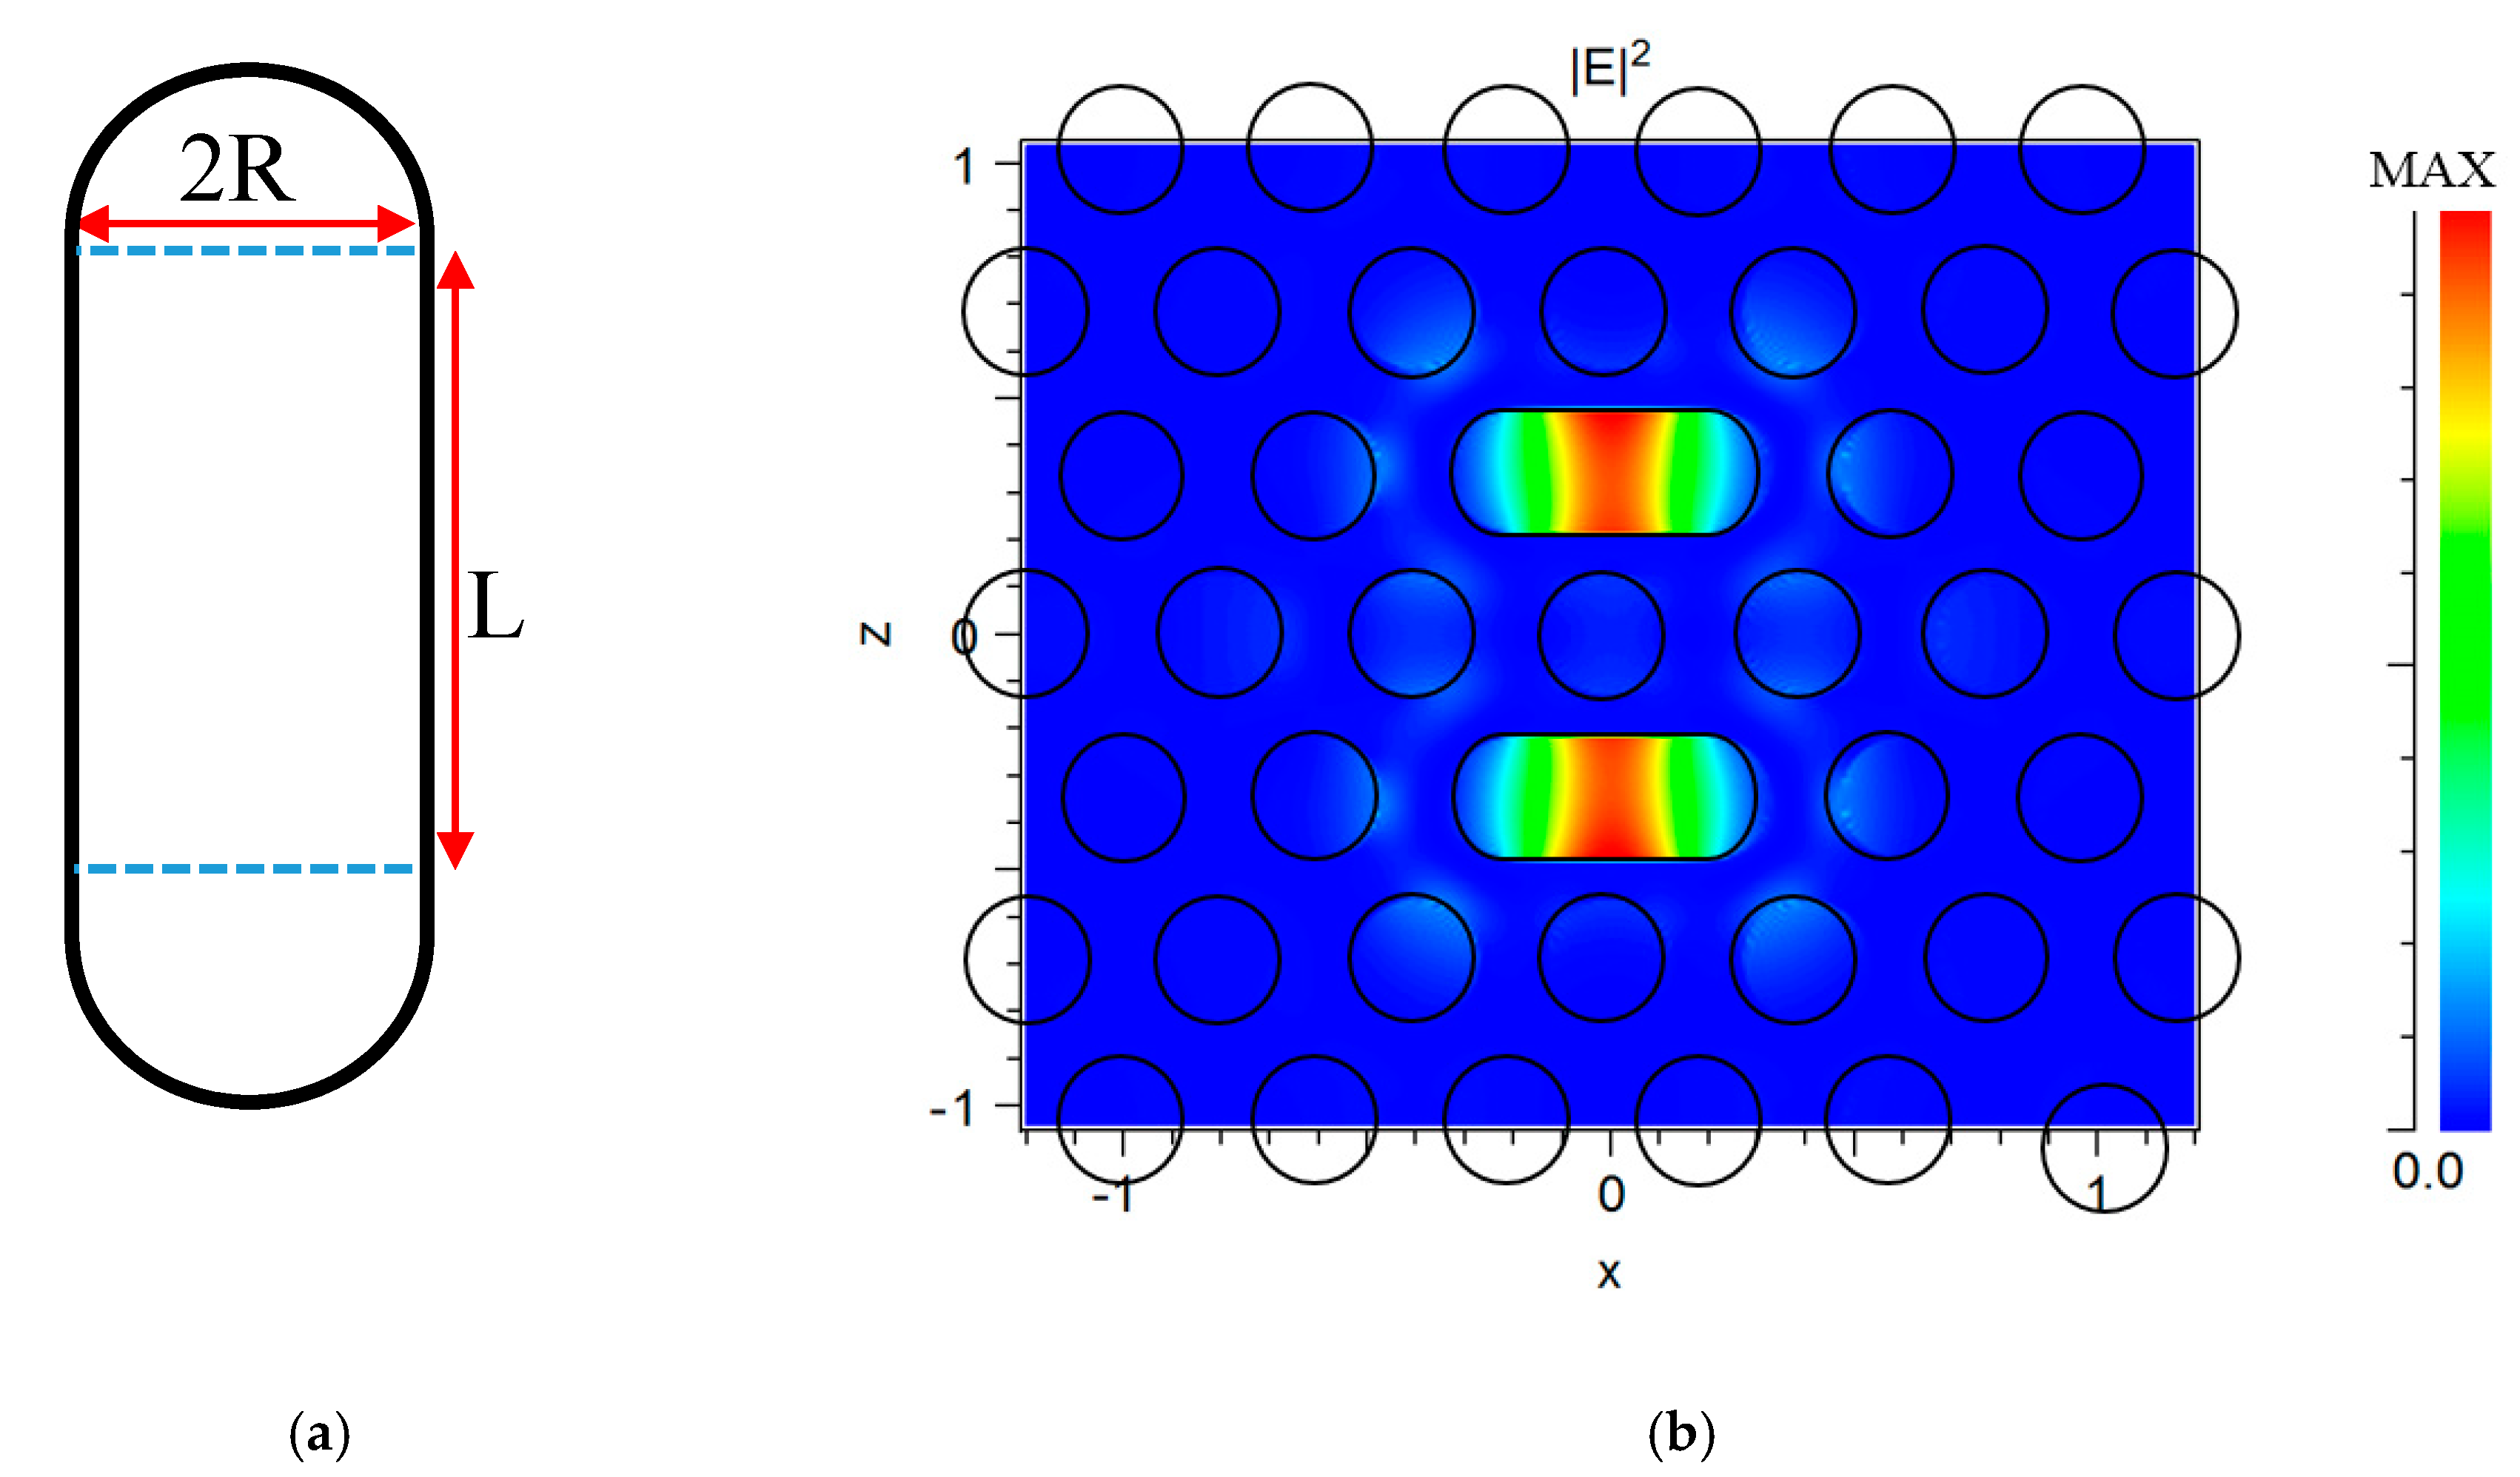
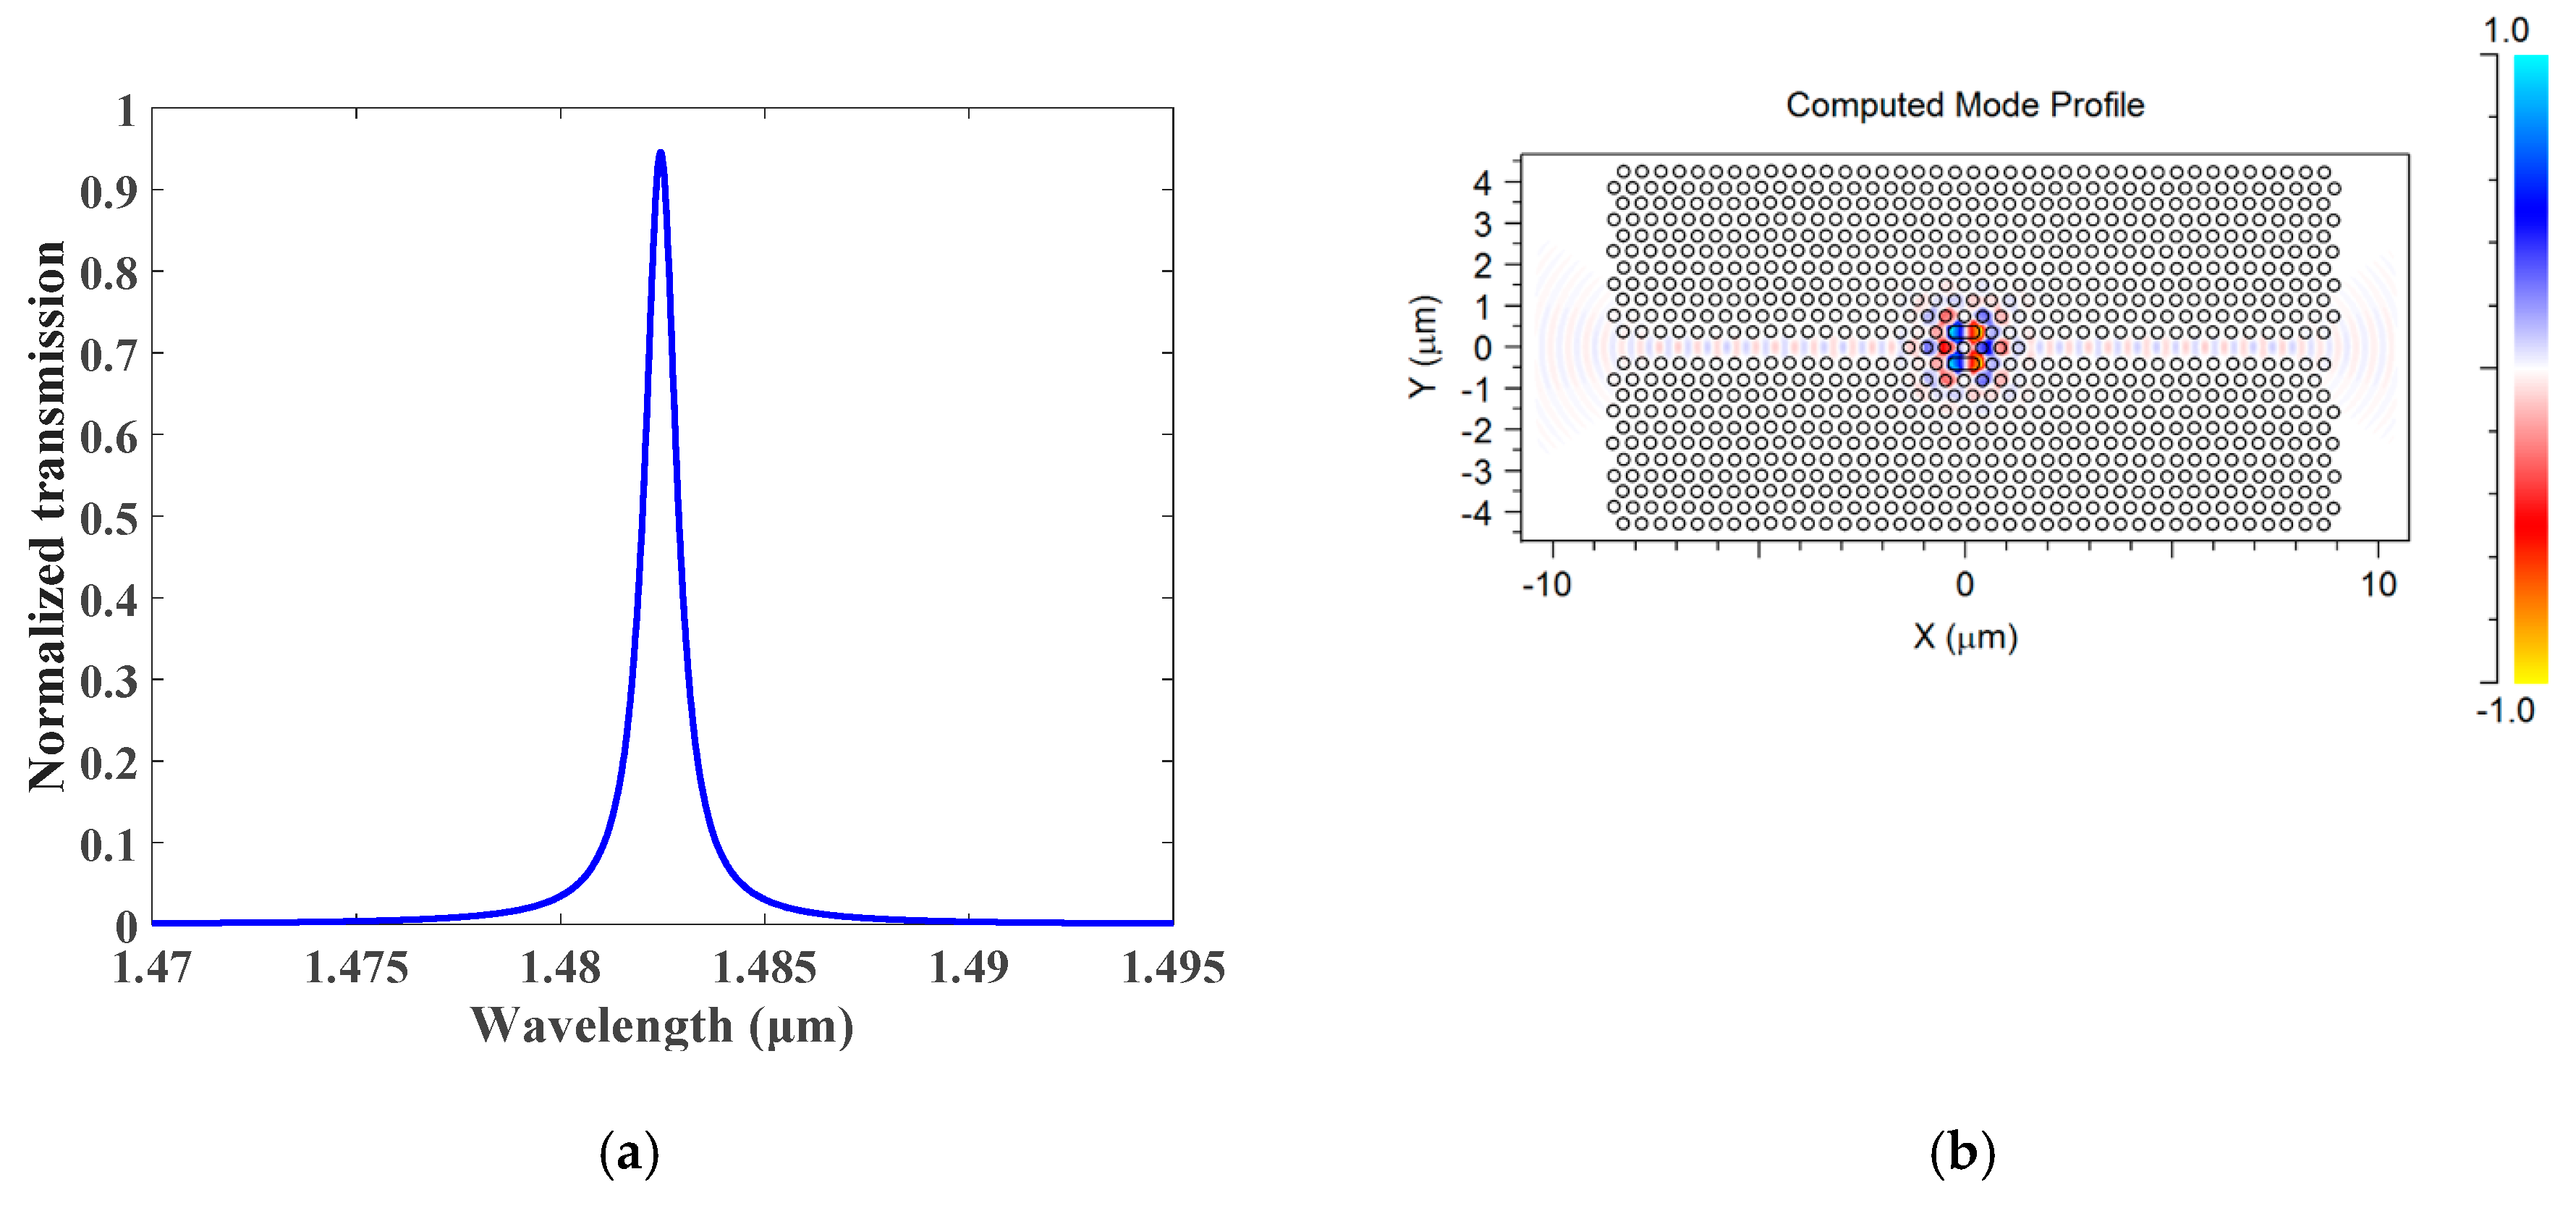
2.2. The Sensor Characteristics

The cavity is created to take a capsule shape in the middle of both sides of the device. This coupled with two waveguides formed by presenting line defects with a capsule length L = a and a radius R = r as the initial sizes of the cavity shown in Figure 6a. The confinement in the horizontal plane of the PBG is obtained, as illustrated in Figure 6b. At the resonance, wavelength light cannot penetrate the periodic structure and the energy of the electric field intensity distribution is concentrated in the center of the cavity. This reduces the loss in the structure and enhances the light–matter interaction.
The resonant channel impulse cavity’s response without liquid analyte infiltrated is shown in Figure 7a. When the photonic crystal cavity is in the resonance state, a piercing peak with a Lorentzian line structure arises in the photonic crystal bandgap in the TE polarization. The capsule-shaped cavity exhibits a resonant mode at a wavelength of 1482.22 nm. Figure 7b shows the Gaussian wave through the cavity in the horizontal plane. It is obvious that the field intensity is intensely restricted in the sensing region of the cavity. The Q factor of the resonance frequency is expressed as the center wavelength λc divided by the Full Width at Half Maximum (FWHM) Q = λc/Δλ of the peak. The component of quality obtained from the resonance wavelength is 1482 = 1568.73.

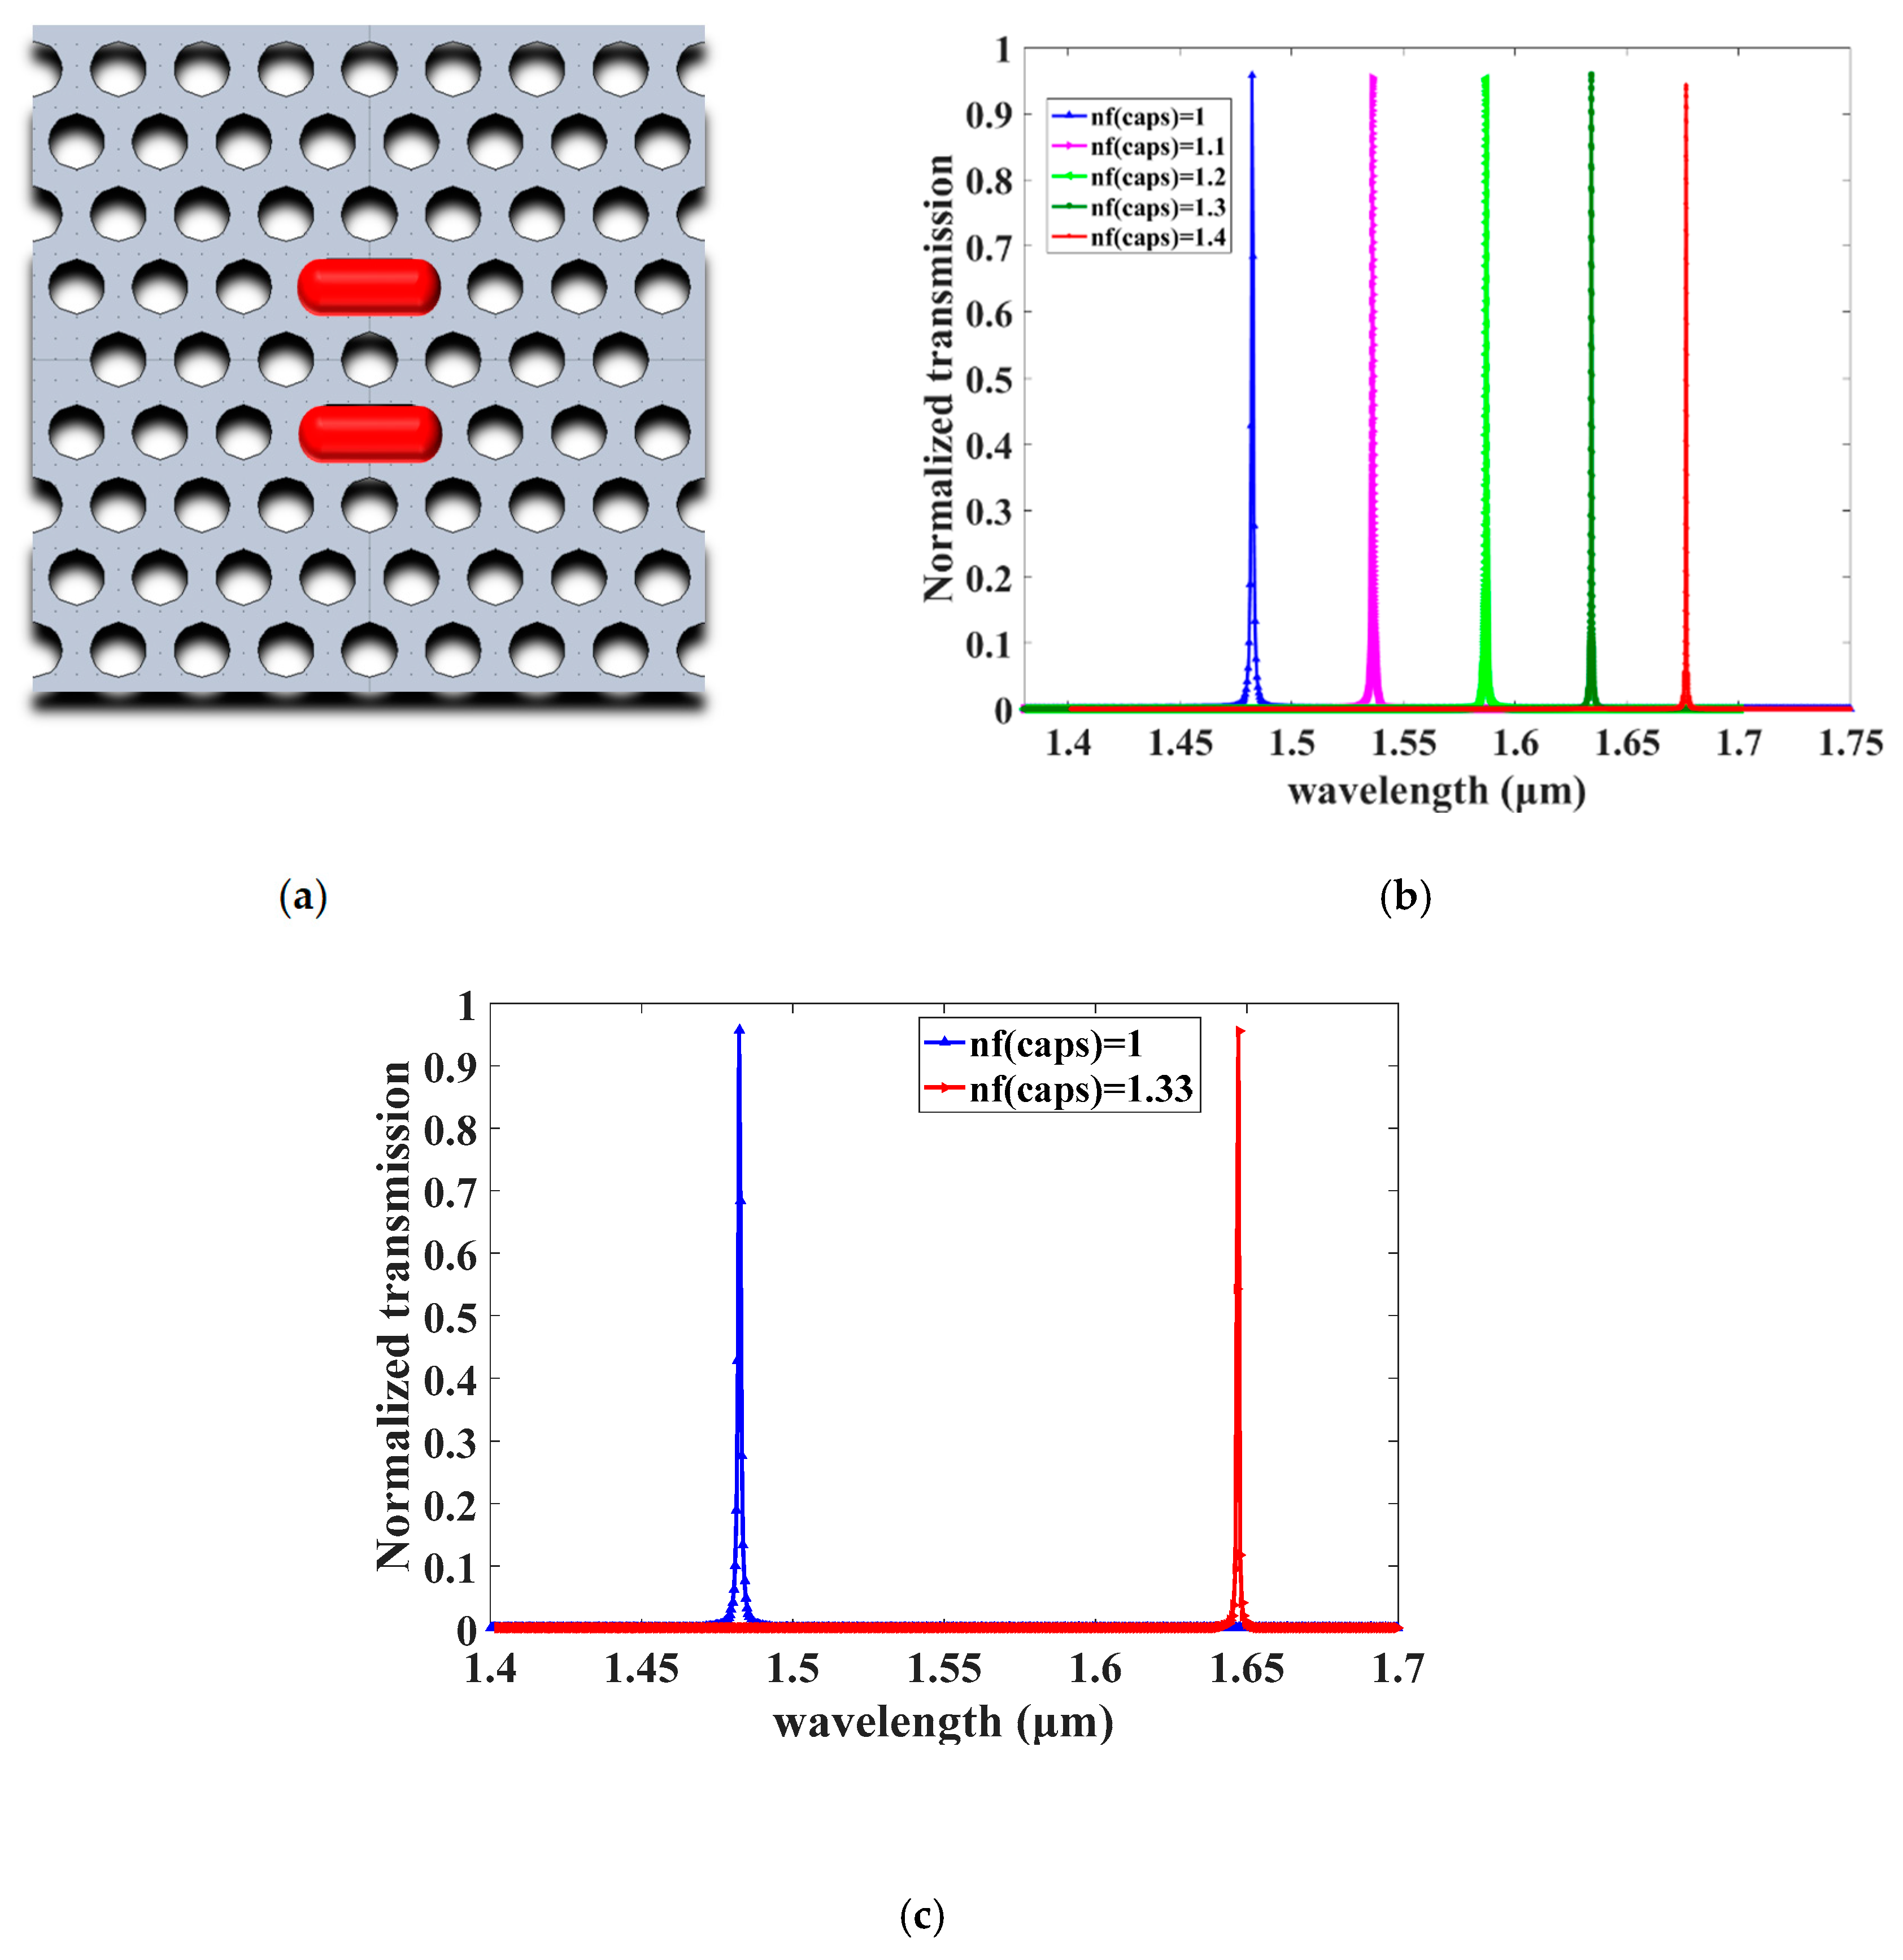
2.3. The Refractive Index Sensitivity

The refractive index (RI) of the sensors’ sensitivity is a significant metric and, as a quantitative evaluation metric, it can be expressed as S = Δλ/Δn, where Δλ is the resonant wavelength shifting by considering the cavity without the liquid infiltrated nf(caps) = 1 as a reference and Δn is the alteration in the RI due to the liquid analyte that infiltrated the cavity.
We have selected five refractive index (RI) values, n = 1 to n = 1.4, by step = 0.1, to determine the sensitivity along the operation wavelength, as shown in Figure 8b. It is worth noting that nf(caps) means that the solution only infiltrated the capsules (see Figure 8a). By considering the first peak, with n = 1 as a reference, we obtained the corresponding sensitivity for the five RI, i.e., n = 1.1, n = 1.2, n = 1.3 and n = 1.4 as follows: 538.2, 524, 505.87, and 485.35, respectively. We noticed that when the RI increases, the sensitivity decreases slightly.
Distilled and deionized water (DI) was used as a liquid analyte that infiltrated the cavity (sensing region), which changes the RI of the cavity from n = 1 to nf(caps) = 1.33 (Δn = 0.33). The change in the RI of the capsules from 1 to 1.33 led to a shift in the resonant wavelength from 1482.22 nm to 1647.27 nm Δλ = 165.05, which provides a high sensitivity S = 500.16 nm/RIU. The calculated quality factor of the second resonance wavelength is Q1647 = 2250.20, as demonstrated in Figure 8c.

3. Sensor Optimization Results and Discussion

To describe the sensor’s efficiency, the detection limit (DL) that specifies the smallest value of the change in the RI unit (RIU) that the sensor can detect must be introduced. The DL can be expressed as [19,20]:
D L = λ 0 10 Q S
where λ 0   shows the resonant wavelength (the true center of the resonant mode), and Q and S are the quality and sensitivity factors, respectively. In Equation (3), it can be deduced that the DL could be enhanced more by augmenting the RI sensitivity along with the cavity’s factor quality.

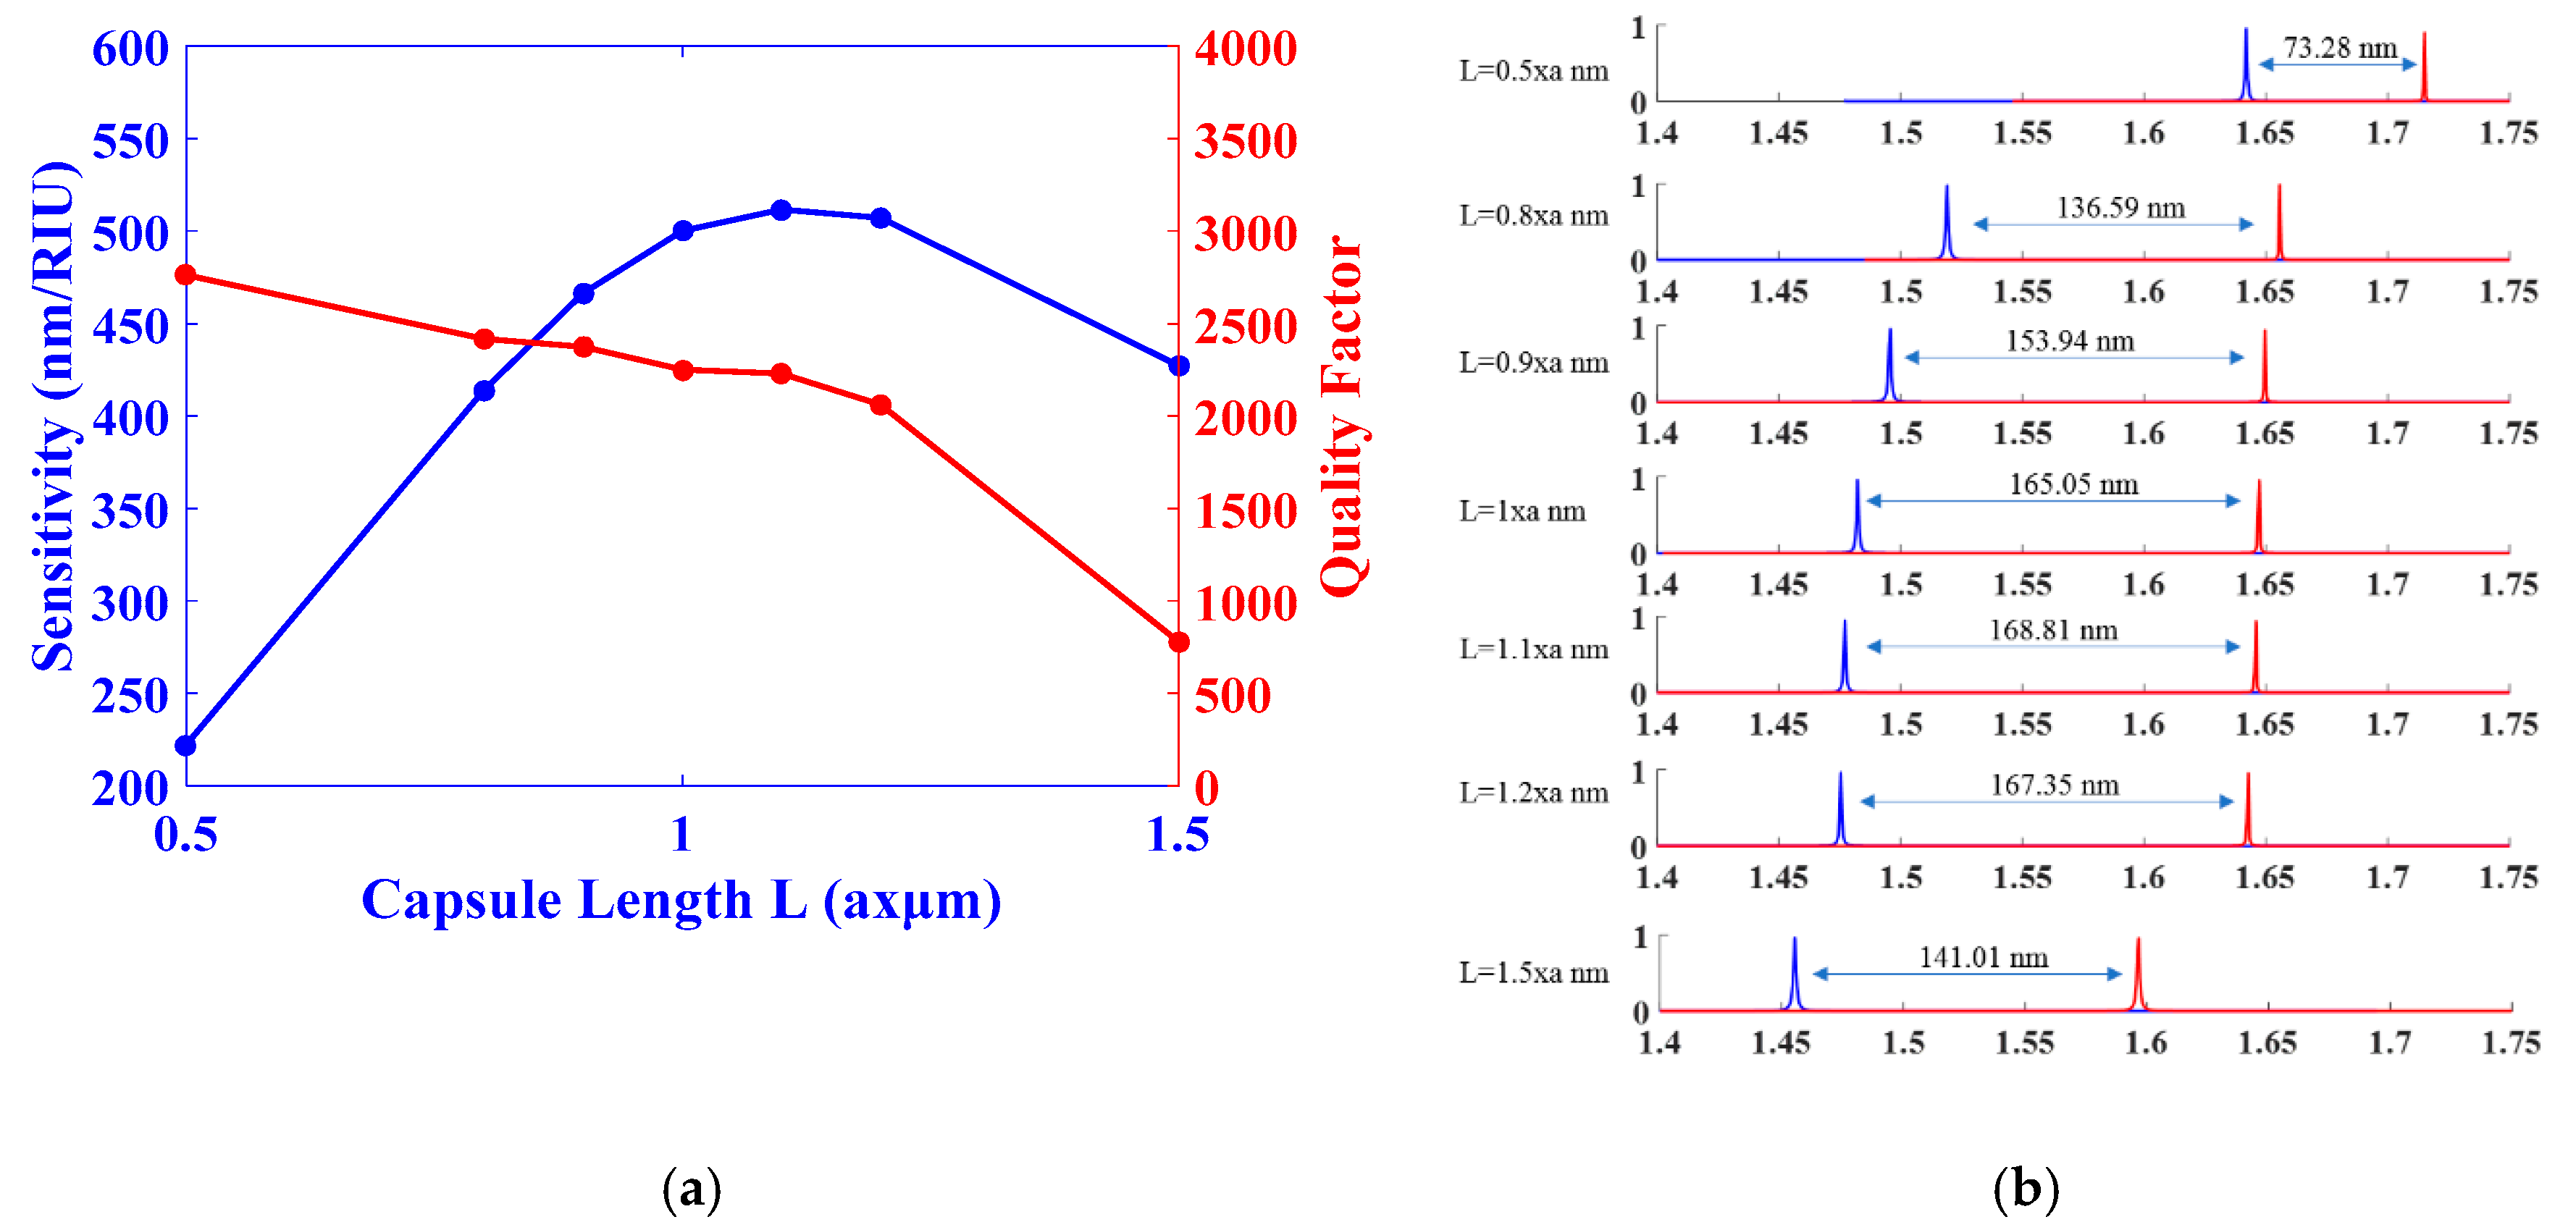
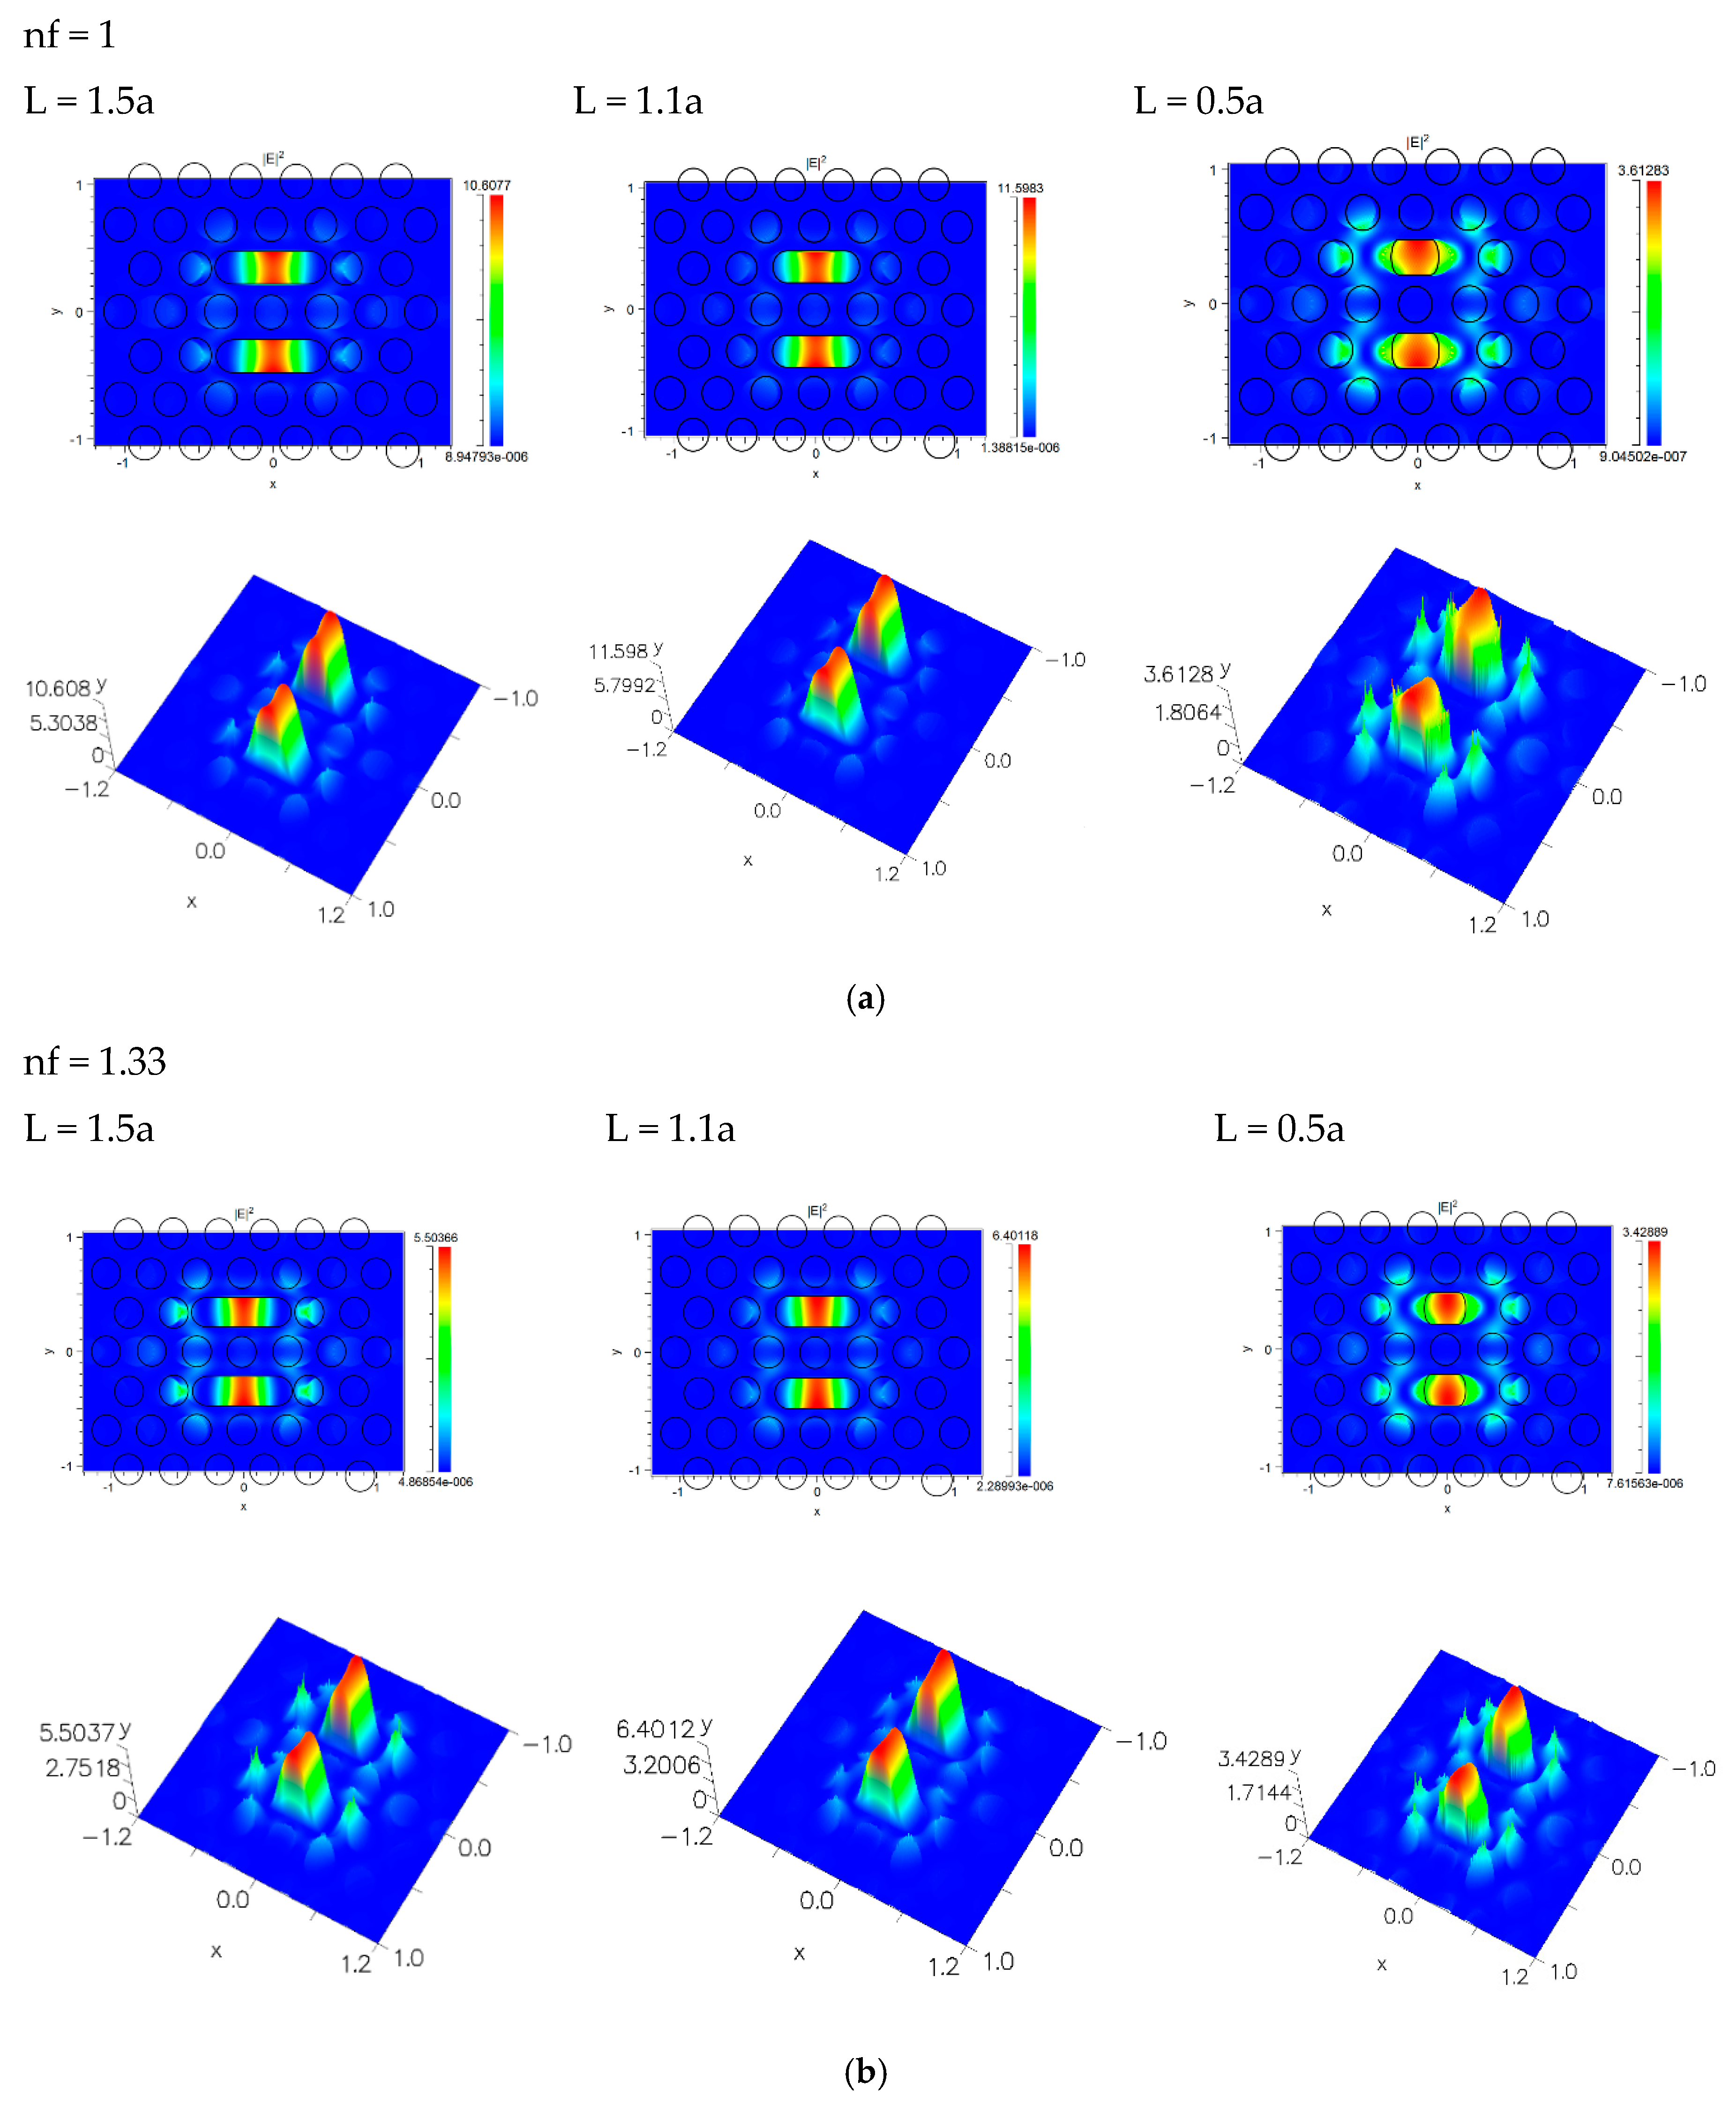
3.1. The Effects of the Capsule Length Sensitivity

The resonance mode depends upon the microcavity defect size [21]. Therefore, we studied the cavity size for the purpose of obtaining a higher sensitivity and quality factor in addition to a lower detection limit.
We investigated the effect of the capsule length L on the sensitivity and quality factor; as shown in Figure 9a, the length L changes from L = 0.5 × a nm to L = 1.5 × a nm. As the length L increases, the sensitivity S increases, which reflects the proportional relation. In contrast, the quality factor decreases as the length increases, which indicates an inverse relation. Figure 9b illustrates the shift in the resonance wavelengths corresponding to L variable values; the largest shift, Δ λ   = 168.81 nm, corresponds to L = 1.1 × a.
To clarify the confinement within the cavity, the relations between the energy and the resonant modes have been considered, as shown in Figure 10a. It is observed that, when the capsule length increases where the sample is not present in the cavity, the electric field is redistributed due to the large cavity; also, the concentration and value of energy in the cavity increase, reaching the highest value when L = 1.2a, then decreasing. On the other hand, the resonant modes shift to higher frequencies due to the decrease in the effective index.
It is observed that the fluctuation in energy values pushes the resonant modes to higher frequencies, leading to a high sensitivity. Then, when the analyte liquid infiltrates the capsule cavity, the resonant mode is pulled to higher frequencies due to the change in the capsule, but with a smaller shift than the cavity without infiltration, as exhibited in Figure 10b. The highest value and energy concentration inside the capsule cavity reached L = 1∗a nm.
Figure 11a,b represent the energy of the electric field distribution with different capsule lengths, with and without the analyte liquid (nf = 1, nf = 1.33), as the length of the capsule L = 0.5a. A large intensity near the boundaries of the capsule cavity can be observed, which indicates low confinement and that the mode is either not localized or not concentrated on the sample. The perfect confinement, localization, and concentration come with the length L = 1.1a where the electric field’s intensity at the boundaries of the capsule cavity is very small; therefore, the light–matter interaction can be improved. As the length increased to L = 1.5a, the confinement became weak and the interaction with the adjacent holes became larger.
The simulation results are summarized in Table 1. As the length is L = 1.1 × a nm, it provides the highest sensitivity of S = 511.56 nm/RIU, a high quality factor of Q = 2230.22 and the lowest DL = 1.44 × 10⁻⁴ RIU.

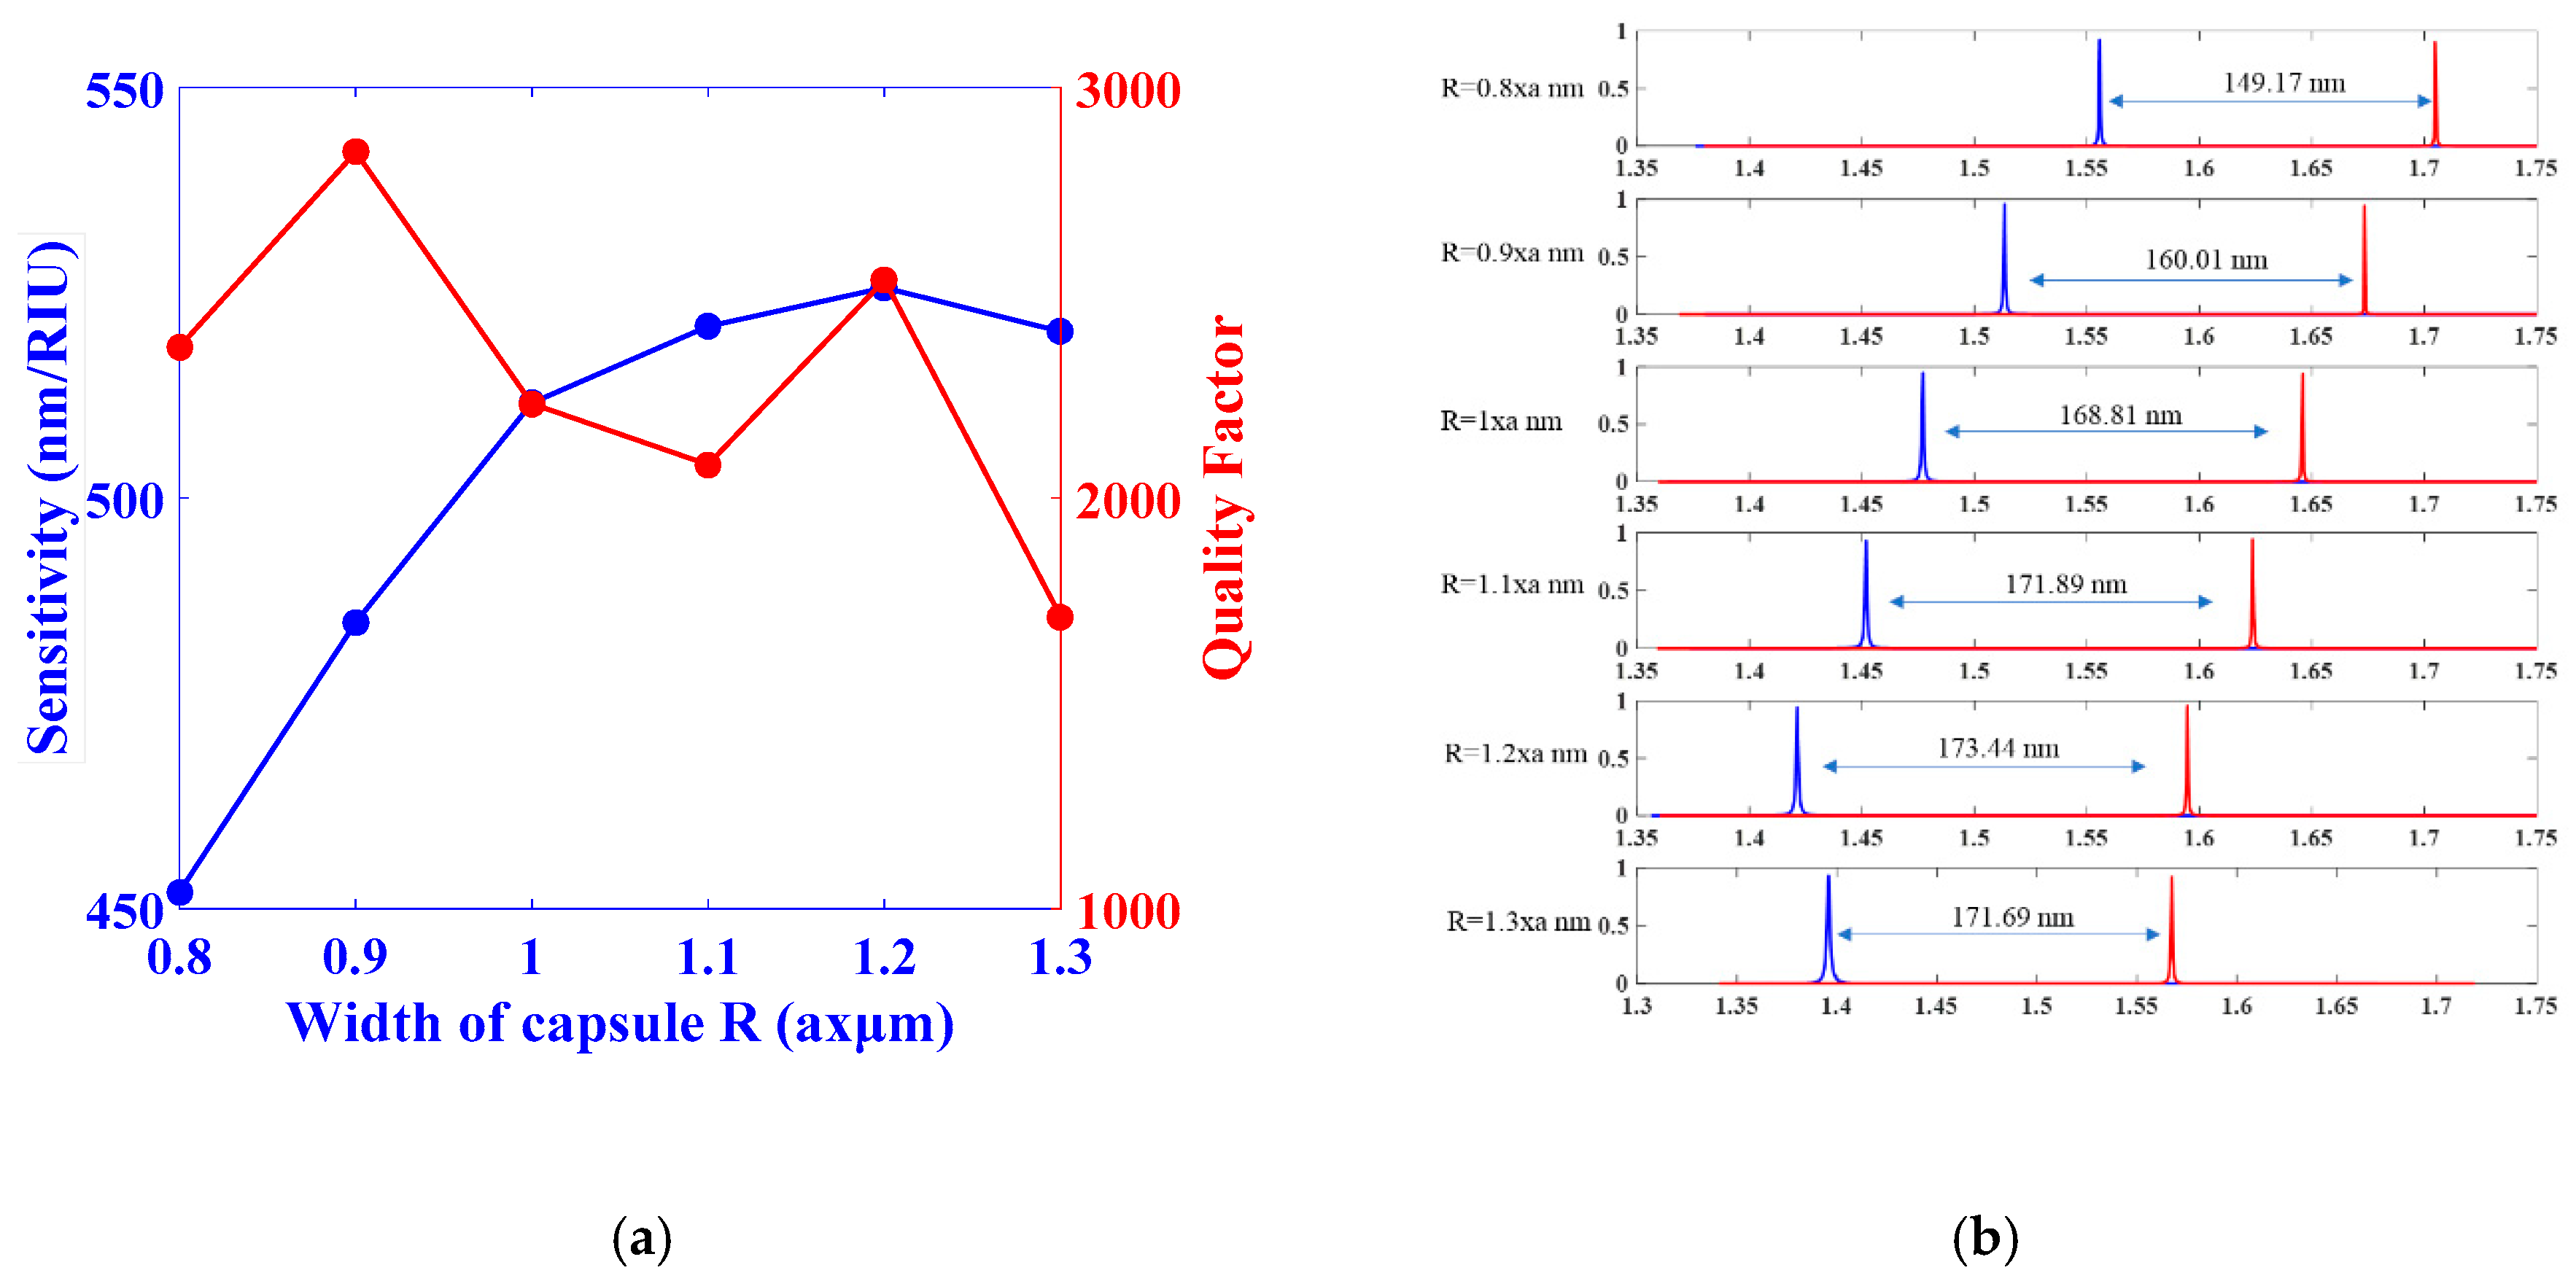
3.2. The Effect of the Capsule Width

As the length is chosen to be L = 1.1 × a nm, the effect of capsule radius R is studied from R = 0.8 × r nm to R = 1.3 × r nm. As shown in Figure 12a, R = 1.2 × a nm led to a high sensitivity S = 525.59 nm/RIU, a high quality factor Q = 2531.18, and a low detection limit DL = 1.21 × 10⁻⁴ RIU. The highest sensitivity corresponds to a high shift of 173.44 nm, as shown in Figure 12b.
Figure 13a,b illustrate that the change in the capsule width affects the energy and the resonant modes inside the cavity. It is noticed that the capsule width R increases when the cavity refractive index is nf = 1. Hence, the resonant mode strides to higher frequencies and the energy thereby decreases. Once the cavity is infiltrated with analyte liquid nf = 1.33 and the capsule width R increases from R = 0.8r to R = 1.3r, the resonant mode shifts to higher frequencies, but with smaller values than the resonant modes without infiltration, which provides a higher sensitivity once R = 1.2r, as shown in Table 2.

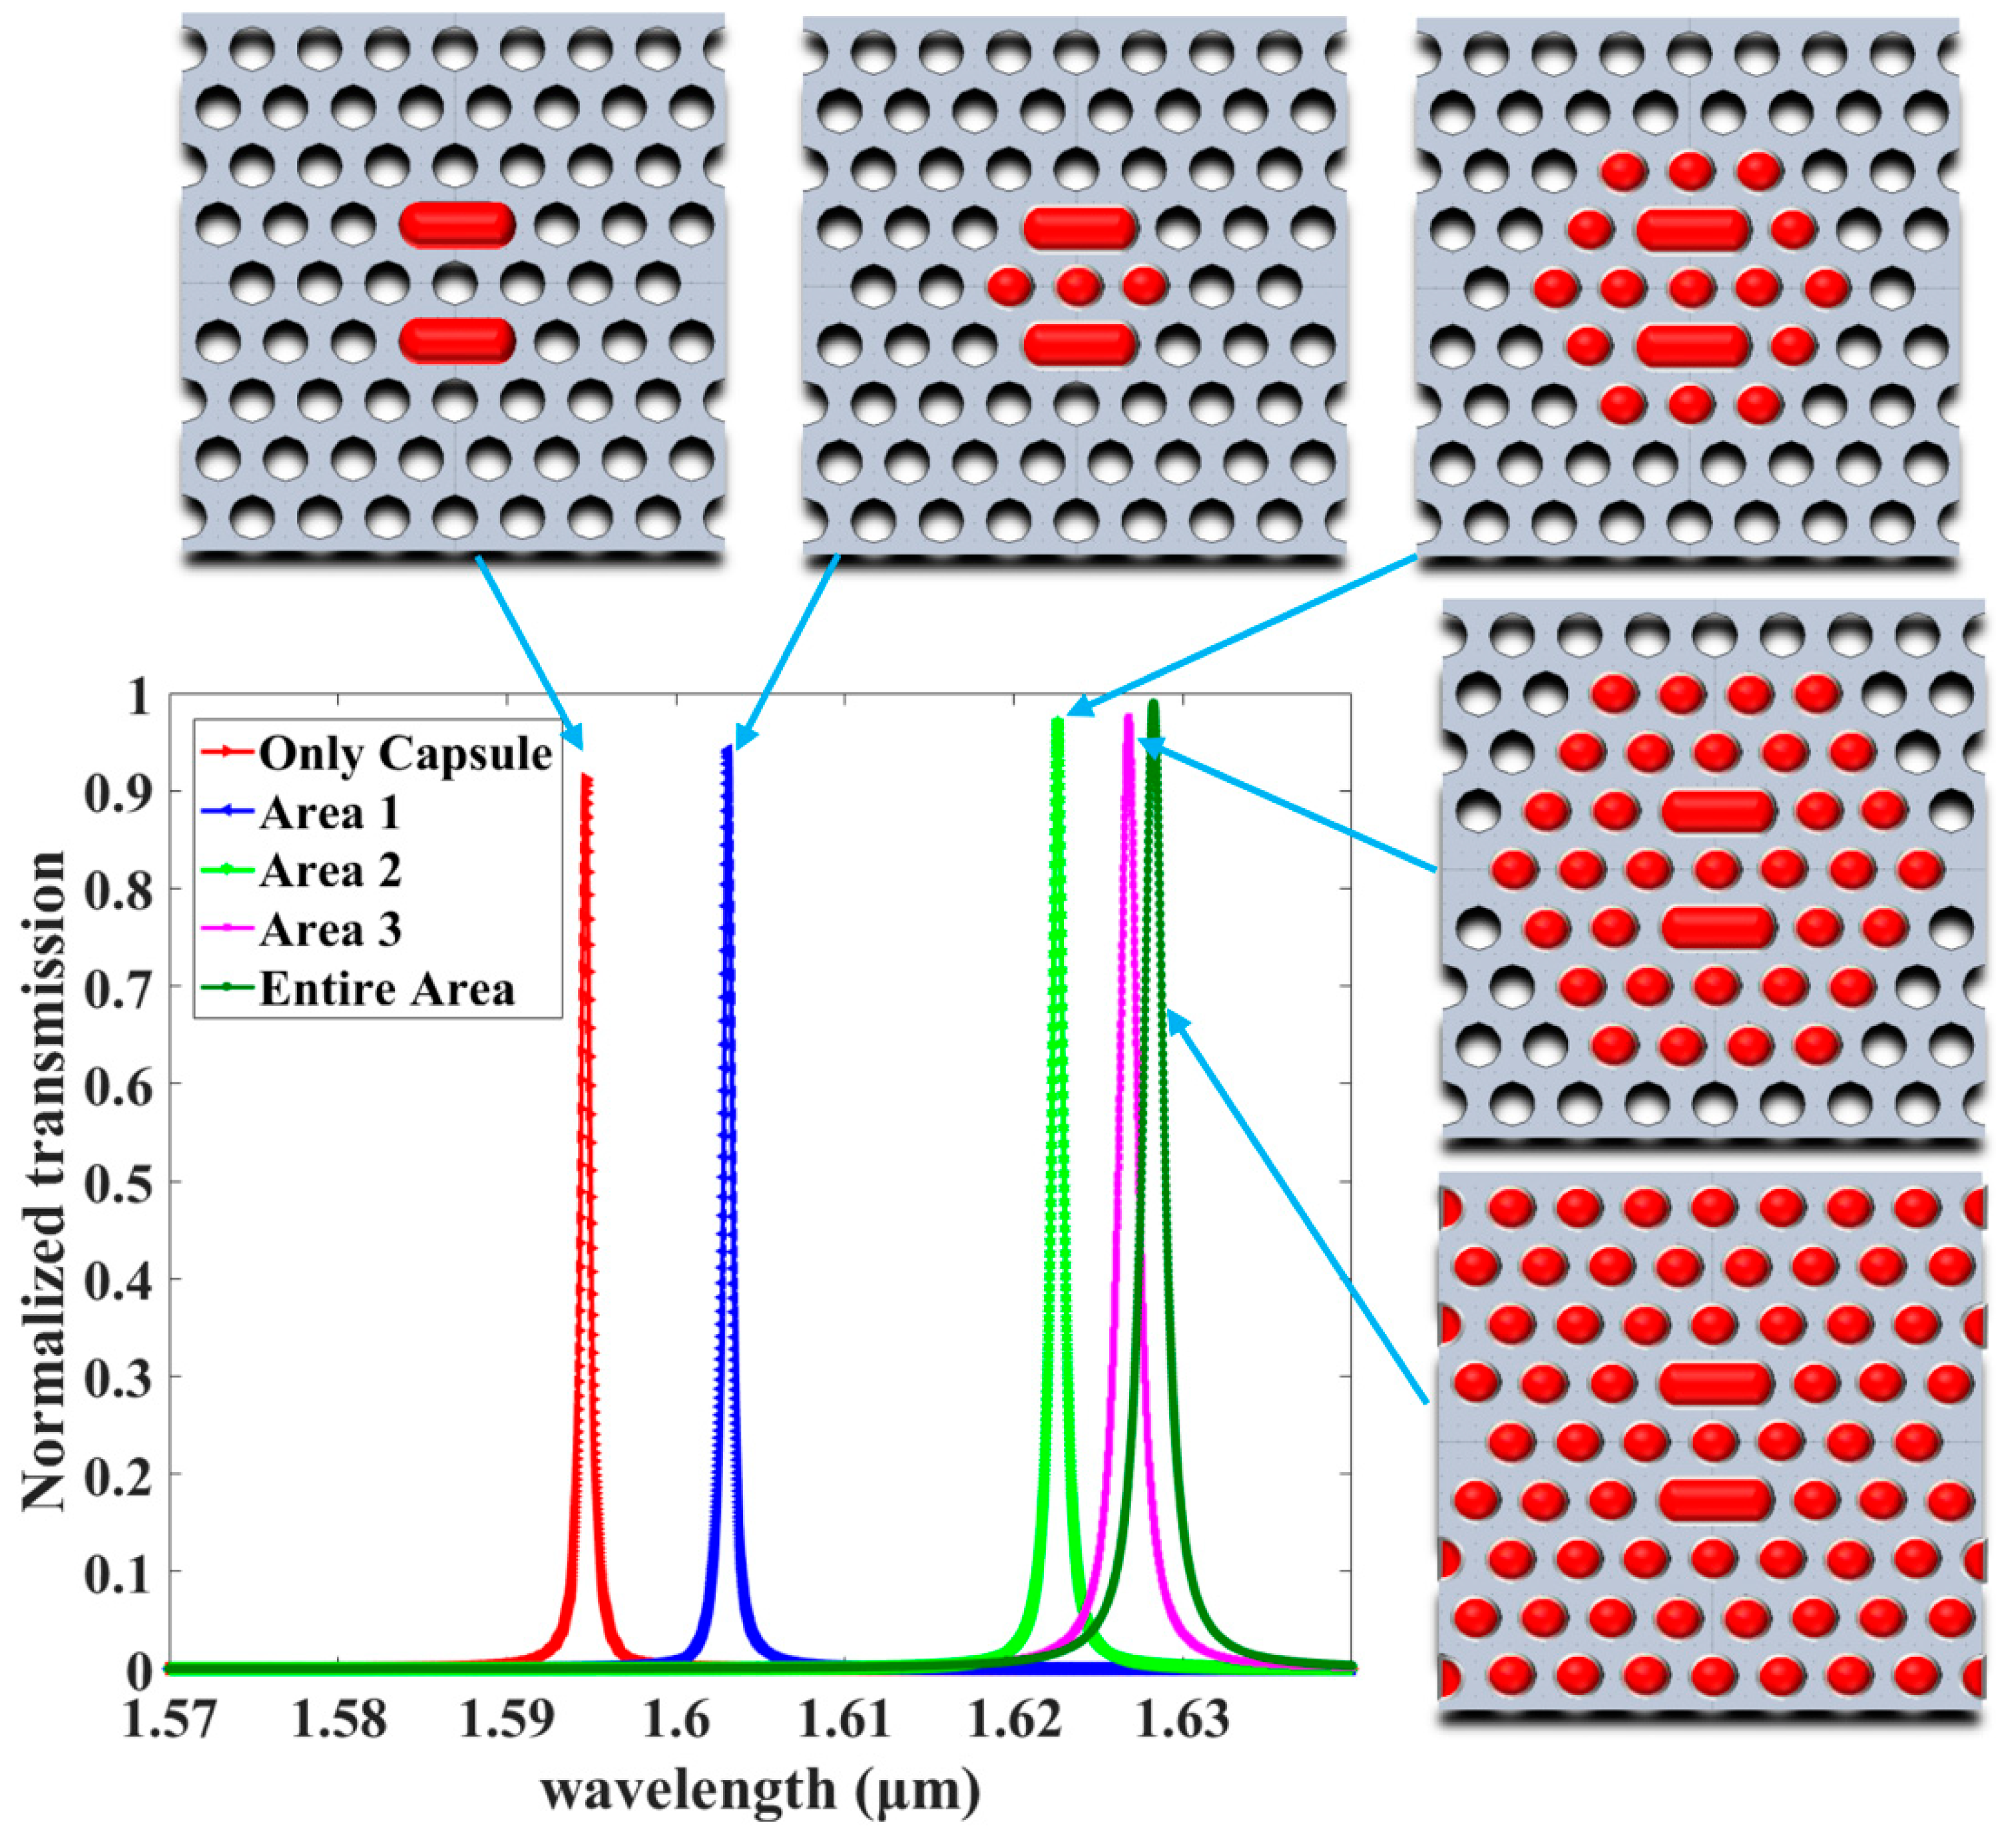
3.3. The Effect of Different Area Infiltration Sensitivity

As mentioned, the resonance modes depend on the defect size of the microcavity. Selected parameters were considered, including an optimized size with a capsule length L = 1.1 × a nm and width R = 1.2 × r nm, which provide a high sensitivity S = 525.59 nm/RIU, a high quality factor Q = 2531.18 and a low detection limit DL = 1.21 × 10⁻⁴ RIU. Moreover, due to the significant effects of the holes around the cavity on the mode in the cavity, the sensing areas were divided into five areas, as shown in Figure 14.
The simulation results are outlined in Table 3. It can be observed that, as the sensing area becomes larger, the band shifts have lower frequencies, due to the reduction in the dielectric contrast and the mode band below the propagation mode band. Thereby, the sensitivity increases to the highest value of S = 627.42 nm/RIU, and the quality factor decreases to the lowest value of Q = 1112.95. In addition, as reported in [13], the high Q will exploit more attenuation during the communications as a result of the amount of reflections within the device, along with escalations in the light path. Thus, as expected, when the sensing area increases, the normalized transmission increases from 91% to 99%. This work optimized a sensing device with the parameters L = 1.1 × a nm and R = 1.2 × r nm and a sensing area referred to as sensing area 2, where the sensitivity was S = 610.26 nm/RIU, the quality factor Q = 2192.68, the detection limit DL = 1.21 × 10⁻⁴ RIU and the transmission 97%. The strong concentration of electric field energy in the capsule cavity is illustrated in Figure 15a,b; thus, the loss is reduced and the light–matter interaction is enhanced.

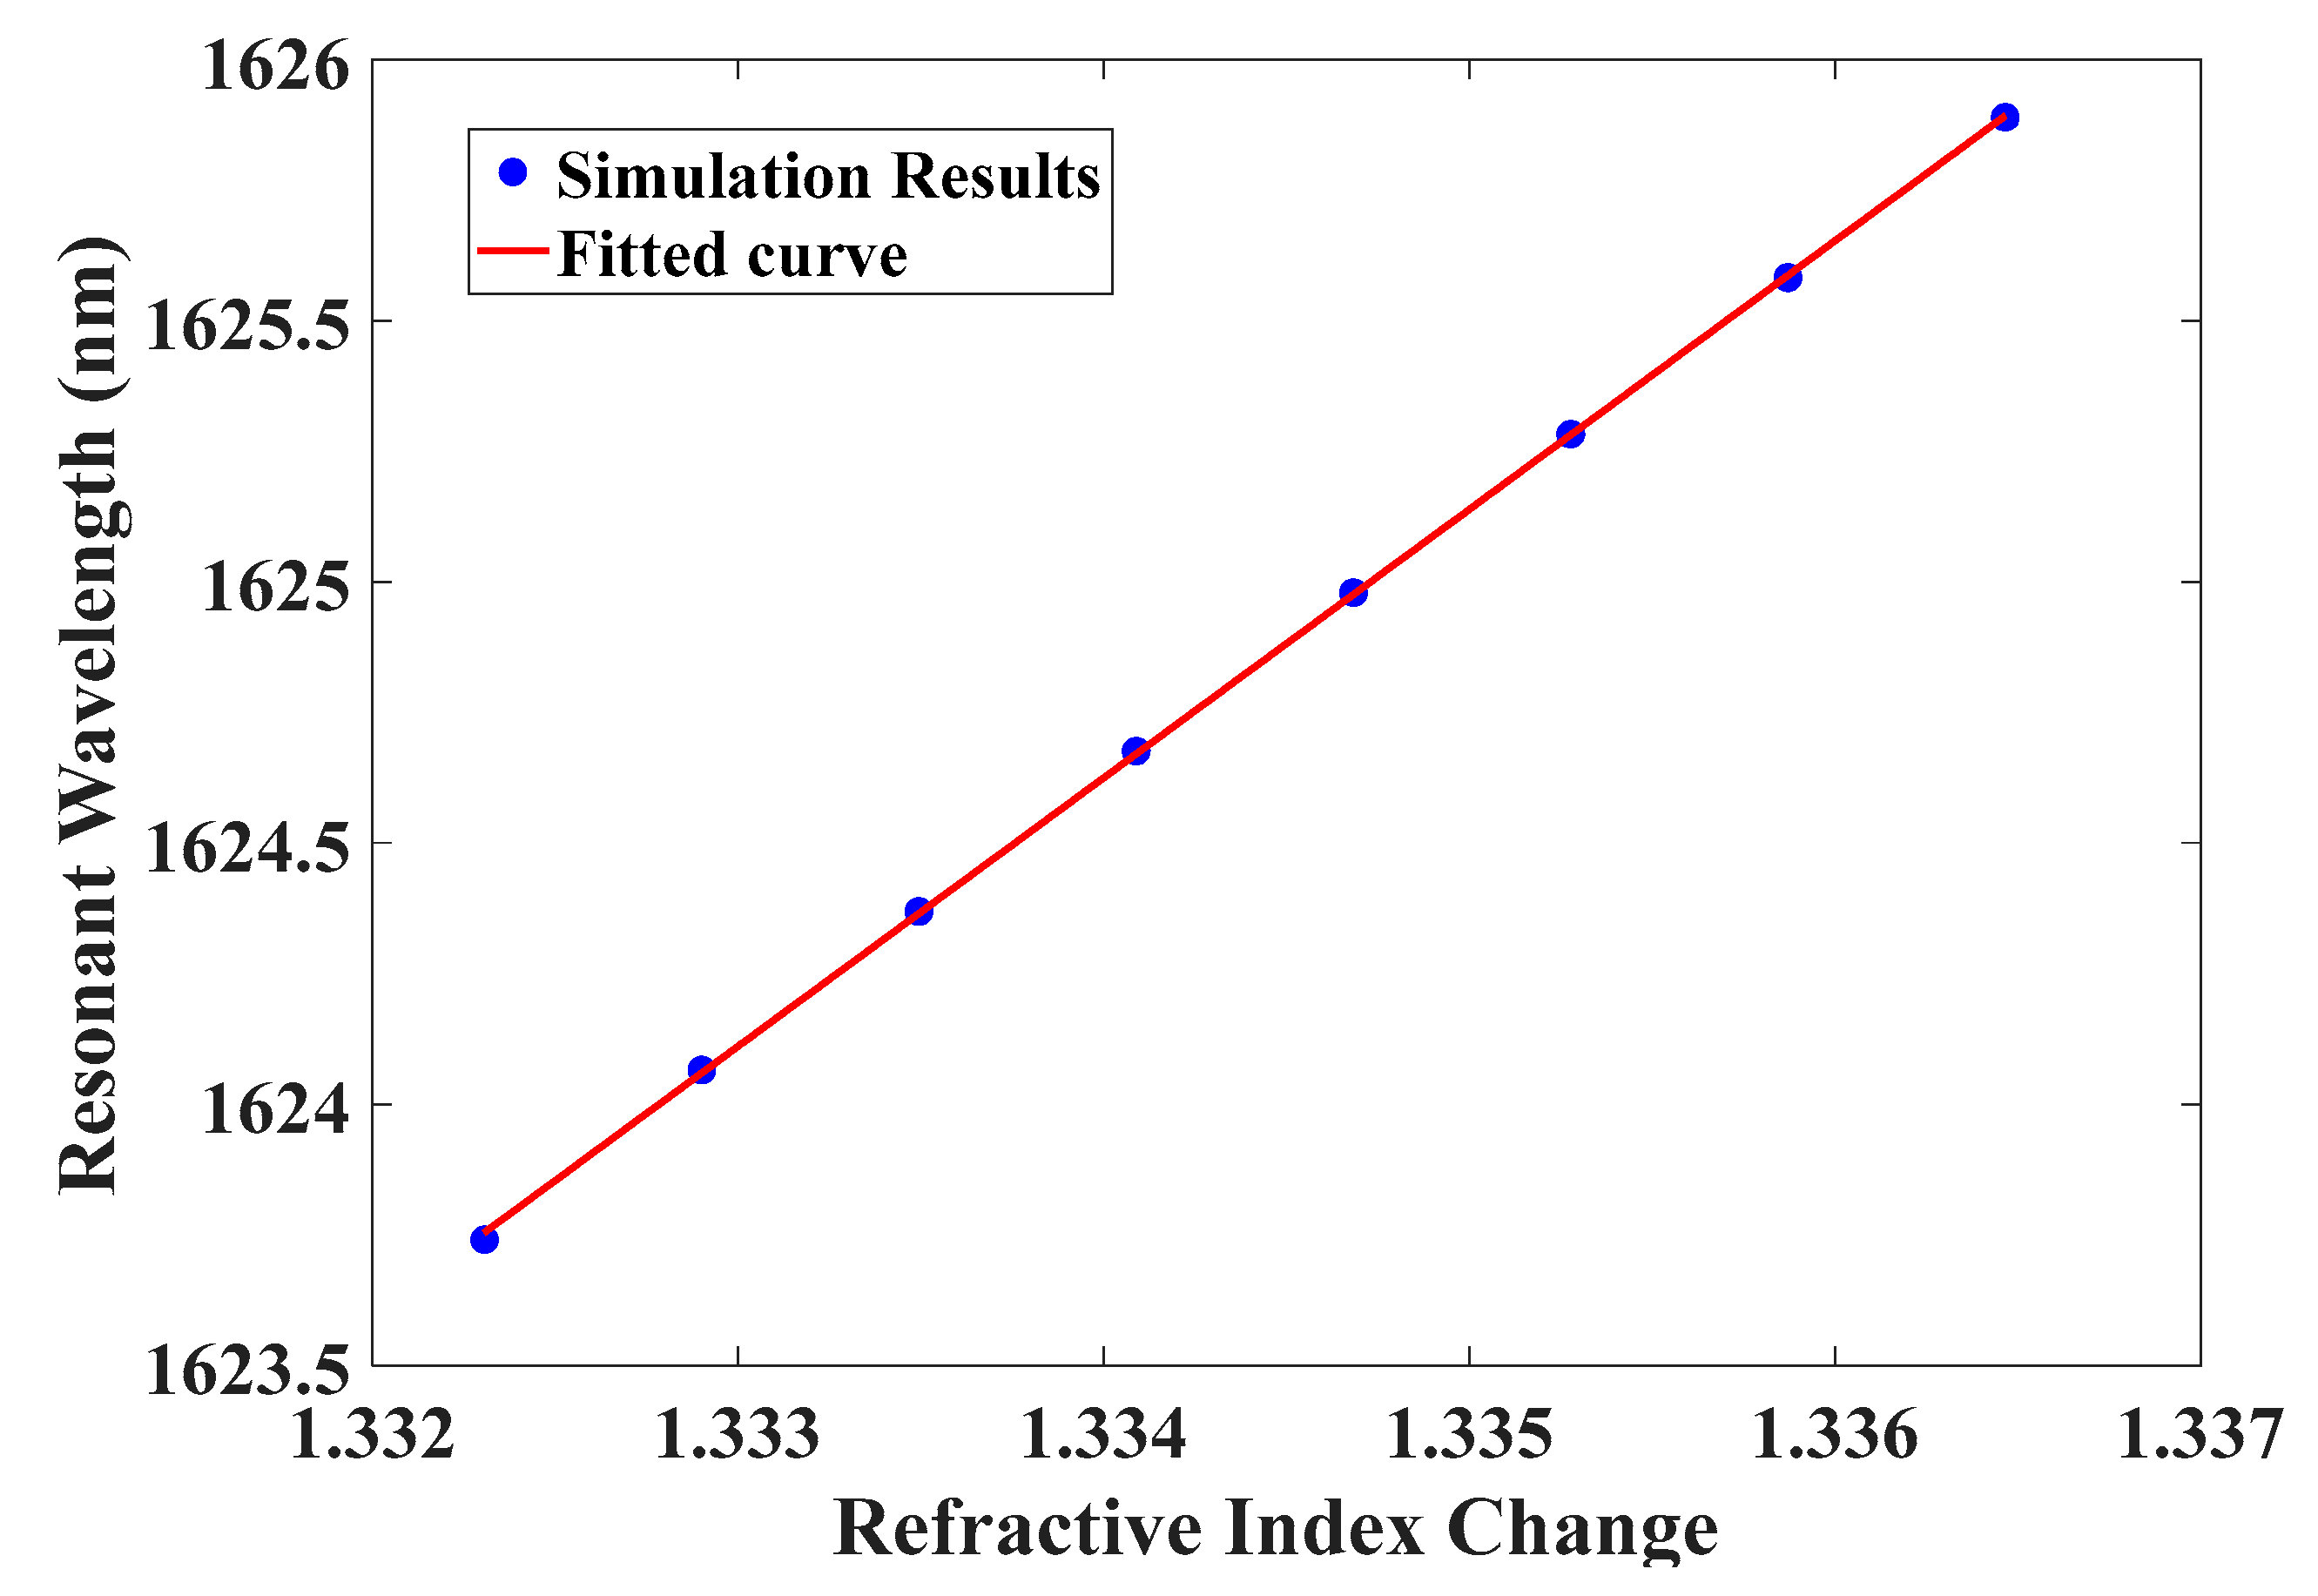
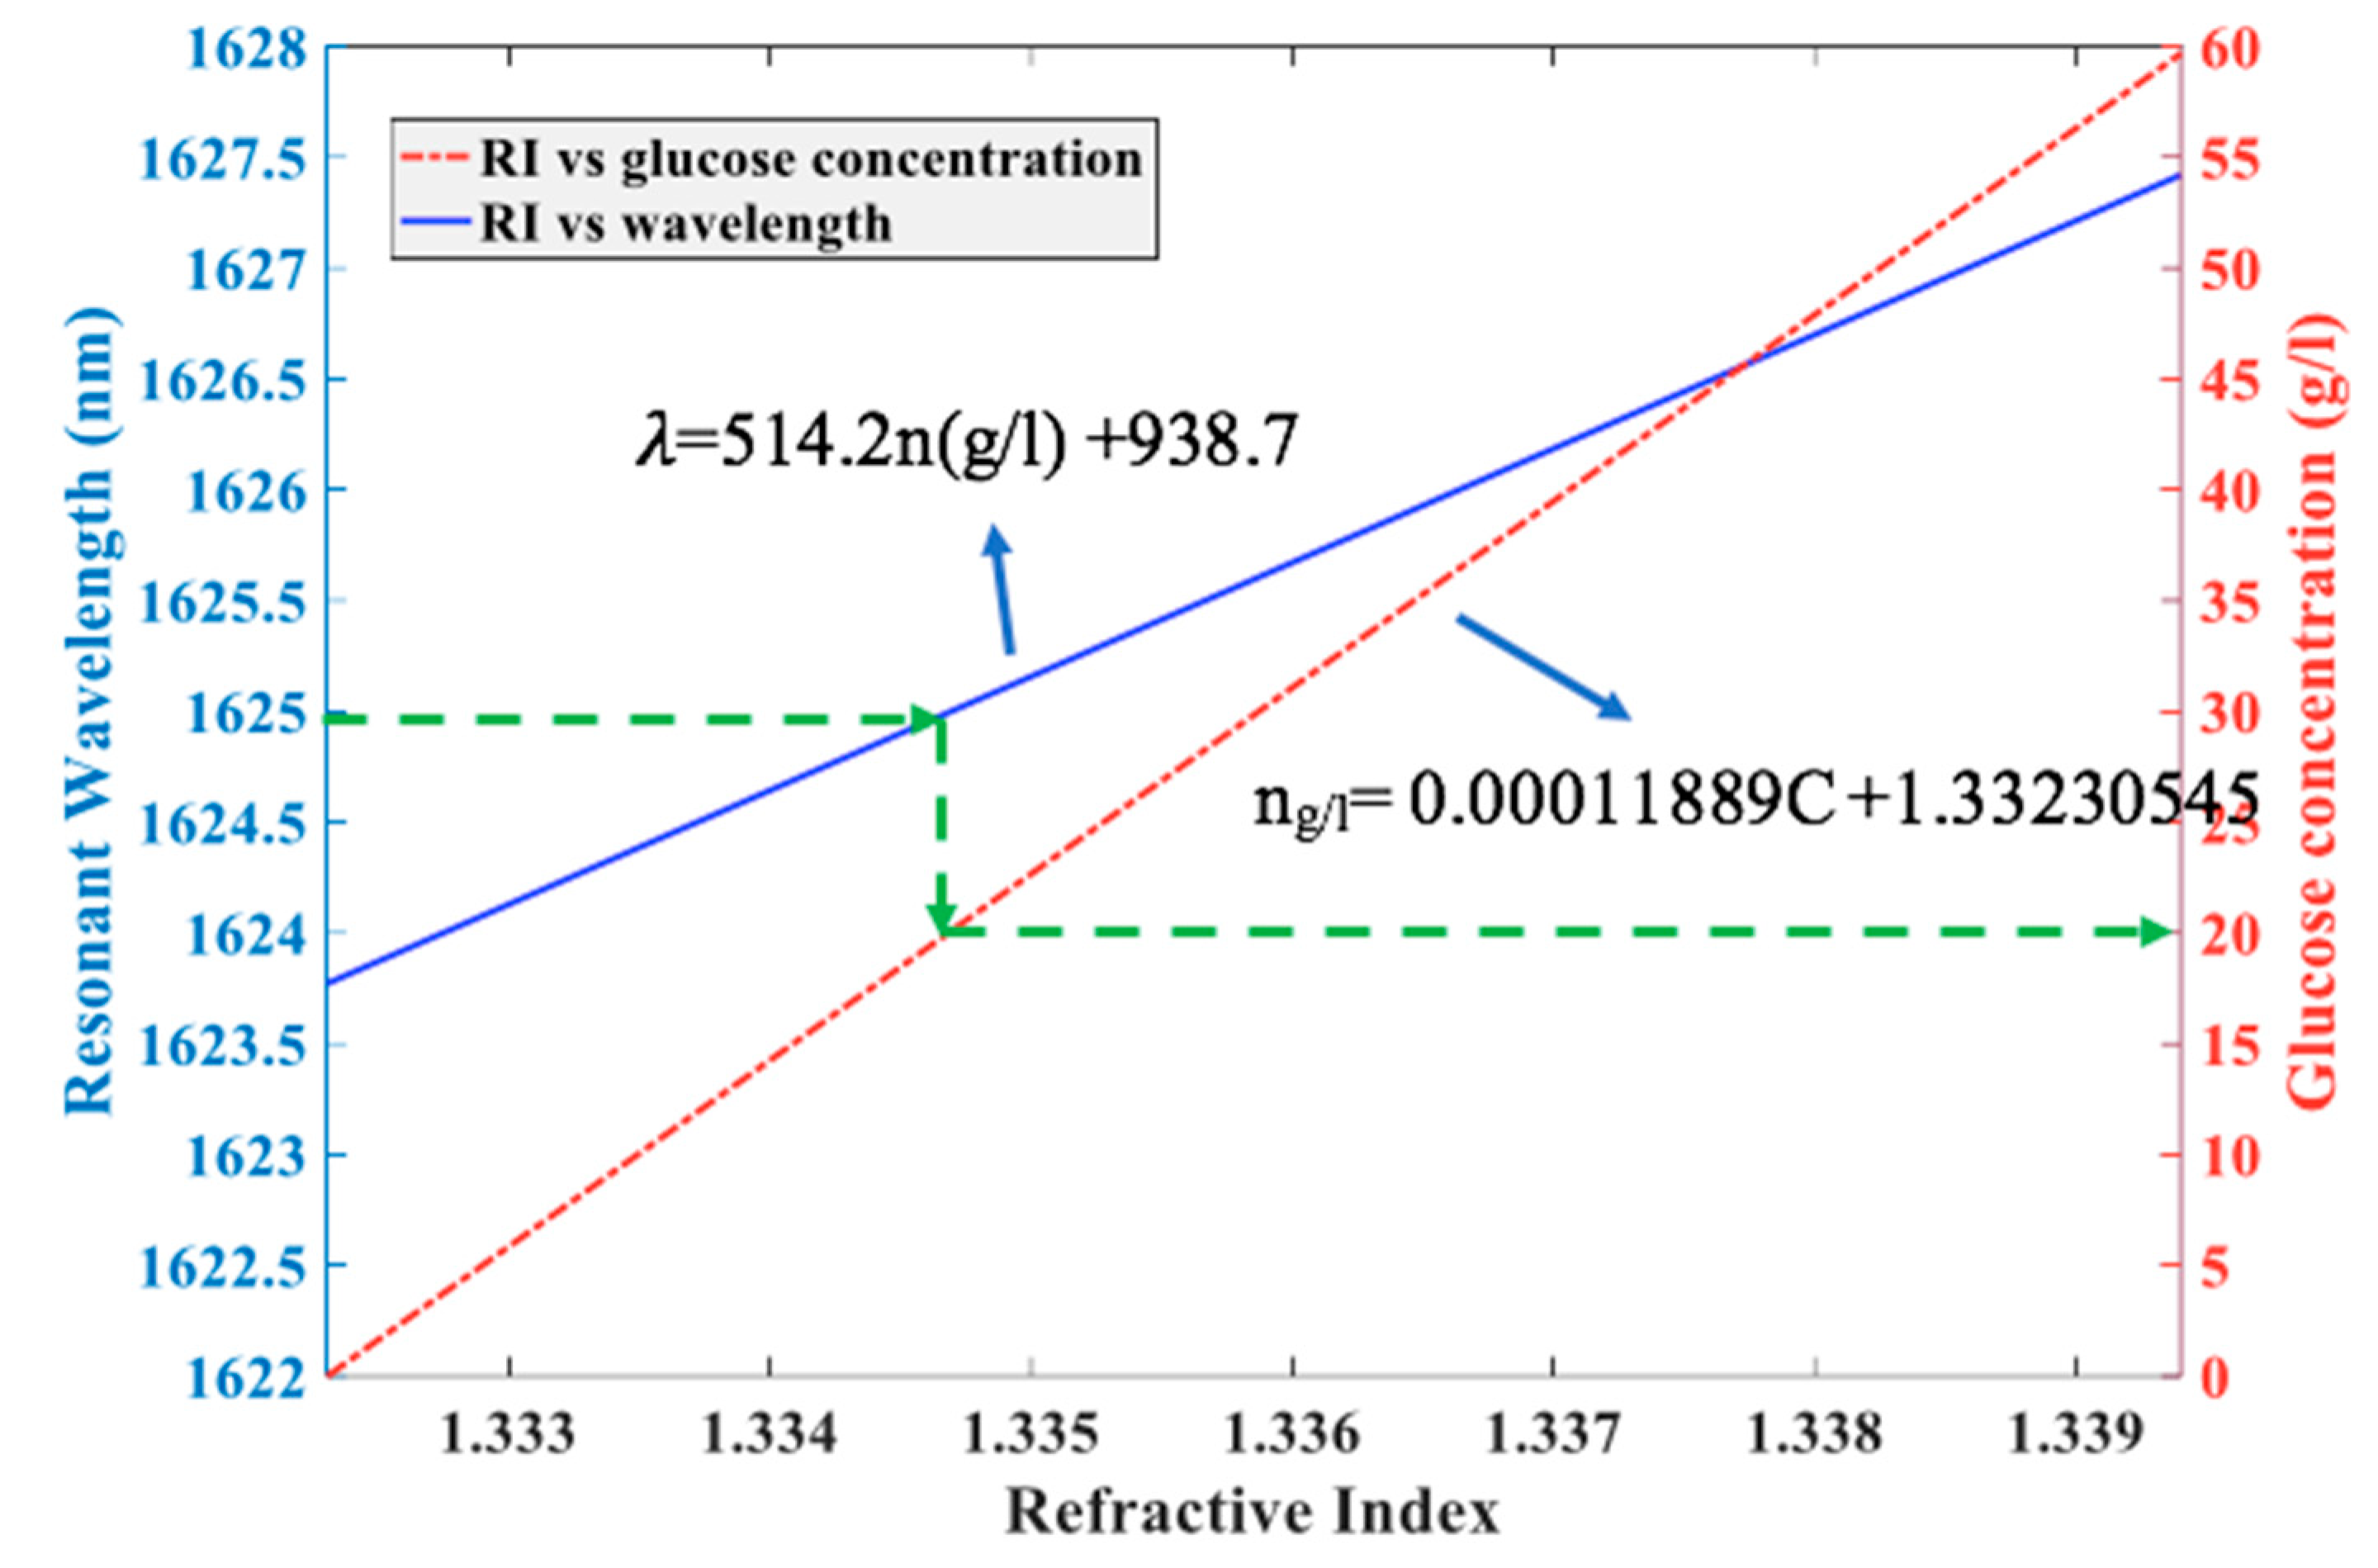
3.4. The Capsule-Shaped Cavity as a Glucose Concentration Sensor

The optimum characteristics of the proposed sensor to detect glucose concentration have been identified as follows: high sensitivity, high quality factor, and low detection limit. A significant previous work by [22] developed a mathematical illustration to define the correlation between the RI and the concentration of glucose. The linear association between the RI and the concentration of glucose can be expressed as follows:
ng/L = 0.00011889C + 1.33230545
where C represents the concentration of glucose (g/L) and ng/L is the RI. As presented in Figure 16, the transmission spectra of the resonant wavelength shift with a nearly constant distance due to the variation in the RI from 1.33230545 to 1.3364666 by the infiltrated liquid. Thus, the sensitivity S is almost constant until the resonant frequency varies within a trivial scale. The wavelength 1623.74 nm was determined as the reference mode and complies with the minimum value of glucose concentration, as can be seen in Figure 17. It is observed that, by increasing the concentration of glucose, the resonant wavelength mode shift increases in a roughly linear way (blue dots). Curve fitting was used to obtain the mathematical function that examines the correlation between the RI corresponding to the glucose concentration and the wavelength shift (red curve), which is expressed as follows:
λ =   514.2 n ( g / L )   + 938.7
where λ is the resonant wavelength mode and n(g/L) is the RI.
Finally, using the fitting curve as in Equation (5) and the curve of Equation (4), we obtained the curves shown in Figure 18. The vertical point projects the resonant wavelength after putting the sample inside the cavity, as illustrated by the dashed green arrow. The value of the glucose concentration is illustrated horizontally, with the intersection of the red dotted curve. Table 5 presents a comparison between our proposed sensor and various published works using the following parameters: transmission, sensitivity S, quality factor Q, and detection limit DL.

4. Conclusions

In this work, the size of a capsule-shaped cavity to perceive the concentration of glucose, coupled with two waveguides as the input and output, has been optimized. The changes in the glucose concentration lead to a variation in the RI, resulting in a shift in the resonant wavelength. Appropriate parameters, such as cavity size, which provides a high sensitivity S = 546.72 nm/RIU, a high quality factor Q = 2066.24, and a low detection limit DL = 1.44 × 10⁻⁴ RIU, have been realized in this work. A high value of transmission of 97% was obtained. The proposed model was found to be simple and easy to manufacture, along with other characteristics such as its high sensitivity and low detection limit. The characteristics and features of the proposed design open up many opportunities and make it promising in the manufacture of different types of biosensing detection devices.

Author Contributions

Conceptualization, M.M.; Formal analysis, M.M. and Y.F.; Funding acquisition, I.B.H.; Investigation, Y.F. and I.B.H.; Methodology, M.M. and Y.F.; Validation, M.M.; Writing—original draft, M.M.; Writing—review & editing, Y.F., I.B.H., A.A.A. and I.U.D. All authors have read and agreed to the published version of the manuscript.

Funding

This research was funded by IFO Profession Development Funds, Metropolitan State University, USA.

Conflicts of Interest

The authors declare no conflict of interest.

References

  1. Arunkumar, R.; Suaganya, T.; Robinson, S. Design and Analysis of 2D Photonic Crystal Based Biosensor to Detect Different Blood Components. Photon Sens. 2018, 9, 69–77. [Google Scholar] [CrossRef]
  2. Mohammed, N.A.; Hamed, M.M.; Khalaf, A.A.M.; Alsayyari, A.; El-Rabaie, S. High-sensitivity ultra-quality factor and remarkable compact blood components biomedical sensor based on nanocavity coupled photonic crystal. Results Phys. 2019, 14, 102478. [Google Scholar] [CrossRef]
  3. Romano, S.; Lamberti, A.; Masullo, M.; Penzo, E.; Cabrini, S.; Rendina, I.; Mocella, V. Optical Biosensors Based on Photonic Crystals Supporting Bound States in the Continuum. Materials 2018, 11, 526. [Google Scholar] [CrossRef] [PubMed] [Green Version]
  4. Caër, C.; Serna, S.; Zhang, W.; Le Roux, X.; Cassan, É. Liquid sensor based on high-Q slot photonic crystal cavity in silicon-on-insulator configuration. Opt. Lett. 2014, 39, 5792–5794. [Google Scholar] [CrossRef]
  5. Zhang, Y.; Zhao, Y.; Wang, Q. Measurement of methane concentration with cryptophane E infiltrated photonic crystal microcavity. Sens. Actuators B Chem. 2015, 209, 431–437. [Google Scholar] [CrossRef]
  6. Hsiao, F.-L.; Lee, C. Computational Study of Photonic Crystals Nano-Ring Resonator for Biochemical Sensing. IEEE Sens. J. 2010, 10, 1185–1191. [Google Scholar] [CrossRef]
  7. Dutta, H.S.; Goyal, A.K.; Pal, S. Sensitivity enhancement in photonic crystal waveguide platform for refractive index sensing applications. J. Nanophotonics 2014, 8, 083088. [Google Scholar] [CrossRef]
  8. Bougriou, F.; Bouchemat, T.; Bouchemat, M.; Paraire, N. Optofluidic sensor using two-dimensional photonic crystal waveguides. Eur. Phys. J. Appl. Phys. 2013, 62, 11201. [Google Scholar] [CrossRef]
  9. Lai, W.-C.; Chakravarty, S.; Wang, X.; Lin, C.; Chen, R.T. On-chip methane sensing by near-IR absorption signatures in a photonic crystal slot waveguide. Opt. Lett. 2011, 36, 984–986. [Google Scholar] [CrossRef]
  10. Di Falco, A.; O’Faolain, L.; Krauss, T.F. Chemical sensing in slotted photonic crystal heterostructure cavities. Appl. Phys. Lett. 2009, 94, 063503. [Google Scholar] [CrossRef]
  11. Arafa, S.; Bouchemat, M.; Bouchemat, T.; Benmerkhi, A.; Hocini, A. Infiltrated photonic crystal cavity as a highly sensitive platform for glucose concentration detection. Opt. Commun. 2017, 384, 93–100. [Google Scholar] [CrossRef]
  12. Huang, L.; Tian, H.; Zhou, J.; Liu, Q.; Zhang, P.; Ji, Y. Label-free optical sensor by designing a high-Q photonic crystal ring–slot structure. Opt. Commun. 2015, 335, 73–77. [Google Scholar] [CrossRef]
  13. Butt, M.; Khonina, S.N.; Kazanskiy, N. An array of nano-dots loaded MIM square ring resonator with enhanced sensitivity at NIR wavelength range. Optik 2020, 202, 163655. [Google Scholar] [CrossRef]
  14. Butt, M.; Kazanskiy, N.L.; Khonina, S.N. Highly Sensitive Refractive Index Sensor Based on Plasmonic Bow Tie Configuration. Photon Sens. 2020, 10, 223–232. [Google Scholar] [CrossRef]
  15. Lin, Y.-C.; Chou, S.-H.; Hsueh, W.-J. Robust high-Q filter with complete transmission by conjugated topological photonic crystals. Sci. Rep. 2020, 10, 1–7. [Google Scholar] [CrossRef]
  16. Kunz, K.S.; Luebbers, R.J. The Finite Difference Time Domain Method for Electromagnetics; CRC Press: Boca Roton, FL, USA, 1993. [Google Scholar]
  17. Bérenger, J.-P. A perfectly matched layer for the absorption of electromagnetic waves. J. Comput. Phys. 1994, 114, 185–200. [Google Scholar] [CrossRef]
  18. Zhang, Y.; Zhao, Y.; Li, J. Theoretical research on slow light engineering of slotted photonic crystal waveguides with elliptical holes and optofluidic infiltration. Appl. Opt. 2015, 54, 1639. [Google Scholar] [CrossRef]
  19. White, I.M.; Fan, X. On the performance quantification of resonant refractive index sensors. Opt. Express 2008, 16, 1020–1028. [Google Scholar] [CrossRef] [PubMed] [Green Version]
  20. Zhang, Y.; Zhao, Y.; Lv, R.-Q. A review for optical sensors based on photonic crystal cavities. Sens. Actuators A Phys. 2015, 233, 374–389. [Google Scholar] [CrossRef] [Green Version]
  21. Wang, X.; Xu, Z.; Lu, N.; Zhu, J.; Jin, G. Ultracompact refractive index sensor based on microcavity in the sandwiched photonic crystal waveguide structure. Opt. Commun. 2008, 281, 1725–1731. [Google Scholar] [CrossRef]
  22. Yeh, Y.-L. Real-time measurement of glucose concentration and average refractive index using a laser interferometer. Opt. Lasers Eng. 2008, 46, 666–670. [Google Scholar] [CrossRef]
  23. Shiramin, L.A.; Kheradmand, R.; Abbasi, A. High-Sensitive Double-Hole Defect Refractive Index Sensor Based on 2-D Photonic Crystal. IEEE Sens. J. 2013, 13, 1483–1486. [Google Scholar] [CrossRef]
  24. Rahman-Zadeh, F.; Danaie, M.; Kaatuzian, H. Design of a highly sensitive photonic crystal refractive index sensor incorporating ring-shaped GaAs cavity. Opto Electron. Rev. 2019, 27, 369–377. [Google Scholar] [CrossRef]
  25. Danaie, M.; Kiani, B.; Mohammad, D.; Behnam, K. Design of a label-free photonic crystal refractive index sensor for biomedical applications. Photon. Nanostructures Fundam. Appl. 2018, 31, 89–98. [Google Scholar] [CrossRef]
Figure 1. Schematic diagram of the photonic crystal capsule-shaped cavity coupled to two waveguides.
Symmetry 12 01480 g001
Figure 2. (a) The index profile of the unit cell; (b) the Brillouin zone (BZ).
Symmetry 12 01480 g002
Figure 3. Band gap and dispersion diagram for the transverse electric (“TE”) polarization.
Symmetry 12 01480 g003
Figure 4. (a) The design of the photonic crystal waveguide; (b) the transmission spectrum of the photonic crystal waveguide W1 (the energy concentrates in the line defect).
Symmetry 12 01480 g004
Figure 5. (a) The dispersion diagram of the waveguide W1, the corresponding transmission spectrum, and the resonant peaks because of the coupling between the cavity and waveguide when nf(caps) = 1 and nf(caps) = 1.33. (b) The mode profile of the odd and even modes; (c) the corresponding group velocity dispersion and the operation wavelength.
Symmetry 12 01480 g005
Figure 6. (a) The capsule shape with length L and radius R; (b) the electric field intensity distribution at the resonance wavelength 1482.22 nm.
Symmetry 12 01480 g006
Figure 7. (a) The transmission characteristics obtained from the defect structure with L = a and R = r without infiltrated liquid analyte inside it; (b) the Gaussian wave through the capsule-shaped cavity structure in the horizontal plan.
Symmetry 12 01480 g007
Figure 8. (a) Diagrammatic representation of the photonic crystal (PhC) sensor structure based on cavity with a capsule shape; the red capsule denotes the sensing region filled with analyte liquid, with n = 1.33; (b) determination of the sensitivity using five different refractive indices. (c) The resonant wavelength shifts, equal to 165.05 nm, due to the refractive index (RI) change from nf(caps) = 1 to nf(caps) = 1.33.
Symmetry 12 01480 g008
Figure 9. (a) The sensitivity and quality factor versus the different capsule lengths, L. (b) The transmission and the resonant wavelength shift for all L changes.
Symmetry 12 01480 g009
Figure 10. (a) The shift in wavelengths due to the alteration in capsule length versus the energy concentrated in the cavity. (b) The shift in wavelengths due to the change in capsule length versus the energy concentrated in the cavity while it was filled with analyte liquid.
Symmetry 12 01480 g010
Figure 11. (a) Representation of |E|2 distribution at different resonance wavelengths when nf = 1; (b) representation of |E|2 distribution at different resonance wavelengths when nf = 1.33 for the sample in the cavity.
Symmetry 12 01480 g011
Figure 12. (a) The sensitivity and the quality factor versus the different capsule radii R. (b) The transmission and the resonant wavelength shift for all R changes.
Symmetry 12 01480 g012
Figure 13. (a) The shift in wavelengths due to the change in capsule width R versus the energy concentrated in the cavity. (b) The shift in wavelengths due to the change in capsule width versus the energy concentrated in the cavity while the cavity was filled with analyte liquid.
Symmetry 12 01480 g013
Figure 14. The resonant wavelengths for different sensing areas (the red spots are the analyte liquid the infiltrated the sensing area, with nf = 1.33).
Symmetry 12 01480 g014
Figure 15. (a,b) The mode profile (horizontal and 3D) of the |E|2 distribution of the resonance wavelengths of area 2.
Symmetry 12 01480 g015
Figure 16. Transmission spectra of the developed sensor as a function of changes in the refractive index.
Symmetry 12 01480 g016
Figure 17. Resonant wavelength with regards to RI (blue dots obtained from Table 4). The red curve is the fitted curve.
Symmetry 12 01480 g017
Figure 18. Schematic illustrating the relation between the resonant wavelength and the glucose concentration.
Symmetry 12 01480 g018
Table 1. Simulation results.
Length Lnf = 1nf = 1.33ΔλSQDL
L = 0.5a1641.921715.20573.28222.082762.002.80 × 10−4
L = 0.8a1519.081655.667136.59413.902417.031.65 × 10−4
L = 0.9a1495.741649.676153.94466.472373.631.49 × 10−4
L = a1482.2191647.271165.05500.162250.201.46 × 10−4
L = 1.1a1477.0861645.9168.81511.562230.221.44 × 10−4
L = 1.2a1475.41642.75167.35507.122061.171.57 × 10−4
L = 1.5a1455.4921596.5141.01427.30779.094.80 × 10−4
Table 2. Simulation results.
Width Rnf = 1nf = 1.33ΔλSQDL
R = 0.8r1555.601704.77149.17452.032367.741.59 × 10−4
R = 0.9r1513.391673.40160.01484.872842.251.21 × 10−4
R = r1477.091645.90168.81511.562230.221.44 × 10−4
R = 1.1r1451.701623.59171.89520.882081.531.50 × 10−4
R = 1.2r1421.201594.64173.44525.592531.181.21 × 10−4
R = 1.3r1395.801567.49171.69520.261711.231.76 × 10−4
Table 3. Illustrates the different effects of the sensing areas.
Sensing areaNf = 1Nf = 1.33SQDLTransmission
Only Capsule1421.201594.64525.592531.181.20 × 10−491%
Area 11421.201603.08551.142410.641.21 × 10−494%
Area 21421.201622.59610.262192.681.21 × 10−497%
Area 31421.201626.77622.951265.972.06 × 10−497%
Entire Area1421.201628.25627.421112.952.33 × 10−499%
Table 4. The refractive index (n), the resonant wavelength (λ), sensitivity (S), Q factor and detection limit DL as functions of various glucose concentrations (C).
C (g/L)n λ SQDL
01.332305451623.74 2055.37
51.332899901624.065546.722066.241.44 × 10−4
101.333494351624.37529.902069.261.48 × 10−4
151.334088801624.675524.292069.651.50 × 10−4
201.334683251624.98521.492070.041.51 × 10−4
251.335277701625.283519.132075.711.51 × 10−4
301.335872151625.583516.722078.751.51 × 10−4
351.336466601625.889516.442084.471.51 × 10−4
Table 5. Summary of related works.
ReferencesNormalized TransmissionSensitivity (nm/RIU)Q FactorDetection Limit (RIU)
[21]80%33038001 × 10−3
[23]91%50017,8901 × 10−4
[12]80%16011,477.38.75 × 10−5
[24]97%73912561.6 × 10−4
[25]90%63825–30-
In this work97%546.722066.241.44 × 10−4

