Abstract
Because of its special structure, the anisotropic properties of columnar jointed rock mass (CJRM) are complicated, which brings difficulty to engineering construction. To comprehensively study the anisotropic characteristics of CJRM, uniaxial compression tests were conducted on artificial CJRM specimens. Quadrangular, pentagonal and hexagonal prism CJRM models were introduced, and the dip direction of the columnar joints was considered. Based on the test results and the structural features of the three CJRM models, the deformation and strength characteristics of CJRM specimens were analyzed and compared. The failure modes and mechanisms of artificial specimens with different dip directions were summarized in accordance with the failure processes and final appearances. Subsequently, the anisotropic degrees of the three CJRM models in the horizontal plane were classified, and their anisotropic characteristics were described. Finally, a simple empirical expression was adopted to estimate the strength and deformation of the CJRM, and the derived equations were used in the Baihetan Hydropower Station project. The calculated values are in good agreement with the existing research results, which reflects the engineering application value of the derived empirical equations.
1. Introduction
The complex structure and pronounced anisotropy of columnar jointed rock mass (CJRM) pose challenges to the stability and safety of related projects [1,2]. With the development of water projects in China, geotechnical issues involving CJRM have been increasingly prominent [3,4]. Especially in the Baihetan Hydropower Station, columnar joints are widely distributed in the dam foundation [5,6]. Field investigations have indicated that the CJRM has significant anisotropic deformation and strength properties, which caused the relaxation of local stresses [7,8] and collapse failure during construction [9,10]. Therefore, understanding the anisotropic strength and deformation characteristics of the CJRM is important for the design and construction of engineering projects.
Among many research methods, physical model tests on rock-like materials provide a simple and straightforward approach to solving the mechanical problems [11,12,13,14]. The rock-like materials are widely used to simulate the actual engineering geology and reflect the mechanical characteristics of simulated rock mass. Due to the advantages of easy control and low cost, model tests have been widely used by researchers. For instance, Tien [12] prepared the artificial transversely isotropic rock mass using plaster as the model material, and analyzed its failure mechanism. Li [13] conducted several direct shear tests on the specimens with different dip angles to investigate the anisotropy of closely jointed rock masses. For the CJRM, Xiao [15] used a mixture of plaster, cement and water to simulate the hexagonal prism CJRM (6P-CJRM), and studied the effects of the dip angle of columns on the mechanical properties of CJRM. Ji [16] carried out uniaxial compression tests on artificial 6P-CJRM specimens with various dip angles and proposed an empirical equation to estimate the strength and deformation of CJRM. Jin [17] simulated the quadrangular prism CJRM (4P-CJRM) and described the anisotropic mechanical behavior of CJRM under uniaxial compression.
The cross-sectional shapes of CJRM are mainly irregular quadrilateral, pentagon and hexagon, which has been proved in field investigations [1,18]. This geological phenomenon can also be seen from Figure 1, which shows the CJRM at Baihetan Hydropower Station in China. However, current research on physical model testing of CJRM has mainly focused on the 4P- and 6P-CJRM models and the effect of dip angle on the mechanical properties in the vertical plane (Figure 1a), while ignoring the existence of pentagonal prism CJRM (5P-CJRM) in the natural geological environment and the anisotropic characteristics in the horizontal plane (Figure 1b). In addition, scholars have only taken the CJRM model with a single cross-sectional shape as the research object, and have not considered the influence of column cross-sectional shape on the anisotropic behavior of CJRM. Accordingly, it is necessary to study the influence of the dip direction (in the horizontal plane) of the column on the anisotropic characteristics of CJRMs with different cross-sectional shapes.
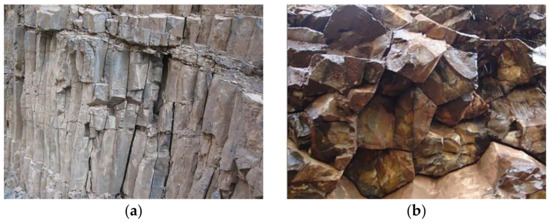
Figure 1.
Columnar jointed rock mass (CJRM) at Baihetan Hydropower Station in China: (a) CJRM in the vertical plane; (b) CJRM in the horizontal plane.
In this study, the uniaxial compression tests were performed on the artificial 4P-, 5P- and 6P-CJRM specimens with different dip directions. The deformation and strength characteristics of CJRM specimens with different cross-sectional shapes were analyzed and compared on the basis of the test results. According to the failure processes and final appearances of specimens, the failure modes and mechanisms were summarized. For these three types of CJRM models, the anisotropic degrees in the horizontal plane were classified, and the anisotropic characteristics were described. Subsequently, the empirical equations for predicting the strength and deformation of the CJRM were derived and applied to the Baihetan Hydropower Station project. The calculated values of the Baihetan CJRM were consistent with the existing research results, reflecting that the derived empirical equations can provide a good reference value for the development of related engineering applications.
2. Structural Characteristics of the CJRM
The columnar joint network is the result of cooling and construction of lava flows [19]. Ideally, for the homogeneous rock, the cross-sectional shape of CJRM is a regular hexagon. However, the geometry of the natural CJRM is an irregular polygonal column owing to the heterogeneity of rock mass and other reasons [20]. Field investigations have shown that the common cross-sections of CJRMs are mainly irregular quadrangular, pentagonal and hexagonal [21,22]. The CJRM of Baihetan Hydropower Station in China shown in Figure 1 also reflects this geological phenomenon. The Baihetan columnar joints are predominantly developed in the P2β33−2 strata, with strikes trending N30°–50°E [18]. The statistical results demonstrate that the quadrangular, pentagonal and hexagonal columns account for 32.1, 46.7 and 17.6% of the total data, respectively [1]. The diameters of columns are mainly in the range of 13–25 cm, and the aspect ratios are in the range of 2–5 [17].
Previous studies on the CJRM were mainly based on the regular 4P- and 6P-CJRM models shown in Figure 2a,b [16,23]. Que [24] proposed a 5P-CJRM model which has the structural characteristics of the above two regular models. As shown in Figure 2c, the 5P-CJRM model not only includes the persistent joints, but also has the interlocking structure. In Figure 2, l4 and l6 are the side lengths of the regular quadrilateral and hexagon, respectively. l5 is the length of the other four sides in the pentagon, excluding the bottom side. The angle between the parallel directions in the top and bottom sides of the pentagon is 50°. Because of the geological structure, the influence of the column deflection needs to be considered when studying the mechanical properties of CJRM. As shown in Figure 2, α is the dip direction of columnar joints in the horizontal plane. β is the dip angle of columnar joints in the vertical plane. In the following model tests, the effect of dip direction on the anisotropic behavior of the three CJRM models was investigated.
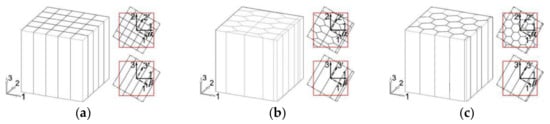
Figure 2.
Structural characteristics of the three CJRM models: (a) 4P-CJRM model; (b) 6P-CJRM model; (c) 5P-CJRM model.
3. Model Tests
3.1. Similar Material and Model Size
Physical model testing is a method to solve engineering problems by simulating actual geological conditions. Based on the similarity principle, the geometric and physical parameters of the prototype and the established model must maintain a certain proportion [25]. The relations between the similarity constants are as follows [26]:
where Cσ, Cγ, CL, Cδ, Cε, CE, Cf, Cφ, Cμ, Cc, Cσc and Cσt are the similarity constants of stress, bulk density, geometry, displacement, strain, deformation modulus, friction coefficient, internal friction angle, Poisson’s ratio, cohesion, compressive strength and tensile strength, respectively.
The selection of similar material is critical to the success of physical model testing. In order to simulate the columnar jointed basalt, Xia [27] compared 10 kinds of mixed materials and finally selected a mixture with a mixing ratio of mg:ms:mw = 3:1:2.4 as the rock-like material, where mg, ms and mw represented the qualities of high-strength gypsum, fine sand and water, respectively. The brand of gypsum was “White Magnolia”, and the particle size of fine sand was less than 1 mm. To avoid errors caused by the brands of raw materials and working conditions, the uniaxial compression tests, Brazilian splitting tests and direct shear tests were performed on the rock-like material with the same mixing ratio, and the mechanical parameters were obtained. As shown in Table 1, the physical and mechanical parameters of rock-like material and intact basalt are listed. By combining the geometric structure of the Baihetan CJRM and the similarity principle, the similarity constants of geometry, density, stress, deformation modulus and dimensionless parameters were determined as 6, 2.5, 15, 15 and 1, respectively.

Table 1.
Physical and mechanical parameters of rock-like material and intact basalt.
In this model test study, the 4P-, 5P- and 6P-CJRM models were introduced simultaneously. To ensure that different models have the same cross-sectional size, the maximum diagonal length of the polygons should be consistent. In addition, the model size needs to meet the similarity constant of geometry and overcome the size effect [28]. Ni [29] presented that the representative elementary volume (REV) of CJRM is approximately four times larger than the average side length of the cross-section. Therefore, under the premise that the size of a standard specimen is 10 cm × 10 cm × 10 cm, the side length values of the 4P-, 5P- and 6P-CJRM models were l4 = 2 cm, l5 = 1.7 cm and l6 = 1.4 cm, respectively. The cement slurry with a mixing ratio of mc:mw = 1:0.4 was selected to simulate the joint surface and act as a binder between the columns, where mc and mw represent the qualities of cement and water, respectively [16]. Through laboratory tests, the cohesion and friction angle of the joint filler were determined as 1.23 MPa and 32.0°, respectively.
3.2. Manufacturing Process of Specimens
In order to study the anisotropic characteristics of CJRM, the dip direction α was considered. Figure 3a–c show the joint distributions in the horizontal plane of 4P-, 5P- and 6P-CJRM specimens with different dip directions α, where dip direction α is the angle between the joint group with the highest connectivity rate and the load direction. The selected dip directions were 0, 15, 30, 45, 60, 75 and 90°. For the 4P- and 6P-CJRM, due to the geometrical features of regular quadrangular and hexagonal joints, the specimens with the dip directions of 0–30° and the specimens with the dip directions of 60–90° duplicated each other. Therefore, only the 4P- and 6P-CJRM specimens with the dip directions of 0–45° were required.
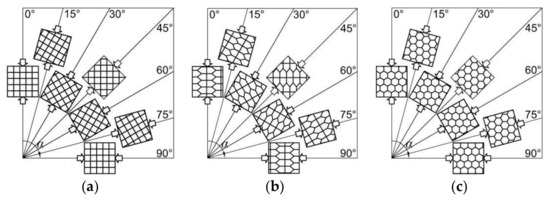
Figure 3.
CJRM specimens with different dip directions α: (a) 4P-CJRM specimens; (b) 5P-CJRM specimens; (c) 6P-CJRM specimens.
The complete manufacturing process is shown in Figure 4. First, the high-strength gypsum, fine sand and water were mixed in a mixing ratio of mg:ms:mw = 3:1:2.4 (Figure 4a), and then the mixture was slowly poured into the molds to obtain the columnar bars with different cross-sectional shapes (Figure 4b). There were six sets of molds, each of which consisted of two symmetrical acrylic plates with grooves. Before casting, engine oil was daubed on each groove to help the columns release from the molds, and six sets of molds were neatly assembled together and fastened using a fixed clamp to prevent slurry loss.
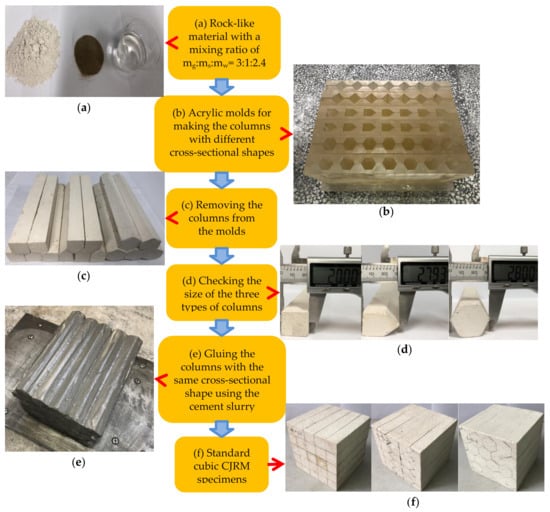
Figure 4.
Manufacturing process of the artificial CJRM specimens: (a) Rock-like material with a mixing ratio of mg:ms:mw = 3:1:2.4; (b) Acrylic molds for making the columns with different cross-sectional shapes; (c) Removing the column bars from the molds; (d) Checking the size of the three types of columns; (e) Gluing the columns with the same cross-sectional shape using the cement slurry to form a model block; (f) Standard cubic CJRM specimens.
After maintaining the rock-like material in the molds at room temperature for 40 min, the initially solidified columnar bars were removed from the grooves and allowed to continue curing for 24 h (Figure 4c). A digital Vernier caliper was used to check the size of the columnar bars with different cross-sectional shapes (Figure 4d). Subsequently, the cement slurry with a mixing ratio of mc:mw = 1:0.4 was used to glue the columns with the same cross-sectional shape together (Figure 4e) and then allowed to cure at 22 ± 2 °C for 20 days.
To obtain a standard cubic specimen, a double-sided grinding machine was then used. By changing the angle between the joint group with the highest connectivity rate and the grinding surface, the artificial CJRM specimens with different dip directions were made. Figure 4f shows the 4P-, 5P- and 6P-CJRM specimens with the dip direction of 0°.
3.3. Testing Equipment and Procedure
The physical model tests were performed on the RMT-150B servo-controlled test system shown in Figure 5. All the data was automatically collected and displayed by the connected computer. The loading was controlled by axial deformation with a rate of 0.2 mm/min. To analyze the failure modes and mechanisms of CJRM specimens, the Canon 700-D camera was used to record the entire testing processes and final appearances. Before testing, the top and bottom ends of the specimen were greased to reduce friction caused by the end effect.
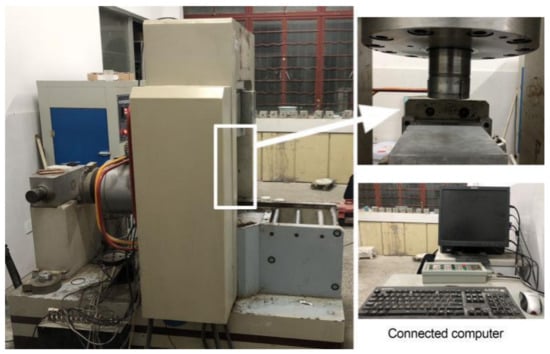
Figure 5.
RMT-150B servo-controlled test system.
4. Test Results
4.1. Deformation and Strength Behavior
The typical stress-strain curves for the three types of artificial CJRM specimens with different dip directions are shown in Figure 6. According to the approximate straight line between 20 and 80% of the peak strength in the stress-strain curve, the elastic modulus Ecj was calculated by the following equation [15]:
where σcj(0.2) and εcj(0.2) are the axial stress and strain corresponding to 0.2 times the peak strength σcj, respectively. σcj(0.8) and εcj(0.8) are the axial stress and strain corresponding to 0.8 times the peak strength σcj, respectively. The elastic modulus Ecj and uniaxial compression strength (UCS) σcj of the CJRM specimens are shown in Table 2.
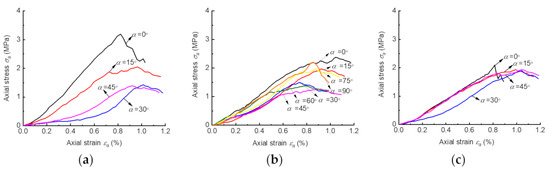
Figure 6.
Stress-strain curves of the CJRM specimens: (a) 4P-CJRM specimens; (b) 5P-CJRM specimens; (c) 6P-CJRM specimens.
Table 2.
Experimental results of the artificial CJRM specimens.
Clearly, the dip direction α had an effect on the anisotropic mechanical behaviors of the CJRM specimens. The variations in elastic modulus and UCS with dip direction α are shown in Figure 7.
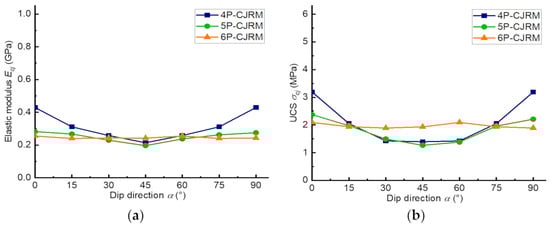
Figure 7.
Variations in elastic modulus and uniaxial compression strength (UCS) with dip direction α: (a) Elastic modulus anisotropy curves of the three CJRM models; (b) UCS anisotropy curves of the three CJRM models.
The three curves in Figure 7a reflect the differences between the deformation behaviors of the three CJRM models. The elastic modulus of 4P-CJRM achieves the maximum values at α = 0 and 90° and yields the minimum value at α = 45°. Due to the structural features of regular quadrangular joints, the variation curve of 4P-CJRM is symmetrical about α = 45°. For 6P-CJRM specimens, the elastic modulus changes little with the dip direction, which is caused by the interlocking between the columns. Since the 5P-CJRM has the structural characteristics of the above two models, its variation curve is approximately symmetrical, and the fluctuation range of the curve is smaller than that of the 4P-CJRM. The elastic modulus values at α = 0° also reflect the differences between the structural features of the three CJRM models. For 5P- and 6P-CJRM specimens, the total deformation includes not only the axial compression deformation but also a small part of shear deformation due to the interlocking between the columns. Therefore, the elastic moduli of the 5P- and 6P-CJRM specimens are smaller than that of the 4P-CJRM specimen when α is 0°.
Figure 7b shows the variations in the UCS with the dip direction α. The variation trends of these three curves are the same as those of the corresponding curves in Figure 7a. The UCS values of the 6P-CJRM specimens at α = 30, 45 and 60° are significantly higher than those of the 4P- and 5P-CJRM specimens. This is because the structure of interlocking between the hexagonal prisms increases the ability of the specimen to resist vertical load. However, for the 4P- and 5P-CJRM specimens with the dip directions of 30, 45 and 60°, the load mainly causes the specimen to slide along the joint surface. Then, the UCS values of 4P- and 5P-CJRM are smaller than those of the 6P-CJRM. Due to the interlocking structure of the 6P-CJRM, its UCS changes little with the dip direction. In addition, owing to the differences between the structural features of the three CJRM models, the UCS value of the 4P-CJRM is greater than that of the other two models when α is 0°. For 4P-CJRM, the load direction is perpendicular to a group of joint planes at this time, so there is no shear stress along the joints. However, for 5P- and 6P-CJRM, a small part of the load causes the columns to slide slightly along the joints due to the interlocking structure.
4.2. Failure Modes and Mechanisms
The final failure appearances and corresponding failure modes of the CJRM specimens are shown in Figure 8. Three main failure modes of the artificial CJRM specimens are summarized. The typical failure processes of these three modes are listed in Figure 9, and the failure mechanisms are described in detail below.
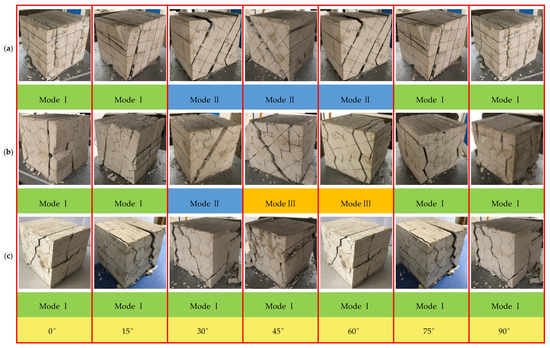
Figure 8.
Final failure appearances of three types of artificial CJRM specimens with different dip directions: (a) 4P-CJRM specimens; (b) 5P-CJRM specimens; (c) 6P-CJRM specimens.
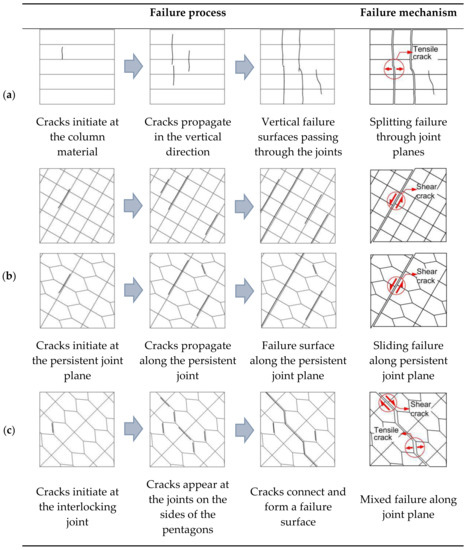
Figure 9.
Typical failure processes of the CJRM specimens: (a) Failure process and mechanism of Mode I; (b) Failure process and mechanism of Mode II; (c) Failure process and mechanism of Mode III.
- Mode I:
- Splitting failure through joint planes. This mode occurs in the 4P- and 5P-CJRM specimens with the dip directions of 0, 15, 75 and 90° and in all the 6P-CJRM specimens. As observed from Figure 9a, the cracks initiate at the column material and propagate in the vertical direction. Eventually, failure surfaces passing through the joint planes appear on the specimen. Therefore, no sliding along the joint plane is observed, and the damage of the specimen is tensile failure.
- Mode II:
- Sliding failure along persistent joint plane. This mode occurs in the 4P-CJRM specimens with the dip directions of 30, 45 and 60° and in the 5P-CJRM specimen with the dip direction of 30°. The cracks initiate at the persistent joint plane and propagate along the persistent joint (Figure 9b). Eventually, sliding failure occurs along the persistent joint plane because the shear stress acting on the joint plane is greater than its shear strength.
- Mode III:
- Mixed failure along joint plane. This mode occurs in the 5P-CJRM specimens with the dip directions of 45 and 60°. The cracks initiate at the interlocking joints on the top of the pentagon, and appear at the joints on the sides of the pentagon under the further load (Figure 9c). Eventually, the cracks at the two locations connect and form a failure surface. The initial cracks are caused by tension because the angle between the joint and the load direction is small. The further load makes the columns slide along the sides of the pentagon, and the lateral deformation of the specimen accelerates the propagation of the cracks at the interlocking joints. Therefore, the failure mode of the specimen is mixed failure along the joint plane.
Each of the three failure modes has its own distinct characteristics, and these three modes are easy to distinguish. It is worth noting that the 5P-CJRM specimens with dip directions of 15 and 75° had similar propagations of cracks on the recorded sides to those of Mode II and Mode III respectively.
5. Discussion
5.1. Anisotropic Degrees in Horizontal Plane
The variation curves in Figure 7 show the different mechanical characteristics of the three CJRM models. It can be seen from the fluctuation ranges of the curves that there are similarities and differences between the anisotropic degrees of the three models. To quantitatively describe the anisotropic degrees of the CJRM in the horizontal plane, the anisotropic ratio Rc is introduced. Rc is the ratio of the maximum value to the minimum value in a variation curve [30]:
where Rcs and Rcd are the strength and deformation anisotropic ratios, respectively. σcjmax and σcjmin are the maximum and minimum UCS values in the variation curve, respectively. Ecjmax and Ecjmin are the maximum and minimum elastic modulus values in the variation curve, respectively. The larger the Rcs or Rcd value, the more significant the strength or deformation anisotropy of the rock.
By using the test results in Table 2, the anisotropic ratios of the three CJRM models in the horizontal plane were obtained. The calculated deformation anisotropic ratios of the 4P-, 5P- and 6P-CJRM models were 2.01, 1.44 and 1.06, respectively. The corresponding strength anisotropic ratios were 2.29, 1.88 and 1.11. Based on the classification system of the inherent anisotropy of rock proposed by Ramamurthy [31], the anisotropies of the 4P-, 5P- and 6P-CJRM models in the horizontal plane were ranked into medium, low and low degrees, respectively.
5.2. Anisotropic Characteristics of the Three CJRM Models
In order to visually show the anisotropic characteristics of the three CJRM models, the polar coordinate system was adopted. According to the test results in Figure 7, the variations in the elastic modulus and UCS of the three CJRM models are shown in Figure 10.
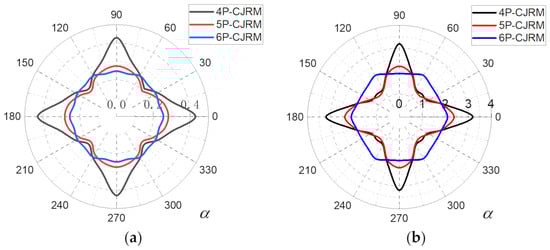
Figure 10.
Elastic modulus and UCS of the three CJRM models in the polar coordinate system: (a) Elastic modulus Ecj; (b) UCS σcj.
For 4P-CJRM, the variation curves of the elastic modulus and UCS in the horizontal plane are all an axisymmetric diagram resembling a gyro. Meanwhile, there are three orthogonal elastic symmetric planes (Figure 2a), so the 4P-CJRM model is orthotropic. The variations in the elastic modulus and UCS of the 5P-CJRM are similar to those of the 4P-CJRM, which also reflects the orthotropic characteristic. However, for 6P-CJRM, the variation curves of the elastic modulus and UCS in the horizontal plane are all approximately circular. Therefore, the 6P-CJRM model can be considered to be a quasi-transverse isotropic body.
5.3. Theoretical Prediction of Strength and Deformation
For the jointed rock mass cut by multiple sets of weakness planes, Ramamurthy [31] proposed the following empirical equation to predict its UCS:
where σc is the UCS of jointed rock mass when the joint angle is θ. θm is the joint angle value corresponding to the minimum value of UCS. A and B are the constant terms that can be determined using the test results at θ = 0°, θm and θ = θm, 90°.
In addition, this form of Equation (8) can also be used to estimate the elastic modulus of the jointed rock mass [15]. Therefore, this simple empirical expression was introduced in this study to predict the strength and deformation of the CJRM. Before using Equation (8), the UCS and elastic modulus of the CJRM specimens were normalized to make the derived empirical equations more convenient to use, as follows:
where σcr and Ecr are the normalized UCS and normalized elastic modulus, respectively. σci and Eci are the UCS and elastic modulus of intact rock-like material, respectively. Then, the empirical equations for estimating the normalized UCS and normalized elastic modulus of the CJRM can be rewritten as:
where the subscripts s and d represent the parameters of the strength and deformation, respectively.
By combining the model test results in Table 2, the specific empirical equations were determined and are listed in Table 3. The corresponding theoretical curves of normalized UCS and normalized elastic modulus are shown in Figure 11.
Table 3.
Empirical equations for predicting the UCS and elastic modulus of the CJRM.
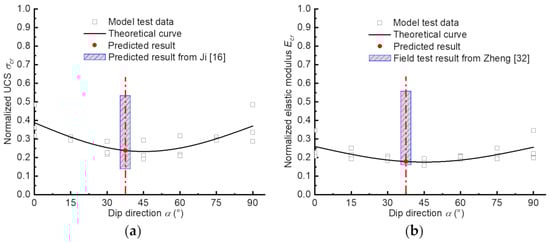
Figure 11.
Theoretical curves of the normalized mechanical parameters: (a) Normalized UCS σcr; (b) Normalized elastic modulus Ecr.
To verify the applicability of the derived empirical equations, the Baihetan Hydropower Station project was introduced. For the Baihetan CJRM, the average dip direction α is 40° [18]. Then, the normalized UCS and normalized elastic modulus of the Baihetan CJRM can be predicted using the equations in Table 3. The calculated values are listed in Table 4 and compared with the existing research results. As can be seen in Figure 11, the calculated values are all within the ranges of the existing results. This proves that the empirical equations in Table 3 are valuable for related engineering applications.
Table 4.
Calculated results and existing results of the Baihetan CJRM.
6. Conclusions
In order to comprehensively understand the anisotropic characteristics of CJRM, the physical model tests were performed on the 4P-, 5P- and 6P-CJRM specimens with different dip directions. The main conclusions are summarized as follows:
- (1)
- The differences between the strength and deformation behaviors of the three CJRM models were mainly caused by the structural features of these three models. The curves of 4P-CJRM were symmetrical, while the curves of 6P-CJRM were approximately straight. For 6P-CJRM, the variation curves combined the characteristics of the above two models.
- (2)
- Three typical failure modes of the CJRM specimens with different dip directions α were summarized, including the splitting failure through joint planes, the sliding failure along a persistent joint plane and the mixed failure along a joint plane.
- (3)
- The anisotropy ratio was introduced to classify the anisotropic degrees of the three CJRM models. The anisotropic degrees of the 4P-, 5P- and 6P-CJRM models in the horizontal plane were medium, low and low, respectively.
- (4)
- The anisotropic characteristics of the three CJRM models were described by placing the test results in the polar coordinates. The curves of the 4P- and 5P-CJRM models in the horizontal plane were all an axisymmetric diagram resembling a gyro, which indicated their orthotropy. The curves of the 6P-CJRM were approximately circular, which revealed its quasi-transverse isotropy.
- (5)
- A simple empirical expression was adopted to estimate the strength and deformation of the CJRM, and the derived equations were used in the Baihetan CJRM. The calculated values were all within the ranges of the existing research results, which indicates that the derived empirical equations are valuable for related engineering applications.
For related projects, the deformation and strength characteristics of the CJRM in three-dimensional space can be determined by combining the conclusions of this paper and the research of the mechanical properties of CJRM in the vertical plane. In addition, the empirical equations obtained in this paper can be used to estimate the UCS and elastic modulus of CJRM in the horizontal plane.
Author Contributions
X.Q., Z.Z. and Z.N. contributed to the study conception and design. X.Q., Z.N. and W.L. performed the experiments. The first draft of the manuscript was written by Z.Z. and X.Q. All authors commented on previous versions of the manuscript. All authors have read and agreed to the published version of the manuscript.
Funding
This study was funded by the National Natural Science Foundation of China (Grant Nos. 41831278, 51878249 and 51579081).
Acknowledgments
This study was supported by the National Natural Science Foundation of China (Grant Nos. 41831278, 51878249 and 51579081).
Conflicts of Interest
The authors declare no conflict of interest.
References
- Jiang, Q.; Feng, X.T.; Hatzor, Y.H.; Hao, X.J.; Li, S.J. Mechanical anisotropy of columnar jointed basalts: An example from the Baihetan hydropower station China. Eng. Geol. 2014, 175, 35–45. [Google Scholar] [CrossRef]
- Niu, Z.; Zhu, Z.; Que, X. Constitutive model of stress-dependent seepage in columnar jointed rock mass. Symmetry 2020, 12, 160. [Google Scholar] [CrossRef]
- Chen, M.; Lu, W.B.; Zhang, W.J.; Yan, P.; Zhou, C.B. An analysis of consolidation grouting effect of bedrock based on its acoustic velocity increase. Rock Mech. Rock Eng. 2015, 48, 1259–1274. [Google Scholar] [CrossRef]
- Feng, X.T.; Hao, X.J.; Jiang, Q.; Li, S.J.; Hudson, J.A. Rock cracking indices for improved tunnel support design: A case study for columnar jointed rock masses. Rock Mech. Rock Eng. 2016, 49, 2115–2130. [Google Scholar] [CrossRef]
- Jiang, Q.; Wang, B.; Feng, X.T.; Fan, Q.X.; Wang, Z.L.; Pei, S.F.; Jiang, S. In situ failure investigation and time-dependent damage test for columnar jointed basalt at the Baihetan left dam foundation. Bull. Eng. Geol. Environ. 2018, 78, 3875–3890. [Google Scholar] [CrossRef]
- Zhong, D.N.; Liu, Y.R.; Li, C.; Yang, Q.; Chen, Y.L. Study of unloading relaxation for excavation based on unbalanced force and its application in baihetan arch dam. Rock Mech. Rock Eng. 2020, 52, 1819–1833. [Google Scholar] [CrossRef]
- Chen, B.R.; Li, Q.P.; Feng, X.T.; Xiao, Y.X.; Feng, G.L.; Hu, L.X. Microseismic monitoring of columnar jointed basalt fracture activity: A trial at the Baihetan Hydropower Station China. J. Seismol. 2014, 18, 773–793. [Google Scholar] [CrossRef]
- Hao, X.J.; Feng, X.T.; Yang, C.X.; Jiang, Q.; Li, S.J. Analysis of EDZ development of columnar jointed rock mass in the Baihetan diversion tunnel. Rock Mech. Rock Eng. 2016, 49, 1289–1312. [Google Scholar] [CrossRef]
- Jin, C.Y.; Yang, C.X.; Fang, D.; Xu, S. Study on the failure mechanism of basalts with columnar joints in the unloading process on the basis of an experimental cavity. Rock Mech. Rock Eng. 2015, 48, 1275–1288. [Google Scholar] [CrossRef]
- Lu, W.; Zhu, Z.; Que, X.; Zhang, C.; He, Y. Anisotropic constitutive model of intermittent columnar jointed rock masses based on the cosserat theory. Symmetry 2020, 12, 823. [Google Scholar] [CrossRef]
- Ramamurthy, T.; Arora, V.K. Strength predictions for jointed rocks in confined and unconfined states. Int. J. Rock Mech. Min. Sci. Geomech. Abstr. 1994, 31, 182. [Google Scholar] [CrossRef]
- Tien, Y.M.; Kuo, M.C.; Juang, C.H. An experimental investigation of the failure mechanism of simulated transversely isotropic rocks. Int. J. Rock Mech. Min. Sci. 2006, 43, 1163–1181. [Google Scholar] [CrossRef]
- Li, B.; Jiang, Y.; Mizokami, T.; Ikusada, K.; Mitani, Y. Anisotropic shear behavior of closely jointed rock masses. Int. J. Rock Mech. Min. Sci. 2014, 71, 258–271. [Google Scholar] [CrossRef]
- Moomivand, H. Effects of orientation, frequency, and number of sets of discontinuities on rock strength under triaxial stresses. Arab. J. Geosci. 2014, 7, 5345–5352. [Google Scholar] [CrossRef]
- Xiao, W.M.; Deng, R.G.; Zhong, Z.B.; Fu, X.M.; Wang, C.Y. Experimental study on the mechanical properties of simulated columnar jointed rock masses. J. Geophys. Eng. 2015, 12, 80–89. [Google Scholar] [CrossRef]
- Ji, H.; Zhang, J.C.; Xu, W.Y.; Wang, R.B.; Wang, H.L.; Yan, L.; Lin, Z.N. Experimental investigation of the anisotropic mechanical properties of a columnar jointed rock mass: Observations from laboratory-based physical modelling. Rock Mech. Rock Eng. 2017, 50, 1919–1931. [Google Scholar] [CrossRef]
- Jin, C.Y.; Li, S.G.; Liu, J.P. Anisotropic mechanical behaviors of columnar jointed basalt under compression. Bull. Eng. Geol. Environ. 2018, 77, 317–330. [Google Scholar] [CrossRef]
- Cui, J.; Jiang, Q.; Feng, X.T.; Li, S.J.; Liu, J.F.; Chen, W.F.; Zhang, J.C.; Pei, S.F. Insights into statistical structural characteristics and deformation properties of columnar jointed basalts: Field investigation in the Baihetan dam base, China. Bull. Eng. Geol. Environ. 2017, 77, 775–790. [Google Scholar] [CrossRef]
- Long, P.E.; Wood, B.J. Structures, textures, and cooling histories of Columbia River basalt flows. Geol. Soc. Am. Bull. 1986, 97, 1144–1155. [Google Scholar] [CrossRef]
- Weinberger, R.; Burg, A. Reappraising columnar joints in different rock types and settings. J. Struct. Geol. 2019, 125, 185–194. [Google Scholar] [CrossRef]
- Phillips, J.C.; Humphreys, M.C.S.; Daniels, K.A.; Brown, R.J.; Witham, F. The formation of columnar joints produced by cooling in basalt at Staffa Scotland. Bull. Volcanol. 2013, 75, 1–17. [Google Scholar] [CrossRef]
- Xia, Y.J.; Zhang, C.Q.; Zhou, H.; Chen, J.L.; Gao, Y.; Liu, N.; Chen, P.Z. Structural characteristics of columnar jointed basalt in drainage tunnel of Baihetan hydropower station and its inflfluence on the behavior of P-wave anisotropy. Eng. Geol. 2019, 264, 105304. [Google Scholar] [CrossRef]
- Lin, Z.N.; Xu, W.Y.; Wang, W.; Wang, H.L.; Wang, R.B.; Ji, H.; Zhang, J.C. Determination of strength and deformation properties of columnar jointed rock mass using physical model tests. KSCE J. Civ. Eng. 2018, 22, 3302–3311. [Google Scholar] [CrossRef]
- Que, X.; Zhu, Z.; Lu, W. Anisotropic constitutive model of pentagonal prism columnar jointed rock mass. Bull. Eng. Geol. Environ. 2020, 79, 269–286. [Google Scholar] [CrossRef]
- Yang, Z.Y.; Chen, J.M.; Huang, T.H. Effect of joint sets on the strength and deformation of rock mass models. Int. J. Rock Mech. Min. Sci. 1998, 35, 75–84. [Google Scholar] [CrossRef]
- Sebastian, R.; Sitharam, T.G. Transmission of elastic waves through a frictional boundary. Int. J. Rock Mech. Min. Sci. 2014, 66, 84–90. [Google Scholar] [CrossRef]
- Xia, Z.F. Research on Similar Material Model Test and Numerical Simulation for Columnar Jointed Rock Mass. Master’s Thesis, Northeastern University, Shenyang, China, 2014. [Google Scholar]
- Yan, D.X.; Xu, W.Y.; Wang, W.; Shi, C.; Shi, A.C.; Wu, G.Y. Research of size effect on equivalent elastic modulus of columnar jointed rock mass. Chin. J. Geotech. Eng. 2012, 34, 243–250. [Google Scholar]
- Ni, H.J.; Xu, W.Y.; Shi, A.C.; Xu, J.R.; Ji, H. Scale effect on equivalent continuum elastic modulus of columnar jointed rock masses by distinct element method. Eng. Mech. 2015, 32, 90–96. [Google Scholar]
- Singh, J.; Ramamurthy, T.; Venkatappa, R.G. Strength anisotropies in rocks. Ind. Geotech. J. 1989, 19, 147–166. [Google Scholar]
- Ramamurthy, T. Strength and modulus responses of anisotropic rocks. In Comprehensive Rock Engineering; Pergamon: Oxford, UK, 1993; Volume 1, pp. 337–349. [Google Scholar]
- Zheng, W.T. Rock Mechanics of Irregular Columnar Jointed Basaltic Mass and Its Application in High Slope and Dam Foundation. Ph.D. Thesis, Hohai University, Nanjing, China, 2008. [Google Scholar]


© 2020 by the authors. Licensee MDPI, Basel, Switzerland. This article is an open access article distributed under the terms and conditions of the Creative Commons Attribution (CC BY) license (http://creativecommons.org/licenses/by/4.0/).