Article

Two-Dimensional Numerical Model for Stability Analysis of Tunnel Face Based on Particle Flow Code

1
School of Civil Engineering, Beijing Jiaotong University, Beijing 100044, China
2
College of Civil and Transportation Engineering, Shenzhen University, Shenzhen 518060, China
3
Underground Polis Academy, Shenzhen University, Shenzhen 518060, China
*
Author to whom correspondence should be addressed.
Symmetry 2021, 13(1), 94; https://doi.org/10.3390/sym13010094
Submission received: 1 December 2020 / Revised: 20 December 2020 / Accepted: 28 December 2020 / Published: 7 January 2021

Abstract

:
In this paper, numerical simulations of face stability of shallow tunnels are carried out by using the particle discrete element codes PFC2D from the microscopic view. Progressive instability of the tunnel face is achieved through the withdrawal of the baffle used to simulate the tunnel face. Under different retreating displacement of the tunnel face, the evolution laws of support pressure on the tunnel face, the ground deformation, ground surface settlement and contact force chain in front of the tunnel face are studied. The results show that with the withdrawal of the tunnel face, the support pressure on the tunnel face can be divided into four stages, namely, the rapid decline stage, the minimum stage, the slow rising stage, and the horizontal stability stage. Moreover, based on the simulation results of the particle contact force chain, discriminated methods of failure zones are proposed. The research results obtained from this paper will provide theoretical support for the reasonable value of support pressure of a tunnel face in practical engineering.

1. Introduction

The rapid expansion of urban development has highlighted the shortage of land resources, traffic congestion and environmental degradation. Making full use of urban underground space resources and realizing three-dimensional development of urban space can effectively improve the comprehensive carrying capacity of cities. At present, there are still many major scientific problems and technical bottlenecks to be solved in large-scale utilization of urban underground space. A shield tunneling machine is a kind of special mechanical equipment for excavation and support when constructing subway tunnels and other underground works in water-bearing strata and soft surrounding rock. The instability mode of surrounding rocks and the limit support pressure on the tunnel face are the main contents of stability analysis of the tunnel face [1,2,3,4].
Because of the complexity of geotechnical problems, the model test method can only understand the local finite geotechnical mechanical behavior, and the numerical analysis method has become an important means of geotechnical mechanics research. Numerical simulation can simulate many complex stratigraphic environments. With the development of computer technology, many scholars have carried out numerical simulation work in the study of the stability of a shield tunnel excavation surface, and have achieved remarkable results. Buhan [5] established a three-dimensional finite element model of the tunnel face of an earth pressure balance shield tunnel. Considering the action of permeability force on the tunnel face, it was found that the stability safety factor of the excavated surface was only related to the ratio of horizontal and vertical permeability coefficient. Vermeer et al. [6] used the finite element software Plaxis3D to study the stability of a shield tunnel face and pointed out that the limit support pressure of the tunnel face was only related to the friction angle and cohesion. Changes of the parameters of the initial side pressure coefficient, elastic modulus, Poisson’s ratio and shear expansion angle of the soil layer in the model would only affect the deformation of the soil. Kamata and Masimo [7] developed a two-dimensional block particle Discrete Element Method (DEM) program to study the stability of the tunnel surface and pointed out that when the particles of the tunnel face are stripped, it can be considered as a sign of the instability of the excavated surface. Chen et al. [8] simulated the damage of the excavation surface by using discrete element software PFC3D. It was pointed out that the damage to an excavation surface can be divided into two stages: in the first stage, the supporting force decreases rapidly to the limit support force with the increase of horizontal displacement. To study the stability of an open surface of circular shallow buried tunnel, Dias et al. [9] used the numerical simulation method to calculate the support pressure in the active and passive failure modes of the tunnel surface.
There are many kinds of numerical analysis method. According to numerical analysis methods based on continuous or discontinuous media, they can be roughly divided into the following three categories: numerical simulation methods based on continuous medium (e.g., finite element method, finite difference method, boundary element method, etc.); numerical simulation methods based on discontinuous medium (e.g., Particle Flow Code PFC, Universal Distinct Element Code UDEC, etc.); and numerical simulation methods based on a continuous medium and discontinuous medium synchronously (e.g., discontinuous deformation analysis method and numerical manifold method). All kinds of numerical analysis method have their advantages and disadvantages when analyzing specific problems. The numerical simulation method based on continuous media is relatively mature, the calculation speed is fast, and the parameters of the calculation model are directly set by macroscopic material parameters. The advantage of the numerical simulation method based on discontinuous media is that the change and destruction of materials can be studied from the microscopic perspective, however the relationship between the macroscopic parameters and the microscopic parameters is difficult to calibrate. The numerical simulation method that is based on continuous medium and discontinuous medium synchronously adopts the continuous medium theory before the failure of the material, and the discontinuous medium theory after the failure of the material to better study the contact relationship of fractures and other phenomena. Although the last kind of numerical analysis method is a frontier subject, the calculation speed and the analysis theory more in line with the reality of the material still need further study. The particles’ discrete element codes PFC2D are based on meso-discontinuous mechanics and is suitable for solving the problem of the fracture and destruction [10,11,12,13,14,15]. In this paper, numerical simulation analyses of face stability of shallow tunnels are carried out by using the particles’ discrete element codes PFC2D from the microscopic view. First, the evolution laws of the support pressure on a tunnel face and corresponding progressive instability modes of sands at a tunnel face are investigated. Then, the ground deformation and contact force chain in front of the tunnel face are studied.

2. Numerical Model and Procedure

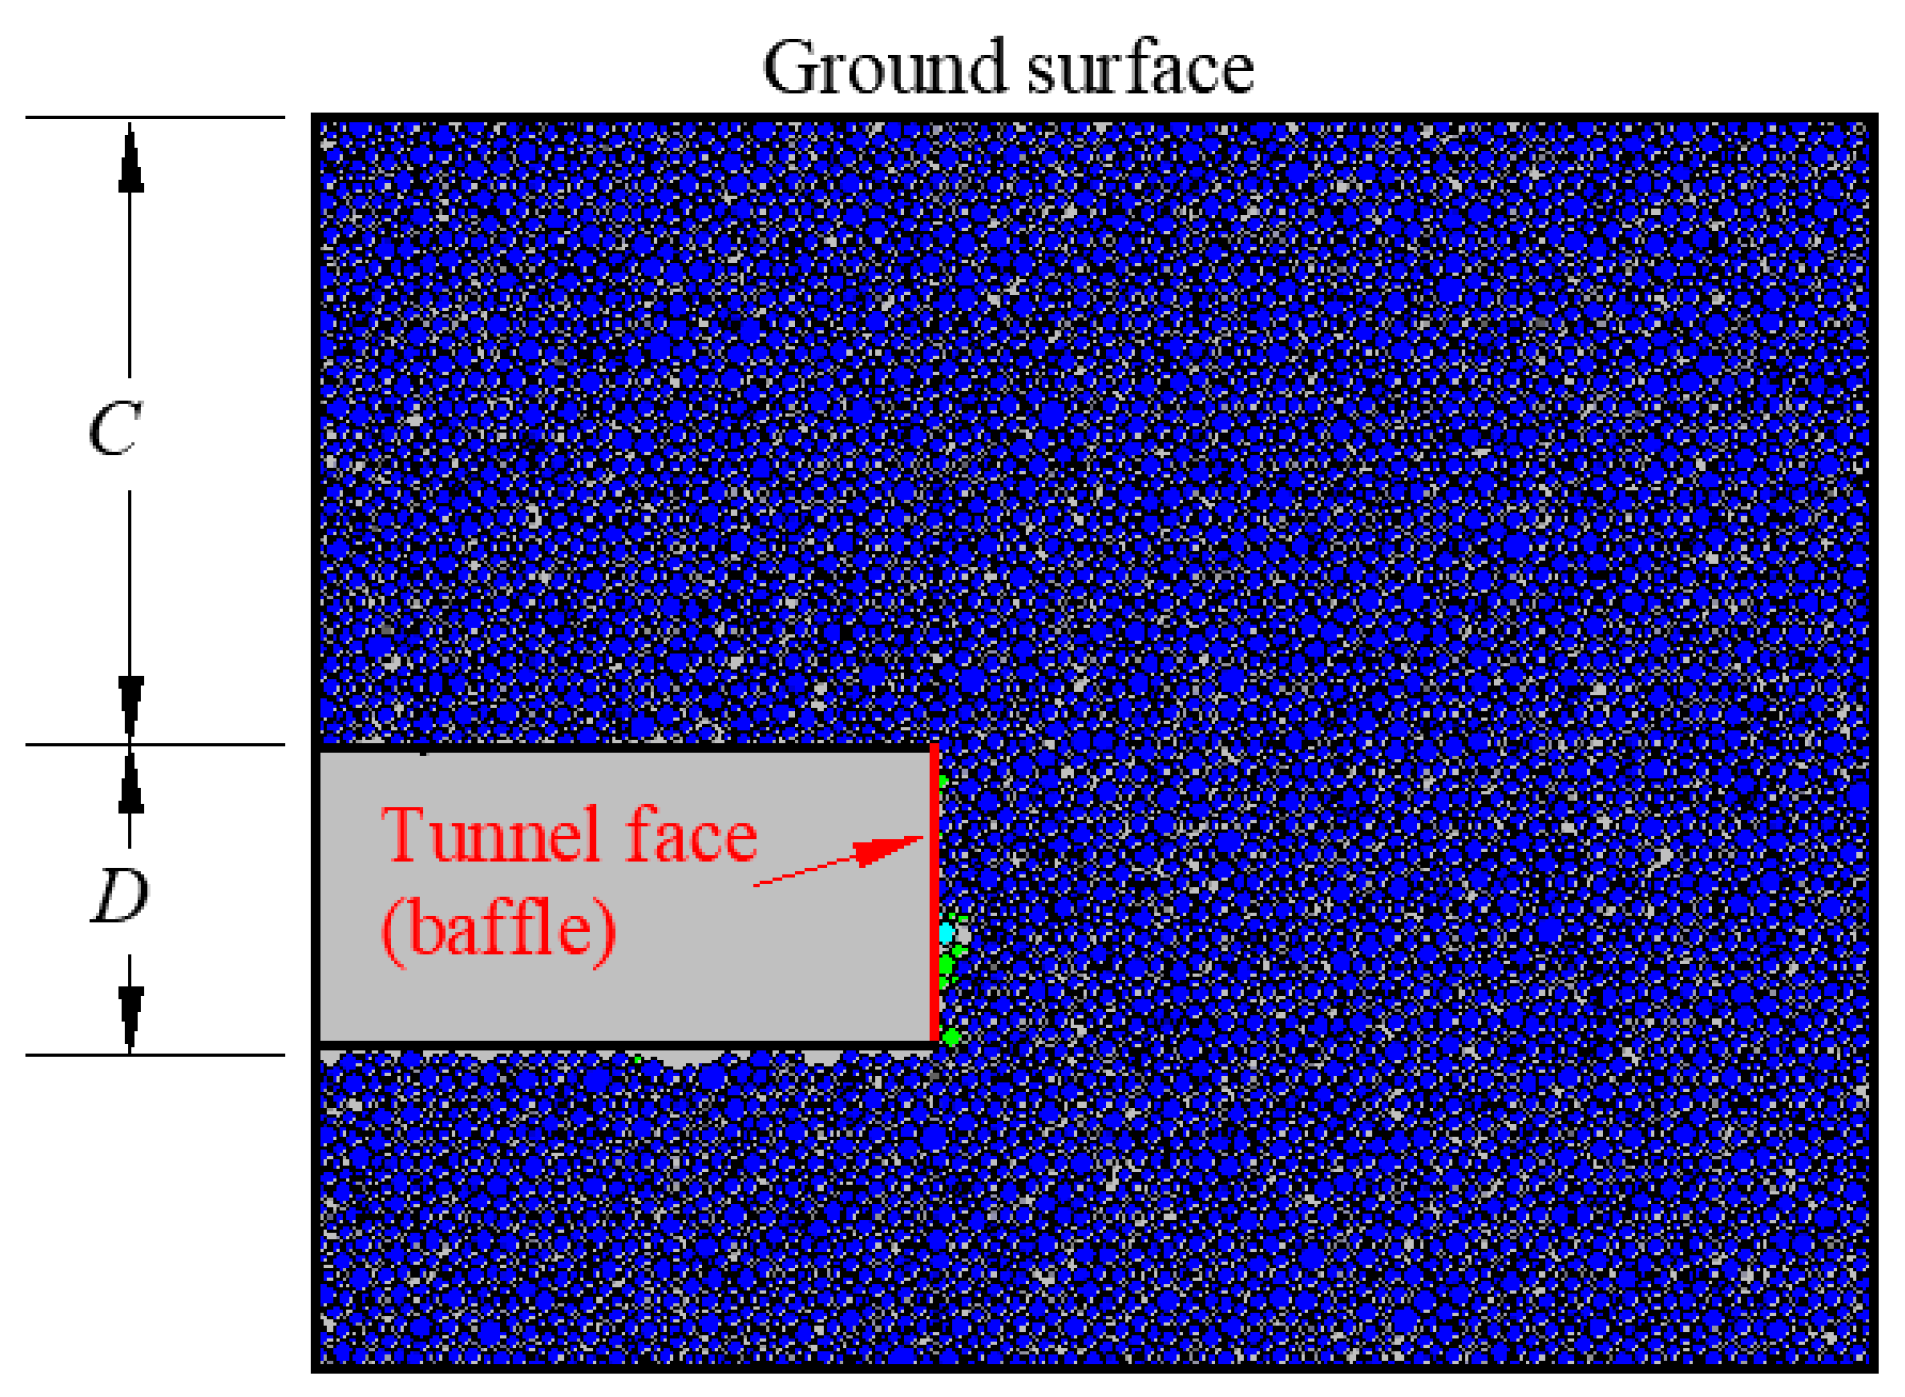
2.1. Dimensions of the Numerical Model

The dimensions of the numerical simulation model based on the particles’ discrete element codes PFC2D are as follows: the length of the model is 30 m, the diameter of the tunnel D is equal to the outer diameter of the cutter plate of 6 m, the depth of the stratum below the tunnel bottom is 6 m, and the depth of the overlying stratum C is 12 m, as rendered in Figure 1.

2.2. Numerical Procedure

The numerical simulation analysis was divided into the following steps:
  • Through the biaxial test of the sample, the parameters were calibrated and the microscopic parameters used in the numerical simulation are obtained;
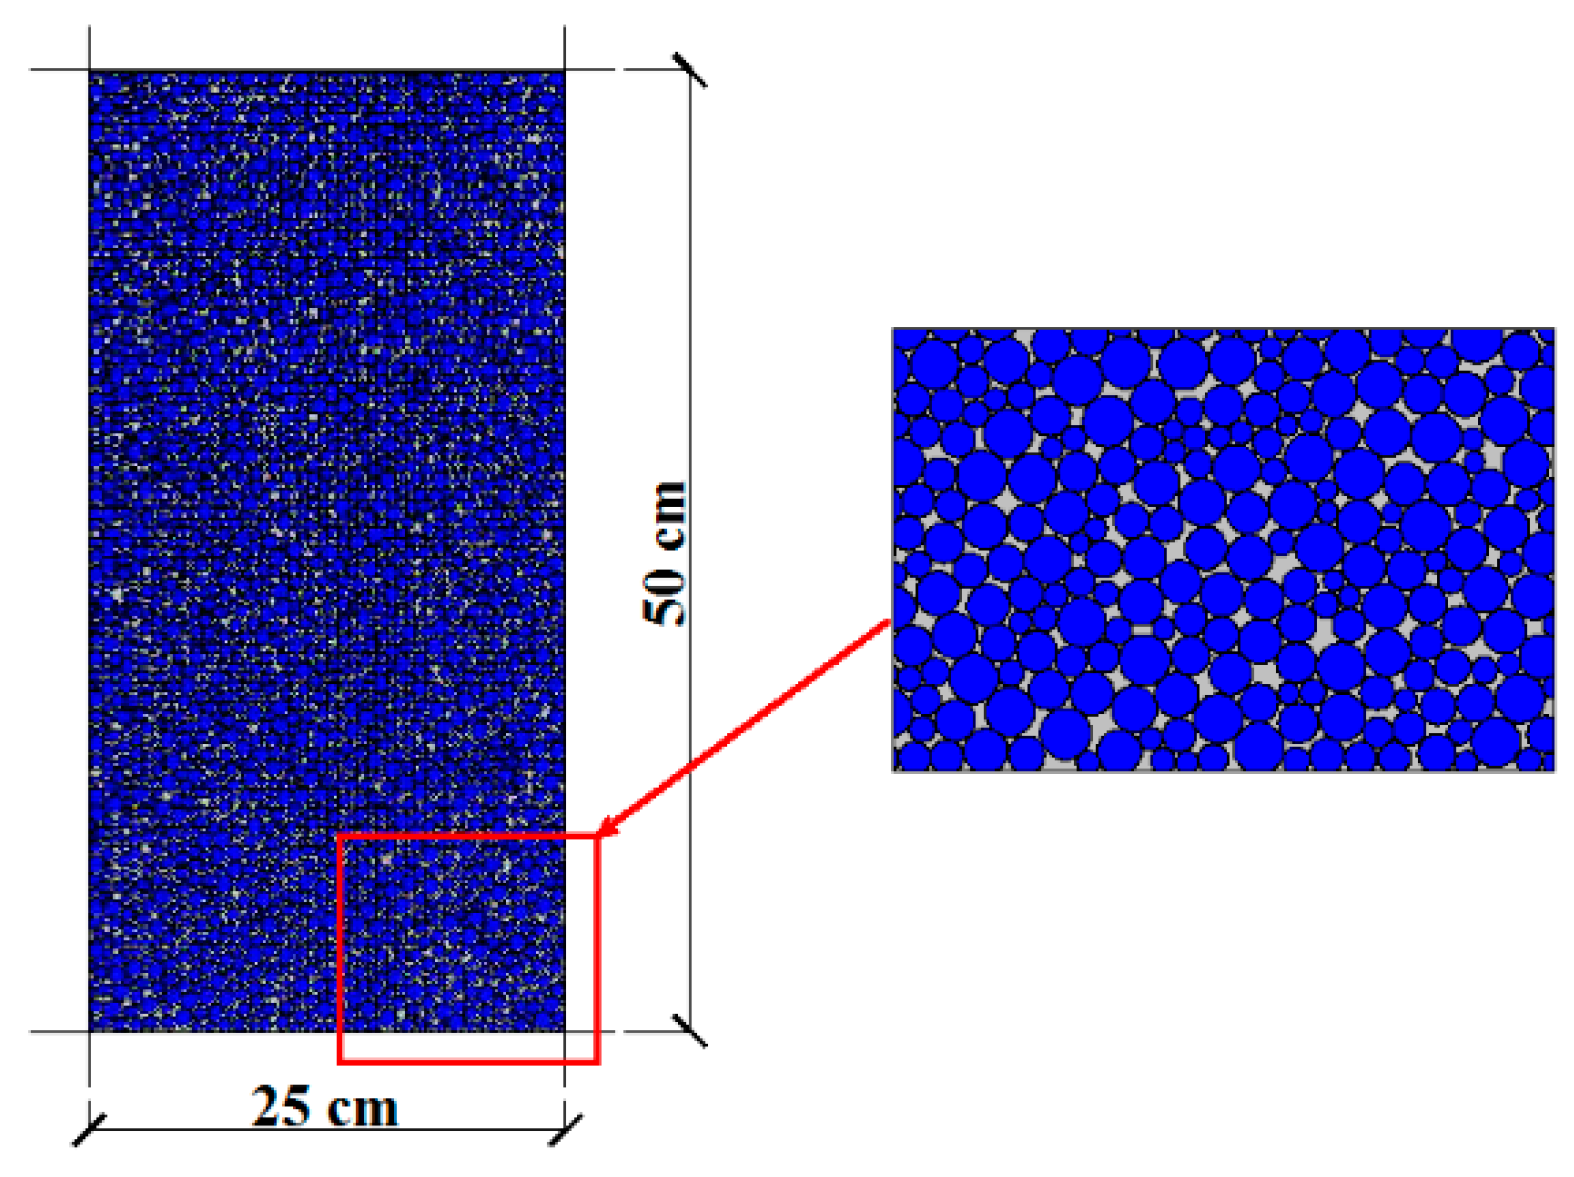
  • The boundary of the model wall was formed, and the aggregate of the particles was formed by using the radius expansion method according to the particle gradation and the particle pore ratio. The first stable equilibrium state was achieved by applying gravity to the model. Then the soil particle were given the friction coefficient and the connection strength to reach the second stable state under the gravity stress field.
  • The instability failure of tunnel face was investigated according to the method of displacement control, and the parameters of lining were given after parameter calibration. The lining adopted the parallel connection model, and the specific parameters are shown in Table 1.
  • Progressive instability of the tunnel face was achieved through the withdrawal of the baffle used to simulate the tunnel face. Retreating displacement of the tunnel face was denoted by δ. The monitoring points and measuring rings were arranged. After the retaining wall and supporting force were added to the model, the modeling process of all models was completed, and then the calculation was carried out through the set time step.
  • In the post-processing stage, data extraction was conducted to investigate the evolution laws of the contact force chain, particle displacement and ground surface settlement.

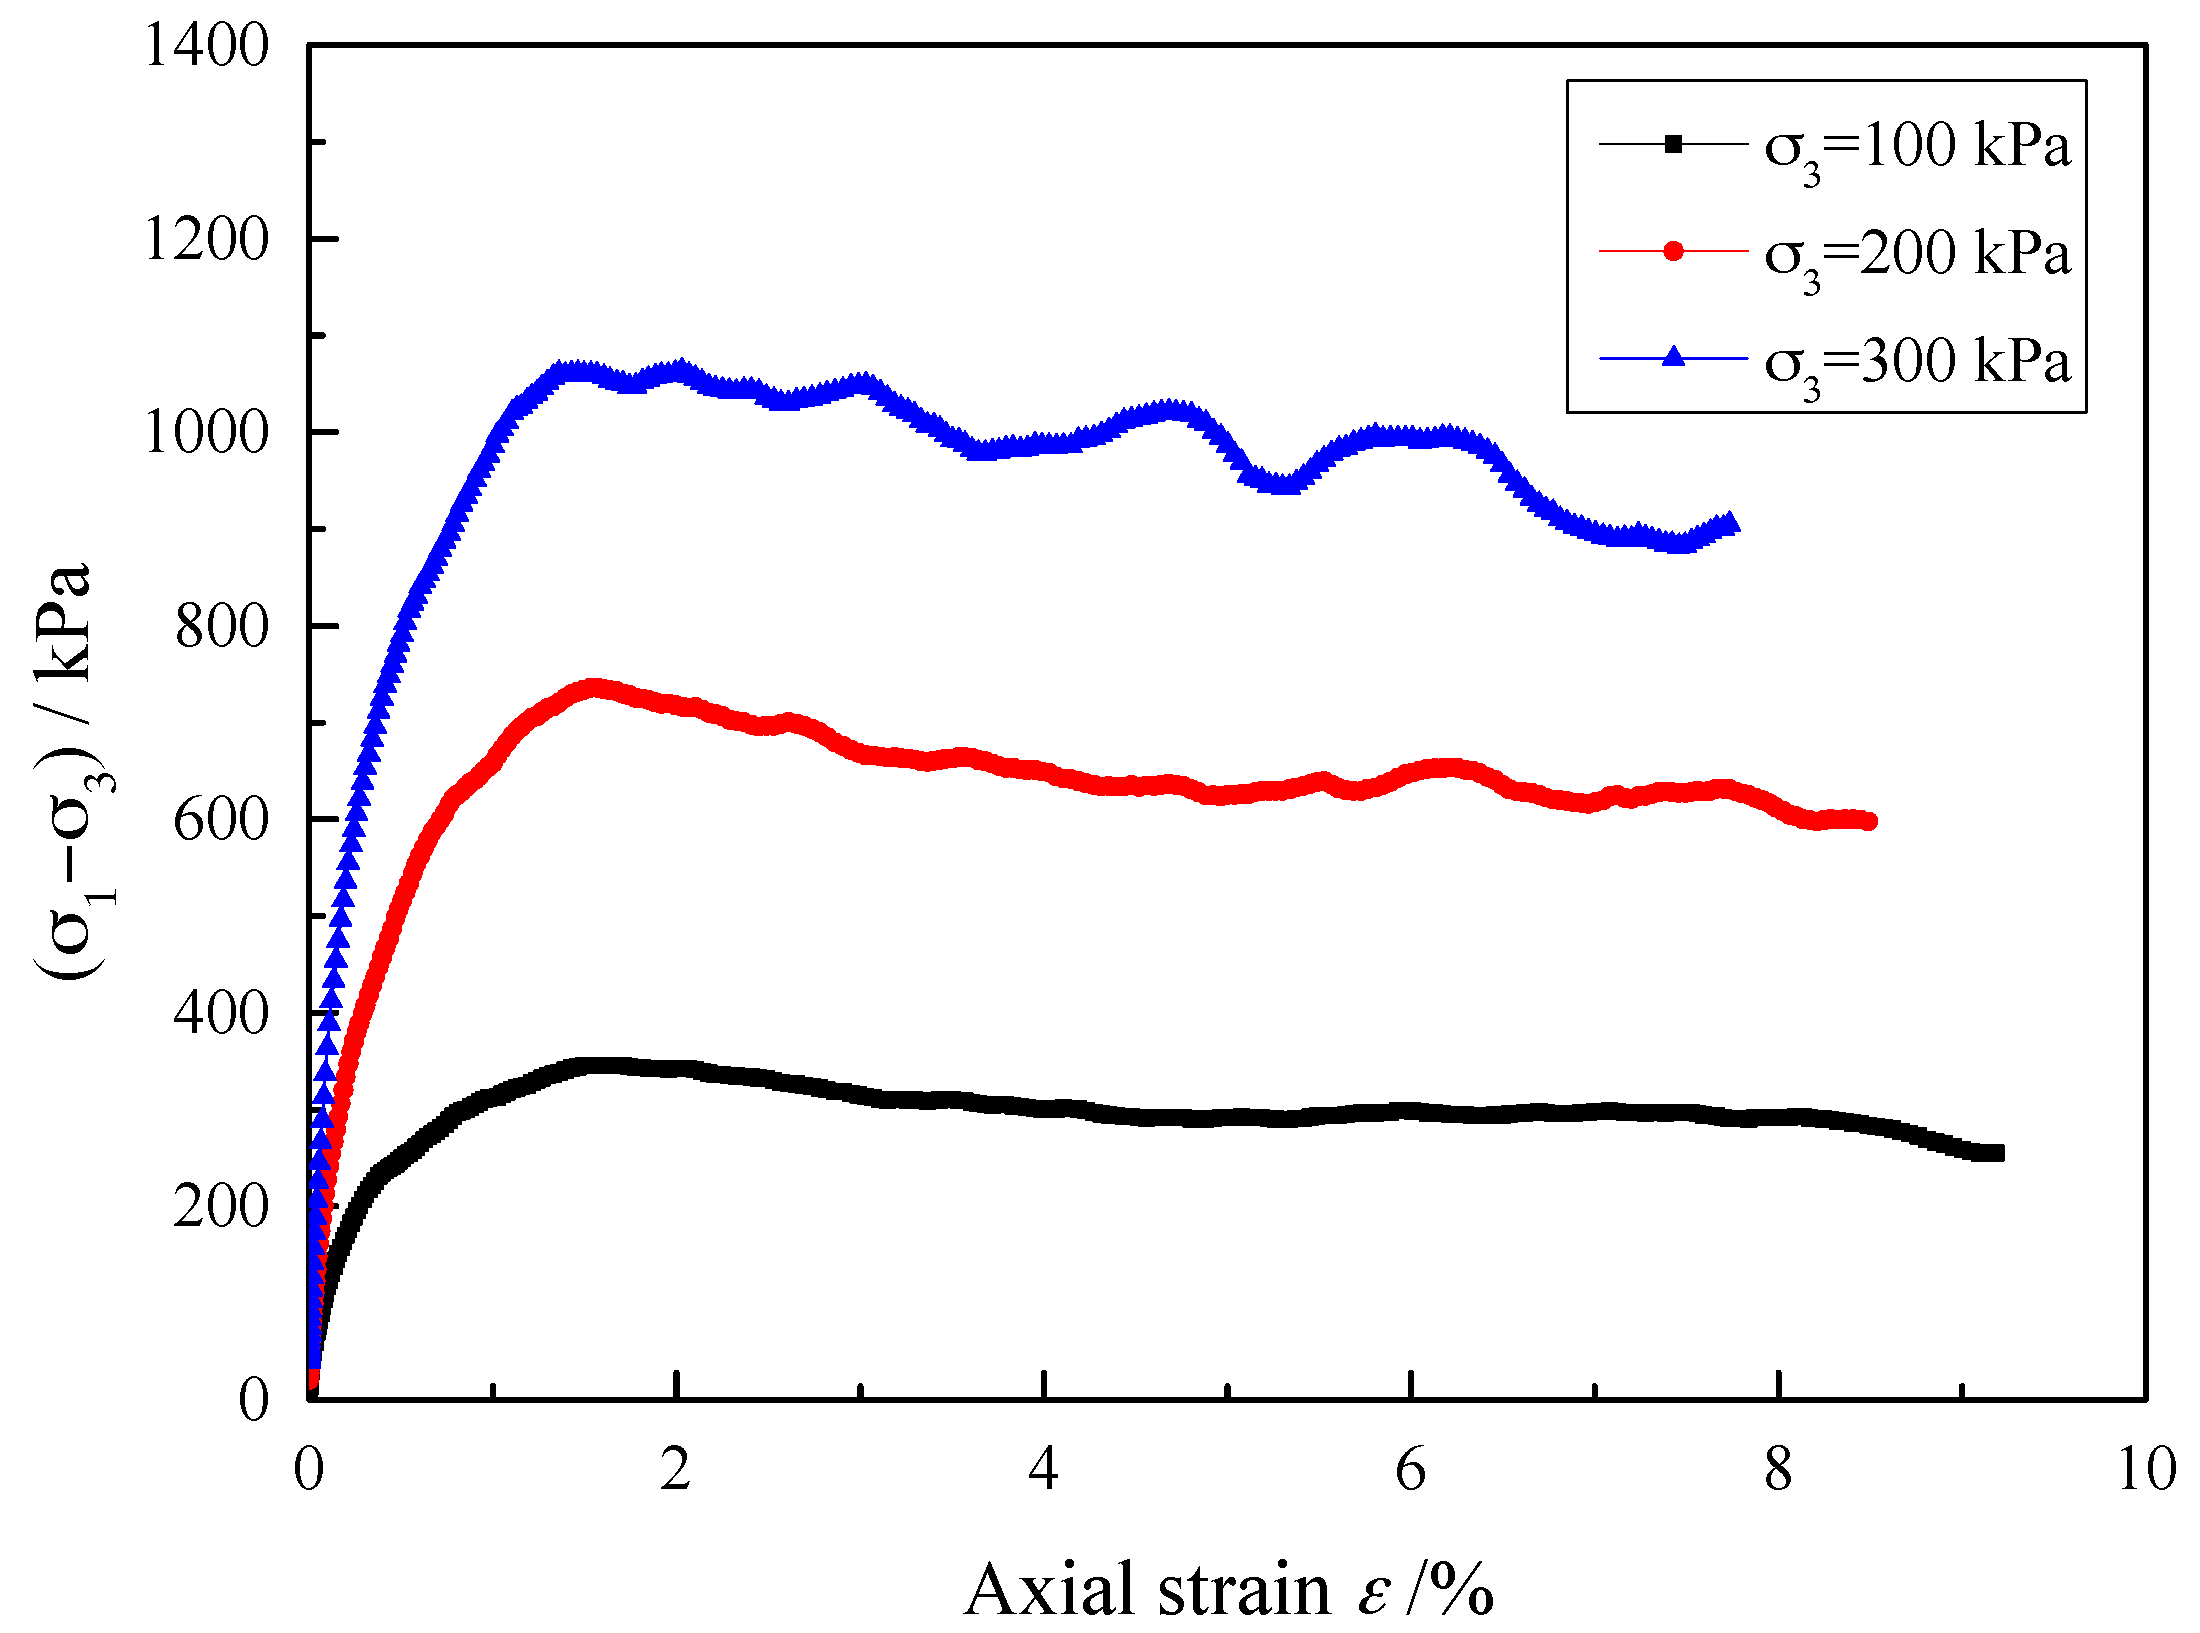
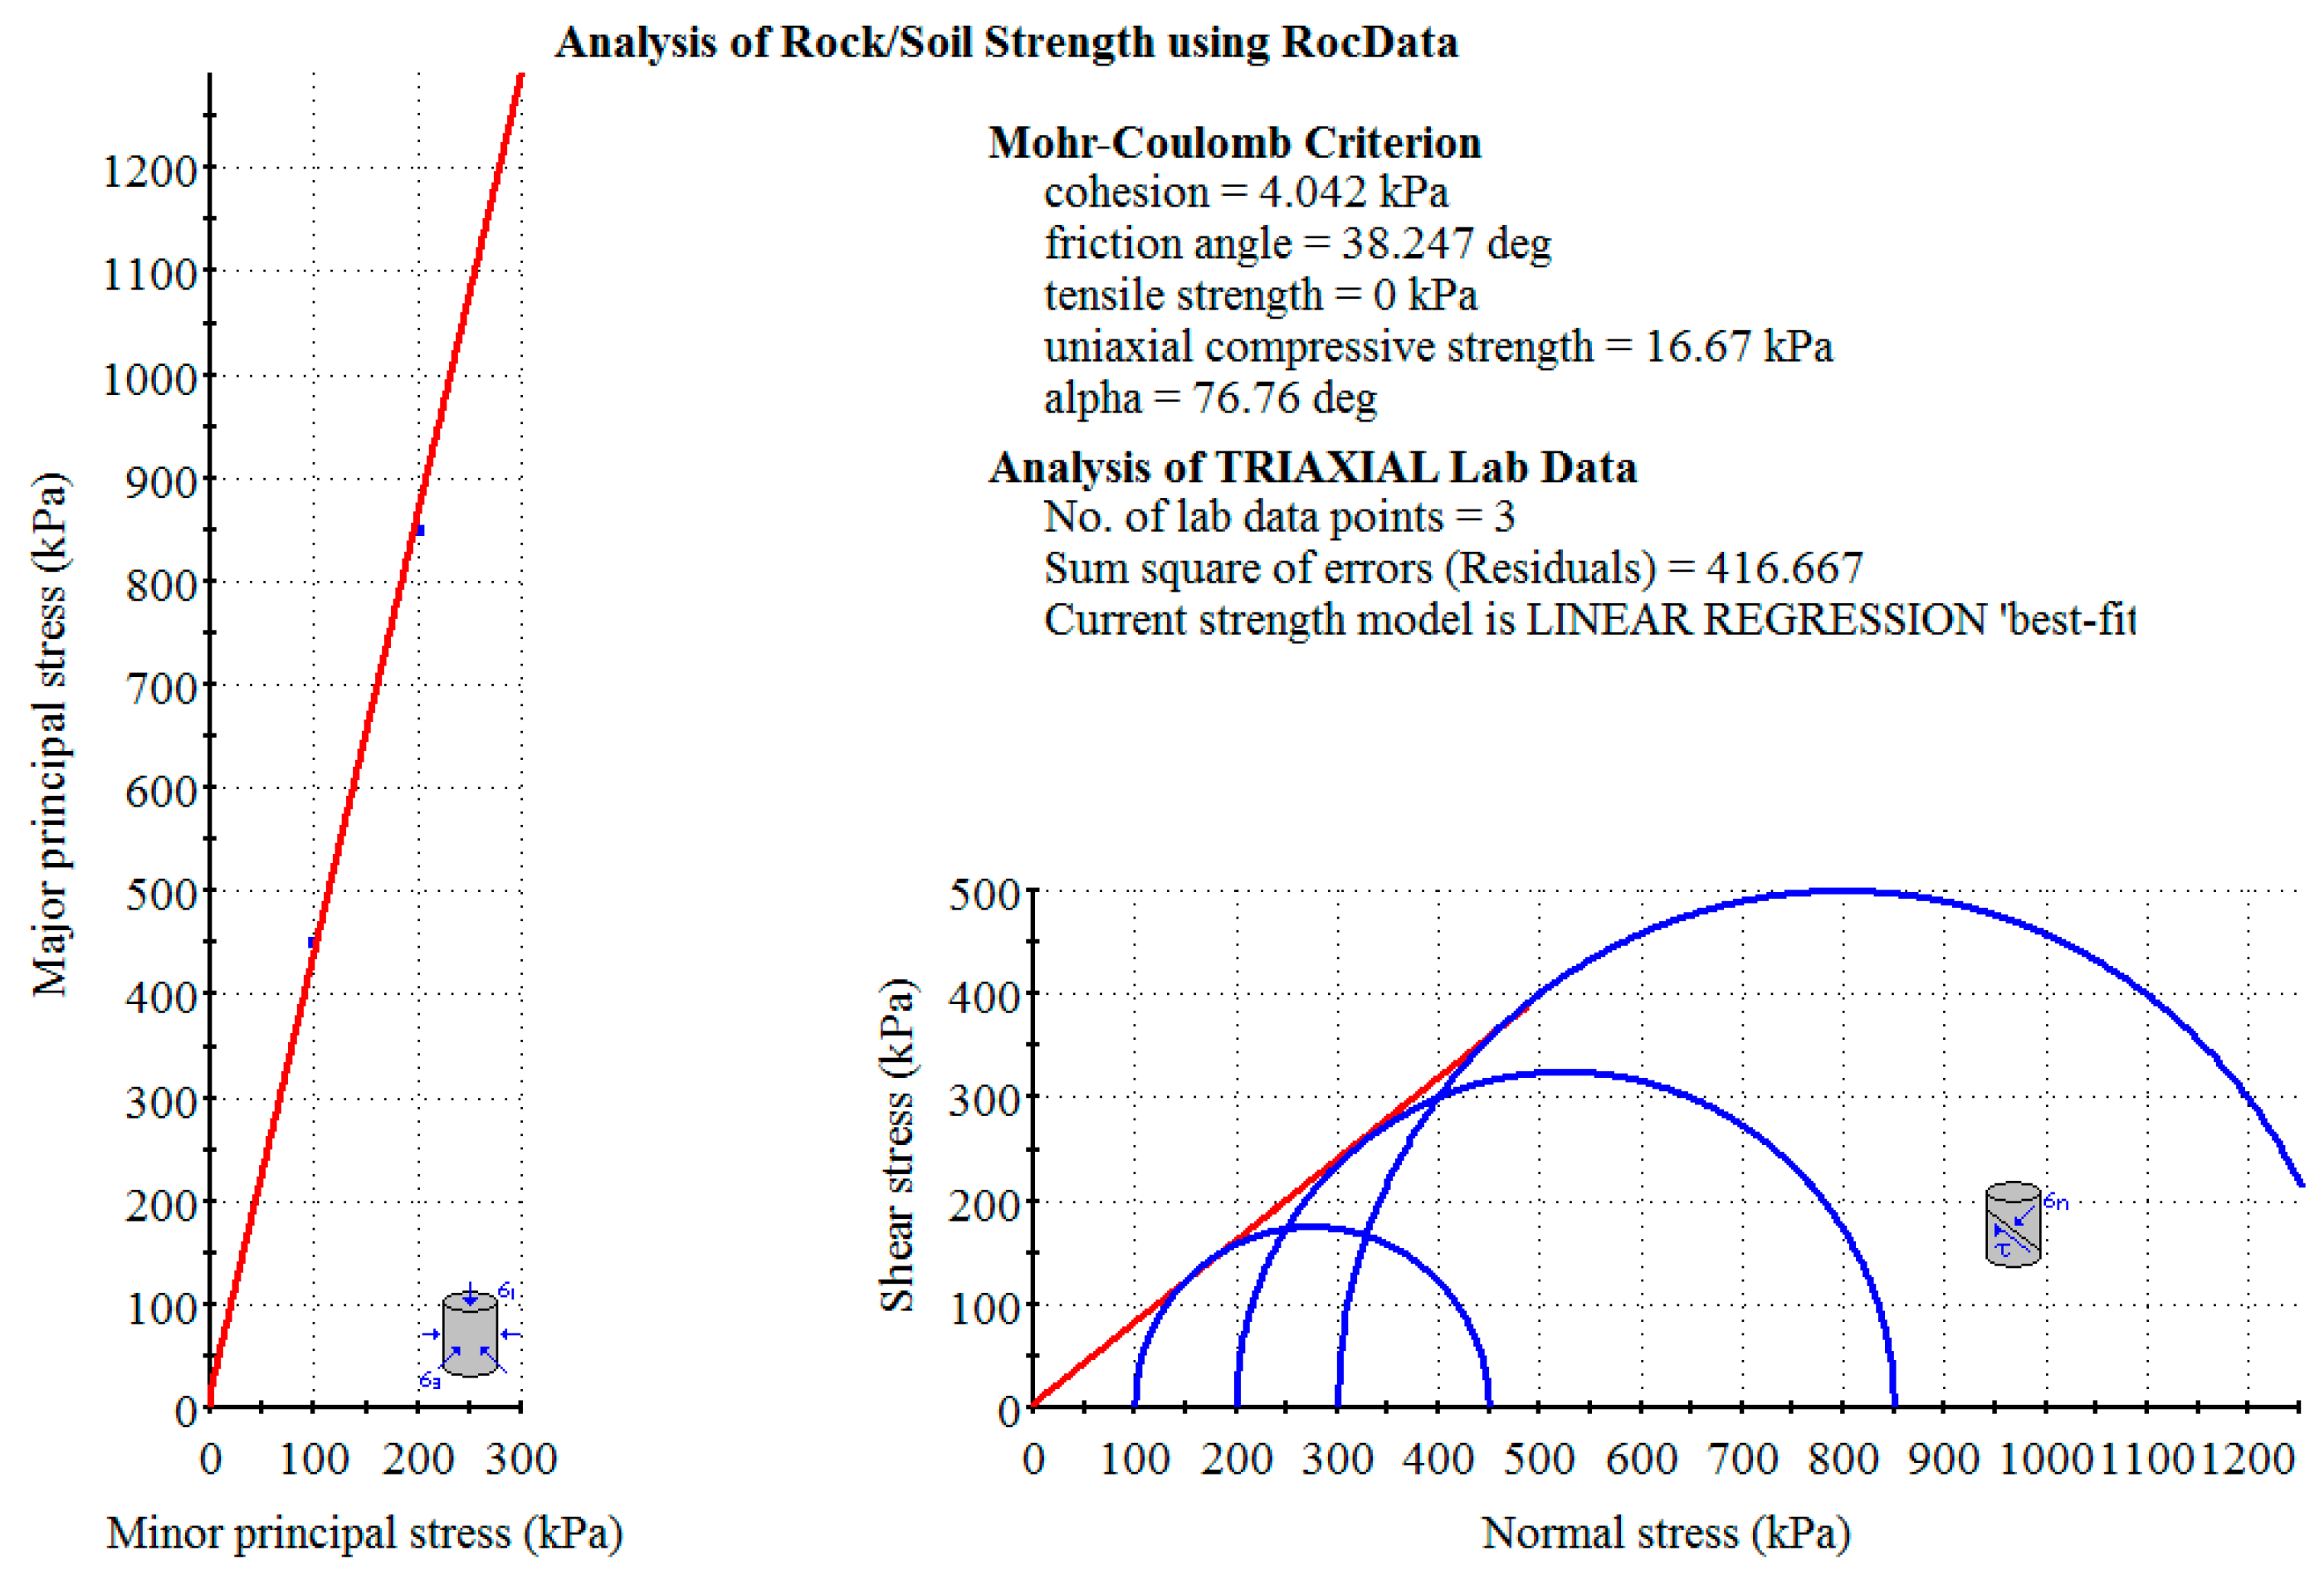
2.3. Parameter Calibration

Figure 2 shows the particle samples for parameter calibration used in the biaxial test. The macroscopic parameters of the targeted sand materials are: cohesive force c = 0 kPa and, the internal friction angle φ = 37.5°. The microscopic parameters of particles used in parameter calibration is rendered in Table 2. Three groups of biaxial tests with different confining pressures were carried out (σ3 = 100 kPa, 200 kPa and 300 kPa). The data of the axial stress–strain curve under different confining pressures was recorded as shown in Figure 3.
Figure 4 indicates the Mohr stress circle and envelope according to the results obtained from Figure 3. The macroscopic parameters of samples are: cohesive force c = 4.042 kPa and, the internal friction angle φ = 38.247°, which can be approximately representative of targeted sand materials.

3. Numerical Results and Analyses

3.1. Analysis of Limit Support Pressure

Figure 5 shows the relationship curve between the normalized tunnel face support pressure and the retreating displacement of the tunnel face. When the tunnel face is not retreating, the support pressure on the tunnel face is the initial earth pressure of the formation. With the withdrawal of the tunnel face, the change process of the support pressure of the tunnel face can be divided into four stages:
  • The first stage (rapid decline stage). When the tunnel face is retreating slightly, the support pressure on the tunnel face will decrease rapidly, and the curve of the support pressure and the displacement of the excavated surface is close to linear.
  • The second stage (minimum stage). As the tunnel face continues to retreat, the downward trend of the support pressure on the tunnel face gradually slows down, and the support pressure gradually reaches the minimum value, which is called the limit value p.
  • The third stage (slow rising stage). As the tunnel face continues to withdraw, the support pressure on tunnel face slowly rises.
  • The fourth stage (horizontal stability stage). The loose zone continues to develop to the surface and eventually forms the penetrating surface. The support pressure on the tunnel face remains unchanged.
Figure 5. Relationship curve between the normalized tunnel face support pressure and the retreating displacement of the tunnel face (C/D = 2.0).
Symmetry 13 00094 g005

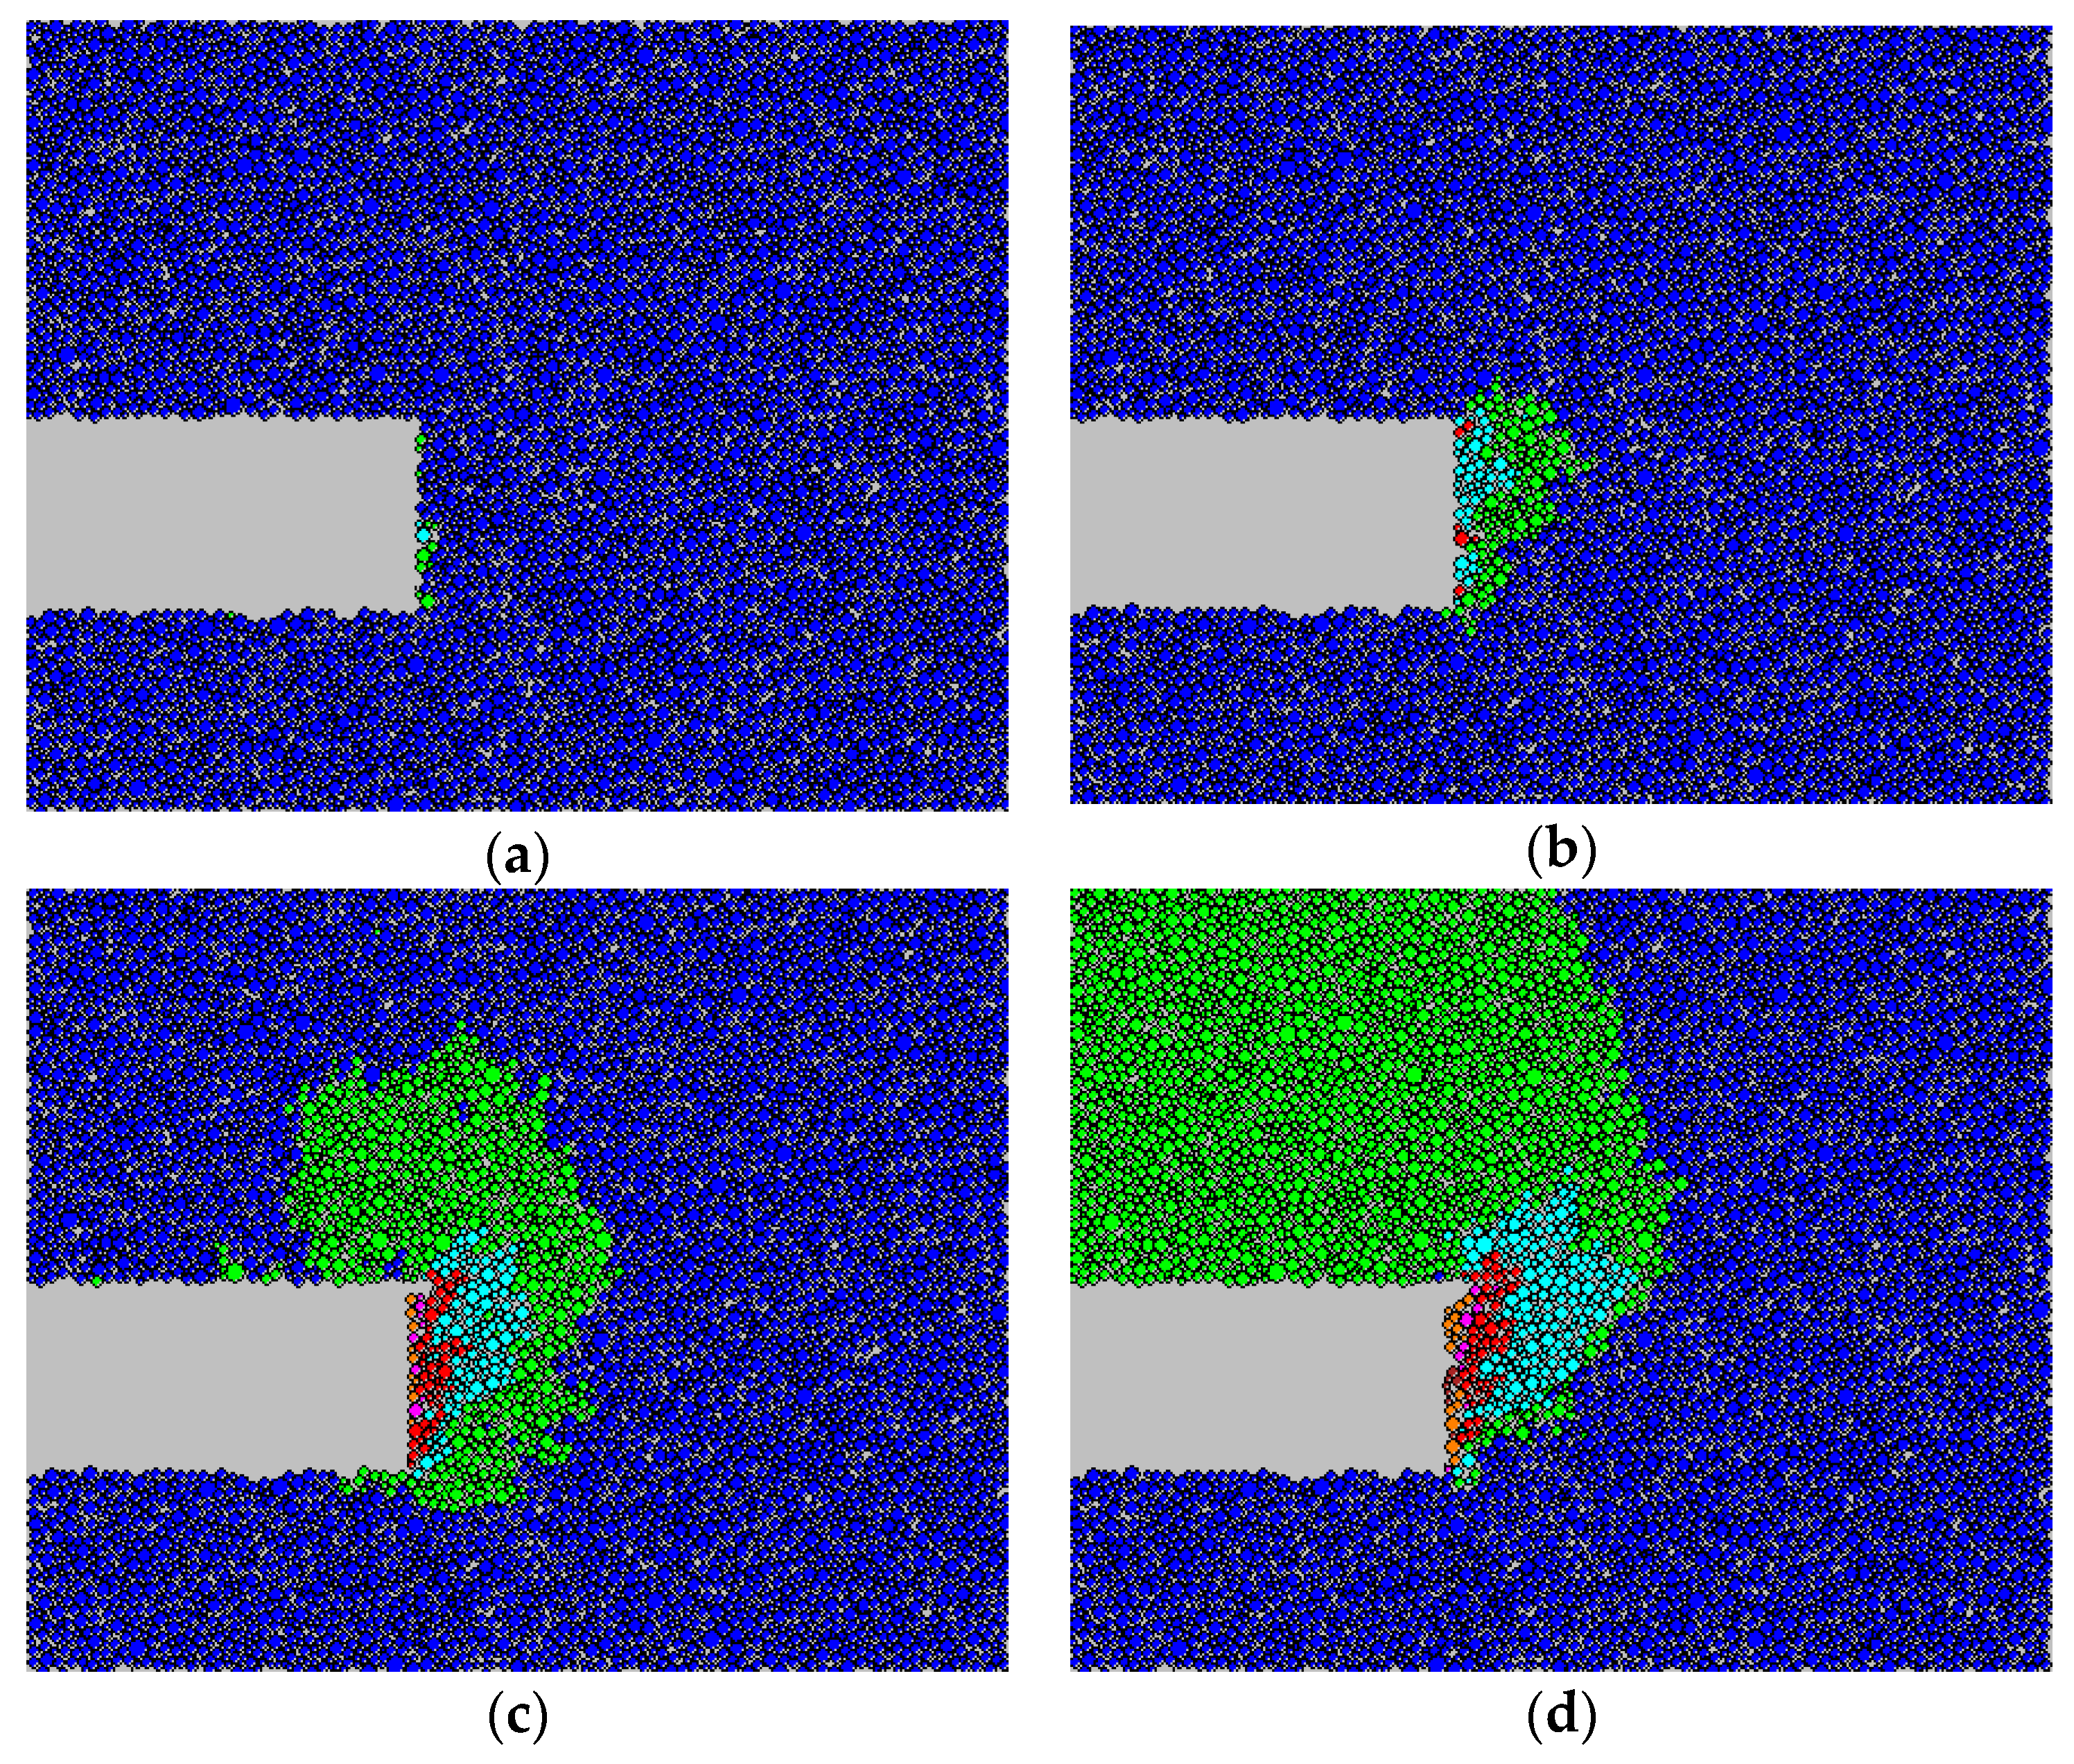
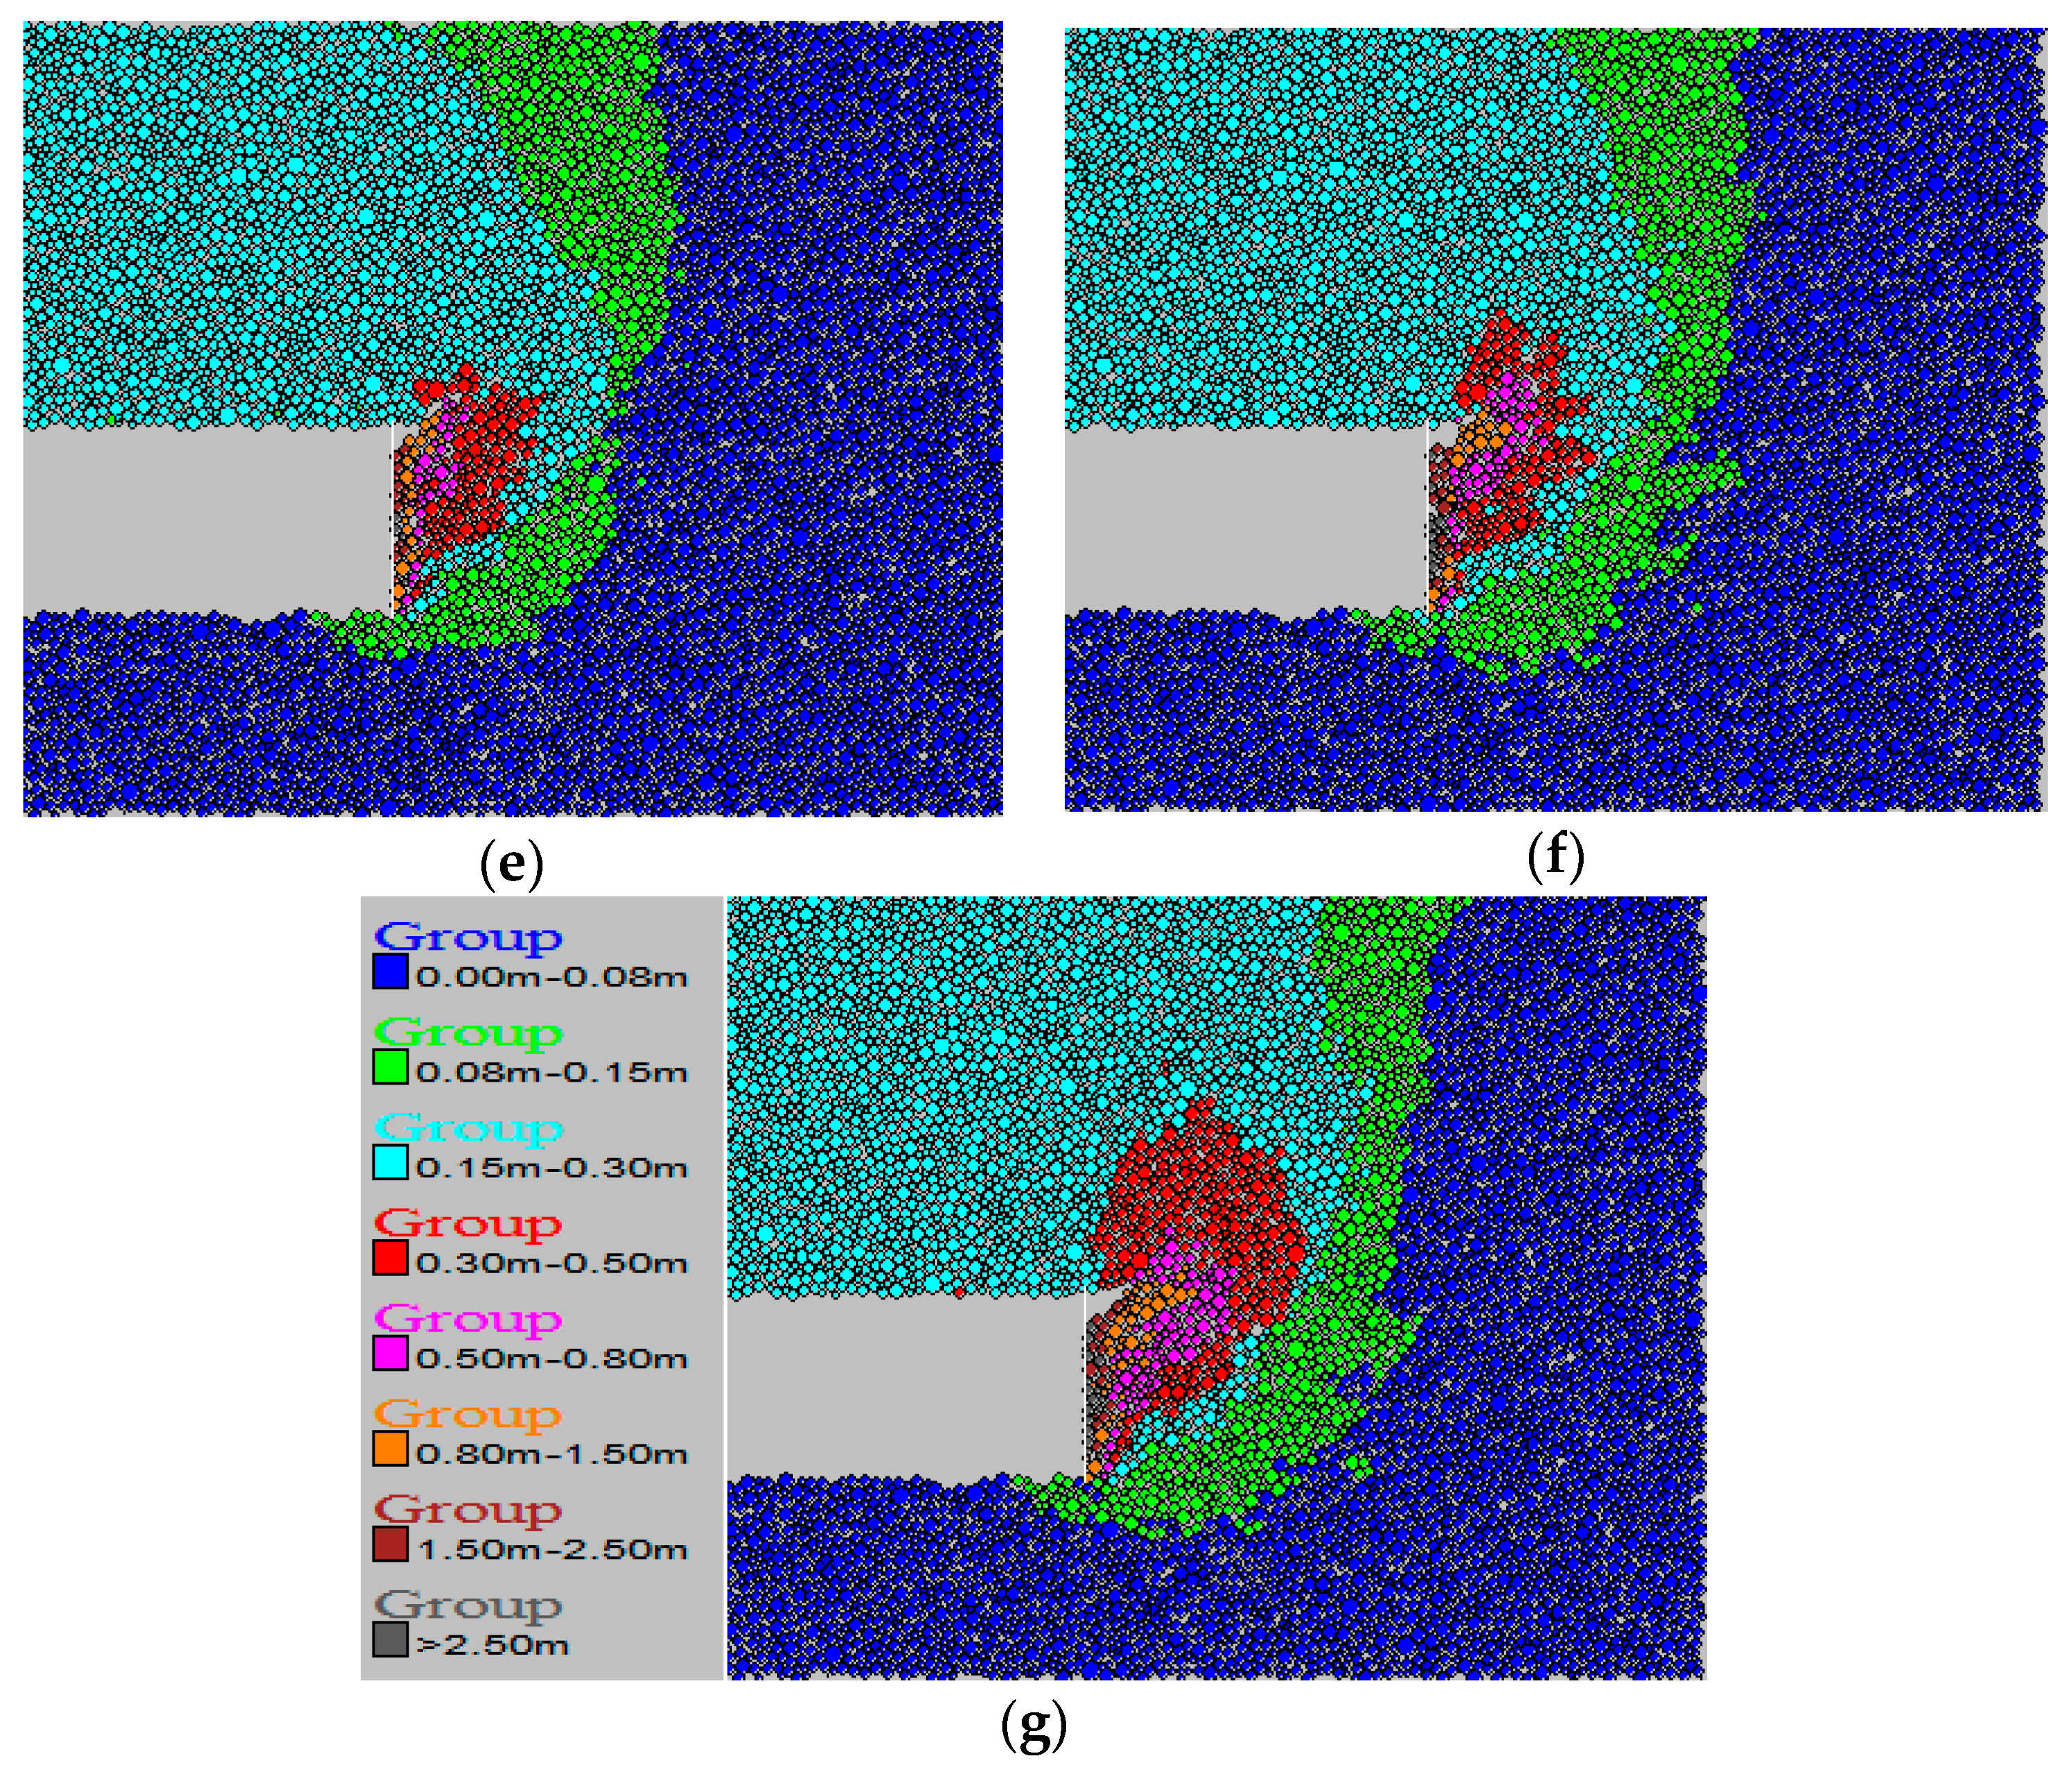
3.2. Analysis of Displacement of the Particles

The development and evolution of particle displacement are shown in Figure 6. When the displacement of the tunnel face grows gradually, the displacement and the range of particle grow gradually. As the simulation continues to increase the tunnel face displacement, the range of stratum disturbance extends to the ground surface.

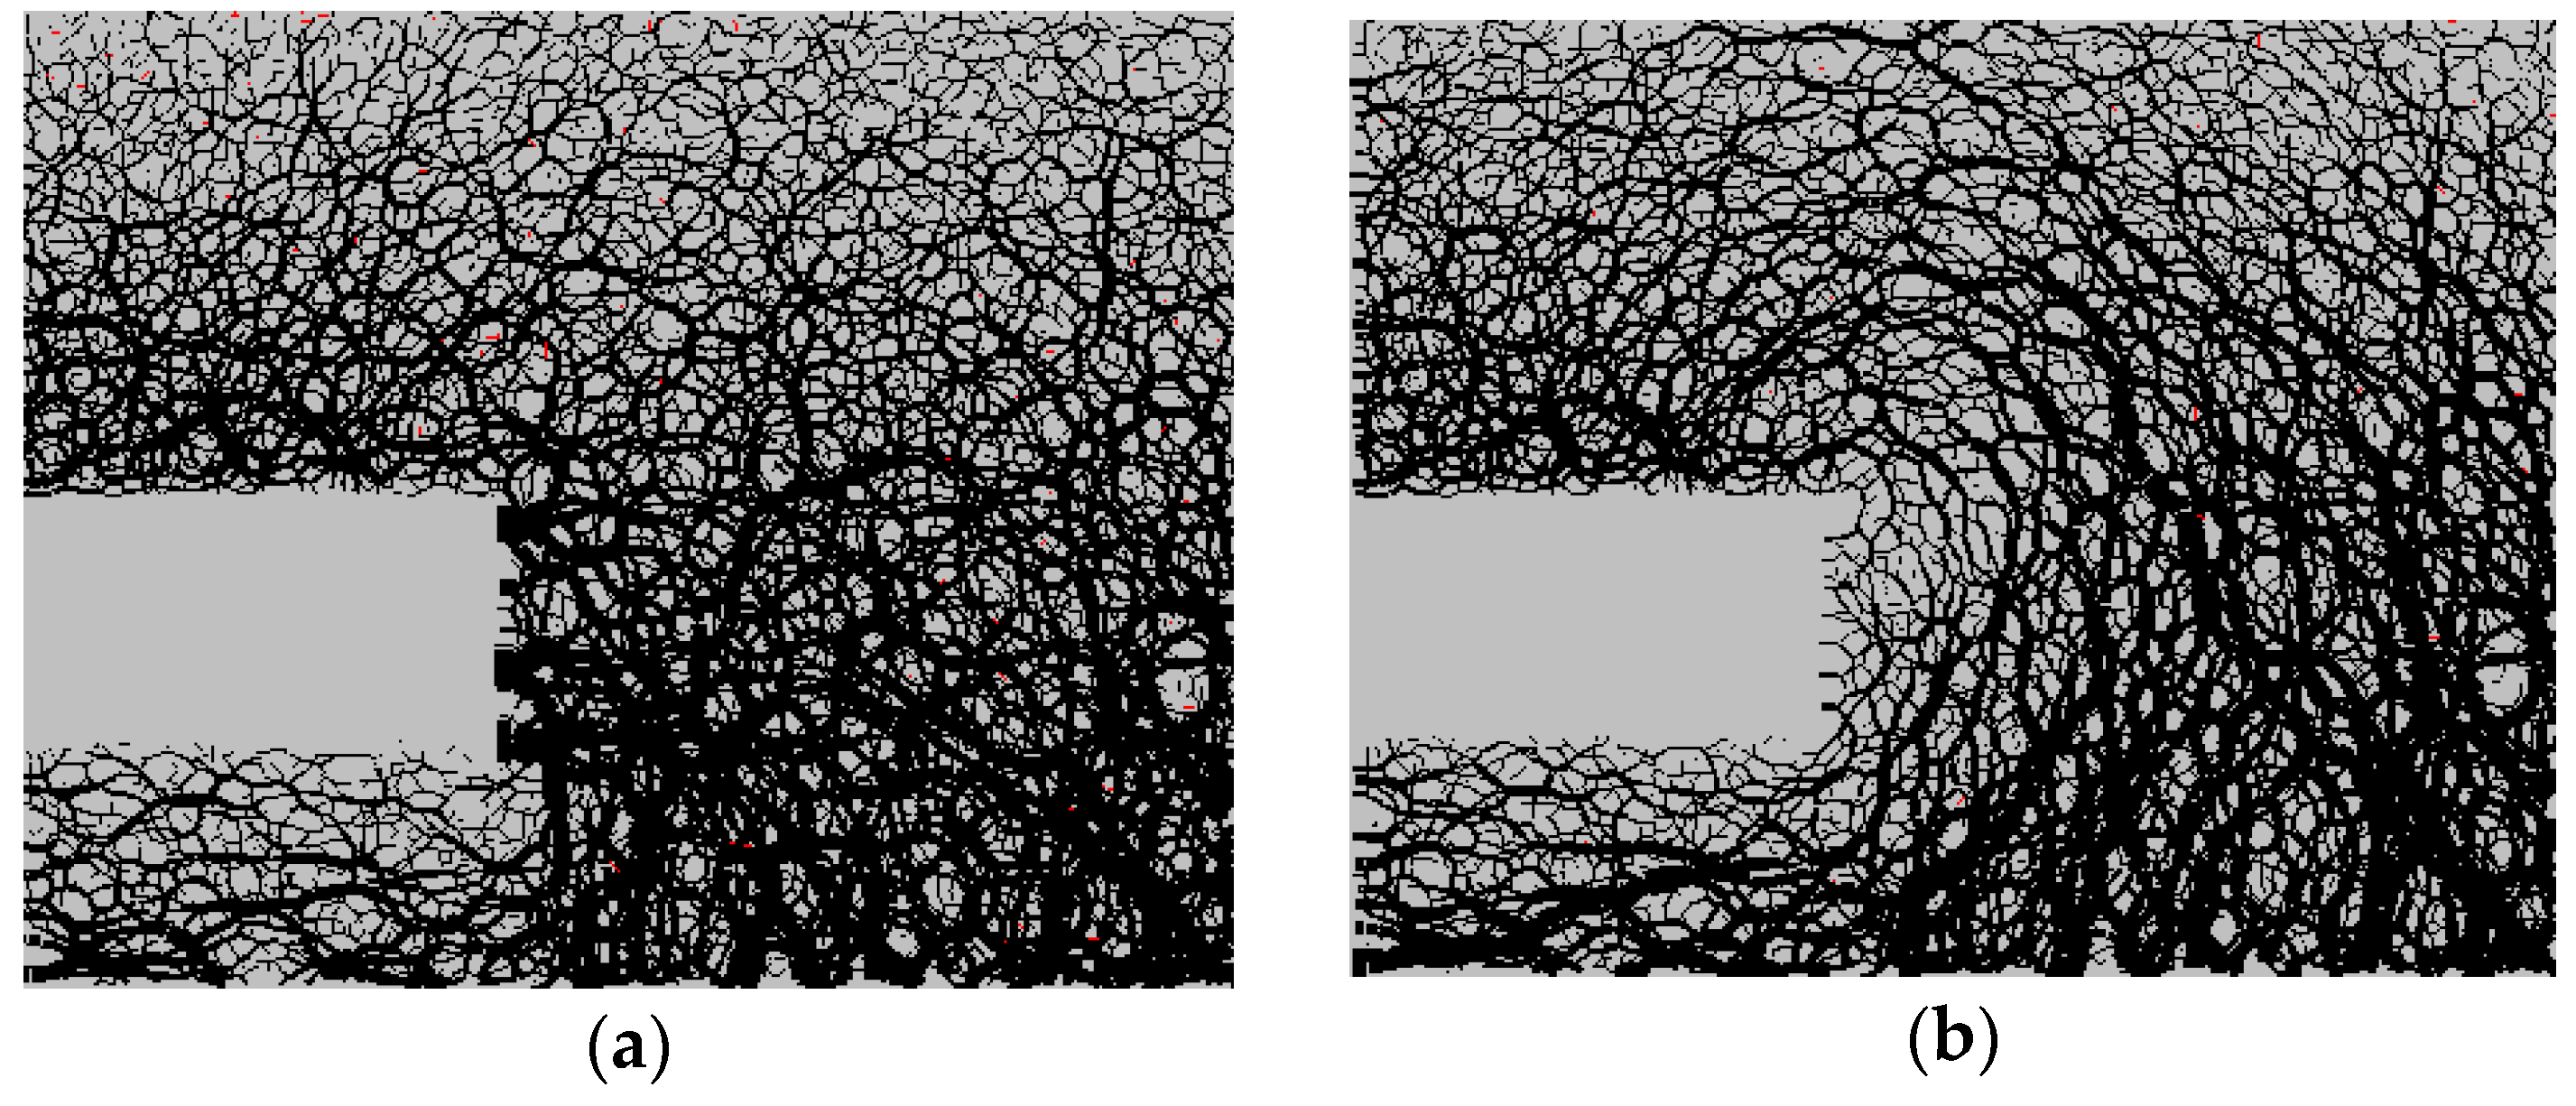
3.3. Analysis of Contact Force Chains of the Particles

Discrete element codes PFC2D provide the built-in analysis function for Contact Force Chains of the particles, which describes the contact force between particles. The thickness of the contact force chain reflects the magnitude of the contact force, and they provide a very convenient tool for explaining the evolution of the loose zone in front of the tunnel face. The evolution of the contact force chain is rendered in Figure 7. With the increase of the retreating displacement of the tunnel face, the horizontal contact force chains near the tunnel face decrease, the loose zone is formed, and its range gradually increases. The contact force chain of loose zone boundary forms a ring, and the stress increases gradually, that is, the horizontal and vertical pressure arches become increasingly stable.

3.4. Analysis of Settlement Curve of Ground Surface

The measuring points are set every 1.5 m on the ground surface to measure the settlement. Figure 8 shows the settlement curve of the ground surface under different retreating displacement of the tunnel face. The result indicates that the larger the retreating displacement of the tunnel face, the larger the ground surface settlement.

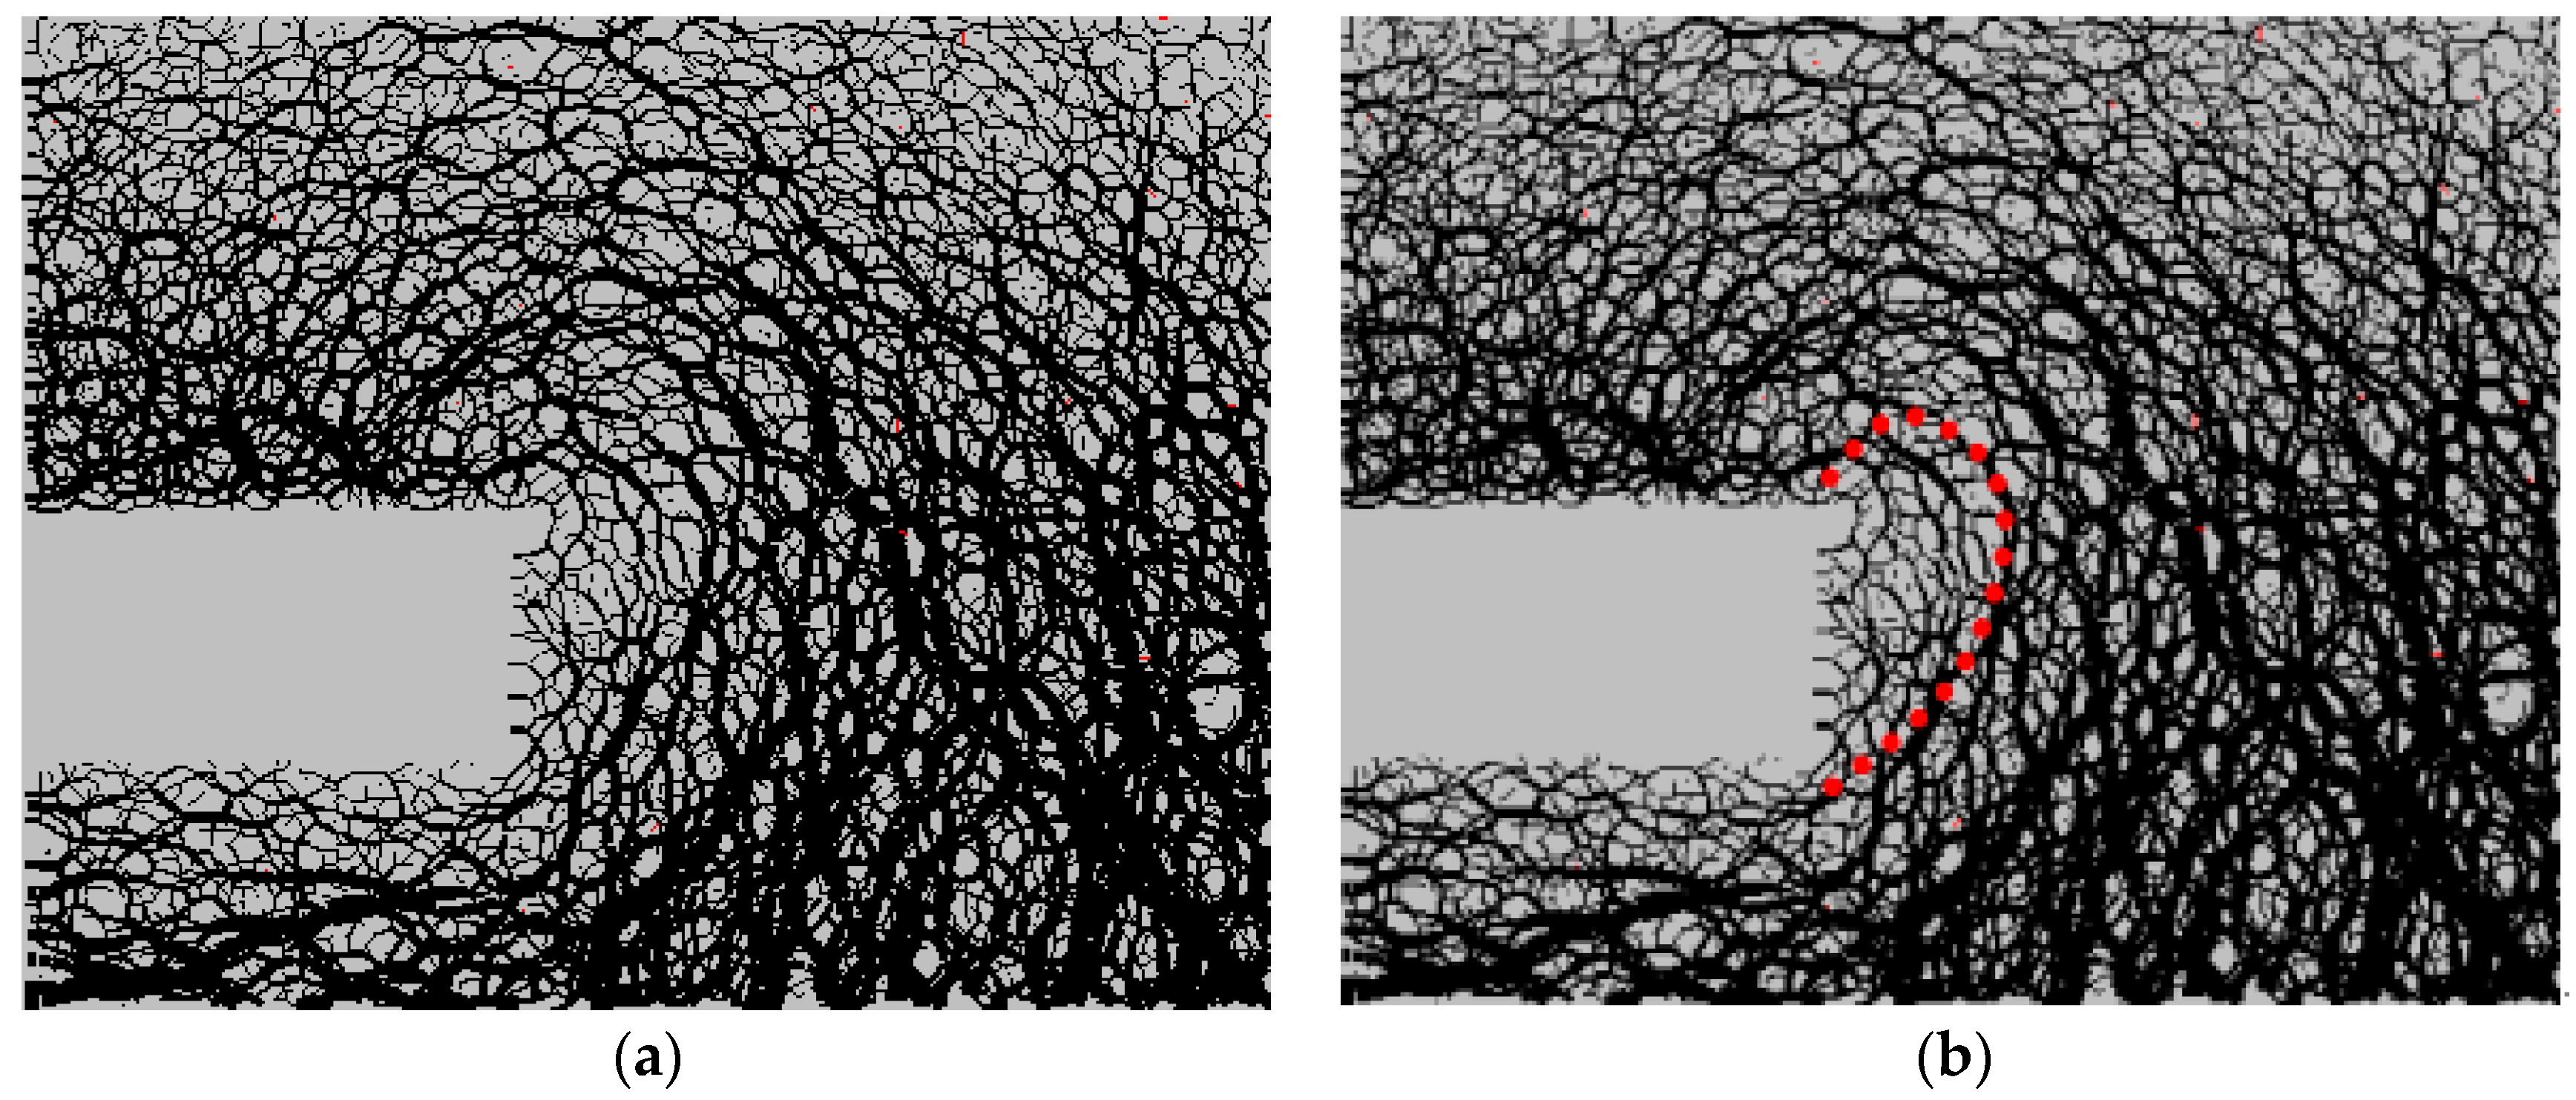
3.5. Analysis of Discriminant Criterion on of Failure Zones at Tunnel Face

For the discrete element codes PFC2D, the contact force chain itself represents the contact pressure between particles, and the innermost obvious contact force chain under the limit state (δ/D = 2.5%) can be directly taken as the discriminant criterion for the failure zone, as shown in Figure 9.

4. Conclusions

In this paper, numerical simulation analyses of the face stability of shallow tunnels are carried out by using the particles’ discrete element codes PFC2D from a microscopic view. Under different retreating displacement of the tunnel face, the evolution laws of support pressure on the tunnel face, the ground deformation, ground surface settlement, and contact force chain in front of the tunnel face are all studied. The main conclusions are as follows:
  • With the withdrawal of the tunnel face, the support pressure on the tunnel face can be divided into four stages, namely, the rapid decline stage, the minimum stage, the slow rising stage, and the horizontal stability stage.
  • When the retreating displacement of the tunnel face grows gradually, the ranges and magnitudes of the the ground surface settlement, particle displacement and contact force chains of the particles increase. Moreover, with the increase of the retreating displacement of the tunnel face, the horizontal contact force chains near the tunnel face decrease, and the loose zone is formed. The contact force chain of the loose zone boundary forms a ring, and the stress increases gradually, which indicates that the horizontal and vertical arch become increasingly stable.
  • For the discrete element codes PFC2D, the innermost obvious contact force chain under the limit state can be directly taken as the discriminant criterion for the failure zone.

Author Contributions

Conceptualization, K.H. and T.X.; methodology, K.H. and T.X.; validation, K.H.; writing—original draft preparation, K.H. and T.X.; writing—review and editing, K.H. and T.X.; funding acquisition, K.H. All authors have read and agreed to the published version of the manuscript.

Funding

This research was funded by the National Natural Science Foundation of China. (No. 51908371).

Data Availability Statement

All data, models, or code generated or used during the study are available.

Acknowledgments

The authors are deeply thankful to the reviewers and editor for their valuable suggestions to improve the quality of the paper.

Conflicts of Interest

The authors declare no conflict of interest.

References

  1. Wang, L.; Han, K.; Xie, T.; Luo, J. Calculation of Limit Support Pressure for EPB Shield Tunnel Face in Water-Rich Sand. Symmetry 2019, 11, 1102. [Google Scholar] [CrossRef] [Green Version]
  2. Mi, B.; Xiang, Y. Analysis of the Limit Support Pressure of a Shallow Shield Tunnel in Sandy Soil Considering the Influence of Seepage. Symmetry 2020, 12, 1023. [Google Scholar] [CrossRef]
  3. Li, X.; Wang, T.; Yang, Y. An Investigation into the Tunnel-Soil-Pipeline Interaction by in Situ Measured Settlements of the Pipelines. Adv. Civ. Eng. 2020, 2020, 18. [Google Scholar]
  4. Li, X.; Yuan, D.; Jin, D.; Yu, J.; Li, M. Twin neighboring tunnel construction under an operating airport runway. Tunn. Undergr. Sp. Technol. 2018, 81, 534–546. [Google Scholar] [CrossRef]
  5. De Buhan, P.; Cuvillier, A.; Dormieux, L.; Maghous, S. Face stability of shallow circular tunnels driven under the water table: A numerical analysis. Int. J. Numer. Anal. Methods Geomech. 1999, 23, 79–95. [Google Scholar] [CrossRef]
  6. Vermeer, P.; Ruse, N.; Marcher, T. Tunnel heading stability in drained ground. Felsbau 2002, 20, 8–18. [Google Scholar]
  7. Kamata, H.; Mashimo, H. Centrifuge model test of tunnel face reinforcement by bolting. Tunn. Undergr. Space Technol. 2003, 18, 205–212. [Google Scholar] [CrossRef]
  8. Chen, R.P.; Tang, L.J.; Ling, D.S.; Chen, Y.M. Face stability analysis of shallow shield tunnels in dry sandy ground using the discrete element method. Comput. Geotech. 2011, 38, 187–195. [Google Scholar] [CrossRef]
  9. Dias, D.; Janin, J.-P.; Soubra, A.-H.; Kastner, R. Three-Dimensional Face Stability Analysis of Circular Tunnels by Numerical Simulations. In Proceedings of the GeoCongress 2008: Characterization, Monitoring, and Modeling of GeoSystems, New Orleans, Louisiana, 9–12 March 2008; pp. 886–893. [Google Scholar]
  10. Cundall, P.A. Particle Flow Code in 2 Dimensions Command and Fish Reference Summary; Itasca Consulting Group Inc.: Minneapolis, MN, USA, 1999. [Google Scholar]
  11. Fakhimi, A.; Carvalho, F.; Ishida, T.; Labuz, J.F. Simulation of failure around a circular opening in rock. Int. J. Rock Mech. Min. Sci. 2002, 39, 507–515. [Google Scholar] [CrossRef]
  12. Zhang, Z.X.; Hu, X.Y.; Scott, K.D. A discrete numerical approach for modeling face stability in slurry shield tunnelling in soft soils. Comput. Geotech. 2011, 38, 94–104. [Google Scholar] [CrossRef]
  13. Funatsu, T.; Hoshino, T.; Sawae, H.; Shimizu, N. Numerical analysis to better understand the mechanism of the effects of ground supports and reinforcements on the stability of tunnels using the distinct element method. Tunn. Undergr. Space Technol. 2008, 23, 561–573. [Google Scholar] [CrossRef]
  14. Wang, P.; Cai, M.; Ren, F. Anisotropy and directionality of tensile behaviours of a jointed rock mass subjected to numerical Brazilian tests. Tunn. Undergr. Space Technol. 2018, 73, 139–153. [Google Scholar] [CrossRef]
  15. Saadat, M.; Taheri, A. A cohesive discrete element based approach to characterizing the shear behavior of cohesive soil and clay-infilled rock joints. Comput. Geotech. 2019, 114, 103109. [Google Scholar] [CrossRef]
Figure 1. Numerical simulation model.
Symmetry 13 00094 g001
Figure 2. Particle specimen of biaxial test.
Symmetry 13 00094 g002
Figure 3. Particle specimen of biaxial test.
Symmetry 13 00094 g003
Figure 4. Mohr stress circle and envelope in parameter calibration.
Symmetry 13 00094 g004
Figure 6. Evolution of displacement of the particles under different retreating displacement of the tunnel face (C/D = 2.0). (a) δ/D = 0%; (b) δ/D = 2.5%; (c) δ/D = 5%; (d) δ/D = 7.5%; (e) δ/D = 10%; (f) δ/D = 12.5%; (g) δ/D = 15%.
Symmetry 13 00094 g006aSymmetry 13 00094 g006b
Figure 7. Evolution of contact force chains of the particles under different retreating displacement of the tunnel face (C/D = 2.0). (a) δ/D = 0%; (b) δ/D = 2.5%; (c) δ/D = 5%; (d) δ/D = 7.5%; (e) δ/D = 10%; (f) δ/D = 12.5%; (g) δ/D = 15%.
Symmetry 13 00094 g007aSymmetry 13 00094 g007b
Figure 8. Settlement curve of ground surface under different retreating displacement of the tunnel face (C/D = 2.0).
Symmetry 13 00094 g008
Figure 9. Discriminant criterion on of failure zones at tunnel face based on contact force chain under the limit state (δ/D = 2.5%, C/D = 2.0). (a) Original drawings; (b) identified drawings.
Symmetry 13 00094 g009
Table 1. The parameters of the lining in numerical simulation.
DensityNormal StiffnessShear StiffnessNormal Contact StrengthTangential Contact StrengthContact RadiusFriction Coefficient
3000/(kg/m3)7 × 109/(N m1)2.8 × 10⁹/(N m1)1.57 × 10⁷/(N m1)1.57 × 10⁷/(N m1)1.00.5
Table 2. Microscopic parameters of particles.
Name of NameSymbolValue
Spherical densityρ/(kg/m3)1940
porosityρ00.15
Minimum radius of the ballRmin/m0.05
Ratio of maximum radius to minimum radius of sphereRmax/Rmin1.5
Spherical contact stiffnessKn/Pa5.6 × 108
Spherical contact stiffness ratioKn/Ks10
Spherical contact modulusEc/Pa5 × 109
Spherical friction coefficientμp0.5
Normal contact bond strengthσc-bond/Pa2 × 104
Ratio of contact bond strengthσc-bond/τc-bond1
Publisher’s Note: MDPI stays neutral with regard to jurisdictional claims in published maps and institutional affiliations.

