Article

Microstrip Impedance Management through Multilayer PCB Stack-Up: Discontinuity Compensation Voids with Asymmetric Dielectrics

by
Aleksandr Vasjanov
1,2,* and
Vaidotas Barzdenas
1,2,*
1
Department of Computer Science and Communications Technologies, Vilnius Gediminas Technical University, 03227 Vilnius, Lithuania
2
Micro and Nanoelectronics Systems Design and Research Laboratory, Vilnius Gediminas Technical University, 10257 Vilnius, Lithuania
*
Authors to whom correspondence should be addressed.
Symmetry 2021, 13(10), 1771; https://doi.org/10.3390/sym13101771
Submission received: 30 August 2021 / Revised: 16 September 2021 / Accepted: 19 September 2021 / Published: 23 September 2021

Abstract

:
To process high-frequency signals on a printed circuit board (PCB), it is often necessary to carefully analyze and select the pad widths of the chip packages and components to match their impedance to the standard Z0. Modern PCBs are complex multilayer designs, utilizing either only high-end laminates, low-end laminates, or a combination of both. The on-board component footprints usually have larger pads that become discontinuities and corrupt the impedance of critical traces. One way to address this issue is to include reference plane cutouts as a measure of compensation. This paper aims to find out how an asymmetric dielectric stack-up affects the microstrip discontinuity impedance compensation using reference plane cutouts. The selected board layer stack-up imitates several different practical design scenarios, including costly PCBs that strictly comprise high-end dielectric materials, as well as trying to lower PCB cost by introducing low-cost materials without major performance sacrifice. S-parameter measurements are performed and confirmed by time domain reflectometry (TDR) measurements.

1. Introduction

The fourth industrial revolution (Industry 4.0) is currently gaining momentum globally, encompassing a wide range of technological innovations regarding cyber-physical systems (CPS), Internet of things (IoT), Internet of services (IoS), robotics, big data, quantum computing, artificial intelligence, cloud manufacturing, and augmented reality [1,2,3]. The adoption of these technologies is central to the development of more intelligent electronic devices that are able to independently and wirelessly exchange information, trigger and perform actions, intelligently control one another, and generate large amounts of data, thus providing the user with endless information [2].
There is no doubt that this industrial revolution will be based on the rapidly developing 5G technologies and their infrastructure [3,4,5], which naturally leads to solving the challenge of manufacturing cost reduction in electronic devices. These include various engineering problems, such as dealing with high component densities, implementing RF and digital high-frequency circuits without compromising basic parameters, reducing their electromagnetic compatibility (EMC) emission level, and hardening EMC susceptibility, all while operating in low energy consumption conditions. Impedance matching on a printed circuit board (PCB) is also one of these problems [6]. To process high-frequency signals on a PCB, it is often necessary to carefully analyze and select the pad widths of the chip packages and components to match their impedance to the standard Z0 (e.g., 50 Ω) PCB track width and impedance. This is not an easy thing to do, as the geometry of modern chip packs is rapidly declining and becoming significantly smaller than the width of a standard 50 Ω PCB track. This problem is also exacerbated when ultra-small chips have several or more high-speed and radio frequency (RF) pads. Alongside the reducing size of IC packages, physically larger components (higher power amplifiers, antennas, filters, connectors, etc.) are still a part of modern, wireless radio devices. The impedance mismatch problem migrated from wireless radio into the modern high-speed digital domain. Digital circuits are currently dominating the market, with smart devices containing high-frequency data lanes interconnecting processors with storage or periphery; impedance mismatch there leads to the same consequences as in the wireless analog domain, if not more. A modulated signal in an analog chain contains a handful of useful harmonics (the carrier, low-frequency data signal) and unwanted inter-modulation side-products, whereas the rapid rise and fall times of a digital signal utilize a huge bandwidth. In the case of impedance mismatch in a chain with very short rise/fall times (tens of picoseconds and below), ringing, over- and under-shoot, as well as deteriorating eye-diagram issues arise, which can easily corrupt data transmission. Both cases are essential to making up different variations in the modern smart digital device with wireless radio functions. Therefore, in view of all the above problems, it is necessary to look for new ways and techniques to match impedances.
Another possible way to match impedances is to use tapered impedance transformers. Tapered impedance transformers match different impedances using a transmission line; a characteristic impedance gradually and monotonically varies from one impedance to the other along the length of the line [7,8]. Tapered impedance matching transformers are defined by two characteristics: tapers length L and its function Z(z). In the literature, there are many different possible functions of Z(z) for tapered transmission line designs that produce a good broadband match: exponential, triangular, Klopfenstein taper, etc. [7,8,9,10,11]. All of these taper functions give different reflection coefficient magnitude responses |Γ|. For example, in the exponential tapers, the peaks in |Γ| decrease with increasing length. The typical length for an exponential taper is about one-half wavelength λ/2 (βL = π, where β is the propagation constant) at the lowest frequency, and the upper-frequency limit is theoretically infinite. The Klopfenstein taper length is slightly longer than the half wavelength ≥λ/2 (βLπ), and the triangular taper starts from the full wavelength λ (βL = 2π) [7]. Therefore, by performing impedance matching at sub-six frequencies, the length of the tapers becomes exceptionally long and practically unsuitable in high-density RF PCB circuits. For example, [12] presents the Klopfenstein taper with a length of 72.6 mm, for matching 50 Ω and 100 Ω impedances in the 1–3 GHz frequency range. Another work [13] presents a 2–18 GHz microstrip Balun that uses the Klopfenstein equations for the taper with a length of 35 mm for transform 50 Ω unbalanced to 130 Ω balanced impedance. The inefficiency of using a small-sized taper is also discussed in [6]. In this work, tapers approximately 0.8 mm long were created, which were more than thirty times smaller than the minimum wavelength of interest (≈2.5 cm at 6 GHz in copper microstrip), and the measurement results showed that these tapered microstrips with or without a reference plane GND notch have no effect on impedance matching. Reference plane cutout is a compact solution to address the issue of altering the impedance of a discontinuity in multilayer PCBs and was discussed in our previous work [14]. Thus, this paper is a follow-up research to the latter.
After extensive research of papers published on the topic of cutout compensation or close to it (e.g., different antenna or distributed filter design on PCB substrates), no papers were found that address and quantify the difference in the resulting impedance when various laminates appear under the cutout. Therefore, this paper quantifies the difference in relative impedance of having only high-end dielectrics and mixing in a lower-quality dielectric under the given conditions. The best way to know the exact impedance under a structure with different laminates is to run an electromagnetic (EM) analysis (essentially solve Maxwell’s equations), but the current rates of board design do not necessarily provide the conditions to run EM simulations for each segment of the PCB, especially when the PCB is high-density, high-speed, and contains mixed signals. This is usually due to a stringent design time frame, availability of pricey EM software, a combination of both, or some other reason. Thus, the quantification of applying cutout impedance compensation in PCBs with an asymmetrical stack-up and providing a sequence of steps for evaluation could provide PCB designers with a faster and more intuitive approach to correcting discontinuity impedances.
This paper is organized, starting from the introduction above, where the issue is purified and its relation to the further evolution of high-speed digital and analog devices pointed out. The device under test (DUT) description and possible practical cases, which can be found in modern equipment, are described in Section 2. The following Section 3 and Section 4, accordingly, contain theoretical evaluation of the DUT as well as discussions providing measurements in both frequency and time domains. At the end of the paper, conclusions are given alongside references.

2. Target Design Scenario and DUT Description

The target of the research in this paper is finding out how an asymmetric dielectric stack-up, viewed from the cross-section shown in Figure 1, affects the microstrip discontinuity impedance compensation using reference plane cutouts. For this purpose, a 6-layer printed circuit board (PCB), comprising two types of dielectric materials with different properties, was designed, simulated, and fabricated. Low-loss TU-87P SLK (Df = 0.008, ɛr = 3.9, frated~10 GHz) core and prepreg layers were included between copper layers L1-L2, L2-L3, and L5-L6, whereas a lossy TU-768 (Df = 0.021, ɛr = 4.3, frated~10 GHz) dielectric material was selected to fill the space between the rest of the copper layers. The difference in the fiberglass weave and the structure of the material (substrate layers S1, S2, etc.) can be distinguished in the cross-section presented in Figure 1b (measured thickness tolerance is ±5 μm).
The latter board layer stack-up selection imitates several different practical design scenarios; the L1-L3 part of the PCB corresponds to a higher-priced board with all dielectric layers having low losses, as well as RF- and temperature-stable specifications. This category of materials usually includes high-performance laminates or ceramics by Isola group [15], Rogers Corp. [16], Taiwan Union Technology Corporation [17], or other industry-leading PCB material providers. As a result, the board containing only one type of high-quality dielectric material provides exemplary performance, which naturally results in a higher fabrication price.
The second part of the DUT PCB, spanning from L6 to L3, corresponds to a design with impedance-controlled traces placed on the outer layer (a high-quality dielectric separates L6 and L5), while other layers are assigned to carry digital and/or analog chip-to-chip communication interconnects with no stringent requirements defined; thus, they are separated by a more conventional dielectric material. Moreover, the latter part of the stack-up emulates a more common approach to a mass-produced design with a few internal layer counts (e.g., 2 or 4), meaning that only the most “valuable” interconnections are kept on an external layer over a high-quality dielectric. This minimizes the overall fabrication cost, but ensures operating conditions on a selected part of the board.
A third combination of layers present comprises two high-performance dielectric layers L1-L2 and L2-L3, and a higher-loss one between L3 and L4. This layer set is similar to the second aforementioned scenario, but is prone to being employed in PCBs with a higher internal layer count (e.g., 6 and more) where several copper layers carrying high-priority traces reference the plane through a low-loss dielectric.
Microstrip lines with two types of discontinuities were laid out on the top (L1) and bottom (L6) layers, which are the outer layers of the DUT. The microstrip with a single discontinuity is shown in Figure 2a, whereas Figure 2c depicts a microstrip containing multiple discontinuities and represents a practical configuration where different active and passive components are connected via a Z0 = 50 Ω. The components themselves were selected in packages, which are widely available and could appear in any industrial, prototype or research design in any combination. The main aim was to isolate the footprint pads of components encapsulated in common packages and quantify their impact on the homogeneity of the defined chain impedance Z0.
The structures shown in Figure 2b,d,e depict internal reference layers with cutouts under certain pads when applying compensation. The fabricated DUT PCB is presented in Figure 3 with each individual microstrip numbered and corresponding to the measurement results presented in the following sections. The numbered DUT traces in Figure 3 form a combination of the microstrip with discontinuity segments in Figure 2a or Figure 2c with reference layer variations in Figure 2b,d,e, or solid underneath. The vector network analyzer (VNA) Port 1 is connected to the left side of the PCB, which is referred to as the input, whereas VNA Port 2 or a termination (short or load) is to the right, hence the marked arrows.
The layer-by-layer structure for each of the microstrips in Figure 3a is presented in Table 1, and is described using PCB segments shown in Figure 2. It should be noted that the layer description for each individual track is provided only until the first solid reference plane, omitting the structures on the following layers. The size of each pad is given in Table 2, whereas the Z0 = 50 Ω (±10%) trace width under the design conditions (ɛr = 3.9, h = 0.2 mm, copper weight 2 Oz) is 0.41 mm.
The measurements were conducted using an open-short-load (OSL) calibrated 8.5 GHz bandwidth LA19-1304B VNA. The DUT was connected directly to the VNA, avoiding the use of additional cables, as shown in Figure 3b.

3. Theoretical Evaluation

When different types of dielectric materials with different properties are used, the total dielectric constant of a given n-layer structure with each layer having a height equal to hn can be calculated via
1 ε tot = n = 1 N 1 ε n × h n h t ,
where h t = n = 1 N h n is the total height of the structure [18]. Thus, according to the second design scenario discussed in Section 2 in this paper, the total dielectric constant between layers L6 and L3 (three compensational cutouts), containing one layer of TU-87P SLK and two layers of TU-768 dielectrics, is equal to ɛtot L6-L3 = 4.16. When a compensation requires a lower number of cutouts, e.g., L6-L4 (two compensational cutouts), corresponding to using one of each type of dielectrics, the total dielectric constant is ɛtot L6-L4 = 4.11. Finally, emulating design scenario No. 3, the total dielectric constant between layers L1 and L4 (refer to Figure 1), containing two layers of TU-87P SLK and one layer of TU-768 dielectrics, is equal to ɛtot L1-L4 = 4.03. As a reminder, the initial dielectric constants for each material are ɛr TU-768 = 4.3 and ɛr TU-87P SLK = 3.9. Thus, an additional dielectric layer in a multilayer PCB stack-up changes the overall dielectric permittivity of the whole structure from the initial value closer to the one added. If the initial ɛr value was greater, the added layer with the smaller dielectric constant reduces it, and vice versa. As the traces are of microstrip type, the final dielectric constant value for each case is further elaborated according to the Hammerstad and Jensen formula for effective dielectric constant ɛtot eff [19]. As an example, this leads to the following total dielectric constants for stacks of different dielectrics ɛtot L6-L3 = 4.16, ɛtot L6-L4 = 4.1, and ɛtot L1-L4 = 4.01. The latter method of estimating the total effective dielectric constants was used to evaluate the impedance of each pad without compensation, as well as with each successive one.
When both inductance and capacitance are available, impedance can also be calculated according to a well-known formula:
Z 0 = L / C ,
where Z0 is the trace impedance, and L and C are per-unit-length inductance and capacitance, respectively. The per-unit-length inductance of the loop bounded by the upper conductor and ground plane can be calculated as follows [19,20]:
L = { 60 v 0 ln ( 8 h w + w 4 h ) , w h 1 120 π v 0 ( w h + 1.393 + 0.667 ln ( w h + 1.444 ) ) 1 , w h 1 ,
where w is the width of the microstrip, h is its distance to the reference plane, and v0 is speed of light in a vacuum. The per-unit-length capacitance between the upper conductor and ground plane is calculated according to [20]:
C = { ε eff 60 v 0 ln ( 8 h w + w 4 h ) , w h 1 ε eff 120 π v 0 ( w h + 1.393 + 0.667 ln ( w h + 1.444 ) ) , w h > 1 ,
where ɛeff is the effective relative permittivity by Hammerstad and Bekkadal model [21,22]:
ε eff = { ε r + 1 2 + ε r 1 2 ( ( 1 + 12 h w ) 0.5 + 0.04 ( 1 w h ) 2 ) , w h 1 ε r + 1 2 + ε r 1 2 ( 1 + 12 h w ) 0.5 , w h > 1 ,
where ɛeff is the relative permittivity, w is the trace width, and h is the dielectric thickness.
According to the calculations, based on the equations provided above and presented in Table 2, a carefully designed PCB stack-up containing different dielectrics, alongside cutout compensation, can lead to pad impedance values that are close to the nominal trace impedance of Z0 = 50 Ω. The impedance of some pads (e.g., A0 or A3) cannot be improved under these circumstances, as the deviation from Z0 is greater after applying a single compensation compared to that without any compensation. Other pad impedances (e.g., A4, A6, and A7) suffice the conditions after applying cutout compensation on two layers, whereas three layers are required for pads A1, A2, A5, and A8.

4. Measurements and Discussion

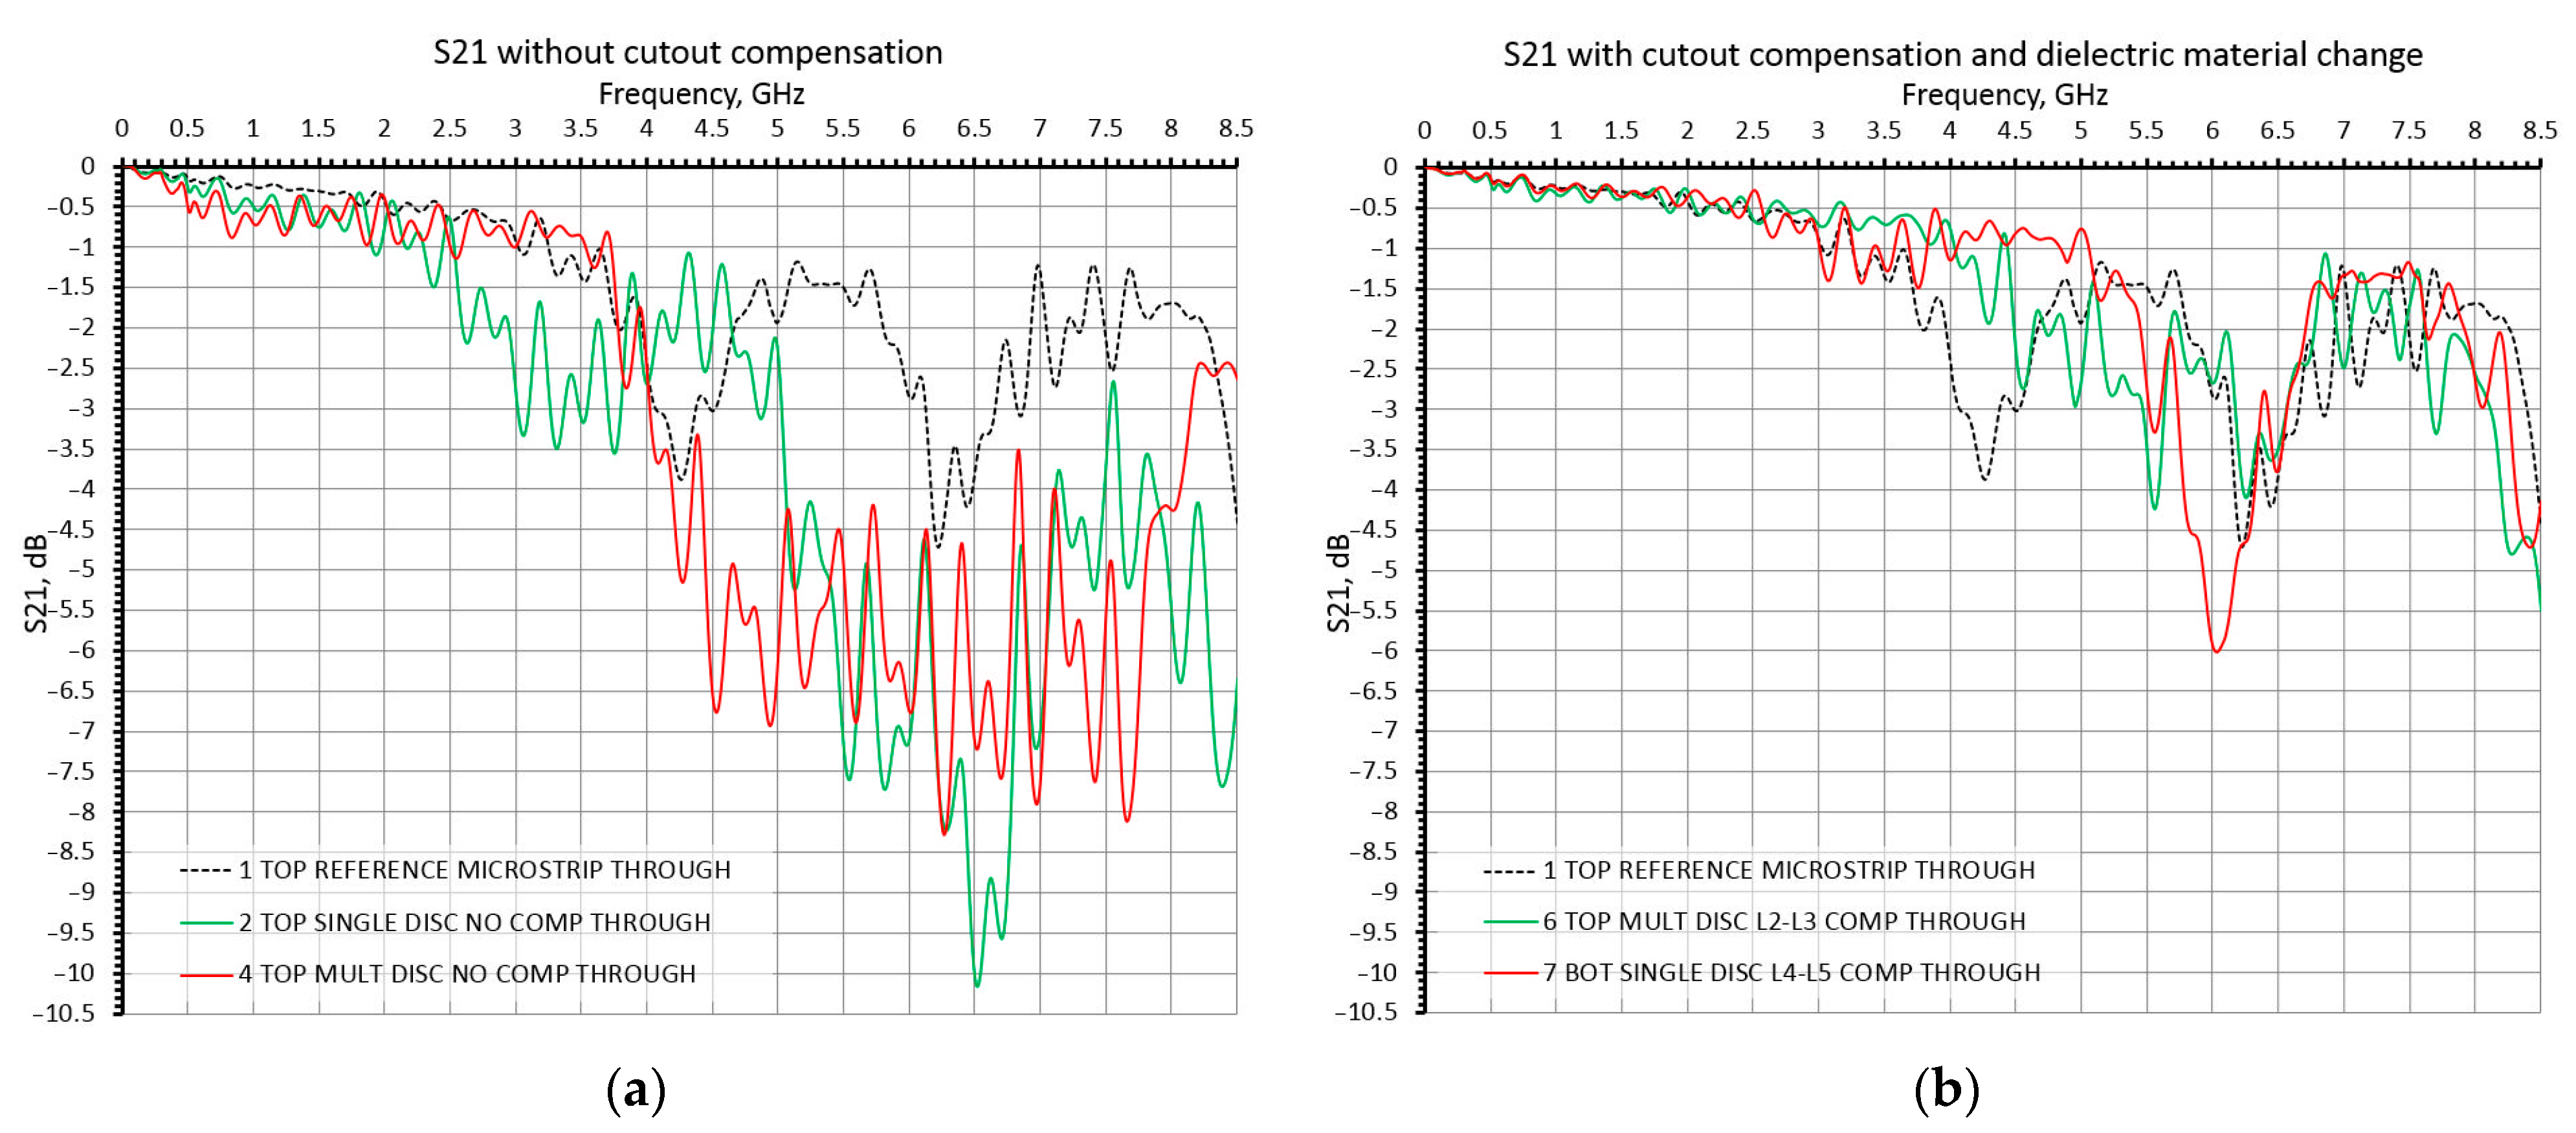
4.1. S-Parameter Measurement Results

S-parameter DUT board measurements are presented in Figure 4 and Figure 5. The microstrip was loaded with a 50 Ω calibration kit load during each measurement.
The reflection coefficient S11 measurement results for each DUT segment are presented in Figure 4. The single discontinuity without any compensation (curve 2) and with a short exponential taper (curve 9) exhibited similar poor results, not exceeding a value of −10 dB at frequencies higher than 1.5 GHz. When adding a single reference plane cutout (curve 8), the response improves by 5–10 dB. Recalling Table 1, Figure 4a curve 8 corresponds to a change in dielectric material from low- to high-loss dielectric material, but still provides a significant improvement. A two-layer cutout compensation is not uncommon for approaching such wide discontinuities; thus, curves 3 and 7 in Figure 4a provide a quantitative comparison for using different numbers of higher-loss (lower quality) dielectrics. Microstrip No. 3 contains two layers of low-loss prepreg TU-87P SLK and core TU-872 SLK materials, followed by a high-loss TU-768, compared to microstrip No. 7, which only has one prepreg TU-87P SLK layer followed by core and prepreg TU-768 materials. Both curves 3 and 7 provide 2–5 dB better reflection coefficient S11 values on almost the whole frequency range compared to curve 8.
The reflection coefficient S11 measurement results for microstrips with multiple discontinuities provide similar results with short exponential tapers, introducing little to no improvements. According to Table 1, microstrip No. 5 discontinuities had only a single layer compensation and no dielectric material change, while microstrip No. 6 had one- or two-layer compensation depending on the pad size and a change of dielectric material.
A part of the transmission coefficient S21 measurement results are presented in Figure 5. The S21 responses for non-compensated traces with low-loss prepreg TU-87P SLK dielectric are presented in Figure 5a. Curves 6 and 7 in Figure 5b, which correspond to the same DUT segment in Figure 4, depict that the losses in microstrip lines with discontinuities can be reduced to losses inherent in a reference microstrip line.
Thus, based on S11 and S21 measurement results for microstrip lines with single and multiple discontinuities, mixing higher and lower quality dielectrics does not negate the effect of applying multi-layer cutout compensation. Swapping a costly low-loss material for a cheaper and higher-loss dielectric in the stack-up might lead to S11 being 1–2 dB higher than if only low-loss high-quality dielectrics were used. However, this result would still be an improvement, considering the outcome of having reference plane cutouts only on copper layers, which are separated by the same low-loss material, or introducing additional required compensation steps and utilizing higher-loss layers of dielectric. The slight differences around the more common ɛr = 4.2 dielectric material constant values for each layer should also not pose a problem unless the values differ drastically. An example of that would be a laminate combination of RO3210 (ɛr = 10.2) [16] and a standard TG170 (ɛr = 4.6), in which case, the per-unit-length capacitance might need deeper insight using CAD tools and measurements.

4.2. TDR Measurements

In order to further compare the impact of including different grade dielectric materials in a single stack-up and applying multi-layer cutout compensation, TDR analysis was applied to microstrips with a single discontinuity. The minimal dimensions of the target discontinuity can be found according to
l = t r c 2 ε eff ,
where l is the length of the minimum resolved feature size, c is the speed of light in air, tr is the rise time of the incident TDR pulse, and ɛeff is the effective dielectric constant [23]. LA19-13-04B VNA provides a rise time of around 58 ps, resulting in a minimal detectable discontinuity of around 5 mm.
The measured TDR responses are presented in Figure 6. The nominal Z0 = 50 Ω microstrip impedance was measured to be around 47 Ω, with a non-compensated pad impedance dropping down to 28.5 Ω. A single cutout compensation increased the impedance of the discontinuity to 36 Ω. The multilayer cutout compensation increased the impedance of the discontinuity to 39 Ω. It should be noted that according to Table 1, the dielectric stack-up under the discontinuity described by curves 3 and 7 in Figure 6 differs, but the TDR response is almost identical.

4.3. Discussion

The difference between laminate types is associated with fabrication technology, materials used, and the weave of the fiberglass, which affects the length of the path the EM field travels through, as well as whether it travels through a fiber part of the PCB or the resin/air part. Different types of laminates have different thicknesses with their own weave shapes, and different resin-to-weave ratios. For cheaper dielectrics, the resin/air gaps between the fiber weave are larger, whereas the high-end laminates have a more uniform spread of fiber. This affects the consistency of the dielectric permittivity as well as losses in the material. If the multiple layer cutout contains a number of different laminates, some of which are high-end low-loss, and others are cheaper higher-loss, the uniformity of the overall structure is affected by the quantity of each type of dielectric material in that stack-up. The more high-loss materials there are, the higher the S21 losses naturally become, but the reflection coefficient S11 is still better compared to no compensation or if there was compensation applied only over high-end laminates.
Thus, for asymmetrical stack-ups, the following procedure of cutout compensation is proposed:
  • Obtain an n-layer PCB with several types of laminates. The total required number of cutouts under a discontinuity has to be established (similar to results in Table 2). Thus, the capacitance-per-length, inductance-per-length, and effective dielectric permittivity are calculated using a model of choice (ex. according to Equations (3)–(5)) assuming there is only one type of dielectric.
  • Calculate the intermediate impedance of the discontinuity according to Equation (2).
  • Evaluate the total effective dielectric permittivity of the structure with the number of cutouts found in step 1 according to a model of choice for evaluating the total dielectric constant of multilayer substrates (ex. Equation (1)) and effective dielectric permittivity model of choice (ex. Equation (5)).
  • Repeat the capacitance-per-length and inductance-per-length calculations in step 1 with the total effective dielectric permittivity found in step 3.
  • Calculate the final impedance of the discontinuity with a multiple-laminate stack-up according to Equation (2).

5. Conclusions

A six-layer PCB comprising two types of dielectric materials with different properties was designed, simulated, and fabricated in order to find out how an asymmetric dielectric stack-up affects the microstrip discontinuity impedance compensation using reference plane cutouts. The selected board layer stack-up imitates several different practical design scenarios, including costly PCBs, which only consist of high-end dielectric materials, as well as trying to lower PCB cost by introducing low-cost materials without major performance sacrifice. Based on S11 and S21 measurement results for microstrip lines with single and multiple discontinuities, mixing higher- and lower-quality dielectrics does not negate the effect of applying multilayer cutout compensation. Swapping a costly low-loss material to a cheaper and higher-loss dielectric in the stack-up might lead to a 1–2 dB S11 reduction; this is compared to using only low-loss high-quality dielectrics. The dielectric permittivity for different laminates might slightly vary, but the overall dielectric permittivity of the whole structure from the initial tends to shift to values closer to the one added. If the first laminate layer dielectric permittivity value was greater, the added layer of different laminate with the smaller dielectric constant reduces it, and vice versa. Cutout compensation with an asymmetric dielectric stack-up results in almost identical results to a fully symmetrical stack-up, and was confirmed using TDR analysis. The overall discontinuity impedance improvement under the given conditions was measured to span from 28.5 Ω to 39 Ω.

Author Contributions

Conceptualization, A.V.; methodology, V.B.; investigation, A.V. and V.B.; writing—original draft preparation, A.V.; writing—review and editing, V.B. All authors have read and agreed to the published version of the manuscript.

Funding

This research received no external funding.

Institutional Review Board Statement

Not applicable.

Informed Consent Statement

Not applicable.

Data Availability Statement

Not applicable.

Acknowledgments

The authors would like to express their gratitude to Alice Lee and TopFast PCB manufacturer for ensuring high-quality fabrication of the presented and discussed device under test.

Conflicts of Interest

The authors declare no conflict of interest.

References

  1. Pereira, A.; Romero, F. A review of the meanings and the implications of the Industry 4.0 concept. Procedia Manuf. 2017, 13, 1206–1214. [Google Scholar] [CrossRef]
  2. Weyer, S.; Schmitt, M.; Ohmer, M.; Gorecky, D. Towards Industry 4.0-Standardization as the crucial challenge for highly modular, multi-vendor production systems. IFAC-PapersOnline 2015, 48, 579–584. [Google Scholar] [CrossRef]
  3. Silva, M.M.D.; Guerreiro, J. On the 5G and Beyond. Appl. Sci. 2020, 10, 7091. [Google Scholar] [CrossRef]
  4. Gundall, M.; Strufe, M.; Schotten, H.D.; Rost, P.; Markwart, C.; Blunk, R.; Neumann, A.; Griebbach, J.; Aleksy, M.; Wubben, D. Introduction of a 5G-Enabled Architecture for the Realization of Industry 4.0 Use Cases. IEEE Access 2021, 9, 25508–25521. [Google Scholar] [CrossRef]
  5. Penttinen, J.T.J. 5G Explained: Security and Deployment of Advanced Mobile Communications; John Wiley & Sons Ltd.: Hoboken, NJ, USA, 2019. [Google Scholar]
  6. Ramzan, R.; Fritzin, J.; Dabrowski, J.; Svensson, C. Wideband Low-Reflection Transmission Lines for Bare Chip on Multi-layer PCB. ETRI J. 2011, 33, 335–343. [Google Scholar] [CrossRef]
  7. Pozar, D.M. Microwave Engineering, 4th ed.; John Wiley & Sons, Inc.: Hoboken, NJ, USA, 2012; pp. 261–267. [Google Scholar]
  8. Steer, M. Microwave and RF Design: Networks; Open Textbook Library: Minneapolis, MN, USA, 2019; pp. 217–225. [Google Scholar]
  9. Klopfenstein, R. A Transmission Line Taper of Improved Design. Proc. IRE 1956, 44, 31–35. [Google Scholar] [CrossRef]
  10. Collin, R.E. Foundations for Microwave Engineering; Wiley-Interscience: New York, NY, USA, 2001. [Google Scholar]
  11. Chen, S.; Liang, Z. The impedance matching analysis on different tapered line function. In Proceedings of the 4th IEEE International Conference on Broadband Network and Multimedia Technology 2011, Shenzhen, China, 28–30 October 2011. [Google Scholar]
  12. Cogollos, S.; Vague, J.; Boria, V.E.; Martinez, J.D. Novel Planar and Waveguide Implementations of Impedance Matching Networks Based on Tapered Lines Using Generalized Superellipses. IEEE Trans. Microw. Theory Tech. 2018, 66, 1874–1884. [Google Scholar] [CrossRef]
  13. Rizvi, S.A.P.; Khan, R.A.A. Klopfenstein tapered 2–18 GHz microstrip balun. In Proceedings of the 9th International Bhurban Conference on Applied Sciences & Technology (IBCAST), Islamabad, Pakistan, 9–12 January 2012. [Google Scholar]
  14. Vasjanov, A.; Barzdenas, V. Reduced-Reflection Multilayer PCB Microstrip with Discontinuity Characterization. Electronics 2020, 9, 1473. [Google Scholar] [CrossRef]
  15. Isola Group. PCB Laminate and Prepreg Materials. Available online: https://www.isola-group.com/pcb-laminates-prepreg/ (accessed on 27 August 2021).
  16. Rogers Corporation. Advanced Electronics Solutions: RF Solutions Laminates, Prepregs and Bondplys. Available online: https://rogerscorp.com/advanced-electronics-solutions (accessed on 27 August 2021).
  17. Taiwan Union Technology Corporation. Product Selector “View Products by Property”. Available online: http://www.tuc.com.tw/en-us/products2 (accessed on 27 August 2021).
  18. Hu, F.; Song, J.; Kamgaing, T. Modeling of multilayered media using effective medium theory. In Proceedings of the 19th Topical Meeting on Electrical Performance of Electronic Packaging and Systems, Austin, TX, USA, 25–27 October 2010; pp. 225–228. [Google Scholar] [CrossRef]
  19. Paul, C.R. Inductance Loop and Partial; Wiley: Hoboken, NJ, USA, 2010; p. 181. [Google Scholar]
  20. Paul, C.R. Analysis of Multiconductor Transmission Lines, 2nd ed.; Wiley: Hoboken, NJ, USA, 2008; pp. 146–147. [Google Scholar]
  21. Hammerstad, E.O.; Bekkadal, F. Microstrip Handbook; ELAB Report STF 44 A74169; The University of Trondheim: Trondheim, Norway, February 1975. [Google Scholar]
  22. Wadell, B.C. Transmission Line Design Handbook; Artech House: Boston, MA, USA, 1991. [Google Scholar]
  23. Antonovici, D. Advances in Time Domain Reflectometry characterisation for high speed interconnects. In Proceedings of the 2015 IEEE 21st International Symposium for Design and Technology in Electronic Packaging (SIITME), Brasov, Romania, 22–25 October 2015; pp. 37–40. [Google Scholar] [CrossRef]
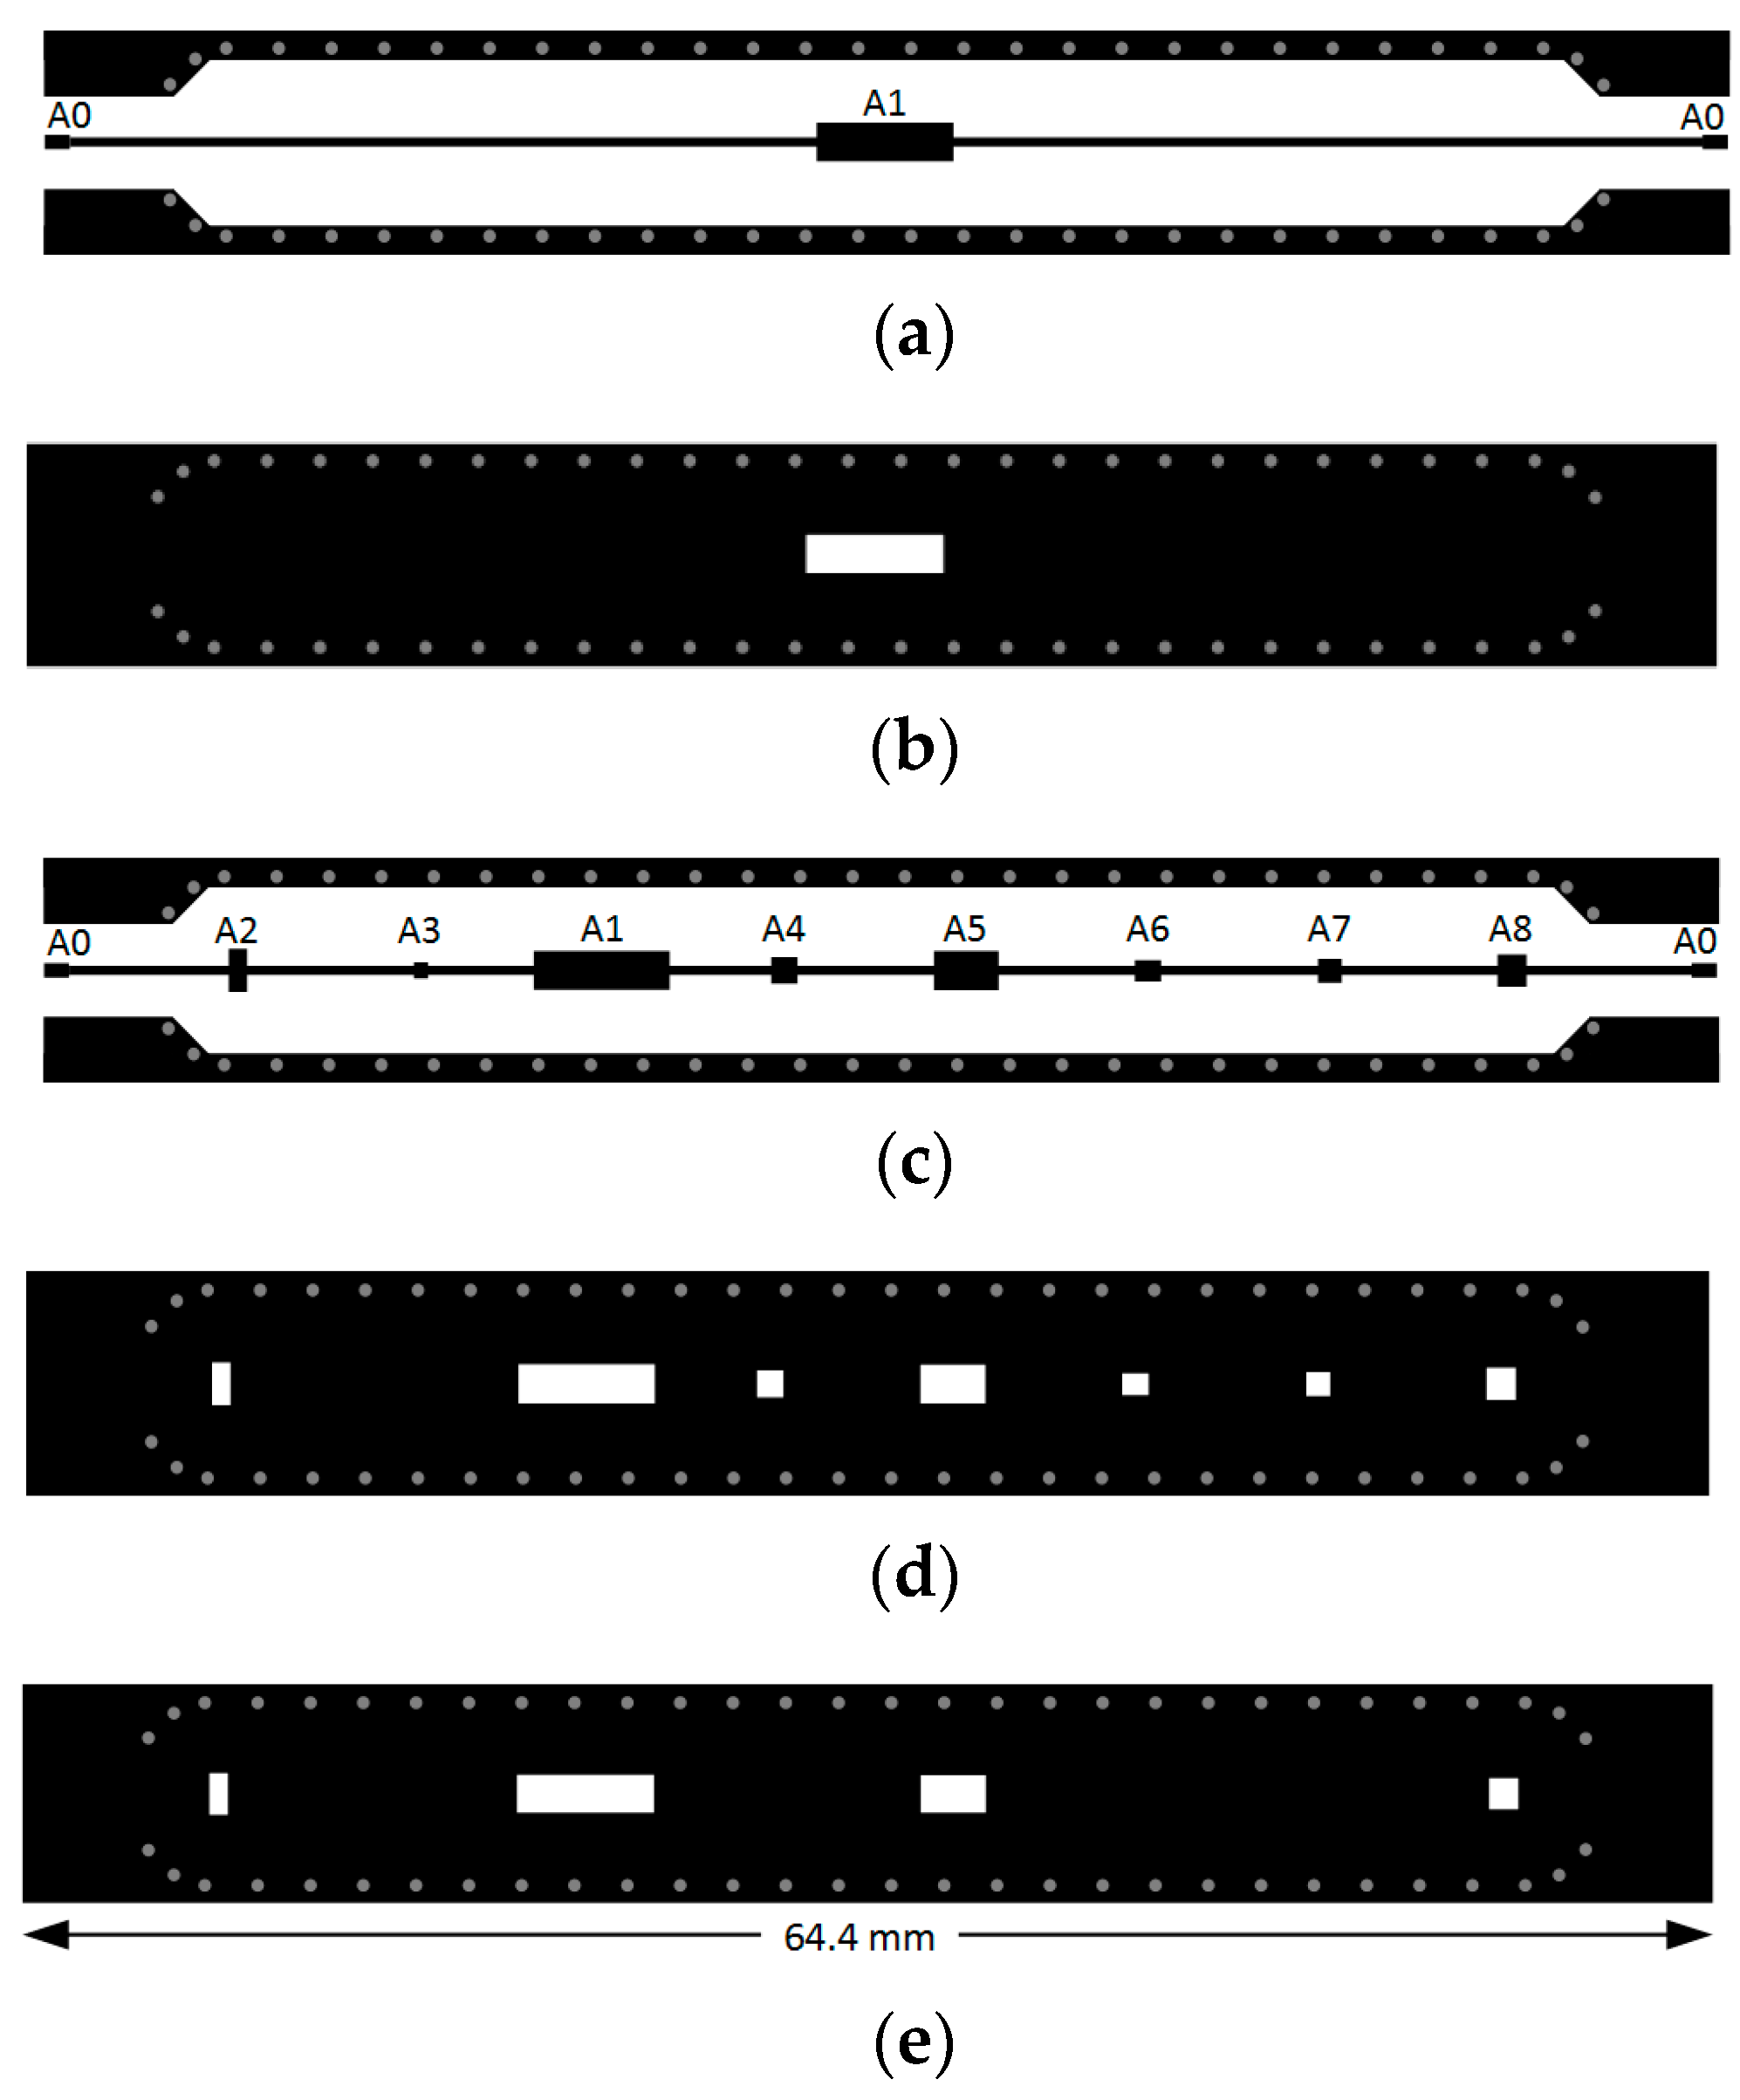
Figure 1. Designed PCB: (a) requested 6-layer stack-up; (b) fabricated board cut.
Symmetry 13 01771 g001
Figure 2. Copper layer segments of the DUT board. (a) Single discontinuity pad on top and bottom copper layers; (b) compensational cutout for single discontinuity pad in inner layers; (c) multiple discontinuity pads on top and bottom; (d) compensational cutouts for multiple discontinuity pads in inner layer L2; (e) compensational cutouts for multiple discontinuity pads in inner layer L3.
Symmetry 13 01771 g002
Figure 3. Fabricated DUT board: (a) top view; (b) measurement setup using LA19-1304B VNA.
Symmetry 13 01771 g003
Figure 4. S11 measurements for a microstrip with: (a) single board-launch SMD SMA connector pad size discontinuity; (b) multiple different-sized pad discontinuities.
Symmetry 13 01771 g004
Figure 5. S21 measurements: (a) without cutout compensation; (b) with cutout compensation and dielectric material change.
Symmetry 13 01771 g005
Figure 6. Shorted microstrip with a single discontinuity TDR response.
Symmetry 13 01771 g006
Table 1. Layer-by-layer configuration of the DUT.
Microstrip Number in Figure 3Microstrip Location on PCBDielectric Material ChangeDUT Layer-by-Layer Configuration Based on Figure 2 Segments (a, b, c, d, or e).
1Top
(L1)
No. TU-87P SLK50Ω reference line. L2—solid GND reference plane
2No. TU-87P SLKL1—a; L2—solid GND reference plane
3Yes. TU-87P SLK → TU-872 SLK →
TU-768
L1—a; L2 and L3—b; L4—solid GND reference plane
4No. TU-87P SLKL1—c; L2—solid GND reference plane
5No. TU-87P SLK → TU-872 SLKL1—c; L2—d; L3—solid GND reference plane
6Yes. TU-87P SLK → TU-872 SLK →
TU-768
L1—c; L2—d; L3—e; L4—solid GND reference plane
7Bottom
(L6)
Yes. TU-87P SLK → TU-768 →
TU-768
L6—a; L5 and L4—b; L3—solid GND reference plane
8Yes. TU-87P SLK → TU-768L6—a; L5—b; L4—solid GND reference plane
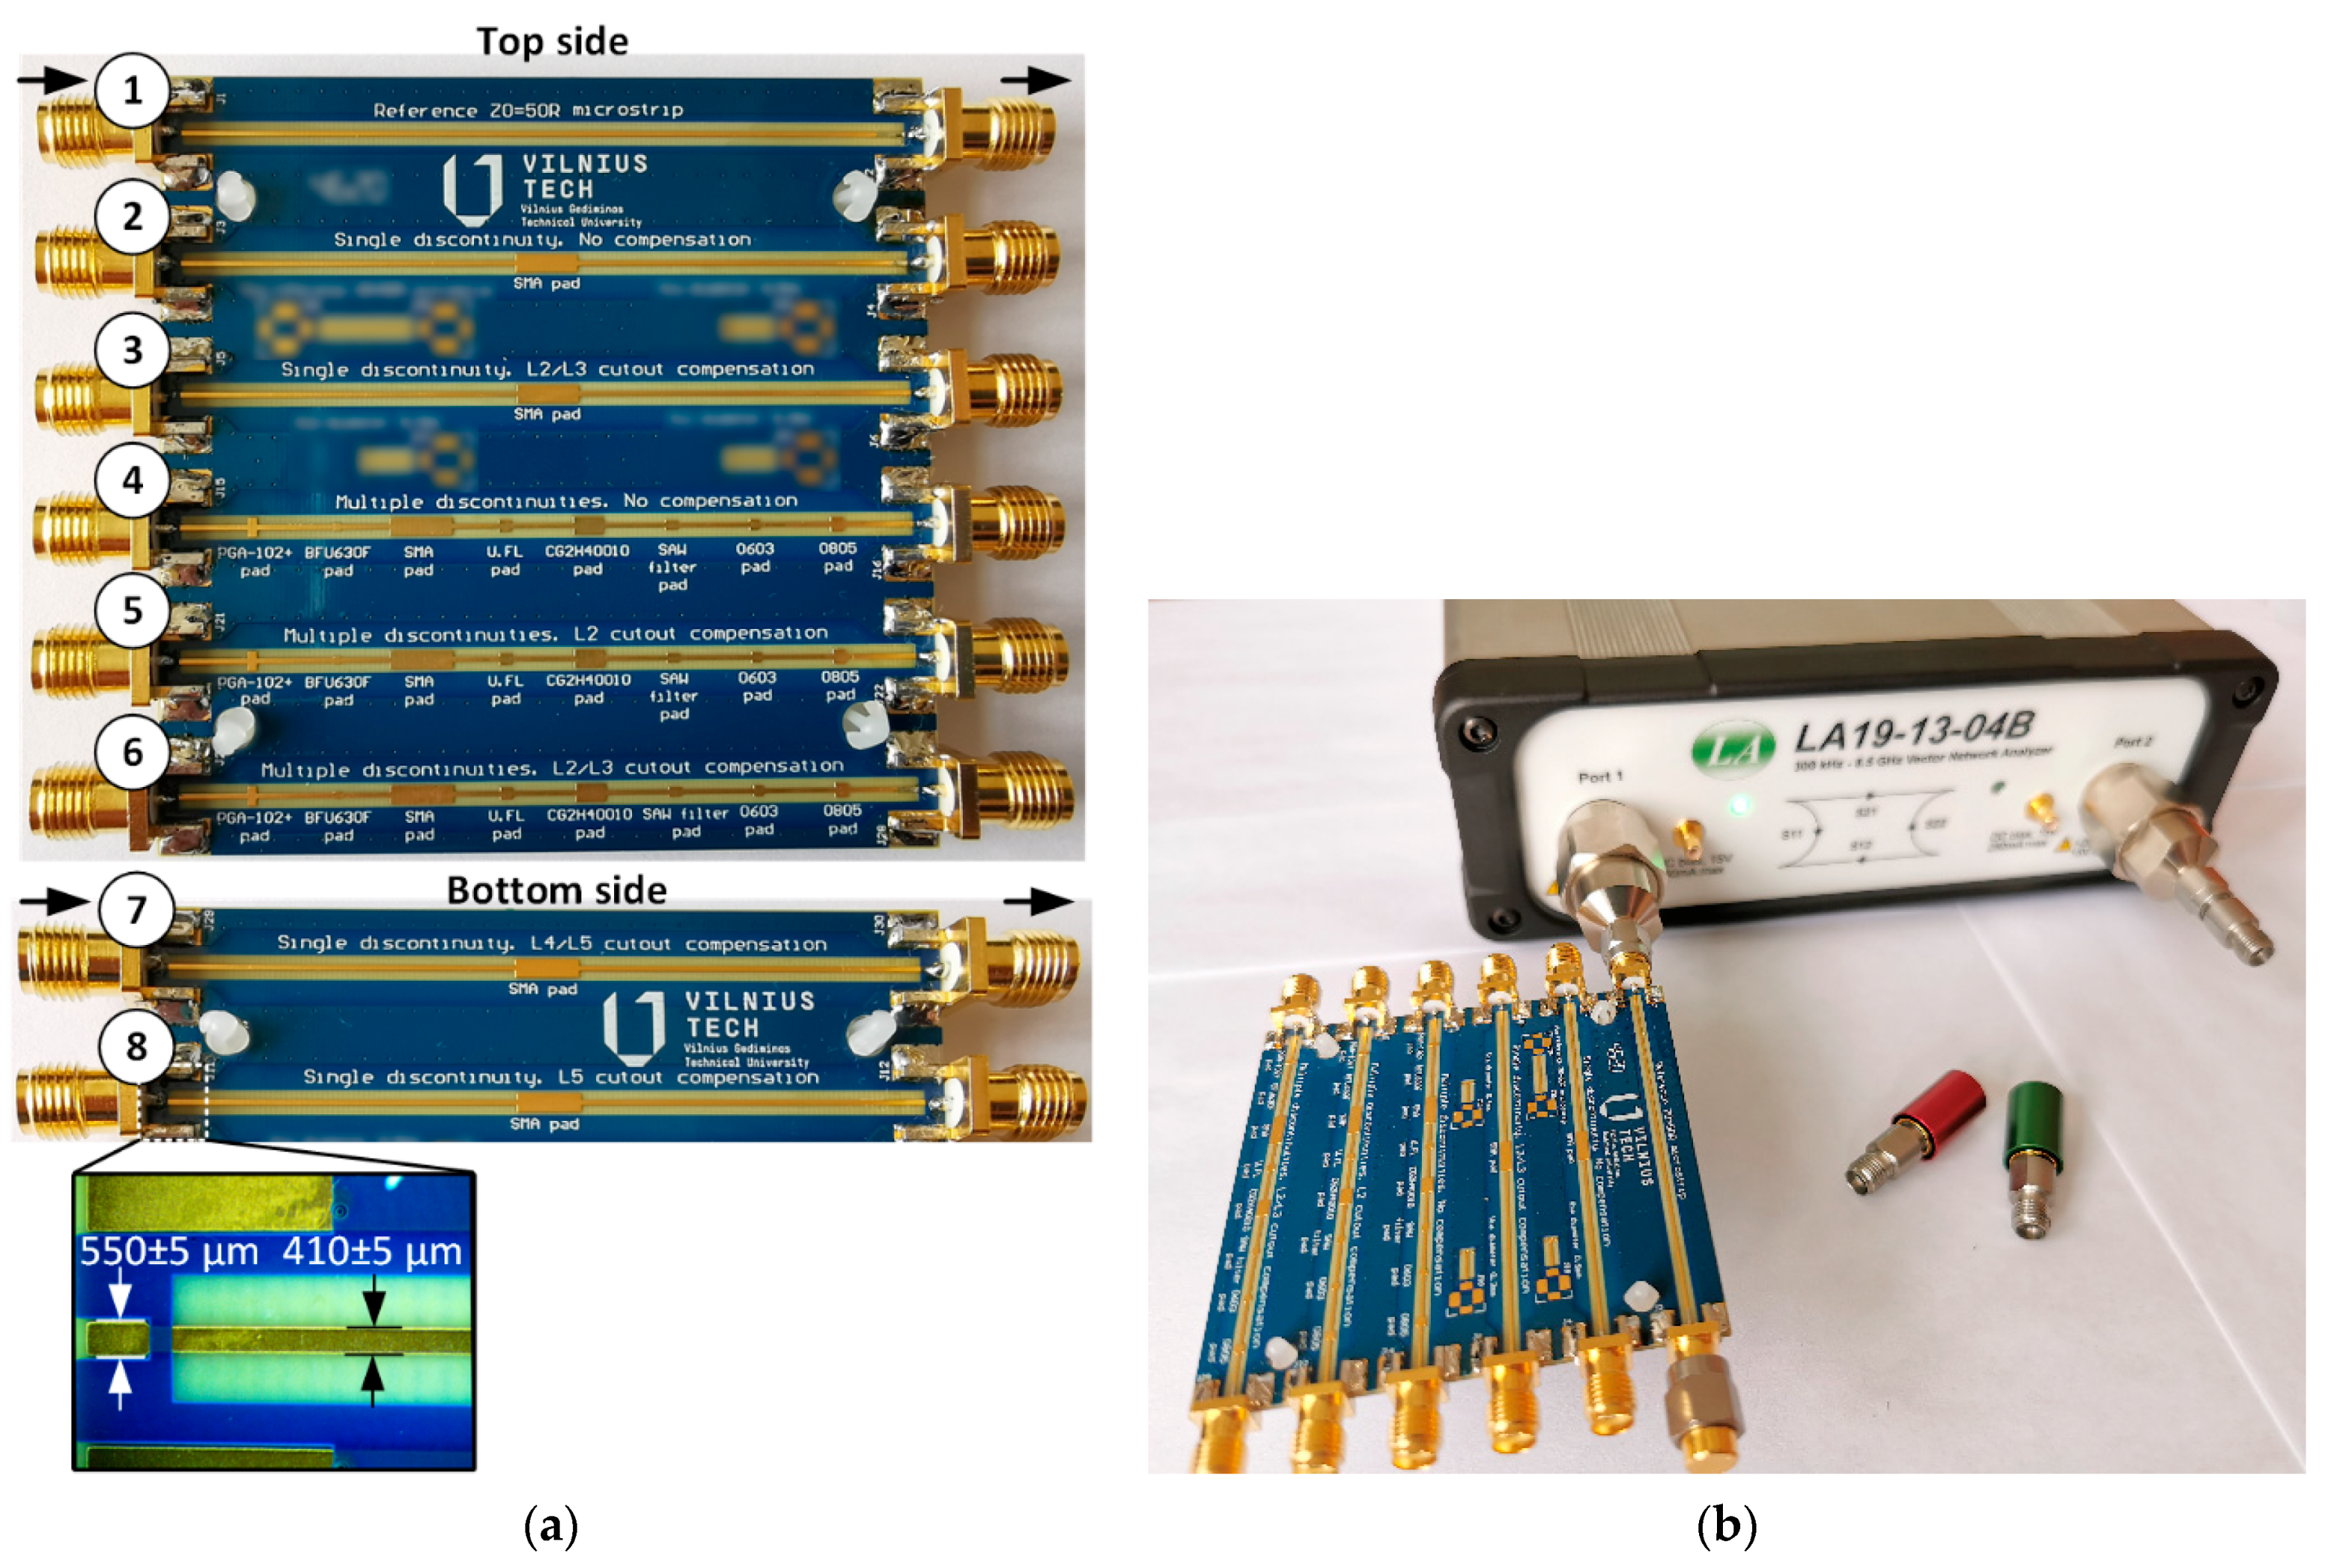
Table 2. Independent pad impedance evaluation using simplified equations.
Pad NamePad from ComponentPad Area
L × W, mm2
Distance between Pad CentersZw/o comp., ΩZ1-layer comp., ΩZ2-layer comp., Ω
A0SMA 2.9 mm conn.1 × 0.55A0–A1: 31.7 mm
A0–A8: 7.4 mm
All others: 7 mm
42.1743 167.6176279.98712
A1SMA 3.5 mm conn.5.2 × 1.519.933736.857247.2629
A2PGA-102+0.7 × 1.618.903735.216345.3666
A3BFU630F0.55 × 0.639.7756 164.6751277.07482
A4U.FL conn.1 × 127.482048.2386 159.97802
A5CG2H400102.5 × 1.519.933736.857247.2629
A6SAW filter1.05 × 0.832.467655.1932 167.38782
A70603 SMD0.8 × 0.929.761151.4696 163.45342
A80805 SMD1.1 × 1.223.852042.901154.1085
1 No further compensation applied to the pad, either due to small impedance deviation from Z0 = 50 Ω, or the additional compensation step overshot the target by more than what is currently lacking under the latter conditions; 2 Values in gray depict pad impedance if an additional compensation step was to be applied under the latter conditions.
Publisher’s Note: MDPI stays neutral with regard to jurisdictional claims in published maps and institutional affiliations.

