Abstract
Fewer contribution feature components in the image high-dimensional steganalysis feature are able to increase the spatio-temporal complexity of detecting the stego images, and even reduce the detection accuracy. In order to maintain or even improve the detection accuracy while effectively reducing the dimension of the DCTR steganalysis feature, this paper proposes a new selection approach for DCTR feature. First, the asymmetric distortion factor and information gain ratio of each feature component are improved to measure the difference between the symmetric cover and stego features, which provides the theoretical basis for selecting the feature components that contribute to a great degree to detecting the stego images. Additionally, the feature components are arranged in descending order rely on the two measurement criteria, which provides the basis for deleting the components. Based on the above, removing feature components that are ranked larger differently according to two criteria. Ultimately, the preserved feature components are used as the final selected feature for training and detection. Comparison experiments with existing classical approaches indicate that this approach can effectively reduce the feature dimension while maintaining or even improving the detection accuracy. At the same time, it can reduce the detection spatio-temporal complexity of the stego images.
1. Introduction
Steganography, another term for covert communication, is a technique for the hidden messages in objects that do not easily arouse suspicion and then sending them to the intended recipients, and it has received widespread attention in the field of information security in recent years [1,2,3,4,5,6,7,8,9,10,11,12,13,14]. The digital medium “steganography” was used by illegal organizations to covertly communicate and engage in activities that hazard national security. Steganalysis, the corresponding attack technique, is to extract the hidden messages in order to counter steganography and protect national security [15,16,17,18,19,20,21,22,23,24,25,26].
With digital media developing rapidly, improving the speed and accuracy of steganalysis has become a pressing problem. Therefore, the digital image adaptive steganalysis algorithm is the direction that researchers are currently focusing on, mainly by extracting the steganalysis features [27,28,29,30,31,32], and using the integrated classifier for training and detection, which can provide a detection effect. At present, researchers have developed a series of high-dimensional steganalysis algorithms. For example, Holub et al. [27] proposed the 8000-D DCTR feature of low complexity (fast) extracted from the used DCT residuals, Song et al. [28] proposed the 17,000-D GFR feature, in which the Gabor filter can provide steganalysis from different scales, Kodovský et al. [29] proposed the 22,510-D CC-JRM feature established by a set of sub-model systems covering the joint distribution of spatial and frequency domain DCT coefficients with extensive statistical correlation, and Fridrich et al. [30] proposed the 34,671-D SRM feature of the complete spatial domain rich model. Although high-dimensional steganalysis features achieve high detection accuracy for image-adaptive steganography, the adaptive steganalysis algorithm extracts steganalysis features with high dimension, which leads to high spatio-temporal complexity for detecting the stego images and affects the development of fast steganalysis. Therefore, how to select the feature components that contribute to detecting, so as to reduce the steganalysis feature dimension and the spatio-temporal complexity of detecting the stego images, has become the focus of the current steganalysis research.
At present, researchers have conducted a series of studies on the selection and dimension reduction of steganalysis features [30,33,34,35,36,37]. These methods can be classified into general and specific steganalysis feature selection methods depending on the objects to which the feature selection methods are applied. General methods are suitable for measuring a variety of steganalysis features, measuring the contribution of feature components to detection of the stego images, and selecting the feature vector with a large contribution to detecting of the stego images for training and detection. Typical methods in this type are the following. Qin et al. [33] proposed a method with no parameter limit, which is simple to use, and in which it is easy to understand the results of the PCA (abbreviated as PCA-D method). This method calculates the covariance matrix and the feature values and feature vector of the covariance matrix, and finally determines the number of selected feature components by determining the number of principal components. However, this method has poor effect on the nonlinear structures data. Ma et al. [34] proposed a feature selection method based on decision rough set -positive domain simplification. The method not only reduces the feature dimension but maintains the detection accuracy of the stego images; however, the feature selection depends on the classifier results, which leads to a high time complexity of the selection. In our previous contribution [35], we proposed a feature selection method (abbreviated as CGSM method) based on comprehensive criteria, which combine the difference function and correlation, and select the feature components with large difference and delete the feature components with weak correlation, which slightly improves the detection accuracy of the stego images and reduces the feature dimension.
Specific methods are suitable for a certain steganalysis feature. Though the calculation for this class of selection methods is simpler than those for the general class, it has a narrower scope of application. Typical methods of this kind are outlined here. Fridrich et al. [30] proposed a series of SRM feature selection methods for airspace-rich models, and most of these take each sub-model of SRM as a subset and then select the features based on the diversity of classifiers. Among them, the BEST-q-CLASS method has the best detection performance in selecting features, reducing the feature dimension and improving the detection accuracy of SRM steganalysis features. However, this method ignores the redundancy between subsets when selecting features, so the feature dimension is still high after selection. Yang et al. [36] proposed an algorithm for GFR feature subspace selection based on Fisher’s criterion (abbreviated as Fisher-G method). The method is able to select more efficient feature subspaces to improve the detection performance of GFR features on the stego images in a targeted way, however, it does not improve the detection accuracy of the stego images significantly when the quality factor is high. Yu et al. [37] proposed a multi-scale GFR feature selection method based on the SNR criterion combined with an improved Relief algorithm (abbreviated as SRGS method), which deletes useless and low-contribution feature components and significantly reduces the feature dimension while maintaining the detection accuracy. However, it has no obvious effect on other steganalysis features.
So far, some studies have achieved different steganalysis feature selection effects [28,33,34,35,36,37], such as CC-PEV, GFR, CC-JRM, SRM and J+SRM features. However, the existing methods for DCTR feature selection effect are not satisfactory, the selected feature dimension is still too high, the detection accuracy is reduced too much, and so on.
In order to reduce the feature dimension of DCTR without affecting the detection of the stego images, this paper attempts to propose a DCTR feature selection method based on different criteria with gain-loss (abbreviated as S-FUND method). First, we try to give a measurement algorithm based on distortion and information gain ratio according to which we measure the difference between the covers and stegos for each steganalysis feature component. Second, by setting the threshold, we delete the feature components with a small contribution measured by at least one of the two criteria. Finally, the preserved feature components are used as the final selected steganalysis feature for training and detection. This method is expected to reduce the spatial complexity of detecting the stego images by reducing the feature dimension while maintaining or even improving the detection accuracy, and to reduce the time complexity of detecting the stego images by avoiding the dependence on classification results.
The rest of this paper is organized as follows: Section 2 describes the related work. Section 3 outlines a measurement algorithm for the difference of steganalysis feature components. Section 4 proposes a multi-criteria-based feature selection method. Section 5 analyzes the effect of DCTR features based on S-FUND method proposed in this paper for detecting of the stego images through a series of experimental comparisons. Section 6 further discusses the experiment in this paper. Finally, Section 7 summarizes the whole paper.
2. Related Work
Distortion is a measure of the difference between the original signal and the altered signal [38], and it is defined as the square root of the ratio of the total harmonic energy to the fundamental energy by the following formula.
where and P represent the fundamental energy and the total signal energy, respectively, and represents the energy of the nth harmonic. The larger the K value, the greater the ratio of total harmonic energy to fundamental energy, i.e., the greater the difference between harmonic energy and fundamental energy, and thus the better to distinguish harmonic energy from fundamental energy.
The information gain ratio improves the measure of the difference between features [39], and solves the problem of information gain bias to take more features, which is defined as the ratio of the information gain value to the entropy of the value of dataset X for feature Y, with the following formula.
where represents the information gain value between dataset X and feature Y, and represent the entropy values of training dataset X and feature Y, respectively, represents the uncertainty of X given known Y. , n is the number of Y values, represents the number of samples in the X. The smaller the value of , the smaller the degree of uncertainty in Y decreasing with X, i.e., the smaller the difference between them.
In previous research, researchers have often used one criterion first to select some of the features that are useful for detecting the stego images (written as “First Selection”), and then using another criterion for a second selection based on the “First Selection” [33,34,35,36,37]. Although this does reduce the feature dimension, the two criteria are used sequentially, i.e., one criterion is measured ahead of the other, so that there are inconsistencies in the measurement using the two criteria.
For example, Yu et al. [37] proposed the SRGS method to reduce the feature dimension. First, the effective SNR criterion is improved, and valuable feature components are selected. On this basis, the Relief algorithm is improved, the redundant feature components in the remaining feature components are deleted. Afterwards, the valuable and non-redundant feature components are finally selected. However, in the SRGS method, when using the Relief algorithm, some components retained by the SNR criterion are unable to be measured by other criteria. There is the same dilemma in [34,35]. This requires the reliability of the selected features to be further improved.
Therefore, it is necessary to find a more rigorous method for selecting valuable feature components to further reduce the feature dimension and improve the detection accuracy.
3. Measure of Difference
The greater the difference between the cover and stego features, the better it is for distinguishing the cover features from the stego features, and thus the better it is for detecting the stego images. On the contrary, feature components with little and no difference between the cover and stego features are considered useless features. These features lead to the feature dimension increasing, resulting in unnecessary detection time and cost, which is detrimental to the application of steganalysis and hinders its development. Therefore, the feature components which contribute to distinguishing the cover and stego images are selected as possible. In order to measure the difference between the cover and stego images for steganalysis, distortion factor and information gain ratio are introduced in this paper.
3.1. Distortion-Based Measurement
When hiding messages are embedded by the steganography algorithm, some of the feature components of the covers are changed, which makes the difference between the cover and stego features. Considering that not all feature components change to the same degree, the greater the difference between the cover and stego features, the better the distinction factor between them. We improve Equation (1) so that it can measure the distortion factor of the cover images before and after steganography, as follows.
where and represent the values of the ith steganalysis feature in the cover and stego images, respectively, and represent the value of the ith steganalysis feature component in jth the cover images or the stego images, respectively. The larger the value, the more distortion factor that occurs in the cover images when the information is embedded in the images, the greater the difference between the cover and stego features, the more favorable the feature component is for detecting the stego images, and the more it should be preserved.
3.2. Information Gain Ratio Based Measurement
In order to measure the difference between the cover and stego features of a steganalysis feature component in many aspects, this subsection introduces the information gain ratio.
In previous work, researchers have used information gain to measure the difference of feature components between the cover and stego features, with the following equation.
where represents information gain value of the feature component between the cover and stego images, and represent information entropy values of feature components between the cover and stego images, respectively, , , represents conditional entropy values of the feature components in the stego images under the condition that the values of the feature components in the cover images are known, . The larger the value, the greater the information gain of the steganalysis feature components between the cover and stego images, and thus the greater the difference between them, and then the better it is for detecting stego images.
However, it is known from previous research that when the feature number is large, it is easier to obtain a more definite subset based on this feature division, i.e., a lower value, and because the value of is a certain, the information gain is greater. Therefore, if information gain is used as the basis for feature selection, there is a problem of bias towards selecting features with more values. In order to solve this problem, this paper uses the information gain ratio to measure the difference of feature components between the cover and stego images. The information gain ratio of feature components can be defined as the ratio of value to the partial entropy of the feature component in the cover images with respect to it in the stego images. We improve Equation (2) so that it can measure the difference in the feature components between the cover and stego images as follows.
where represents the partial entropy of the value of the feature component in the cover images with respect to it in the stego images. A larger value indicates that the feature component should be preserved.
In the next section, we describe in detail the algorithmic steps and performance analysis of the proposed S-FUND method in this paper.
4. S-FUND Method
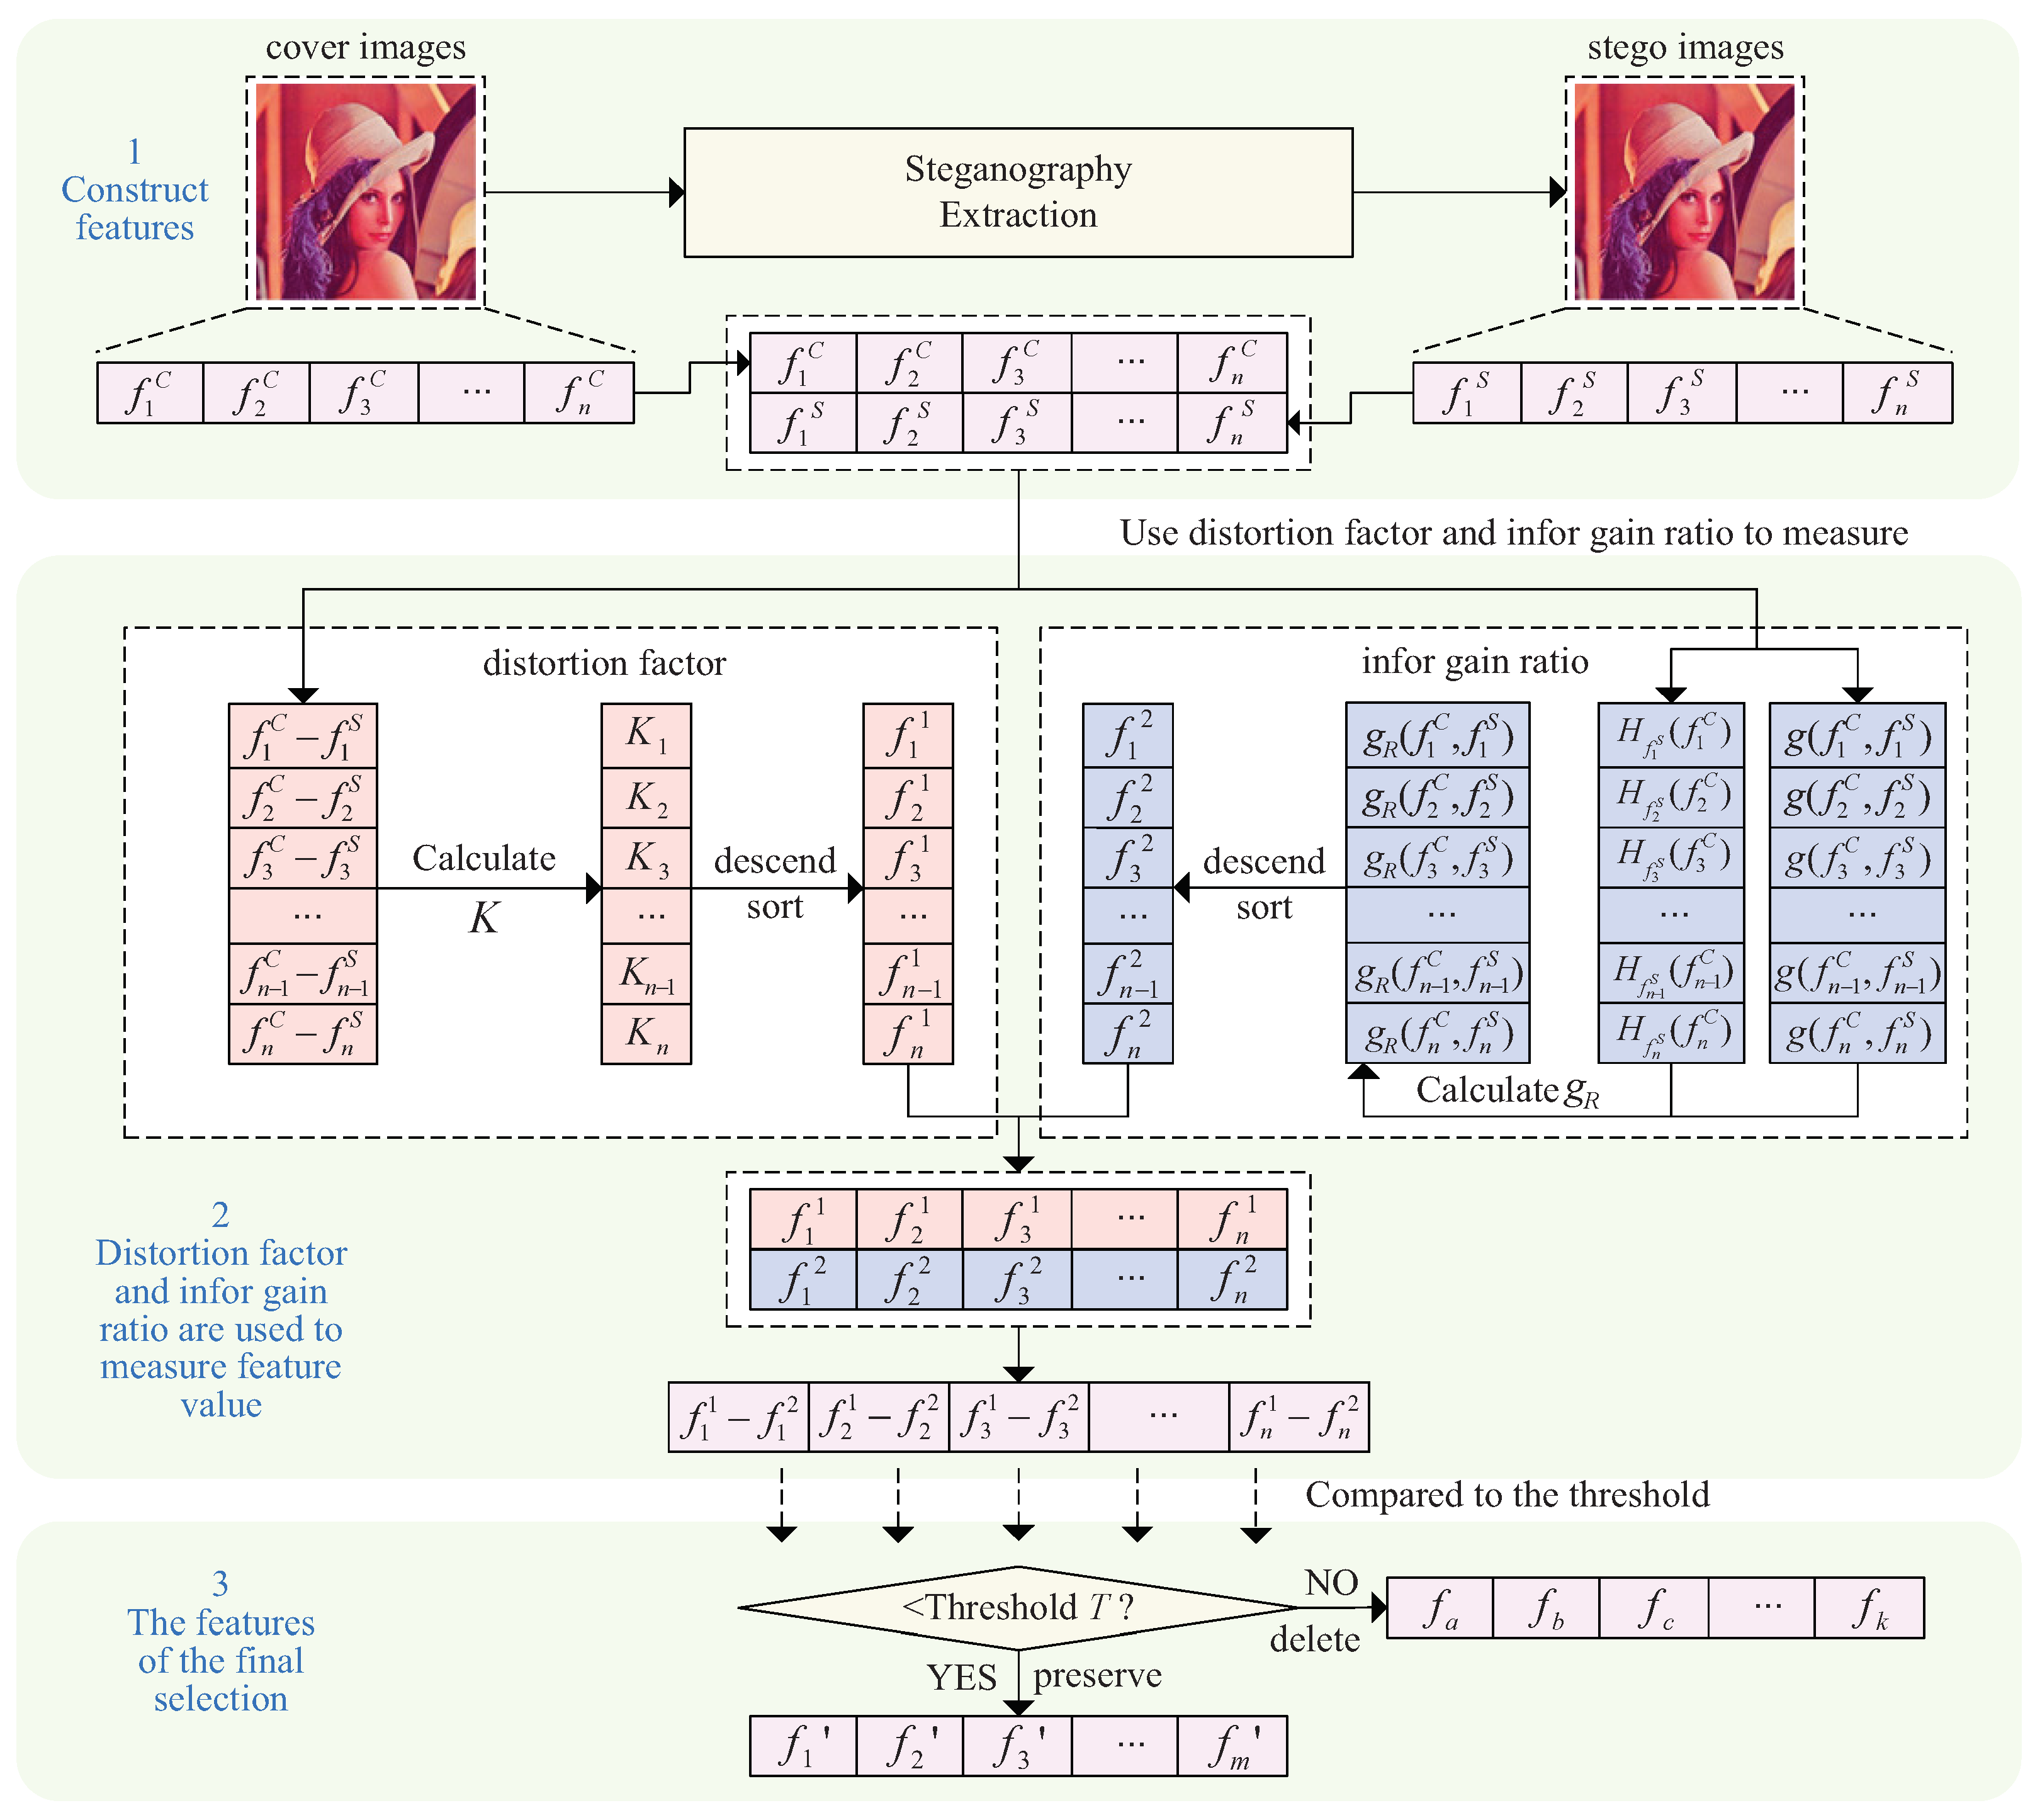
Based on the above, this paper proposes an S-FUND method, which treats the two criteria for measuring the difference between the cover and stego features as the same. First, two criteria are used to measure the difference between the cover and stego features. Afterwards, the feature component with the larger difference in order is deleted. Finally, the preserved feature components are used as the final feature.
4.1. Specific Algorithm
We present the specific algorithm of S-FUND method according to the main steps described above, as shown in Algorithm 1.
| Algorithm 1 Specific algorithm of S-FUND method |
|
Thus, in this paper, we measure the difference between the cover and stego features using distortion factor and information gain ratio. This method reduces the feature dimension significantly, thus reducing the spatio-temporal complexity of detecting the stego images.
Next, Figure 1 is given, which is based on Algorithm 1, and visually depicts S-FUND method process to select the steganalysis features.
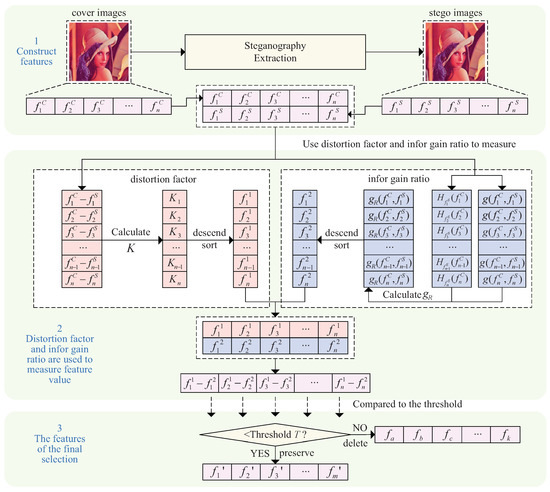
Figure 1.
Process of the S-FUND method.
In the next subsection, we analyze the time complexity of each of the main steps in S-FUND method and compare it with the time complexity of the classification results relying on Fisher’s linear discriminant integrated classifier to give the readers a better understanding of the performance of this method.
4.2. Performance Analysis
The time complexity of the main steps of the proposed S-FUND method is analyzed separately, and the time complexity of other existing classic methods are compared, as shown in Table 1.

Table 1.
Time complexity analysis of the specific steps and other classic methods.
There is no nested relationship between the steps in Table 1, so the time complexity of the S-FUND method proposed in this paper is equal to the maximum time complexity of all the steps. When , i.e., , the time complexity of the S-FUND method is ; when , the time complexity of the S-FUND method is . However, existing feature selection methods rely on the classification results of the Fisher linear discriminant integrated classifier [40], which has a time complexity of:
where L represents the number of individual learners, represents number of training sets per type, represents subspace dimension, so the time complexity of this class of selection methods is must be greater than or equal to , i.e., . Thus, the time complexity of the selection method that relies on Fisher Linear Discriminant integrated classifier results is much greater than or . Because the DCTR feature dimension is 8000, and . The time complexity of S-FUND method is less than that of PCA-D, Steganalysis-, Fisher-G and SRGS methods, and it is similar to that of the CGSM method.
Therefore, the S-FUND method greatly reduces the running time complexity and improves the efficiency of detecting the stego images.
4.3. Threshold Analysis
In order to have a better selection of S-FUND method, we need to explain the threshold T in Algorithm 1.
Based on previous work and experimental experience, when the DCTR feature is reduced to about 40% of the original by different methods, they all show worse detection effect than the original, and the detection effect will decrease as the feature dimension decreases. In this method, when the feature dimension is reduced to about 40% of the original, the threshold is 0.15.
Therefore, we initially set , if is greater than T, that is, , it means that the contribution degree of the feature components measured by the two criteria is quite different. Thus, the two feature components are removed to reduce the feature dimension. We are able to obtain the value of T, i.e., by setting the steps of 0.01. Then, by comparing the detection accuracy under these thresholds T, S-FUND method with the highest detection accuracy is selected as the final detection effect under this payload. In this way, more valuable feature components can be selected, and the feature dimension will be greatly reduced without affecting the detection accuracy, so as to achieve the purpose of feature selection for steganalysis.
5. Experimental Results and Analysis
In order to detect the performance of the S-FUND method proposed in this paper, a series of selection and comparison experiments were conducted using 8000-D DCTR feature [27]. All experiments were run in MATLAB R2018a with an Intel i7-8550U CPU and an 8G RAM computer to ensure that the different methods could be fairly compared. Experimental result figures were processed and generated in OriginPro 8.5.
5.1. Experimental Setup
The computer software, hardware, image library and steganalysis features used in all the experiments in this paper are the same to ensure that the different methods can be compared fairly and more reliably.
We performed a series of operations on the BOSSbase 1.01 image library of the website (BOSSbase 1.01 image library from the URL: http://dde.binghamton.edu/download/, accessed on 3 March 2020) to prepare for the next experiments, with the following steps.
(1) Converting 10,000 images in PGM format from the BOSSbase 1.01 image library into JPEG images with a compression quality factor of 95 (QF = 95).
(2) Generating 10,000 JPEG cover images using SI-UNIWARD [6] steganography to generate 10,000 × 5 = 50,000 images with payload of 0.1, 0.2, 0.3, 0.4 and 0.5 (bpAC).
(3) The DCTR [27] extraction algorithm was used to extract 8000-D steganalysis features from the cover and stego images, and 10,000 × (1 + 5) = 60,000 steganalysis features were obtained. The reason for this is that the cover images become stego images after embedding information, training and detection are paired, that is, the images are symmetric.
Steganalysis effect depends not only on the types of steganalysis features, but also on the different steganography schemes and payloads. Early steganography schemes can be accurately detected by high-dimensional steganalysis features (detection accuracy can reach more than 80%), such as LSB, nsF5 [1], and so on. In recent years, adaptive steganography has achieved low embedding jitter, such as SI-UNIWARD [6]. Solving the ones difficult to detect is the focus of this paper. Moreover, the detection accuracy of the same steganalysis features will be higher with the increase of payloads.
Meanwhile, the steganographic images with high payloads can be visually distinguished to a certain extent, which loses the significance of steganalysis, thus, the payloads of this paper are 0.1, 0.2, 0.3, 0.4 and 0.5. The specific experimental object settings are shown in Table 2.
Table 2.
Experimental subject setup.
Kodovský et al. [40] proposed the FLD ensemble classifier based on random forest algorithm and Monte Carlo thought, and it is widely used to train and detect for steganalysis feature selection [33,34,35,36,37]. Therefore, the FLD integrated classifier is used in this paper, which can achieve the purpose of fair comparison between different methods. Firstly, one-half of the cover image features and their corresponding stego image features with different payloads are randomly selected from each feature set as the training set. Afterwards, the remaining cover image features and their corresponding stego image features with different payloads are used as the test set. The error rates in this integrated classifier are calculated as
where and represent the false alarm rate and missed detection rate, respectively, represents the number of test sets, because the test set contains a cover image set and a stego image set, i.e., . The error rate represents the ratio of the number of classification errors to the total number of tested feature components. The lower the detection error rate, the better the selected feature components are at detecting the stego images. In order to show more intuitively the results of the comparison experiment, we use the following equation— to convert the detection error rate obtained by the classifier into detection accuracy. represents average detection accuracy—the larger value is, the better the selected features are for detecting the stego images.
The experiment consisted of four parts:
- 1.
- Comparison experiment based on the S-FUND method before and after the selection of DCTR steganalysis feature [27] (Section 5.2);
- 2.
- Comparison experiment with Random-D method (Section 5.3);
- 3.
- Comparison experiment with CGSM method [35] (Section 5.4);
- 4.
- Comparison experiment with PCA-D method [33] (Section 5.5).
5.2. Selection Experiment
Holub et al. [27] proposed an 8000-D DCTR image steganalysis feature. The feature is a first-order statistic of the quantized noise residuals obtained from the decompressed JPEG image using 64 discrete Cosine transform kernels. The DCTR feature has lower dimension and computational complexity, and better detection performance.
In order to obtain the detection accuracy of the S-FUND method, we set T = 0.15, 0.14, 0.13, …, 0.02 and 0.01 by setting the steps of 0.01, if is greater than T, the two feature components are removed to reduce the feature dimension.
In the S-FUND method, we delete the steganalysis feature components that differ more than the threshold values measured by two criteria. Firstly, in order to effectively reduce the feature dimension, we consider the difference between the two criteria greater than 15% of the original feature dimensions to be large, and for 8000-D DCTR feature, we delete the component of steganalysis features with a difference greater than 8000 × 15% = 1200 dimensions. The experimental results for the selected feature dimensions and detection accuracy are shown in Table 3.
Table 3.
Comparison of experimental results before and after feature selection based on the S-FUND method.
In Table 3, ‘Dim’ represents the feature dimension, and represents the detection accuracy. From Table 3, it can be seen that the S-FUND method can significantly reduce the feature dimension while maintaining or even improving the detection accuracy at different payloads. For example, when payload = 0.1, the selected features based on S-FUND method can achieve a detection accuracy of 0.5270, which is 0.31% higher than the original, and the selected feature is 3462 dimensions lower than the original feature dimension. Moreover, when , while maintaining the detection accuracy of the stego images, the feature dimension selected based on S-Fund method is only 30.44% of the original. When payload = 0.2, 0.3, the features selected based on S-FUND method can all reduce the DCTR feature dimension to different degrees, and the detection accuracy is improved by 0.49% and 0.16%, respectively. Moreover, the features selected based on S-FUND method are only 29.79% and 51.79% of the original while maintaining the detection accuracy of the stego images, which reduces the spatio-temporal cost of classifier training.
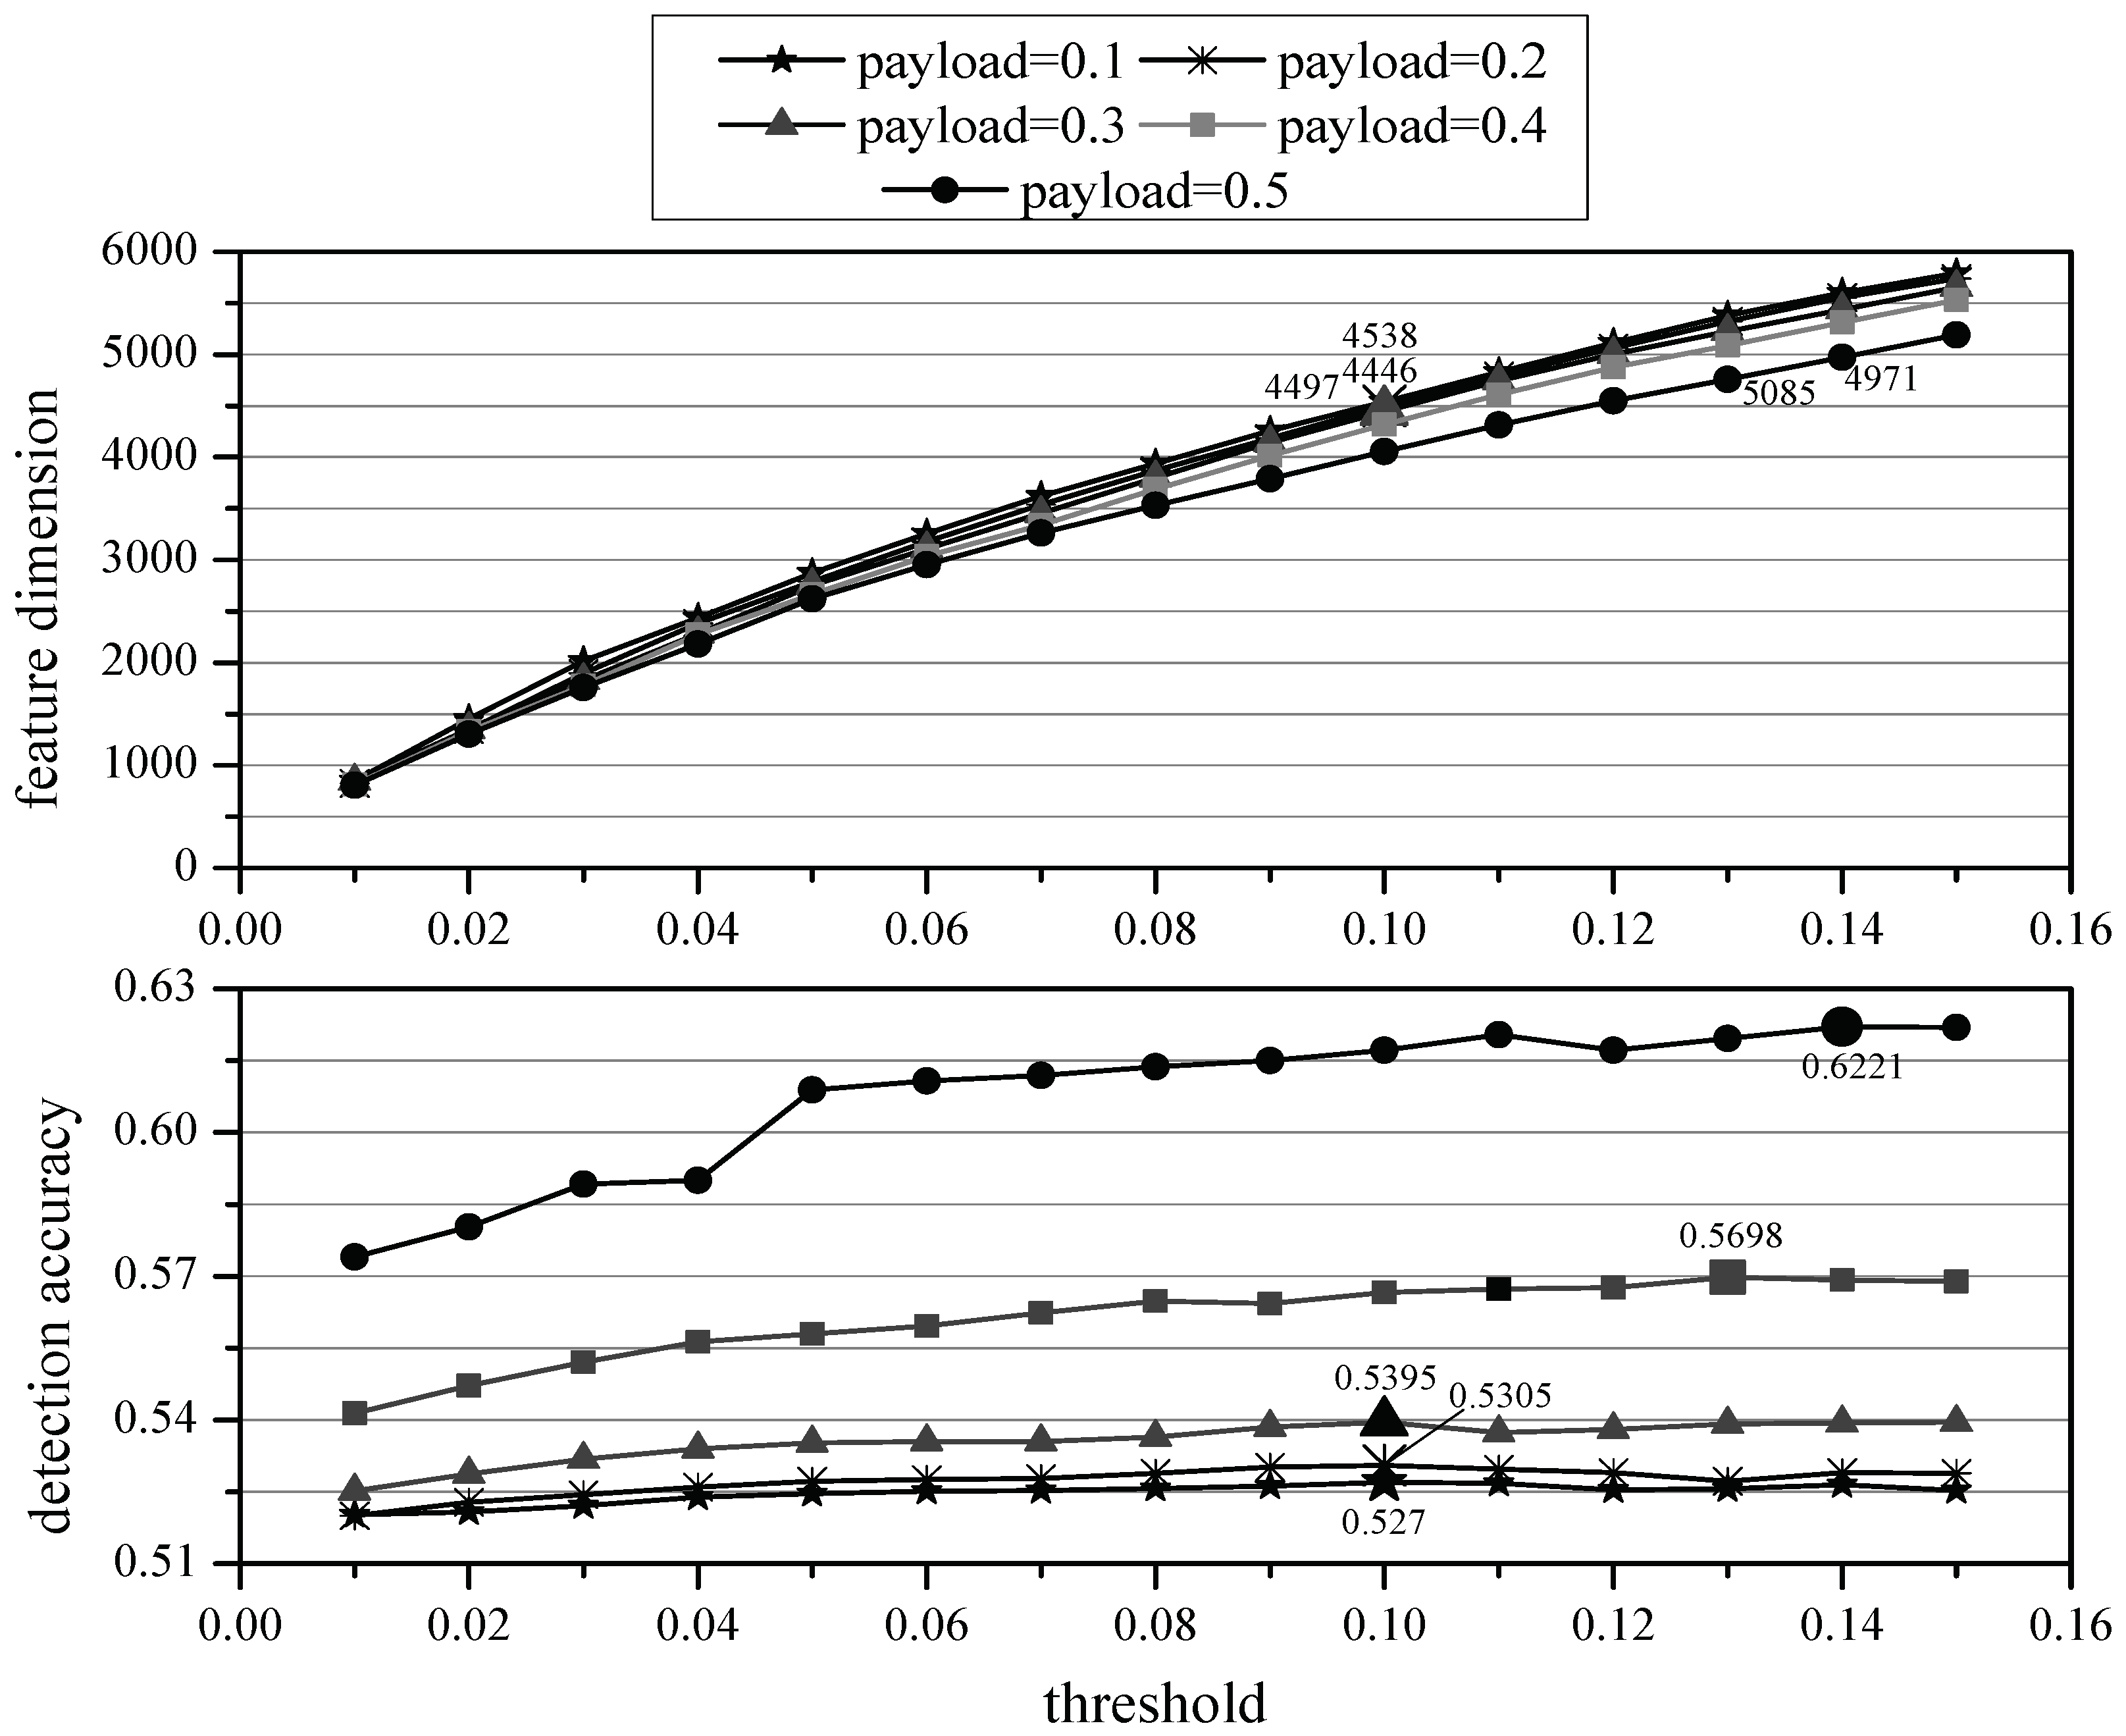
In order to compare the selection of DCTR steganalysis feature by S-FUND method more visually, the feature dimension and detection accuracy before and after selection are shown in Figure 2 below.
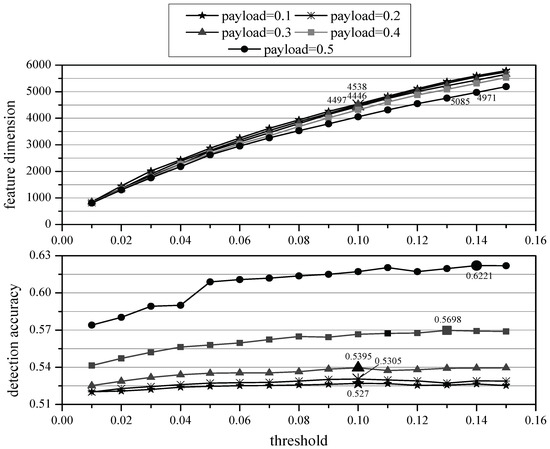
Figure 2.
Comparison of the S-FUND method for DCTR feature selection before and after selection.
In Figure 2, the horizontal axis represents threshold value and the vertical axis represents the corresponding feature dimension and detection accuracy, and the five lines from top to bottom represent the effects of the DCTR features selected at five different payloads, and the points of optimal performance at each payload are processed and labeled with values. It can be clearly seen from the figure that the S-FUND method can maintain or even improve the detection accuracy of DCTR feature while significantly reducing the feature dimension, which proves the effectiveness of the S-FUND method.
5.3. Comparison Experiment with Random-D Method
In order to make a fair comparison between the different methods, the experimental setup of this comparison experiment is the same as in Section 5.1. For different payloads, the following is a comparison of the detection accuracy of the selected features of S-FUND method and the selected features of Random-D method for the stego images. We let the feature dimensions selected by the Random-D method be equal to the corresponding feature dimensions selected by S-FUND method, and compare their detection accuracy; the comparison results are shown in Table 4.
Table 4.
Comparison of experimental results before and after feature selection based on the S-FUND method.
It can be seen from Table 4 that the S-FUND method has better detection accuracy than Random-D method when DCTR feature is reduced to the same dimension at different payloads. For example, when payload = 0.3, the detection accuracy of the features selected by the S-FUND method is 0.52%, 0.61%, 0.83%, 0.97%, 0.98% and 0.98% higher than that of the Random-D method by reducing the feature dimension to 5653, 4745, 3801, 2750, 1826 and 848 dimensions, respectively.
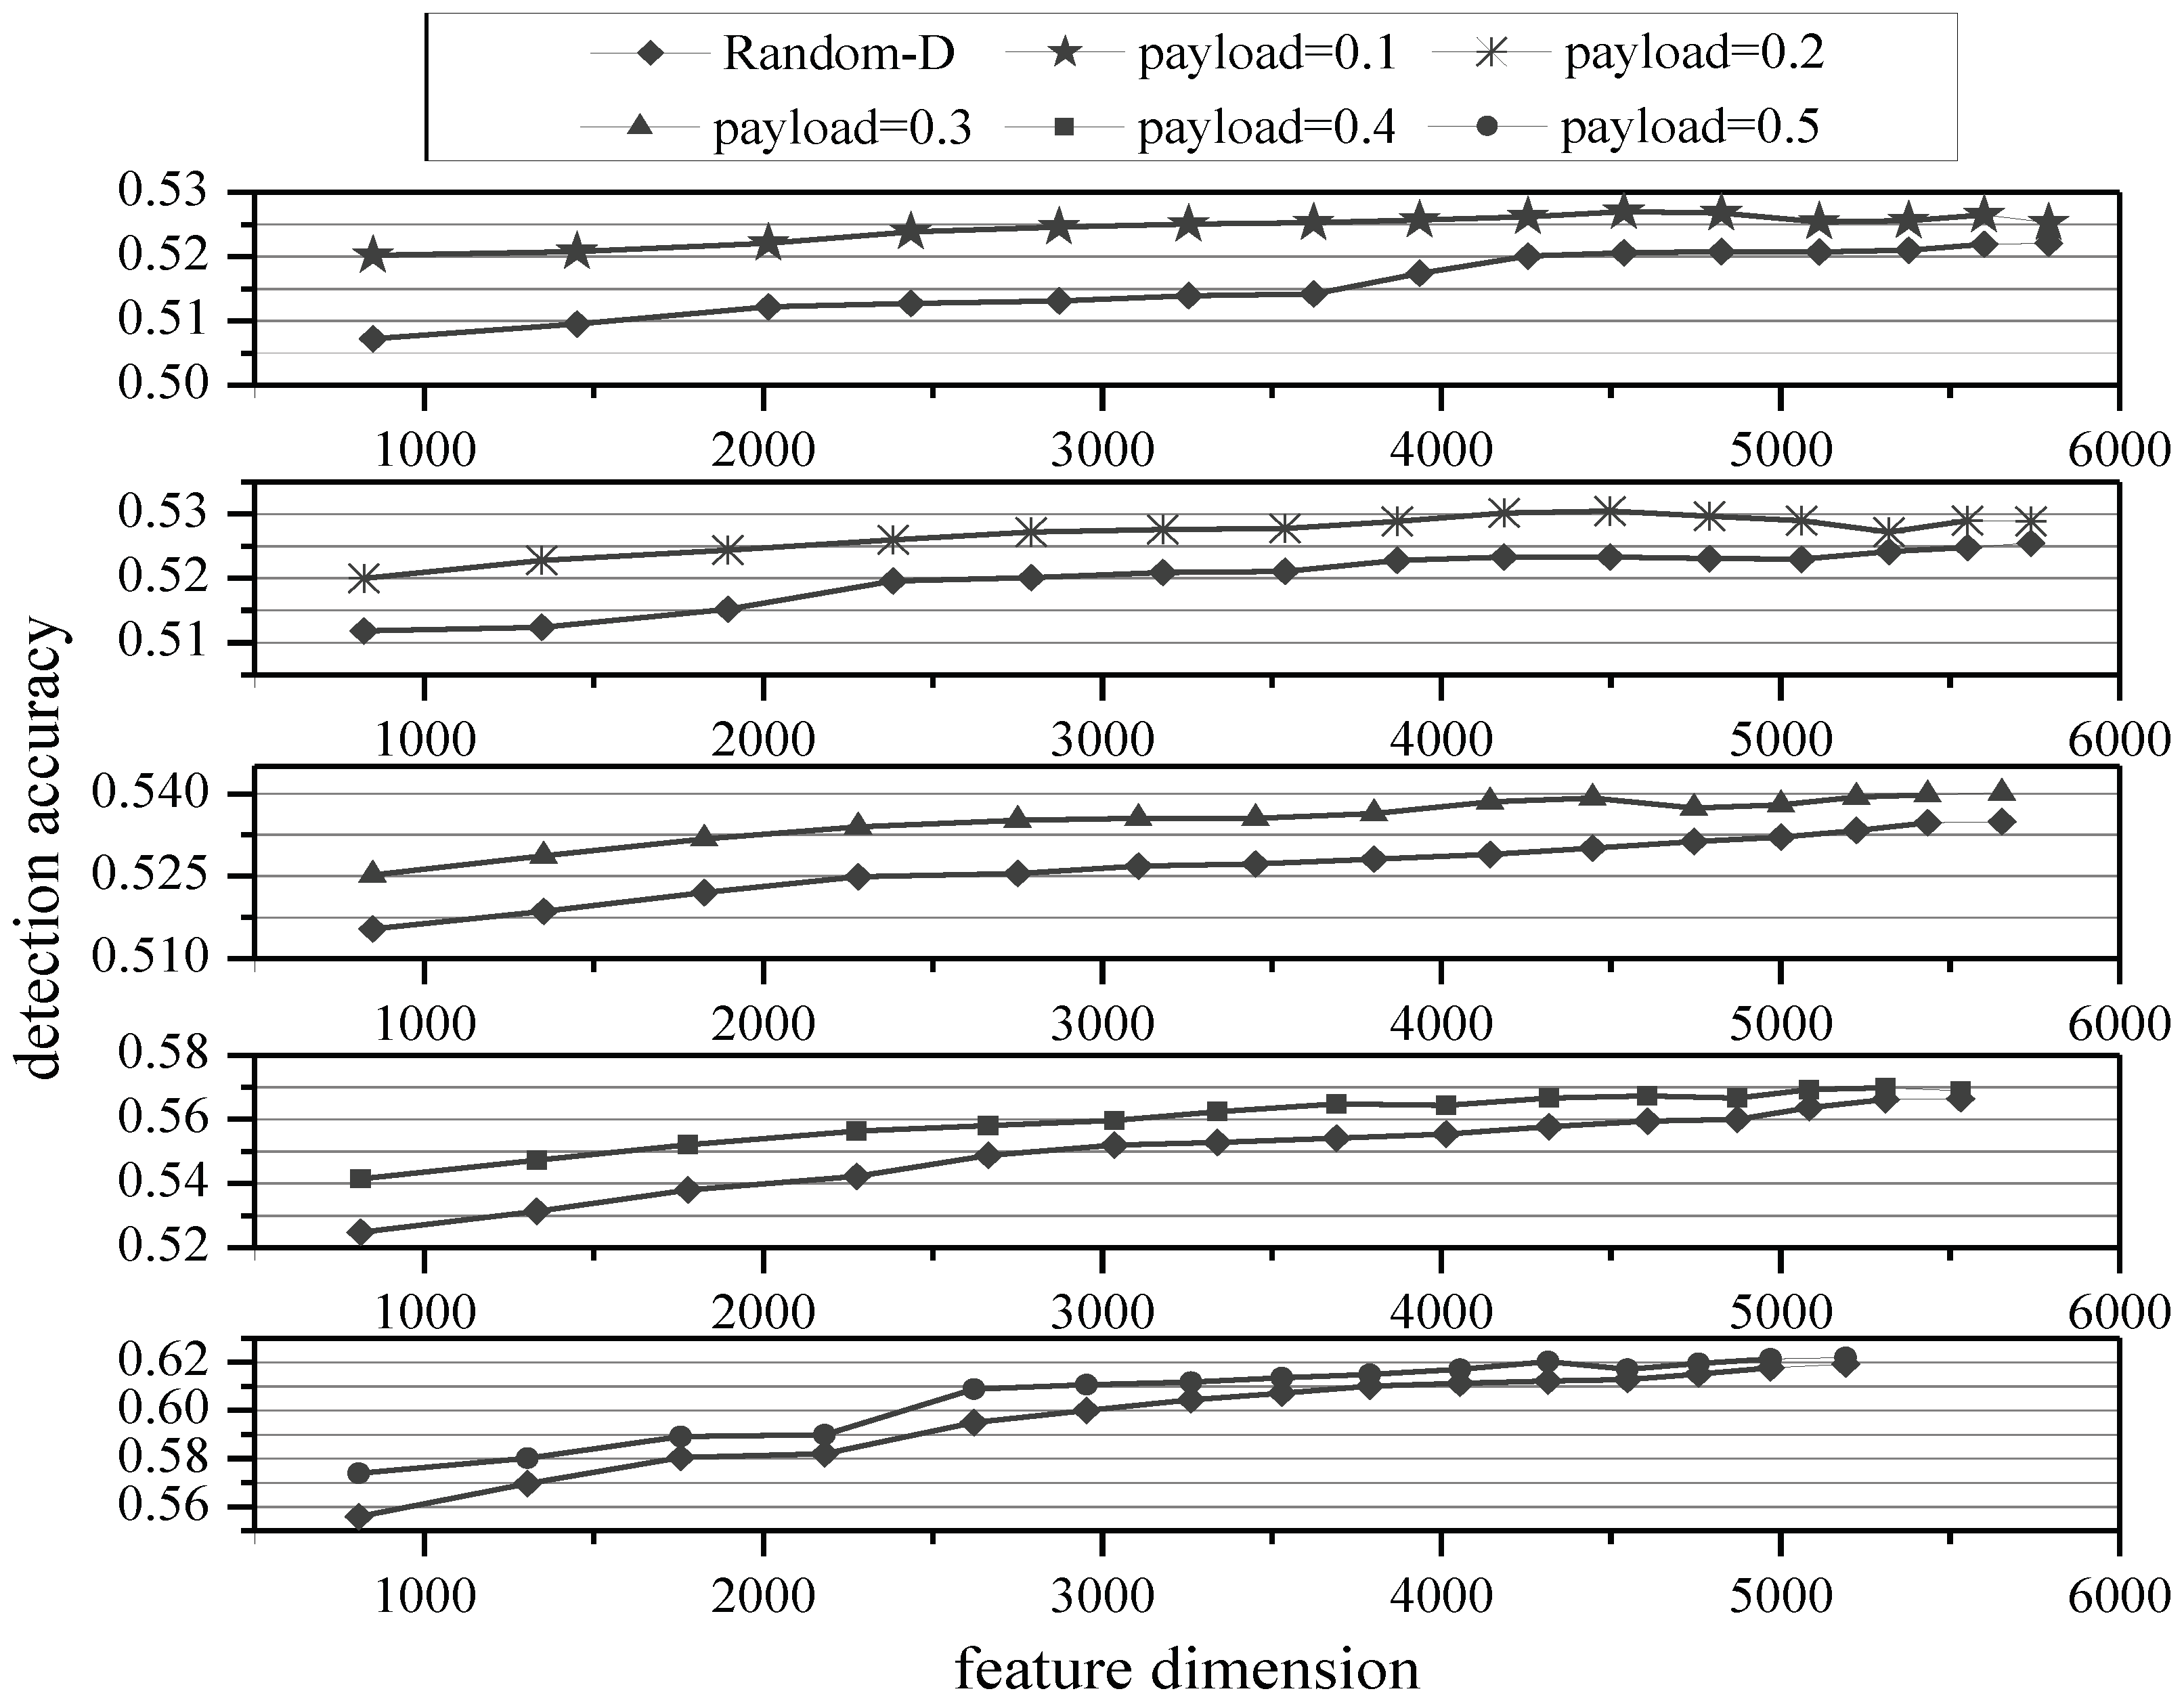
In order to compare the effects of S-FUND method and Random-D method on the selection of DCTR feature more visually, we created Figure 3 based on Table 4.

Figure 3.
Comparison with Random-D method selected DCTR feature.
In Figure 3, the horizontal axis represents the number of feature dimensions, and the vertical axis represents the corresponding detection accuracy. Five line graphs from top to bottom represent the effects of DCTR features selected by S-FUND and Random-D selection at five different payloads. From Figure 3, we can see that the S-FUND method has better detection accuracy than the Random-D method at different payloads.
Additionally, we found that as the number of selected features decreases, the difference in detection accuracy between the two methods of the stego images increases. For example, when payload = 0.1, the difference between the two methods increases from 0.32% to 1.3%. The reason for this phenomenon may be the following: as the number of selected features decreases, the useful features will more likely be deleted by Random-D, while the useless features will be deleted by S-FUND. Therefore, as the number of selected decreases, the difference between the detection accuracy of the stego images based on the features selected by S-FUND method and Random-D selection method will increase.
5.4. Comparison Experiment with CGSM Method
Wang et al. [35] proposed a method for steganalysis feature selection based on the difference function and Pearson’s correlation coefficient. The method first presents a difference function-based feature measurement algorithm to measure the difference between the cover and stego features. Afterwards, the Pearson correlation coefficient is improved to measure the correlation between the feature components and the image classification result. Finally, the feature component with large difference function is selected and the feature component with small Pearson correlation coefficient is deleted. This method is able to select the effective feature components to improve the detection performance of the stego images, however, there is a sequence between the two algorithms, which makes it difficult to avoid selecting useless features or deleting valuable features.
For the DCTR steganalysis feature with different payloads, the following is a comparison between the S-FUND method and the CGSM method when the same feature dimensions are selected, and the comparison results are shown in Table 5.
Table 5.
Comparison of experimental results with CGSM-selected DCTR feature.
It can be seen from Table 5 that S-FUND method has better detection accuracy than CGSM method when the selected DCTR feature is reduced to the same dimensions by both the S-FUND method and the CGSM method at different payloads. For example, when payload = 0.1, the detection accuracy of selected features of the stego images by S-FUND method is 0.12%, 0.43%, 0.56%, 0.89%, 1.16% and 1.6% higher than that of CGSM method when the feature dimension is reduced to 5791, 4826, 3936, 2872, 2015 and 849.
In order to compare the selection effects of S-FUND and CGSM methods on the DCTR steganalysis features more visually, we made Figure 4 based on Table 5.
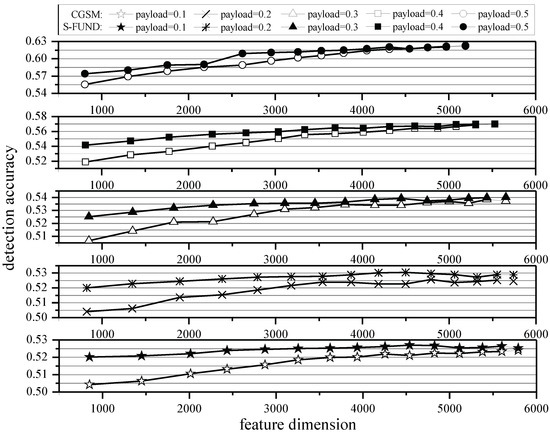
Figure 4.
Comparison with CGSM method selected DCTR feature.
In Figure 4, the horizontal axis represents the feature dimension and the vertical axis represents the corresponding detection accuracy. Five line graphs from top to bottom represent the effects of S-FUND and CGSM methods for selecting DCTR feature at five different payloads. From Figure 4, it can be seen that the S-FUND method has better detection accuracy than the CGSM method when both methods are reduced to the same dimensions under different payloads. Simultaneously, as the number of selected features decreases at different payloads, the difference in detection accuracy between the two methods increases—for example, when payload = 0.1, the difference in detection accuracy between the two methods increases from 0.12% to 1.6%.
Furthermore, we found that the difference in detection accuracy of the stego images between the features selected by the two selection methods is greater at high payloads. For example, when payload = 0.1, 0.2, 0.3, 0.4 and 0.5, the differences are 1.6%, 1.6%, 1.85%, 2.25% and 1.87%, respectively. The reason for this phenomenon may be that more information is embedded in the high payload, and the difference between the cover and stego features is larger, which makes it easier to detect the stego images with the features selected by S-FUND method. Therefore, at high payloads, the difference in detection accuracy of the stego images with the features selected by S-FUND method is larger than that of CGSM method.
5.5. Comparison Experiment with the PCA-D Method
Qin et al. [33] proposed the PCA-D method which has no parameter restrictions, is simple to use, and the results are easier to understand. However, the method is not efficient and is less effective for data with nonlinear structure. The main process is: Firstly, each feature component is subtracted from its respective mean. Secondly, the covariance matrix and the eigenvalues and eigenvectors of the covariance matrix are calculated. Thirdly, the feature values are sorted in descending order. Finally, the number of principal components (the number of selected feature components) is determined, and the feature component is selected as the final selected feature vector, and the comparison experimental results between the S-FUND and the PCA-D methods are shown in Table 6.
Table 6.
Comparison of experimental results with PCA-D-selected DCTR feature.
As can be seen from Table 6, the DCTR features selected by S-FUND methods have better detection accuracy than those selected by PCA-D method for the cover images when the DCTR feature is reduced to the same dimensions at different payloads by the two methods. For example, when payload = 0.2, the detection accuracy of S-FUND method is 0.02%, 1.83%, 0.95% and 1.2% higher than that of the PCA-D method when the feature is reduced to 5739, 4790, 3870 and 2790 dimensions, respectively. When payload = 0.4, using the two methods, the detection accuracy of the features selected by S-FUND method is 2.39%, 2.85%, 1.79% and 0.87% higher than that of the PCA-D method by reducing the feature dimensions to 5531, 4608, 3690 and 2664 dimensions, respectively.
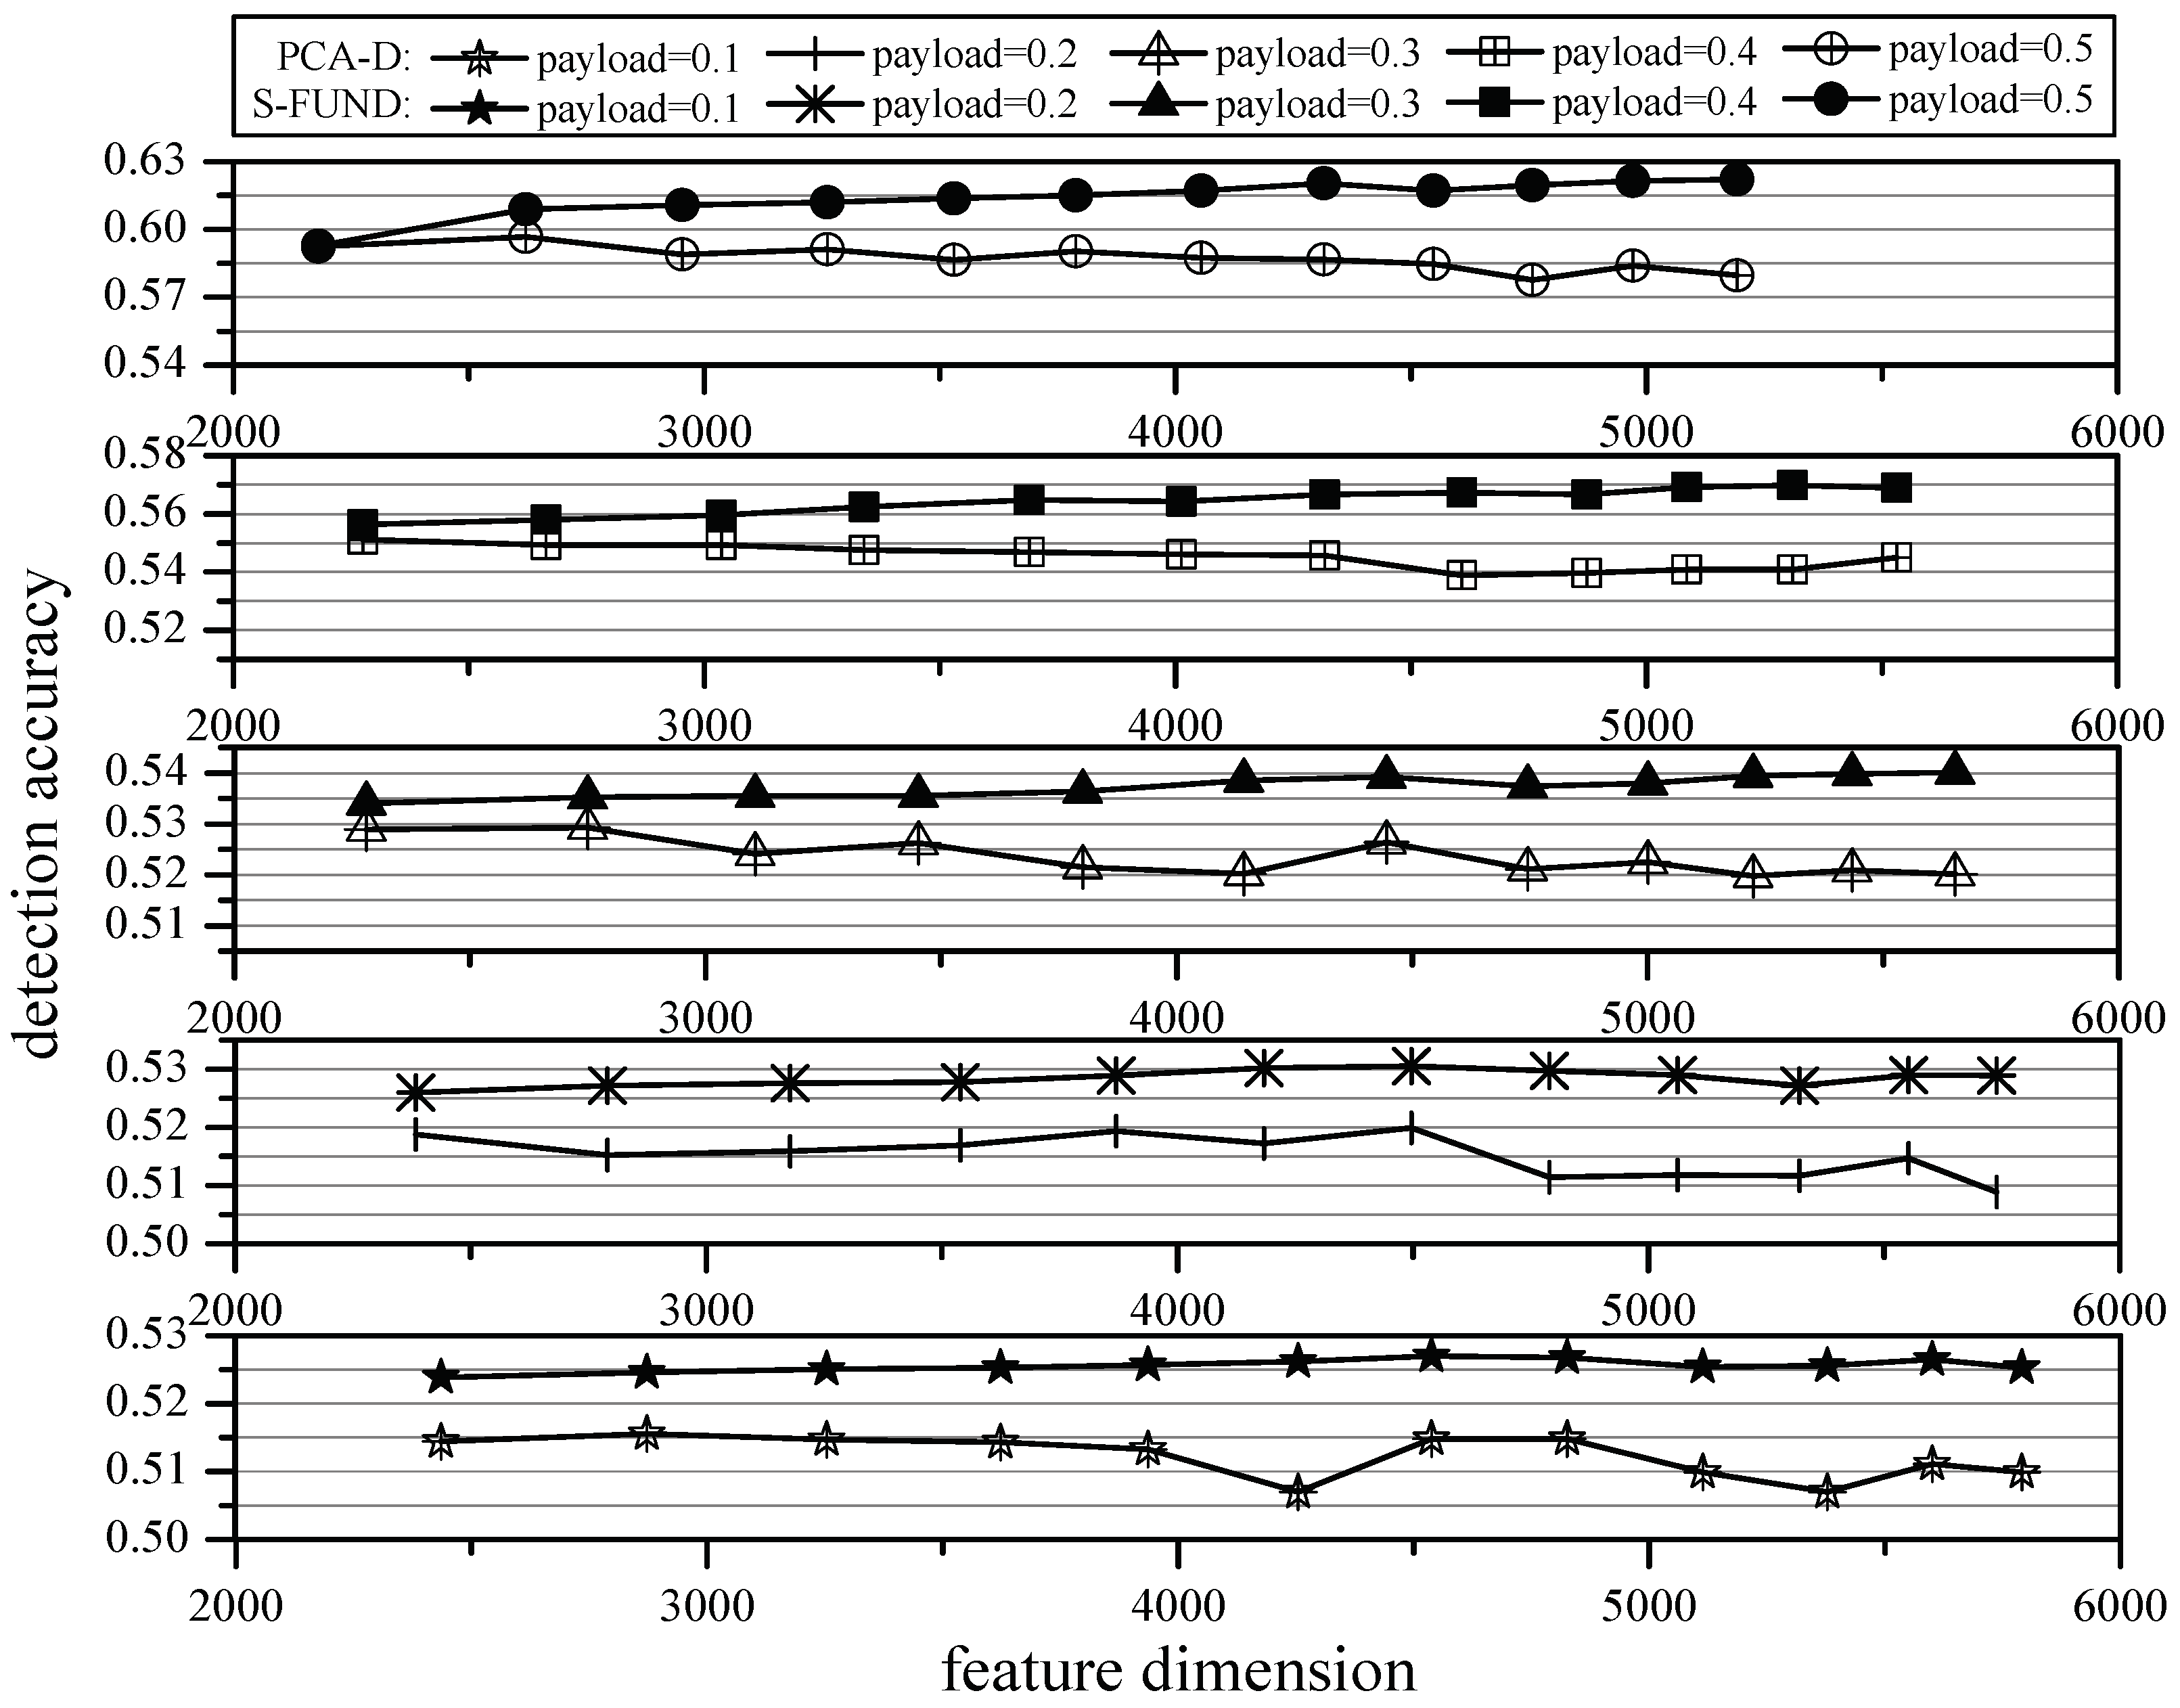
In order to compare more intuitively the effects of the selected features of S-FUND and PCA-D methods for DCTR feature, we created Figure 5 based on Table 6.

Figure 5.
Comparison with PCA-D-method-selected DCTR feature.
In Figure 5, the horizontal axis represents the feature dimension, the vertical axis represents the corresponding detection accuracy, and the five line graphs from top to bottom represent the effects of S-FUND and PCA-D methods for selecting DCTR feature at five different payloads. From Figure 5, it can be seen that the S-FUND method has better detection accuracy than the PCA-D method when the two methods are reduced to the same dimension at different payloads. For example, when payload = 0.1, the feature dimensions selected by the two methods are 5791 and 2435, and the differences in detection accuracy are 1.54% and 0.95%. When payload = 0.3, the feature dimensions selected by the two methods are 5653 and 2280 and the differences in detection accuracy are 2.00% and 0.51%. When payload = 0.5, the feature dimensions selected by the two methods are 5192 and 2621, and the differences in detection accuracy are 4.25% and 1.23%.
6. Discussion
The S-FUND method has also been used in other steganalysis feature selection experiments, such as CC-JRM. Therefore, the method in this paper is a general feature selection method for steganalysis. It is worth mentioning that the contribution of this paper is not only the introduction of distortion and information gain ratio to measure the difference of feature components between the cover and stego images, but also the idea that the two criteria are considered at the same time.
Last but not least, since this work considers the two criteria at the same time, they need to measure the same kind of criteria, that is, they either measure the contribution degree, or both measure the degree of similarity, or both measure redundancy, and so on. The different kinds of criteria in this task force have certain limitations. Regarding the CGSM method and the SRGS method, one involves measuring the similarity between the feature components, and the other measuring the uselessness of the feature component. Such criteria cannot be applied by this paper. In the next work, we are expected to propose a novel method for different kinds of standards. When the kinds of criterion are different, the combination of the these can be carried out—this method considers to combine the similarity between feature components and the value of the component. Among the two feature components with similarity, the component with a small contribution is deleted.
7. Conclusions
In order to effectively reduce the number of DCTR steganalysis feature while maintaining or even improving the detection accuracy of the stego images, this paper proposes a feature selection approach based on distortion factor and information gain ratio. First, the distortion factor and information gain ratio are improved to measure the difference of each steganalysis feature component between the cover and stego images. Second, two measurement values of each feature component are arranged in descending order. Based on the above, the feature components with large different ranking according to the two measurements are deleted. Finally, the preserved feature components are used as the final feature vector. This approach can effectively reduce the DCTR feature dimension while maintaining or even improving the detection accuracy of the stego images, thus reducing the spatial complexity of detecting the stego images. Moreover, by comparing the time complexity of S-FUND method and the selection method that relies on the FLD classifier results, it is demonstrated that the approach in this paper can greatly improve the operational efficiency, thus reducing the time complexity of the classifier to detect the stego images and reducing the cost of detection.
We have conducted a large number of comparison experiments to indicate that DCTR feature selected by S-FUND method substantially reduce the feature dimension while maintaining or even improving the detection accuracy of the stego images. And then, we compared S-FUND method with Random-D, CGSM, and PCA-D methods to indicate that the features selected by S-FUND method are more detection accurate of the stego images. For example, in the comparison experiments with PCA-D method, the features selected by the S-FUND method up to 4.25% more higher than PCA-D method for the stego images.
Author Contributions
Conceptualization, R.J., T.L. and Y.M.; methodology, Y.W.; validation, X.D. and Y.M.; formal analysis, X.D. and T.L.; investigation, Y.W.; resources, Y.W. and Y.M.; data curation, Y.W.; writing—original draft preparation, Y.W.; writing—review and editing, Y.W.; visualization, Y.M.; supervision, R.J. and Y.M.; project administration, R.J.; funding acquisition, R.J. and Y.M. All authors have read and agreed to the published version of the manuscript.
Funding
This work was supported in part by the National Natural Science Foundation of China under Grant (NO.61772176, NO.62002103, NO.61976082), by the Key Scientific and Technological Project of Henan Province under Grant NO.202102210165, by the Training Plan of young backbone teachers in colleges and universities of Henan Province under Grant NO.2017GGJS214, by the Key Scientific Research Project of Henan Provincial Higher Education under Grant (NO.19B510005, NO.20B413004), by the Key Scientific Research (Soft Science) Project of Higher Education Institutions of Henan Province under Grant NO.19A880030, and by the Key R&D and Promotion Special (Soft Science) Project of Henan Province under Grant (NO.202400410088, NO.212400410109).
Conflicts of Interest
The authors declare no conflict of interest.
References
- Fridrich, J.; Pevný, T.; Kodovský, J. Statistically Undetectable JPEG Steganography: Dead Ends, Challenges, and Opportunities. In Proceedings of the 9th ACM Multimedia and Security Workshop, Dallas, TX, USA, 20–21 September 2007; pp. 3–14. [Google Scholar]
- Sarkar, A.; Solanki, K.; Manjunath, B.S. Further Study on YASS: Steganography Based on Randomized Embedding to Resist Blind Steganalysis. In Proceedings of the Security, Forensics, Steganography, and Watermarking of Multimedia Contents X, San Jose, CA, USA, 27–31 January 2008. [Google Scholar]
- Sachnev, V.; Kim, H.J.; Zhang, R.Y. Less Detectable JPEG Steganography Method Based on Heuristic Optimization and BCH Syndrome Coding. In Proceedings of the 11th ACM Workshop on Multimedia and Security, Princeton, NJ, USA, 7–8 September 2009; p. 131. [Google Scholar]
- Filler, T.; Fridrich, J. Gibbs Construction in Steganography. IEEE Trans. Inf. Forensics Secur. 2010, 5, 705–720. [Google Scholar] [CrossRef] [Green Version]
- Holub, V.; Fridrich, J. Designing Steganographic Distortion Using Directional Filters. In Proceedings of the IEEE Workshop on Information Forensic and Security, Costa Adeje, Spain, 2–5 December 2012. [Google Scholar]
- Holub, V.; Fridrich, J.; Denemark, T. Universal Distortion Function for Steganography in an Arbitrary Domain. EURASIP J. Inf. Secur. 2014, 1, 1–13. [Google Scholar] [CrossRef] [Green Version]
- Liao, X.; Yu, Y.B.; Li, B. A New Payload Partition Strategy in Color Image Steganography. IEEE Trans. Circuits Syst. Video Technol. 2020, 30, 685–696. [Google Scholar] [CrossRef]
- Sedighi, V.; Cogranne, R.; Fridrich, J. Content-Adaptive Steganography by Minimizing Statistical Detectability. IEEE Trans. Inf. Forensics Secur. 2016, 11, 221–234. [Google Scholar] [CrossRef] [Green Version]
- Luo, W.Q.; Huang, F.J.; Huang, J.W. Edge Adaptive Image Steganography Based on LSB Matching Revisited. IEEE Trans. Inf. Forensics Secur. 2010, 5, 201–214. [Google Scholar]
- Lu, W.; Chen, J.J.; Zhang, J.H. Secure Halftone Image Steganography Based on Feature Space and Layer Embedding. IEEE Trans. Cybern. 2020, 99, 1–14. [Google Scholar] [CrossRef] [PubMed]
- Cheddad, A.; Condell, J.; Curran, K. Digital Image Steganography: Survey and Analysis of Current Methods. Signal Process. 2010, 90, 727–752. [Google Scholar] [CrossRef] [Green Version]
- Qin, C.; Chang, C.C.; Huang, Y.-H. An Inpainting-Assisted Reversible Steganographic Scheme Using a Histogram Shifting Mechanism. IEEE Trans. Circuits Syst. Video Technol. 2013, 23, 1109–1118. [Google Scholar] [CrossRef]
- Filler, T.; Judas, J.; Fridrich, J. Minimizing Additive Distortion in Steganography Using Syndrome-Trellis Codes. IEEE Trans. Inf. Forensics Secur. 2011, 6, 920–935. [Google Scholar] [CrossRef] [Green Version]
- Fridrich, J.; Goljan, M.; Lisonek, P. Writing on Wet Paper. IEEE Trans. Signal Process. 2005, 53, 3923–3935. [Google Scholar] [CrossRef]
- Zhang, R.; Zhu, F.; Liu, J. Depth-Wise Separable Convolutions and Multi-Level Pooling for an Efficient Spatial CNN-Based Steganalysis. IEEE Trans. Inf. Forensics Secur. 2020, 15, 1138–1150. [Google Scholar] [CrossRef]
- Ye, J.; Ni, J.Q.; Yi, Y. Deep Learning Hierarchical Representations for Image Steganalysis. IEEE Trans. Inf. Forensics Secur. 2017, 12, 2545–2557. [Google Scholar] [CrossRef]
- Avcibas, I.; Memon, N.; Sankur, B. Steganalysis Using Image Quality Metrics. IEEE Trans. Image Process. 2003, 12, 221–229. [Google Scholar] [CrossRef] [Green Version]
- Li, Z.Y.; Bors, A.G. Selection of Robust and Relevant Features for 3-D Steganalysis. IEEE Trans. Cybern. 2020, 50, 1989–2001. [Google Scholar] [CrossRef] [PubMed] [Green Version]
- Denemark, T.; Boroumand, M.; Fridrich, J. Steganalysis Features for Content-Adaptive JPEG Steganography. IEEE Trans. Inf. Forensics Secur. 2016, 11, 1747–1757. [Google Scholar] [CrossRef]
- Luo, X.Y.; Liu, F.L.; Lian, S.G. On the Typical Statistic Features for Image Blind Steganalysis. IEEE J. Sel. Areas Commun. 2011, 29, 1404–1422. [Google Scholar] [CrossRef]
- Ker, A. Steganalysis of LSB Matching in Grayscale Images. IEEE Signal Process. Lett. 2005, 12, 441–444. [Google Scholar] [CrossRef] [Green Version]
- Lyu, S.; Farid, H. Steganalysis Using Higher-order Image Statistics. IEEE Trans. Inf. Forensics Secur. 2006, 1, 111–119. [Google Scholar] [CrossRef]
- Holub, V.; Fridrich, J. Random Projections of Residuals for Digital Image Steganalysis. IEEE Trans. Inf. Forensics Secur. 2013, 8, 1996–2006. [Google Scholar] [CrossRef]
- Lie, W.; Lin, G. A Feature-based Classification Technique for Blind Image Steganalysis. IEEE Trans. Multimed. 2005, 7, 1007–1020. [Google Scholar]
- Sullivan, K.; Madhow, U.; Chandrasekaran, S. Steganalysis for Markov cover data with applications to images. IEEE Trans. Inf. Forensics Secur. 2006, 1, 275–287. [Google Scholar] [CrossRef]
- Yuan, C.S.; Xia, Z.H.; Sun, X.M. Coverless Image Steganography Based on SIFT and BOF. J. Internet Technol. 2017, 18, 437–442. [Google Scholar]
- Holub, V.; Fridrich, J. Low Complexity Features for JPEG Steganalysis Using Undecimated DCT. IEEE Trans. Inf. Forensics Secur. 2015, 10, 219–228. [Google Scholar] [CrossRef]
- Song, X.F.; Liu, F.L.; Yang, C.F. Steganalysis of Adaptive JPEG Steganography Using 2D Gabor Filters. In Proceedings of the 3rd ACM Workshop on Information Hiding and Multimedia Security, Portland, OR, USA, 17–19 June 2015; pp. 15–23. [Google Scholar]
- Kodovský, J.; Fridrich, J. Steganalysis of JPEG Images Using Rich Models. In Proceedings of the SPIE, Electronic Imaging, Media Watermarking, Security, and Forensics XIV, Burlingame, CA, USA, 22–26 January 2012. [Google Scholar]
- Fridrich, J.; Kodovský, J. Rich Models for Steganalysis of Digital Images. IEEE Trans. Inf. Forensics Secur. 2012, 7, 868–882. [Google Scholar] [CrossRef] [Green Version]
- Pevný, T.; Fridrich, J. Merging Markov and DCT Features for Multiclass JPEG Steganalysis. In Proceedings of the SPIE, Electronic Imaging, Security, Steganography, and Watermarking of Multimedia Contents IX, San Jose, CA, USA, 28 January–1 February 2007; pp. 1–14. [Google Scholar]
- Kodovský, J.; Fridrich, J. Calibration Revisited. In Proceedings of the 11th ACM Multimedia and Security Workshop, Princeton, NJ, USA, 7–8 September 2009; pp. 63–74. [Google Scholar]
- Qin, J.H.; Sun, X.M.; Xiang, X.Y. Principal Feature Selection and Fusion Method for Image Steganalysis. J. Electron. Imaging 2008, 18, 033009. [Google Scholar]
- Ma, Y.Y.; Luo, X.Y.; Li, X.L. Selection of Rich Model Steganalysis Features Based on Decision Rough Set α-Positive Region Reduction. IEEE Trans. Circuits Syst. Video Technol. 2019, 29, 336–350. [Google Scholar] [CrossRef]
- Wang, Y.H.; Ma, Y.Y.; Jin, R.X.; Liu, P.; Ruan, N. Comprehensive Criteria-Based Generalized Steganalysis Feature Selection Method. IEEE Access 2020, 8, 154418–154435. [Google Scholar] [CrossRef]
- Yang, C.F.; Zhang, Y.; Wang, P. Steganalysis Feature Subspace Selection Based on Fisher Criterion. In Proceedings of the IEEE International Conference on Data Science and Advanced Analytics, Tokyo, Japan, 19–21 October 2017; pp. 514–521. [Google Scholar]
- Yu, X.Q.; Ma, Y.Y.; Jin, R.X.; Xu, L.G.; Duan, X.T. A multi-scale Feature Selection Method for Steganalytic Feature GFR. IEEE Access 2020, 8, 55063–55075. [Google Scholar] [CrossRef]
- Ortega, A.; Ramchandran, K. Rate-distortion Methods for Image and Video Compression. IEEE Signal Process. Mag. 2002, 15, 23–50. [Google Scholar] [CrossRef]
- Dai, J.H.; Xu, Q. Attribute Selection Based on Information Gain Ratio in Fuzzy Rough Set Theory with Application to Tumor Classification. Appl. Soft Comput. 2013, 13, 211–221. [Google Scholar] [CrossRef]
- Kodovský, J.; Fridrich, J.; Holub, V. Ensemble Classifiers for Steganalysis of Digital Media. IEEE Trans. Inf. Forensics Secur. 2012, 7, 432–444. [Google Scholar] [CrossRef] [Green Version]

Publisher’s Note: MDPI stays neutral with regard to jurisdictional claims in published maps and institutional affiliations. |
© 2021 by the authors. Licensee MDPI, Basel, Switzerland. This article is an open access article distributed under the terms and conditions of the Creative Commons Attribution (CC BY) license (https://creativecommons.org/licenses/by/4.0/).