1. Introduction
In human beings, the left and right hemispheres have a high percentage of anatomical and functional asymmetry [
1]. Since the 19th century, different studies have discovered that there is an asymmetry in the processing of sensory information between both cerebral hemispheres, resulting in lateralization in specific cognitive tasks and asymmetry of behavioral characteristics, such as handedness, auditory preference, and physical exercise [
2,
3]. One of the first discoveries of brain anatomical asymmetry was in the left and right Sylvian fissures [
4]. A significant asymmetry in Planum Temporale, probably related to language processing, has also been shown [
5].
In the visual system, an asymmetry of visual processing has been observed. Most human beings have a dominant eye, with a greater preference in the processing of visual stimuli, which may be caused by gene expression, environmental factors, or the asymmetry of the visual cortex [
5,
6]. It has also been observed that in convergence eye movements, the responses are asymmetric between the dominant eye and the non-dominant eye, both in maximum speed and in mean maximum latency [
7].
The study of eye movements has been the subject of multiple investigations over the years, since it allows us to analyze the qualitative and quantitative characteristics of eye motion. The quality of the eye movements gives us an idea of the state of the muscles, nerves and brain nuclei responsible for its functionality [
8]. So, the analysis of eye movements may provide useful information for the diagnosis of disease or degeneration of those structures. More recently, monitoring eye movements has been used to control electronic devices through human–computer interfaces [
9]. The analysis of eye movements has further allowed the study of psychophysiological and behavioral characteristics of some professionals, such as drivers or pilots [
10,
11].
Eye movements can be classified into three broad groups [
12]. The first group includes movements for maintaining gaze. They include the Vestibulo–Ocular Reflex (VOR) and the Optokinetic Reflex (OKR). These are involuntary movements, known as nystagmus, as an alternate eye rotation, fast in one direction and slow in the opposite direction. During VOR, the eyes compensate for the rotational movement of the head. This is an involuntary movement that originates from the vestibular system. It consists of a slow-phase eye rotation in the opposite direction of the head rotation, followed by a fast-phase (400 °/s) eye rotation in the same direction of head rotation. The OKR allows the eyes to compensate for displacement of the visual field to maintain the gaze. It is also an involuntary and reflex movement. The eyeball moves slowly (60 °/s) in the same direction of visual field displacement and rapidly in the opposite direction [
13]. A second group of eye movements allows the displacement of the gaze for searching purposes. These eye displacements may be saccadic movements, pursuing movements, and vergencies. The saccadic movement allows the abrupt change of fixation on an object that appears suddenly in the visual field. It is voluntary, with a maximum amplitude of 30°, reaching a speed of 700 °/s [
14]. The pursuit movement is also voluntary in nature, and it allows the simultaneous fixation of the fovea of each eye on an object that moves through the visual field. It has an ideal speed of 15–30 °/s and a maximum of 100 °/s [
15]. Saccadic movements correct the deviation from persecution movements, compensating each other [
16]. The second group of eye movements also includes vergencies (convergence and divergence). These voluntary movements allow the change of the anteroposterior axis of the eyeball in the horizontal plane in order to align the fovea on near or far objects, decreasing (convergence) or increasing (divergence) the angle formed by the eyes’ axis. A third group of “micromovements” or physiological nystagmus could be described [
17]. When we keep our gaze fixed on one point, both eyes suffer an involuntary movement of small amplitude (less than 1°), which allows the continuous stimulation of the photoreceptors and avoids fading phenomenon due to saturation of photoreceptors [
18].
Over the years, different techniques have been developed for the analysis and quantification of eye movements [
19]. Currently, the measurement of eye movements may be explored by electrooculography techniques, by infrared light refection devices, by means of a magnetic tracking coil, or by video-oculography [
20]. Of all the methods used for monitoring eye movements, perhaps one of the most widely used is Electro-oculography (EOG) [
14,
20]. In the human eye, there is a difference in electrical potential between the anterior corneal pole (positive charge) and the posterior retinal pole (negative charge), resulting in an anteroposterior dipole of the eyeball [
21]. The electric dipole is an indirect measure of the Transepithelial Potential (TEP) of the Retinal Pigment Epithelium (RPE), which is determined by the potential difference between the basolateral and apical membrane of the pigment epithelial cells [
22]. The EOG is an electrophysiological test that allows the recording of the changes in electrical potential between the cornea and the retina, and the amplitude of the potential changes with the magnitude and speed of visual excursion [
23]. Through EOG recording, it is possible to measure eye movement in more than two directions simultaneously. The EOG is an objective method that allows detection of eye movement of high amplitude of up to ±70 degrees with an accuracy of 1.5–2 degrees [
24]. It also allows eye movement to be evaluated with eyes closed. The main drawback is that head movement and the surrounding electric fields may affect the quality of the recording, so when this technique is used, it is necessary to isolate the surrounding electric fields environment [
25].
Despite the large number of scientific works on ocular motility, to date there has been no systematic study that allows us to know whether electrooculographic responses are similar in both eyes despite ocular dominance in many humans.
For these reasons, the present work aims to study the electrooculographic stimulation parameters in terms of directionality, linear and angular velocity, and state of adaptation to light/dark that allows us to determine the possible interocular differences in visual function.
2. Materials and Methods
2.1. Participants
The study has been carried out in 10 healthy subjects (5 women and 5 men) without ophthalmological diseases (mean of 24.2 ± 4.5 years of age). If necessary, participants used appropriate refractive correction for the test distance. Each participant signed an informed consent of the type of study to be carried out.
2.2. Light Stimulation Procedure
To carry out the electrooculogram, protocols were adapted from the International Society for Clinical Electrophysiology of Vision (ISCEV) guidelines [
22]. The volunteer was sitting in front of a flat stimulating screen. For horizontal and vertical stimulation experiments, the visual angle with respect to the screen was 30° in the horizontal axis (15° on each side, right or left) and 30° in the vertical axis (15° up and down). For the rotational experiments, the visual angle with respect to the screen is 10° (5° on each side, right, left, top and bottom) by adjusting the distance from the subject to the display.
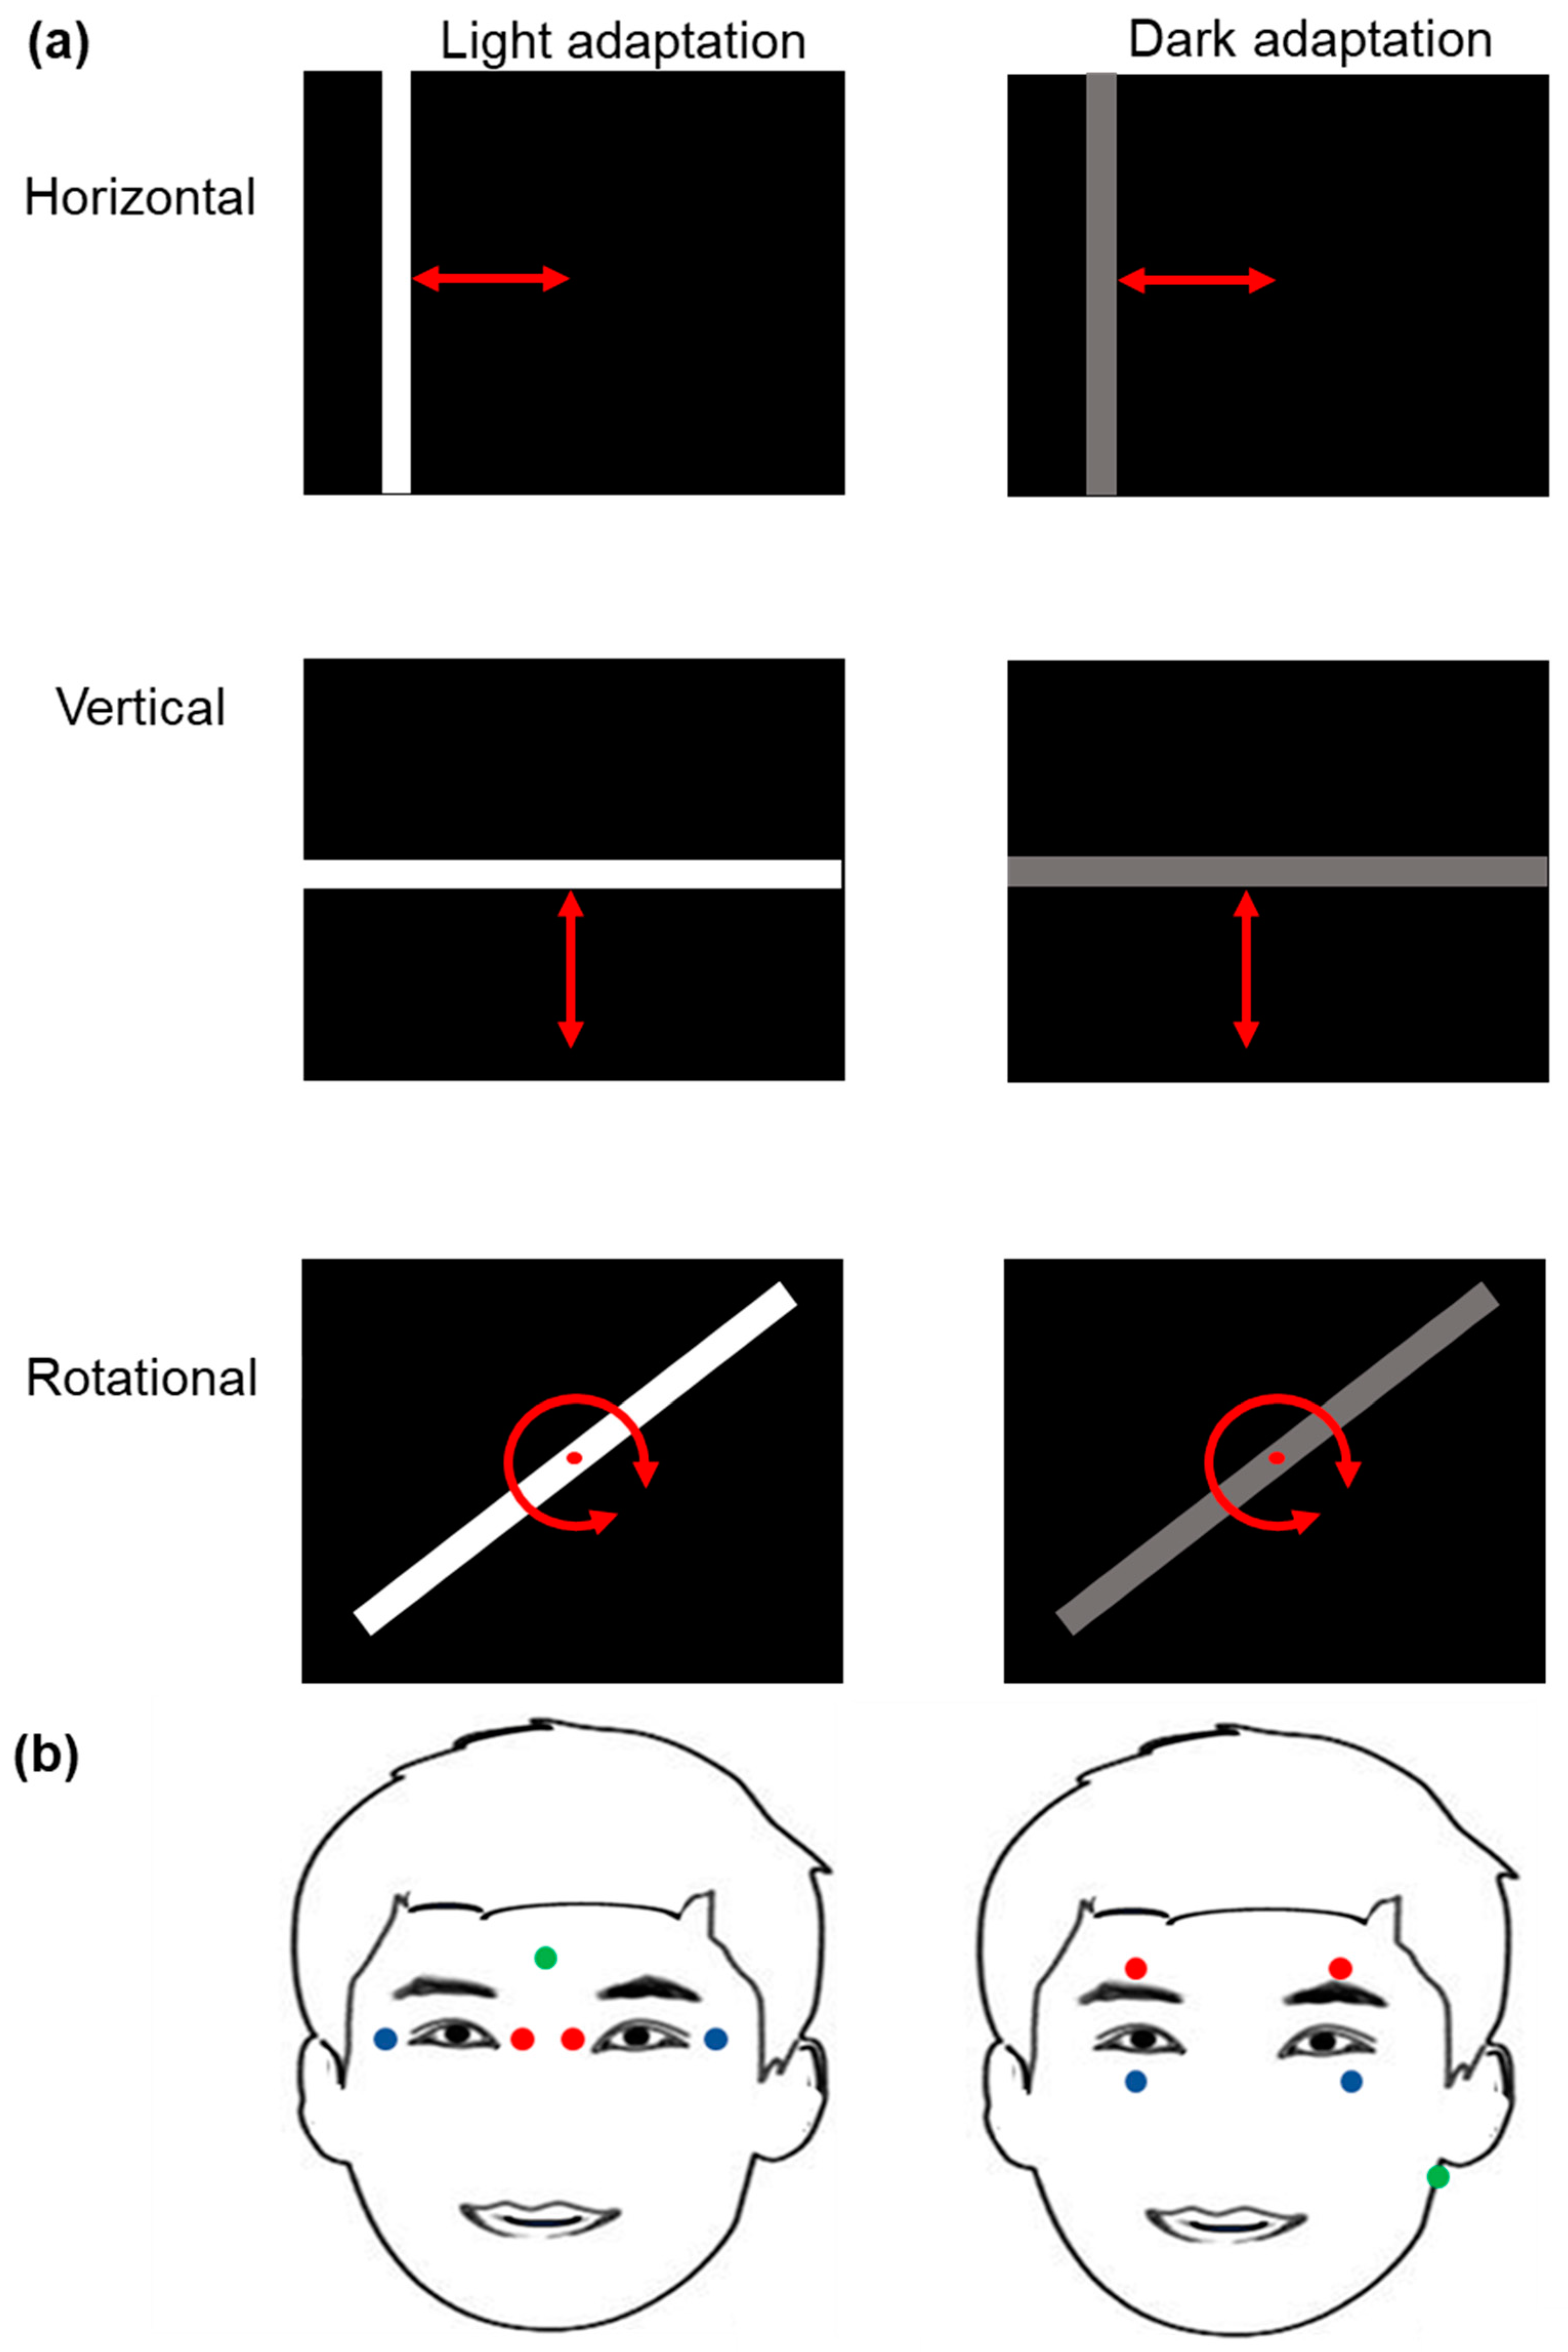
Light stimulation was applied from a computer screen (Dell, Vostro 3550, 1366 × 768 pixels) programmed by a self-made software based on Python software (Python 2.5.4. Python Software Foundation). The stimulating parameter set included white bars on a black background for light adaptation, and gray bars on a black background for dark adaptation. The width of the bars was set as 2 degrees and the length was adjusted to 30 degrees in horizontal and vertical movements, while in rotary movements, the width of the bars was set as 0.6 degrees and the length was 10 degrees. The movement of the white/gray bars was adjusted to a vertical (from top to bottom and vice versa), horizontal (from left to right and vice versa), or rotational (clockwise or counterclockwise) displacement.
In the horizontal movement, the bar consists of a smooth sweep in one direction, from left to right or right to left. Then, an immediate jump back to repeat the same left to right sweep (or right to left). Additionally, in the vertical movement, the bar consists of a smooth sweep from top to bottom (or bottom to top), then an immediate jump back to repeat the same top to bottom (or bottom to top). The temporal frequency of 0.2, 0.3, 1, 2, 3, or 10 Hz refers to the angular velocity of a smooth sweep at 6, 10, 30, 60, 100, or 300 degrees per second, respectively. Participants do not have a special fixation point, since they need to fix at the edge of the bar in horizontal and vertical movement.
In the rotary movement, the stimulus consists of a clockwise smooth bar rotation (or counterclockwise smooth bar rotation); the temporal frequency of 0.2, 0.3, 1, or 2 Hz refers to the angular velocity of 72, 120, 360, or 720 degrees per second, respectively. The participant can choose one end of the bar as a fixation point to follow. Additionally, the eye uses a combination of vertical and horizontal movement when exposed to the rotational stimulus.
For the experiments carried out under light adaptation, white bars with a luminosity of 500 cd/m
2 on a dark background of 3 cd/m
2 were used. For the experiments carried out under dark adaptation, the luminosity of the gray bar was 90 cd/m
2 on a dark background of 3 cd/m
2 (
Figure 1a). All light intensities were measured by a commercial photometer (GO 4068 Gossen Mavo-monitor USB, Gossen Corporation, Milwaukee, WI, USA).
2.3. Electro-Oculography Signal Recording
After cleaning the skin surface with alcohol, disposable contact surface electrodes of 0.5 cm diameters (conductive adhesive hydrogel, Covidien Ireland limited, IDA Business & Technology Park, Tullamore, Ireland) were placed in the lateral and medial positions to the optical edge of each eye for horizontal electrooculogram (
Figure 1b). For the recording of vertical and rotational electrooculograms, the electrodes were placed above and below the orbit of each eye (
Figure 1b). The ground electrodes were arranged, respectively, in the frontal region and the left mastoid apophysis.
Experimental protocol in each volunteer consists of two phases. Initially, after 15 min pre-adaptation to ambient light (70 cd/m2), electrooculogram recordings were performed for the different stimulation protocols (white bars, different directions/rotation, various temporal frequencies, light adaptation). Then, the room light was switched off, and after 15 min of complete darkness, the electrooculogram recording experiments were carried out again to different stimulation protocols (gray bars, different directions/rotation, various temporal frequencies, dark adaptation). Each protocol was repeated 10 times in each adaptation condition for each participant. During the whole protocol, the participants were asked to blink as little as possible and try to follow the bar on the screen without moving their head.
Every two repetitions, a time of 30 s of rest was left for relaxing. After finishing the experiment, the electrodes were removed, and the skin was cleaned.
The electrooculogram signals were digitized (1 KHz) and stored using the PowerLab recording system (PowerLab, AD Instruments Ltd: Dunedin, New Zealand, Model 4/30), using the Labchart® software (Labchart 7, AD Instruments) and analyzed offline.
2.4. Quantitative and Statistical Analysis
The amplitude of electrooculogram signals of 3 successive waves was averaged from the 10 repetitions of each stimulating protocol.
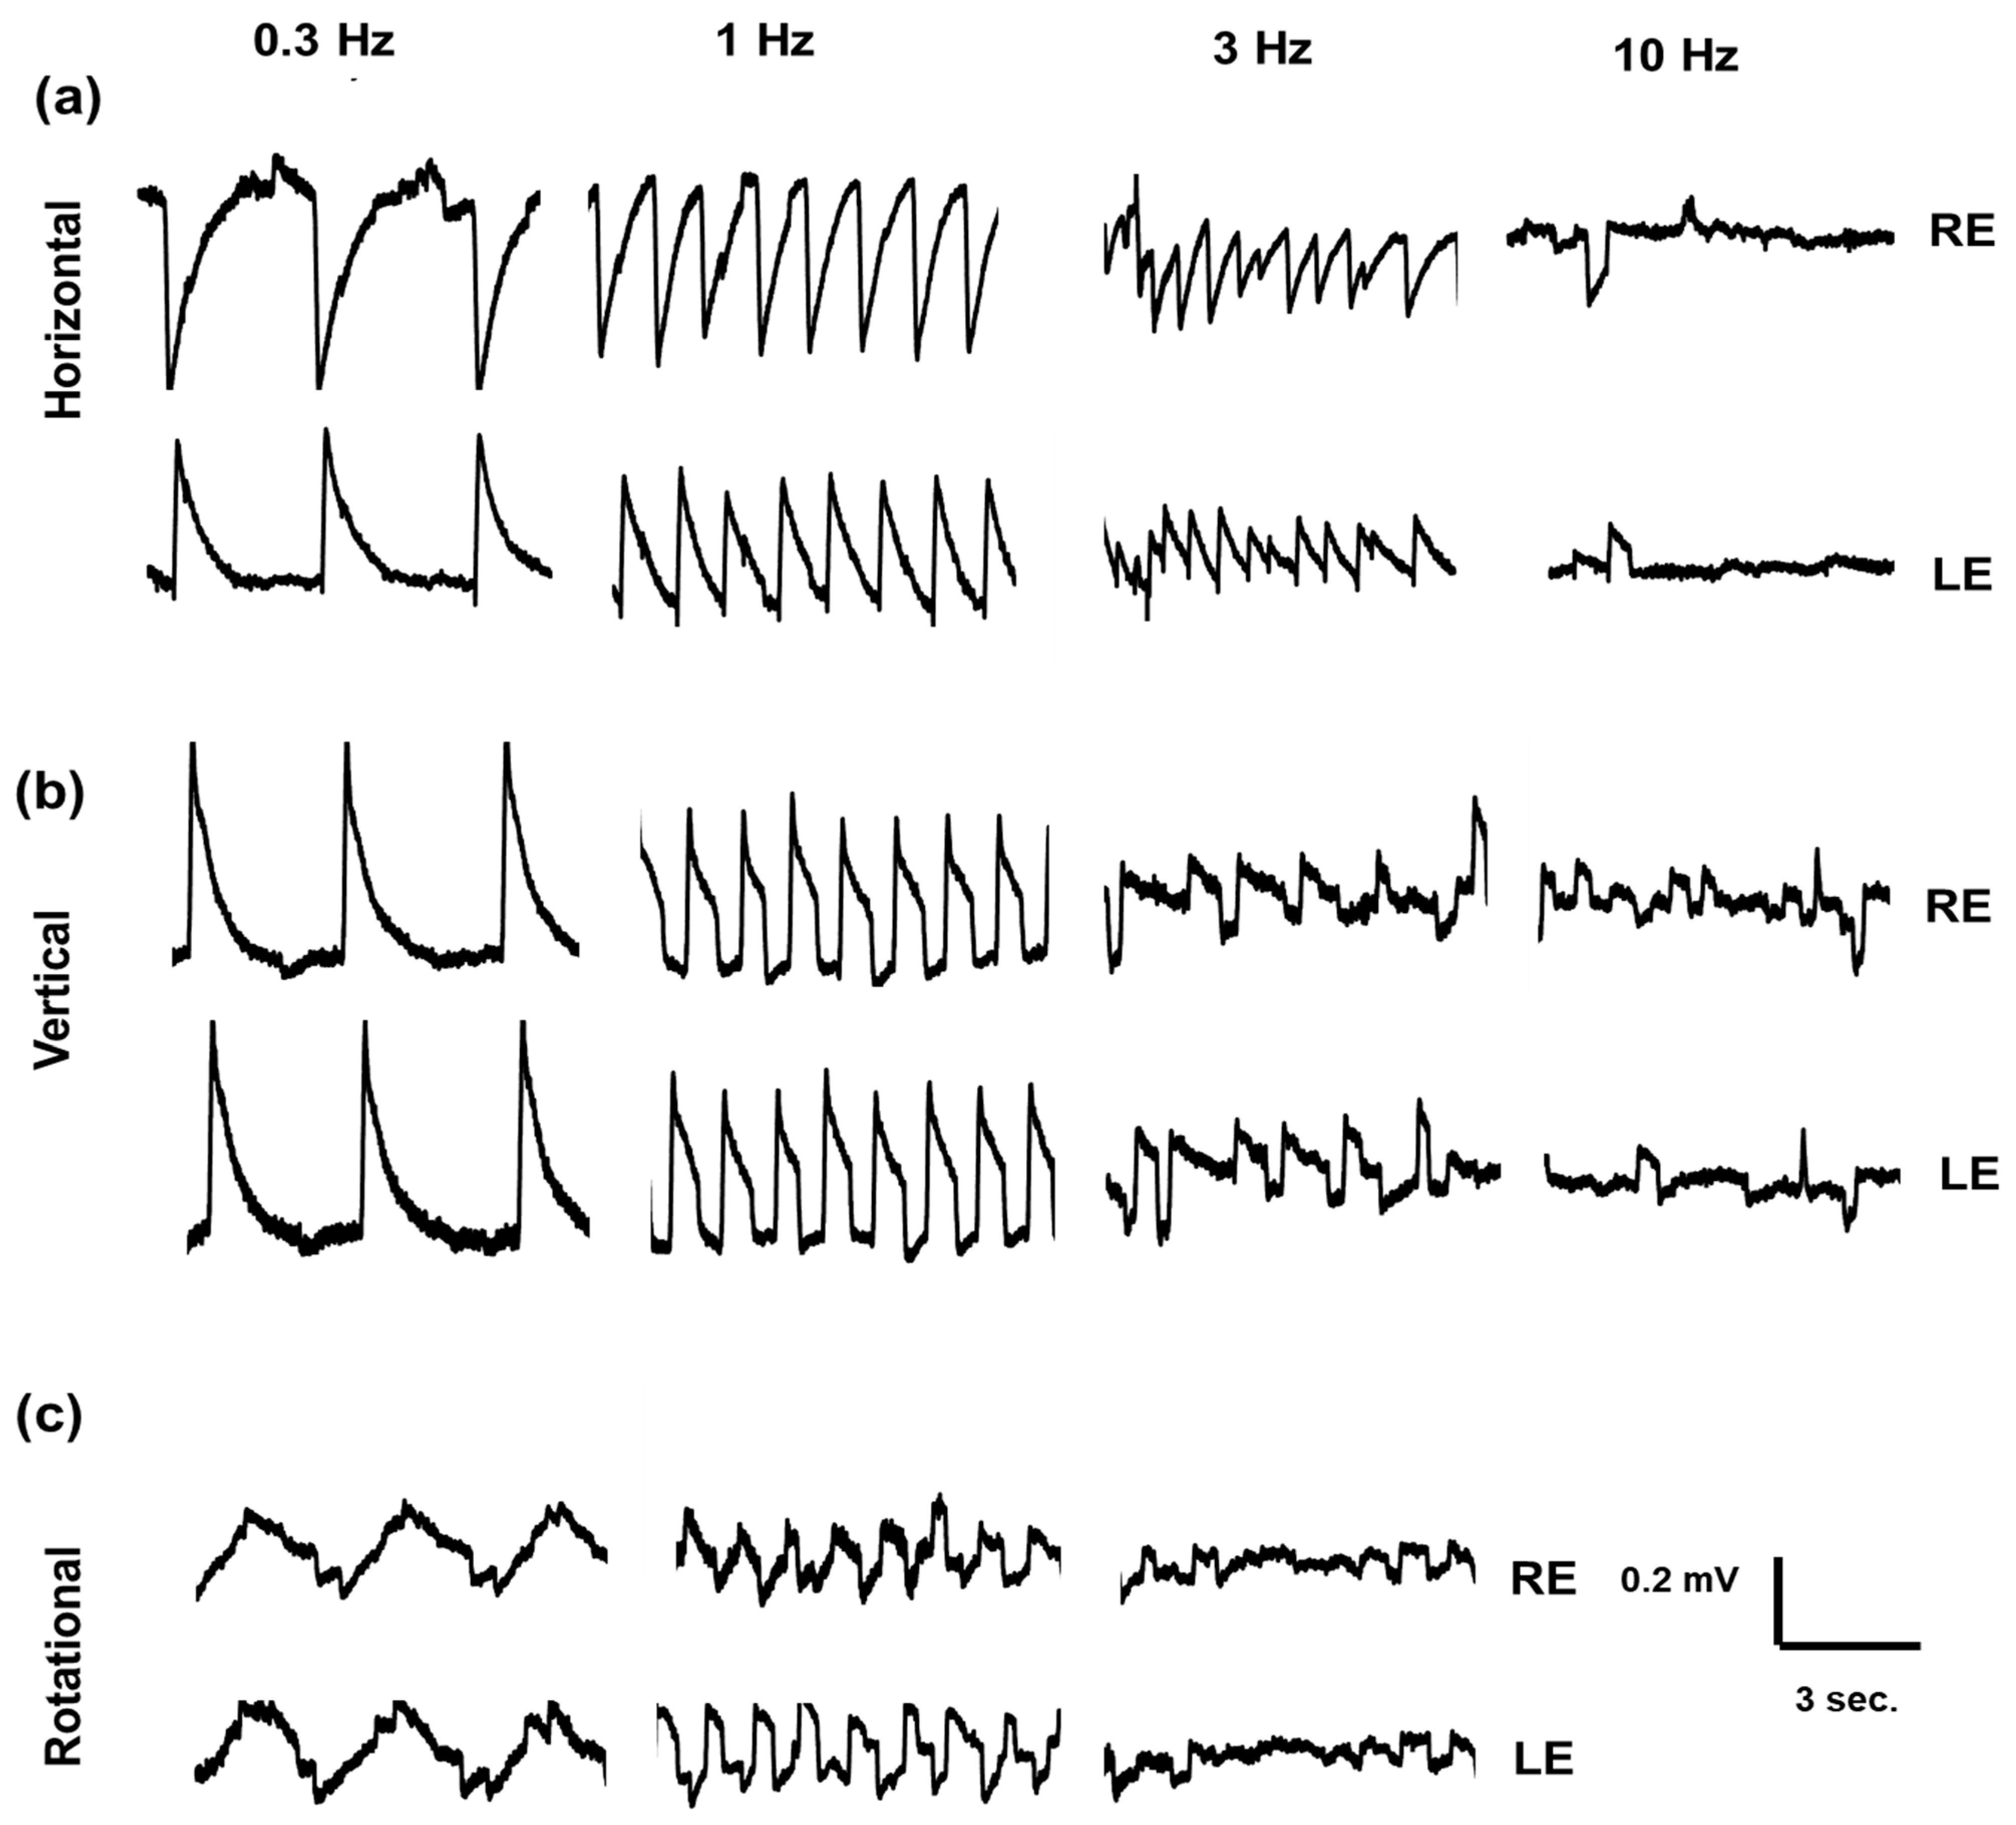
Figure 2 shows examples of the electrooculogram recordings obtained from a healthy volunteer, in response to horizontal, vertical, and rotational stimulation protocols.
The quantitative analysis was carried out using Excel software. All the amplitude values are shown as mean ± Standard Error of the Mean (
± SEM) and were compared using a paired Student
t-test. The Gaussian distribution of the data was tested by the Kolmogorov–Smirnov test, and we confirmed that the data fit a normal distribution. To study changes in EOG amplitudes under different intensities and frequencies, two-way ANOVA (two-tail) with a post hoc test was used. Statistical analyses were performed with GraphPad Prism version 5.00 for Windows (Graph Pad Software, San Diego, CA, USA,
www.graphpad.com (accessed on 7 December 2020)).
3. Results
Electrooculogram recording experiments were carried out at temporal frequencies of 0.2, 0.3, 1, 2, 3, and 10 Hz. To carry out these experiments, a white bar on a black background moved on the screen under light adaptation and a gray bar on a black background moved on the screen under dark adaptation for linear (horizontal and vertical) and rotational displacements.
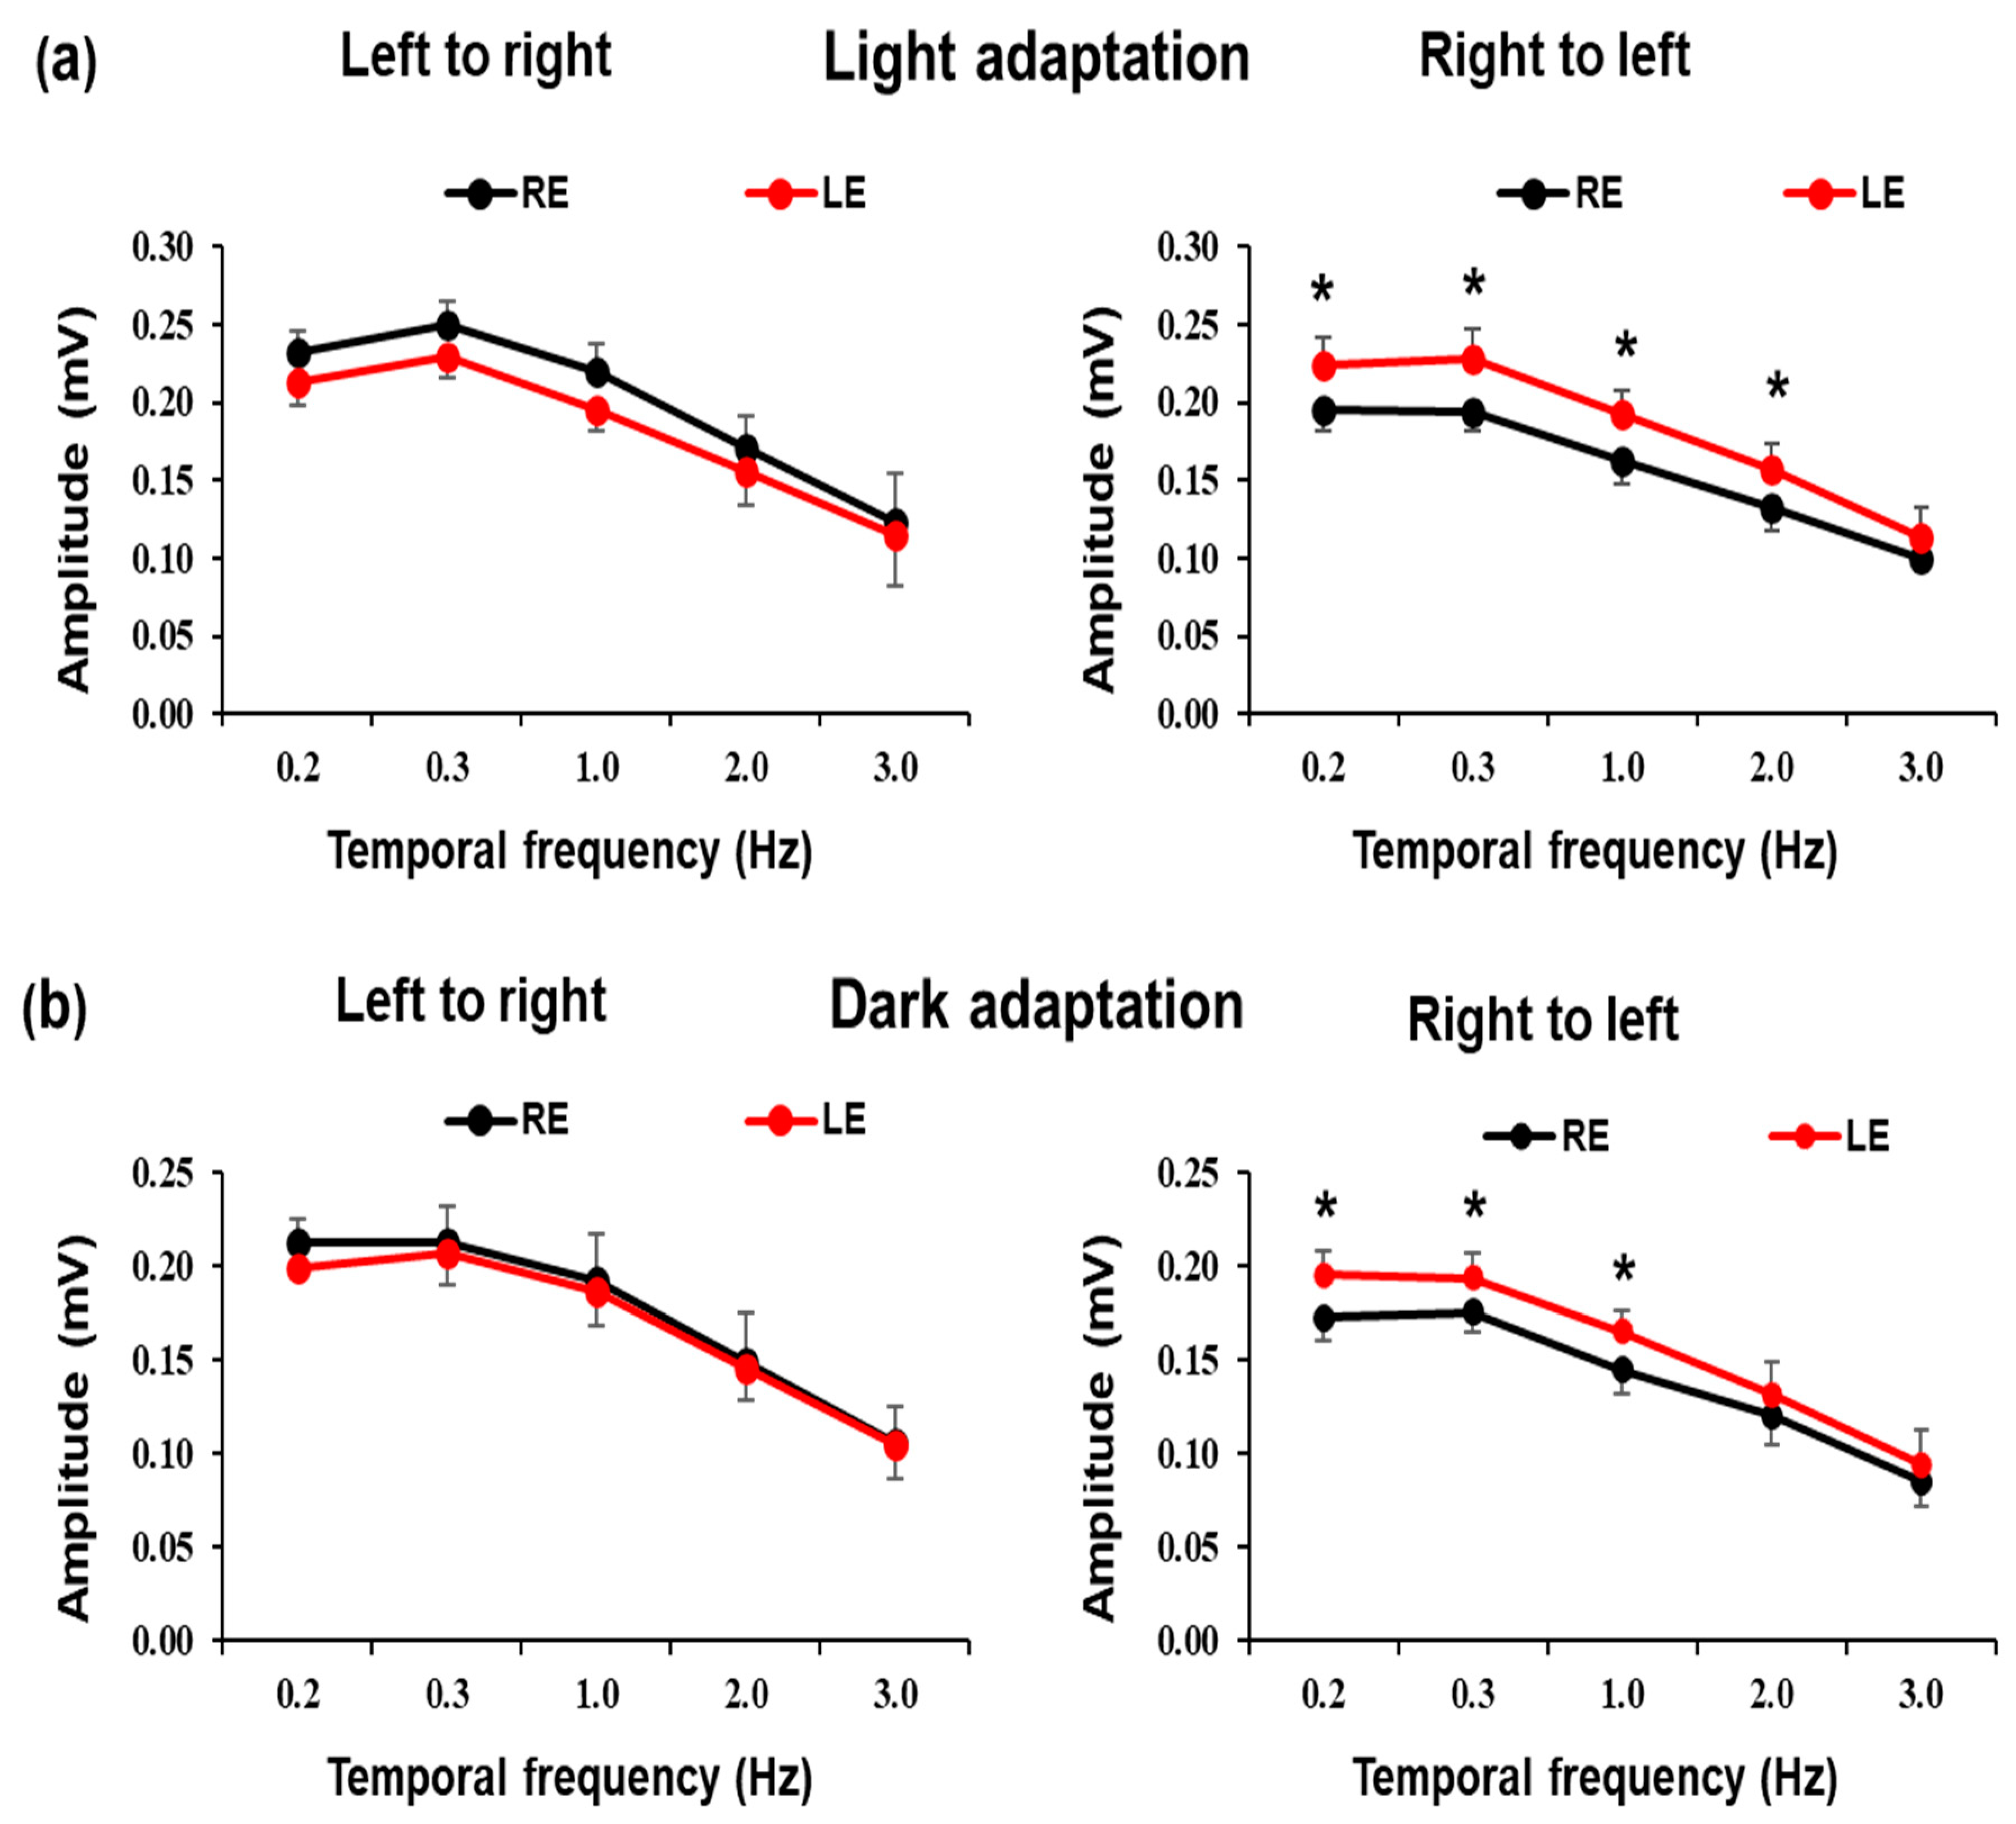
In a first experimental series, a comparative analysis of the EOG responses was carried out between the left and right eyes (
Figure 3). The figure shows the averaged values of EOG recording amplitudes to a stimulus consisting of a white bar on a black background that moved in horizontal directions (right to left, left to right) under light adaptation conditions at different temporal frequencies. It is also shown in
Figure 3 the EOG response amplitudes to a stimulus consisting of a gray bar on a black background that moved in horizontal directions (right to left, left to right) under dark adaptation at different temporal frequencies. The records of both eyes were carried out simultaneously. The amplitude of the electrooculogram is averaged (
± SEM) from the 10 healthy volunteer participants. Statistically significant differences (*
p < 0.05; Student
t-test) were observed between the EOG amplitudes of the left eye and right eye for horizontal displacement from right to left, but no significant differences were observed between the EOG amplitudes of the left eye and the right eye (
p > 0.05; Student
t-test) in horizontal displacement from left to right either in light or dark adaptation.
Table 1 shows the averaged values (
± SEM) of the 10 healthy volunteers from all the performed experiments. The table includes data for a white bar on a black background moving on the screen under light adaptation, and also for a gray bar on a black background moving on the screen under dark adaptation, for linear (horizontal and vertical) and rotational displacements at different temporal frequencies.
Statistically significant differences (* p < 0.05; Student t-test) were observed between the EOG amplitudes of the left eye and right eye for horizontal movements (right to left), but no statistically significant differences were observed between the EOG amplitudes of the left eye and the right eye (p > 0.05; Student t-test) in horizontal (left to right), vertical, or rotational eye movements either under light or dark adaptation.
Statistical analyses were performed with GraphPad Prism version 5.00. The importance of differences between the left and right eyes at the same time frequency was determined using the paired Student t-test.
From these results, we summarize that when horizontal stimuli are used, and the displacement of the bar is from left to right, the amplitude of the EOG response is equal between the left and right eyes. Additionally, when the stimuli move from right to left, the left eye has a greater amplitude than the right eye (p < 0.05; Student t-test) at almost all different temporal frequencies tested. However, for vertical and rotational movements, the amplitude of the EOG response is similar between the left and right eyes.
We further analyze if there were significant differences or asymmetry between vertical, horizontal, and rotational responses. For such purposes, amplitude responses were averaged from the left and right eyes. Statistically significant differences were observed between results obtained for vertical displacement (0.281 ± 0.015 mV at 0.3 Hz, up to down), when compared with horizontal (0.211 ± 0.012 mV at 0.3 Hz, right to left) or rotational (0.132 ± 0.007 mV at 0.3 Hz, clockwise) stimuli (
p < 0.05; Student
t-test). Statistically significant differences were also observed between results obtained for horizontal displacement and rotational stimuli (see
Table 2) (
p < 0.05; student
t-test).
Table 2 shows the averaged values from both eyes (
± SEM) for each experiment.
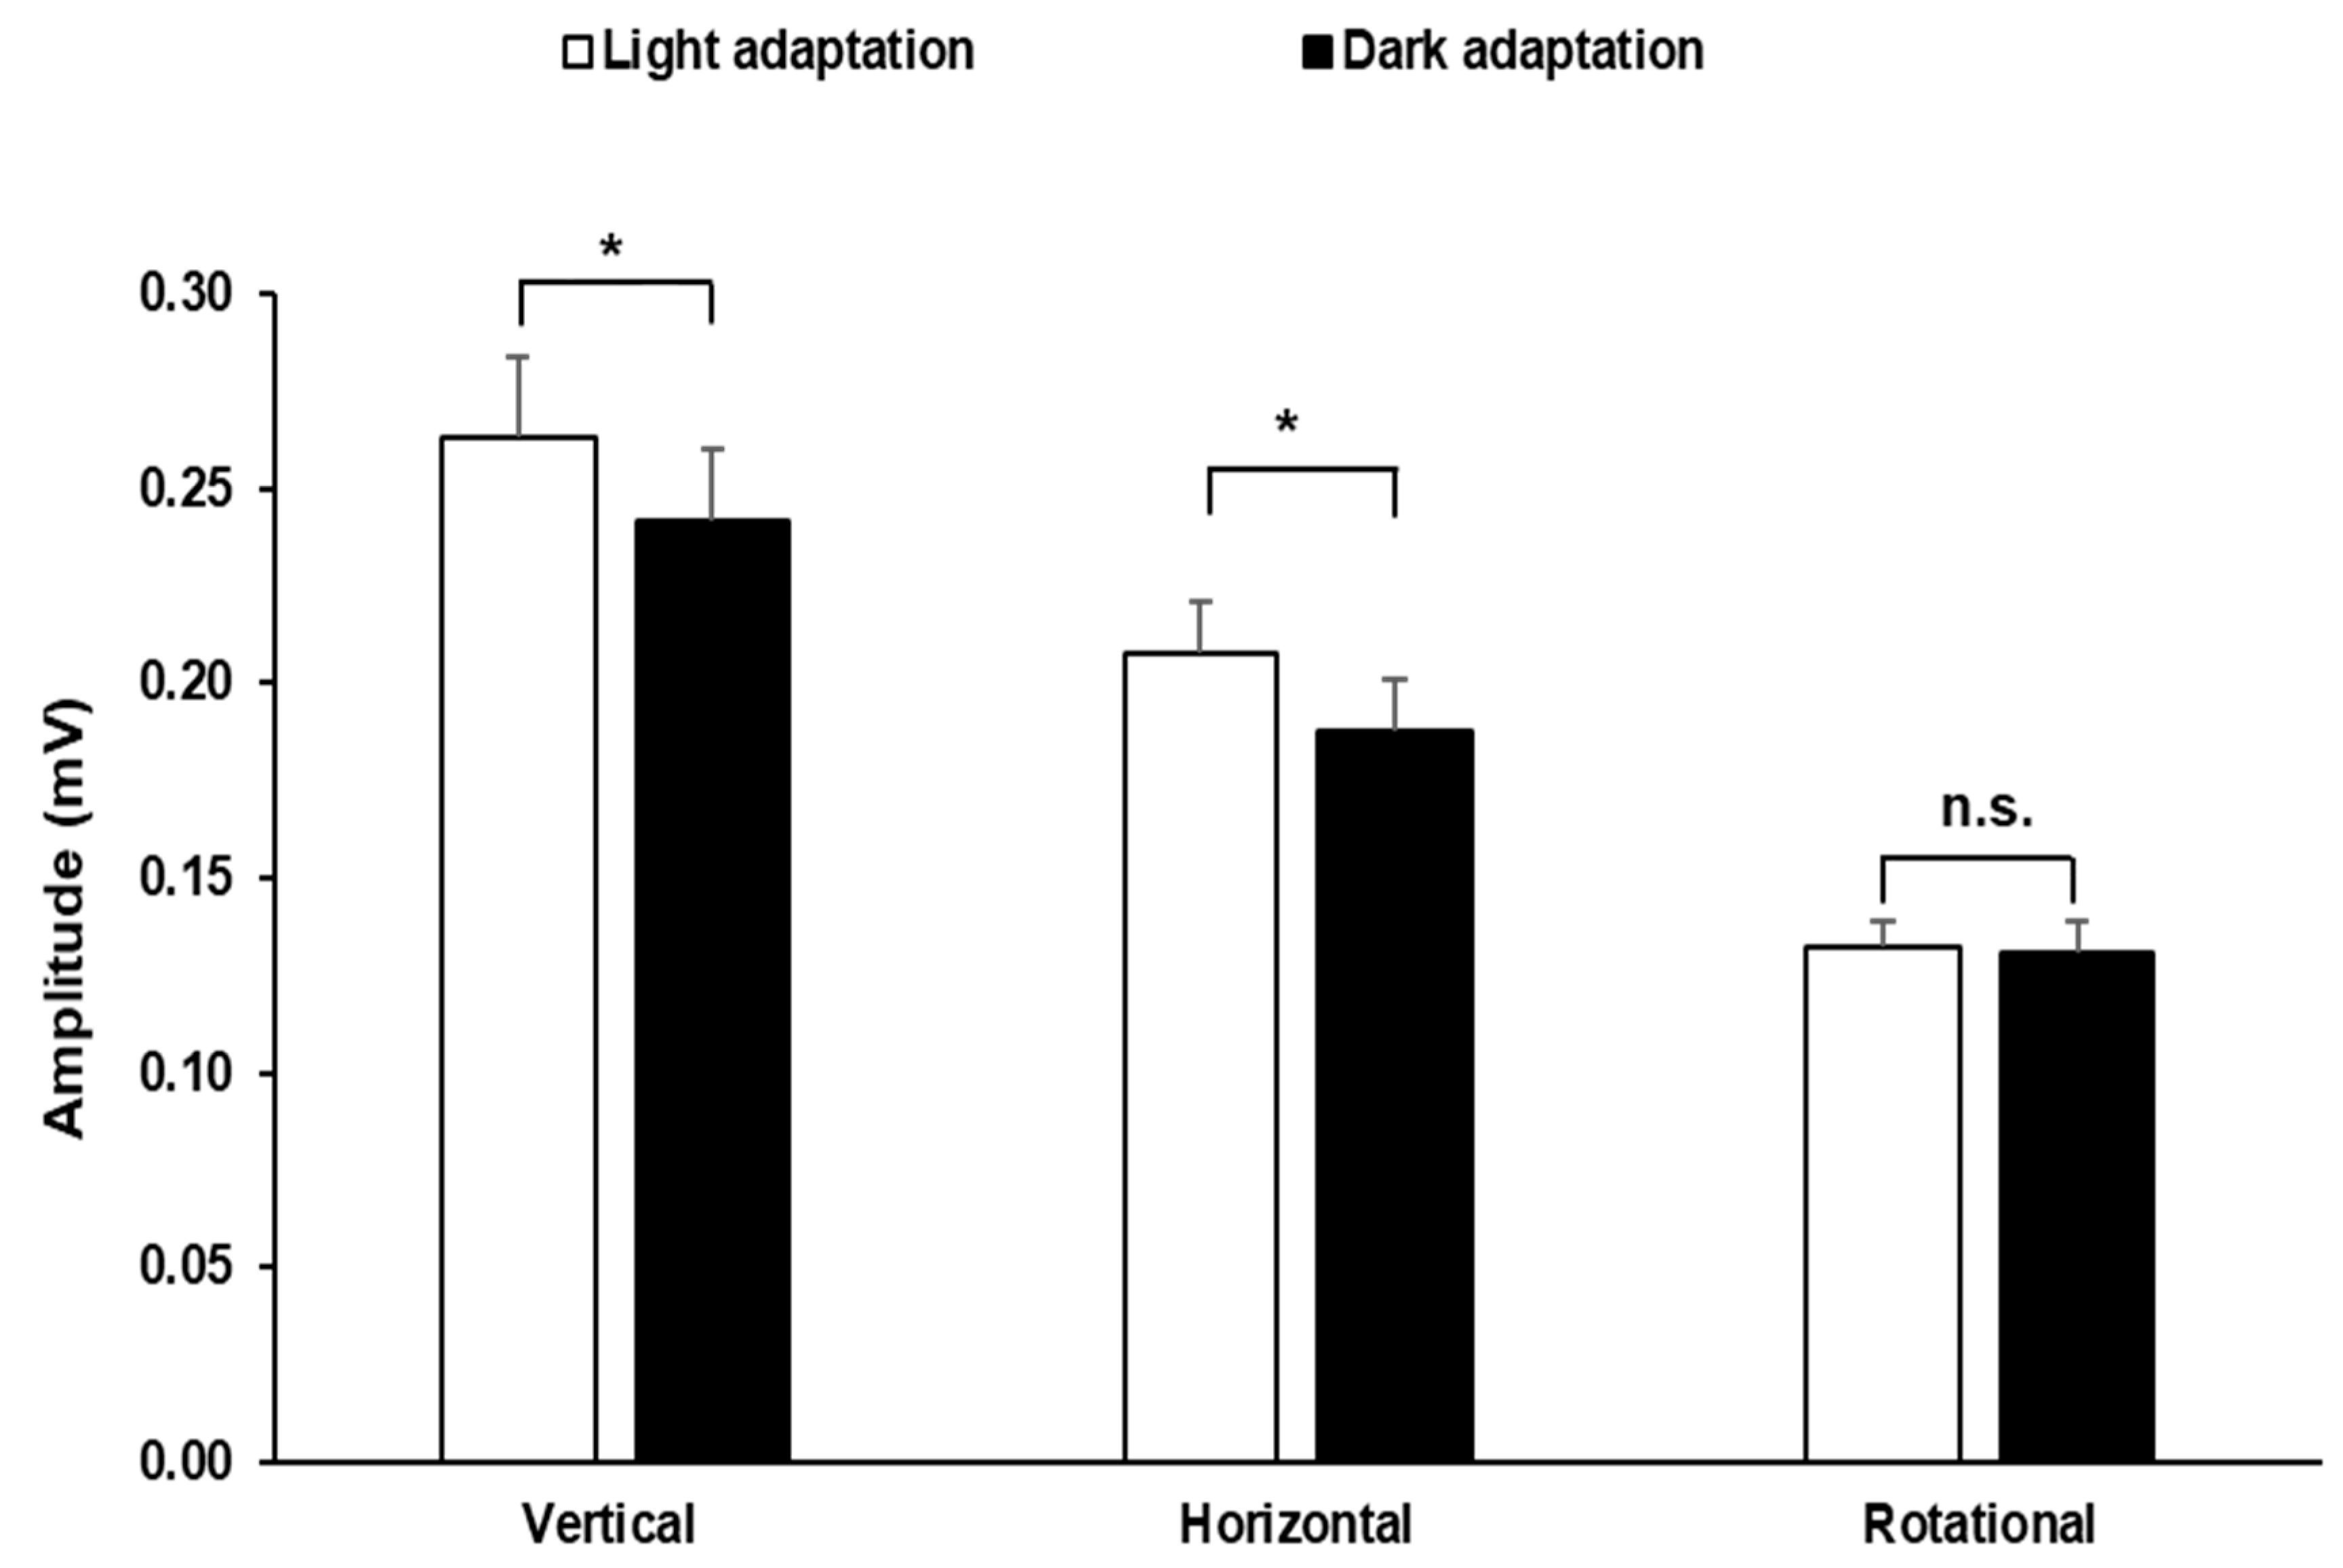
Our analyses of the dark vs. light adaptation of EOG recordings using linear (vertical and horizontal) or rotational bar stimuli are shown in
Figure 4. The figure shows the mean electrooculogram amplitudes (
± SEM) averaged from the right eye and left eye of the 10 voluntary participants in response to bars moving at a temporal frequency of 0.3 Hz under the different light adaptation conditions. Statistically significant differences were observed between the results obtained in response to linear vertical (0.263 ± 0.021) displacement under light adaptation and those obtained under dark adaptation (0.242 ± 0.018) (
p < 0.05; student
t-test). The same statistically significant differences were observed between results obtained in response to linear horizontal (0.211 ± 0.012 mV) displacements under light adaptation and those obtained under dark adaptation (0.188 ± 0.013 mV) (
p < 0.05; student
t-test). The results obtained under different adaptation conditions in response to rotational stimuli showed no significant differences (
p > 0.05; student
t-test).
4. Discussion
Our experiments were intended to study the electrooculographic stimulation parameters in terms of directionality, linear and angular velocity, contrast, and state of light/dark adaptation that allow us to determine possible interocular differences in eye movement.
Our results showed that in the horizontal movement of the eyeballs, when eyes move from right to left, the amplitude of the EOG recordings was greater in the left eye than in the right eye. However, EOG recording amplitude was similar between both eyes when eye displacement occurs from left to right. However, in vertical and rotational eye displacement, the amplitude of the EOG response is similar between the left and right eyes. Although our results are in concordance with other authors [
23], the possible explanation is not so clear. In our experiment design, all volunteers have a right dominant eye. Based on data analysis, we observed that when the left eye turns to the left or right, the amplitudes are symmetrically equal. However, the right eye shows an asymmetric amplitude; when it turns to the left the amplitude is smaller than when it turns to the right.
In the literature, the asymmetry of the eye movements between both eyes has also been observed in convergence, it was found that the responses between the dominant eye and the non-dominant eye are asymmetric, both in maximum speed and in mean maximum latency [
7]. The study highlighted that the left and right eyes rotate with a non-identical angle of vision. In addition, the movements of both eyes start and finish asynchronously [
26,
27]. Asymmetry of pro-saccadic latencies between both eyes has also been found [
28]. All these examples of eye movement asymmetries are manifestations of the functional asymmetry of the brain between both hemispheres. Previous studies also revealed that there are differences between dominant and non-dominant eyes such as visual acuity asymmetry, contrast asymmetry, and sensitivity asymmetry.
Studies on the dominant eye were started long before when ocular dominance was related to sports performance [
29,
30,
31] or motor skills in right handers [
6]. The dominant eye is an example of functional brain asymmetry due to causes such as genes, environmental factors, childhood training, asymmetry of the visual cortex, and handedness [
5,
6,
28].
Our study includes light stimuli of different temporal frequencies in an attempt to explore saccadic and pursuit eye movements. Further protocols of adaptation level and directionality are also included.
From another point of view, we observed that the amplitudes of the EOG responses in vertical movements are significantly greater than in horizontal ones. It is possible that this difference is due to the influence of the extraocular muscles. The rectus extraocular muscles (superior and inferior) and the oblique extraocular muscles (superior and inferior) participate in the vertical movements. However, only the lateral and medial rectus extraocular muscles participate in horizontal movements. Thus, there may be more influences from the extraocular muscles in vertical than horizontal movements, resulting in greater amplitudes of EOG responses in vertical than horizontal movements.
The differences we have found between the vertical and horizontal recordings, although statistically significant, do not invalidate the use of the stimuli usually applied for ophthalmic examination of eye movements [
32]. However, we point out that vertical scrolling could be more efficient.
The eye movement in response to the rotating bar is a combination of vertical and horizontal displacements. Usually, the participant needs to fix on one end of the bar as a fixation point to follow; we configured a vision angle of 10 degrees to be able to analyze the rotary movement in the EOG response. It is striking that rotational movements produce EOG responses of significantly less amplitude than linear movements. This could be due to the fact that although the six extraocular muscles participate in rotational movements, the degree of angular displacement of the gaze to follow circular movements is only 10° in our experimental conditions, while the displacement in response to linear stimulation has an amplitude of 30°. This difference would be justified by the fact that the amplitude of the electrooculogram varies with the degree of eye displacement [
33].
Our results showed higher values of EOG amplitude from recordings carried out under light adaptation conditions. This could be because under light adaptation there is an increase in intracellular free calcium of the RPE and the exit of chloride, leading to depolarization in the basolateral RPE membrane, thus registering an increase in transepithelial potential. In contrast, under dark adaptation, ion homeostasis produces a decrease in transepithelial potential [
22,
34].
When EOG is used as a measure of the integrity of the oculomotor pathways, we propose to use vertical stimulus displacement, since it seems to be the optimal stimulus without differences between both eyes. Therefore, the variation of saccadic movements in Duane’s disease [
35], the alteration of slow eye-tracking movements as biomarkers of patients diagnosed with schizophrenia [
36], and the changes in micro-movements of patients diagnosed with Parkinson’s disorders [
37], Alzheimer’s disease [
38], or just attention and fatigue [
39] could benefit in their early diagnosis or follow-up through the use of the EOG responses to vertical stimuli.
Finally, we cannot avoid some limitations of our study. (i) The variability in EOG recording amplitudes among different subjects is sometimes more than desired. (ii) Measures of the response amplitude have been carried out manually, and the subjectivity of the observer may not be discarded. (iii) participants are not trained before collecting the data, so experiments needed to be repeated several times to avoid blinking. (iv) The duration of the whole protocol is sometimes too long; therefore, the participants display some signs of fatigue. Any case, from our experiments, we conclude that when using EOG as a measure of the integrity of the oculomotor pathways, we propose that the optimization of functional evaluation of eye movements by means of EOG responses must include vertical displacements, since horizontal displacement stimuli generate significant differences between both eyes. The use of a vertical displacement test could benefit the early diagnosis or follow-up of neurological disorders avoiding interocular differences.


