Article

Comparison Analysis of Gene Expression Profiles Proximity Metrics

by
Sergii Babichev
1,*,†,‡,
Lyudmyla Yasinska-Damri
2,‡,
Igor Liakh
3,‡ and
Bohdan Durnyak
2,‡
1
Department of Physics, Kherson State University, 73000 Kherson, Ukraine
2
Department of Computer Science and Information Technology, Ukrainian Academy of Printing, 79000 Lviv, Ukraine
3
Department of Informatics, Phisical and Mathematical Disciplines, Uzhhorod National University, 88000 Uzhhorod, Ukraine
*
Author to whom correspondence should be addressed.
Current address: Department of Physics, Kherson State University, University Street, 27, 73000 Kherson, Ukraine.
The authors contributed to this work equally.
Symmetry 2021, 13(10), 1812; https://doi.org/10.3390/sym13101812
Submission received: 21 August 2021 / Revised: 22 September 2021 / Accepted: 24 September 2021 / Published: 28 September 2021
(This article belongs to the Section Computer)

Abstract

:
The problems of gene regulatory network (GRN) reconstruction and the creation of disease diagnostic effective systems based on genes expression data are some of the current directions of modern bioinformatics. In this manuscript, we present the results of the research focused on the evaluation of the effectiveness of the most used metrics to estimate the gene expression profiles’ proximity, which can be used to extract the groups of informative gene expression profiles while taking into account the states of the investigated samples. Symmetry is very important in the field of both genes’ and/or proteins’ interaction since it undergirds essentially all interactions between molecular components in the GRN and extraction of gene expression profiles, which allows us to identify how the investigated biological objects (disease, state of patients, etc.) contribute to the further reconstruction of GRN in terms of both the symmetry and understanding the mechanism of molecular element interaction in a biological organism. Within the framework of our research, we have investigated the following metrics: Mutual information maximization (MIM) using various methods of Shannon entropy calculation, Pearson’s χ 2 test and correlation distance. The accuracy of the investigated samples classification was used as the main quality criterion to evaluate the appropriate metric effectiveness. The random forest classifier (RF) was used during the simulation process. The research results have shown that results of the use of various methods of Shannon entropy within the framework of the MIM metric disagree with each other. As a result, we have proposed the modified mutual information maximization (MMIM) proximity metric based on the joint use of various methods of Shannon entropy calculation and the Harrington desirability function. The results of the simulation have also shown that the correlation proximity metric is less effective in comparison to both the MMIM metric and Pearson’s χ 2 test. Finally, we propose the hybrid proximity metric (HPM) that considers both the MMIM metric and Pearson’s χ 2 test. The proposed metric was investigated within the framework of one-cluster structure effectiveness evaluation. To our mind, the main benefit of the proposed HPM is in increasing the objectivity of mutually similar gene expression profiles extraction due to the joint use of the various effective proximity metrics that can contradict with each other when they are used alone.

1. Introduction

An analysis of gene expression experimental data allows concluding [1] that generally, the human genome contains approximately 25,000 active genes (not zero expression values). Approximately, the same number of genes are inactive ones (zero expression values). Which genes are currently active depends on the nature of the biological organism and its current state. Therefore, processing gene expression data to extract genes that allow us to adequately distinguish the studied biology objects is an important step of gene expression data pre-processing. In this instance, symmetry plays a key role in the field of both genes’ and/or proteins’ interaction since it undergirds essentially all interactions between molecular components in the gene regulatory network and extraction of gene expression profiles, which allows us to identify how the investigated biological objects (disease, state of patients, etc.) contribute to the further reconstruction of the gene regulatory network (GRN) in terms of both the symmetry and understanding the mechanism of molecular element interaction in a biological organism. The step-by-step procedure of gene expression data formation and processing for the purpose of GRN reconstruction and/or creation of a diseases diagnostics system is presented in Figure 1 [2]. As can be seen, the implementation of this process involves four stages: Performing the experiment; formation of an array of gene expressions and removing unexpressed and low-expression genes for all studied samples; statistical and entropic analysis of the obtained gene expression profiles in order to identify mutually correlated genes that allow us to distinguish the investigated samples with high resolution; reconstruction, validation and simulation of GRN or creation of a disease diagnostic system.
One of the most important steps of this procedure implementation is an extraction of the mutually similar gene expression profiles in terms of the used proximity metric. The gene expression profile, in this instance, means the vector of gene expressions, the values of which are determined for various samples (or various conditions of the performed experiment). The traditional proximity metrics (Euclidean, Manhattan, etc.) are not effective in this case due to the high dimension of the gene expression profiles. Thus, research focused on the evaluation of the gene expression profiles’ proximity metrics in order to determine an optimal one in terms of appropriate quality criteria is an actual problem in this subject area.
Lately, many scientific works have been devoted to solving the problem of assessing the level of gene expression profiles’ informativeness in order to extract the most informative ones. Hence, in [3], the authors considered the technique of miRNA molecules extraction based on pairwise comparison of differentiated miRNA molecules. Approximately 2,744,989 raws out of 9,888,123 were read during the simulation process implementation. As a result of the performed experiment, the authors allocated 2565 informative miRNA molecules for further processing. A comparative analysis of various gene expression data classification techniques to extract the most informative ones using errors of both the first and second kind was considered in [4]. A review [5] presented a comparative analysis of the various hybrid techniques used to select informative gene expression profiles for the purpose of solving the problem of classification of the biological objects investigated for different types of cancer. The analysis of efficiency of various hybrid models of gene expression profiles’ extraction by an estimation of the level of corresponding gene informativeness on the basis of the statistical analysis with application of the cluster analysis and methods of data classification was executed. In the reviewed works, classification accuracy was used as the criterion to evaluate the appropriate technique’s effectiveness. Various combinations of data mining and machine learning techniques were analyzed in this review. The following gene expression profiling filtering methods and appropriate proximity metrics were considered by the authors in this work: Mutual information maximization (MIM) [6,7], Phi-squared test [8], correlation-based feature selection [9,10], Laplacian and Fisher score [11], information gain [12], Fisher criterion [13,14], minimum redundancy maximum relevance [15,16], probabilistic random function [17], Fisher–Markov selector [18] and symmetrical uncertainty [19]. Within the framework of the authors’ research, the classification techniques with the calculation of the classification quality criteria were used to evaluate the appropriate proximity metrics’ effectiveness. Three stages were carried out in all cases: Evaluation of the gene expression profiles’ proximity in terms of the used metric, a grouping of the gene expression profiles using an appropriate clustering method, and classification of the investigated samples that contained the allocated gene expression profiles with the calculation of the classification accuracy. It should be noted that in most cases, classification accuracy values varied within the range from 80% to 100%. However, we would like to note that the highest classification accuracy was achieved in the cases of the use of a small number of the most informative genes. Only in a few cases, the selected number of genes exceeded 100 with high accuracy of the samples’ classification. The small number of genes does not allow us to reconstruct a high-quality GRN, which can investigate the nature of the system molecular elements’ interaction in different states in order to achieve the following: To identify the group of genes that determine the appropriate disease in the first stage; to determine the nature of their interactions with each other and other system elements and the second stage; and finally, to determine the nature of the impact of these genes expression changes on other network genes during the further gene regulatory network simulation.
Additionally, the analysis of the techniques listed in [19] allows concluding that in most instances, the parameters of the proposed algorithms were determined empirically. In other words, the proposed techniques are not self-organizing. Undoubtedly, this fact is one of the significant disadvantages of the hereinbefore listed methods. To our mind, improving the objectivity of informative gene expression data extraction can be achieved based on the application of the ensemble of data mining and machine learning techniques with subsequent decision making on the basis of quantitative quality criteria applied to evaluate the appropriate stage effectiveness [20,21]. Previous research [22,23,24] presented a partial solution to the hereinbefore described problem. In these papers, the authors presented the results of the research regarding the development of a hybrid model of gene expression profiles extraction based on the joint application of quantitative statistical criteria, Shannon entropy, the SOTA (self organizing tree algorithm) clustering algorithm and an ensemble of binary classifiers. The final decision was made based on an analysis of the results of the fuzzy inference system. However, the authors used only correlation distance as the gene expression profiles proximity metric. Comparison of various metrics of gene expression profiles’ proximity with an evaluation of their effectivity using quantitative quality criteria was not considered in these works.
The goal of the research is the comparison of the most-used metrics of gene expression profiles proximity followed by the formation of an optimal hybrid proximity metric (HPM) based on quantitative criteria of the investigated samples’ classification.

2. Materials and Methods

Let the initial gene expressions dataset be presented as a matrix:
G = { e i j } , i = 1 , n ¯ ; j = 1 , m ¯
where n and m are the number of genes and investigated samples, respectively.
In this case, the criterion for the formation of subsets of gene expression profiles can be the objective function:
C ( e s , e p ) = min f ( e s , e p ) o r C ( e s , e p ) = max f ( e s , e p )
where: e s , e p are the s and p genes’ expression profiles, respectively; and f ( · ) is the similarity function used to assess the proximity degree of gene expression profiles e s , e p .
It is obvious that in this case the choice of method is determined by the similarity function inherent in this method. Within the framework of our research, we consider the following similarity functions: Mutual information maximization (MIM), Pearson’s χ 2 test and correlation distance.

2.1. Mutual Information Maximization Method

Formally, the mutual information of two vectors of discrete variables e s and e p can be estimated as follows [25]:
I ( e s , e p ) = x e s y e p p ( x , y ) l o g 2 p ( x , y ) p ( x ) p ( y )
where: p ( x , y ) is the function of the joint probability distribution in vectors e s and e p ; p ( x ) and p ( y ) are the probability distribution functions of the vectors e s and e p , respectively.
When applying the entropy theory, the mutual information can be expressed as follows [25]:
I ( e s , e p ) = H ( e s ) + H ( e p ) H ( e s , e p )
where: H ( e s ) , H ( e p ) and H ( e s , e p ) are the entropies of vectors e s , e p and joint entropy of these vectors, respectively.
Entropy, in this case, can be defined as a measure of the system’s corresponding state uncertainty and is calculated by Shannon’s formula [26]:
H ( e ) = i = 1 m p i ( e ) l o g 2 p i ( e )
where: m is the number of the investigated samples (length of the gene expression profile); and p i ( e ) is the probability of implementation of the corresponding discrete value of the i-th variable. In this case, the joint Shannon entropy is calculated by the formula:
H ( e s , e p ) = i s = 1 m i p = 1 m p i ( e s , e p ) l o g 2 p i ( e s , e p )
where p i ( e s , e p ) is the joint probability of the i-th value in the gene expression profiles e s and e p .
An analysis of literature resources [27,28,29,30,31] allows concluding that the existing methods of the Shannon entropy calculation differ in the method of probability evaluation of the implementing corresponding state of the system. and, in the general case, can be divided into two groups. The first group of methods is based on estimating the frequencies of appropriate state of the system. The methods of the second group involve the evaluation of the entropy directly without the use of frequencies of the system’s corresponding states. A block chart of the most common methods for estimating Shannon’s entropy is shown in Figure 2.
The idea of the maximum likelihood (ML) method is based on the assumption that the values of the expression vector of the corresponding gene are a priory discretized so that each variable can take n values. Then, the probability of the i-th state implementation can be determined by a standard way as the frequency of the corresponding event p i = n i n , and the formula for calculating the Shannon entropy, in this case, takes the form:
H M L ( e ) = i = 1 m n i n l o g 2 n i n
The bias correction ML method takes into account the shift in Shannon’s entropy value due to the presence of zero probabilities [27,28]. The formula for calculating Shannon’s entropy in this case takes the form:
H B C M L ( e ) = H M L ( e ) + n > 0 1 2 n
where n > 0 is the number of samples with a non-zero frequency of the corresponding event.
The Chao–Shen method of calculating Shannon’s entropy is based on the integrated application of the Horvitz–Thompson [29] and Good–Turing [30] methods. The probability of occurrence of the value of the corresponding feature in this case is calculated as follows:
H C S ( e ) = i = 1 m n i n l o g 2 n i n 1 ( 1 n i n ) m I ( n i )
where I ( n i ) = 1 if n i > 0 , and I ( n i ) = 0 otherwise; m is the number of gene expression values in the i-th cell; and m is the number of cells.
The James–Stein shrinkage estimator [27] involves the complex use of two models: a high-dimensional model (the data vector contains a large number of attributes) with high variance and small bias, and a low-dimensional model characterized by low variance and high bias. The application of the method assumes the division of the feature vector into k identical cells, and the probability in the i-th cell is calculated by the formula:
p i J S = λ p i + ( 1 λ ) p i M L
where: p i = 1 n i is the target probability in the i-th cell (if all the features in this cell have different values); n i is the number of features in this cell; and λ is the intensity parameter, the value of which is determined as follows:
λ = 1 i = 1 k ( p i M L ) 2 ( n 1 ) i = 1 k ( p i p i M L ) 2
where parameter n determines the number of features in the data of the investigated vector. Shannon’s entropy, in this instance, is calculated by Formula (5).
The application of the Bayesian method to calculate Shannon’s entropy also involves the breakdown of the data vector into k cells with an estimation of the probabilities of the investigated vector distribution π = π i i = 1 k , ( i = 1 k π i = 1 ) and a priori formation of the probability vector π with the following determination of conditional probabilities p ( H | π ) and p ( π | x ) [31]:
H ( x ) = H ( π ) p ( H | π ) p ( π | x ) d x
where p ( π | x ) means the probability value in the corresponding cell, provided that the value x belongs to this cell:
p ( π | x = j = 1 k p ( π i | x j ) , w h e r e p ( π i | x j ) = π i , p r o v i d e d t h a t x j i
The conditional probability p ( H | π ) is determined by the Dirac function in accordance with the condition:
p ( H | π ) = δ ( H i = 1 k π i l o g 2 π )
In this instance, the nature of the probability distribution π i corresponds to the Dirichlet distribution with the concentration parameter α :
p ( π ) i = 1 k π i α 1
The final evaluation of the probability in the i-th cell by the Bayesian method at the corresponding concentration parameter in this cell α i is performed in accordance with the formula:
p i B S = n i + α i n + i = 1 k α i
A concentration parameter α in this case is determined in advance in accordance with the data of Table 1. The value of Shannon’s entropy is calculated by the standard Formula (5).
The M I M method assumes maximizing the function (2) in the case of maximum similarity of the gene expression profiles e s and e p .

2.2. Modified Mutual Information Maximization Proximity Metric

As was noted hereinbefore, the application of the MIM criterion assumes using various methods of Shannon entropy evaluation and, for this reason, the obtained results can disagree with each other. To solve this problem, we propose the modified mutual information maximization (MMIM) proximity metric that is based on the use of the Harrington desirability function [32], the equation and plot of which are presented below (Formula (17) and Figure 3).
d = e x p ( e x p ( Y ) )
The value of the non-dimensional parameter Y varies within the range from 2 (d = 0) to 5 (d = 1). The intersection points of the function on the graph 0.63 = 1 1 / e and 0.37 = 1 / e correspond to the desirability boundaries within the range of the function variation. The desirability value of 0.37 usually corresponds to the boundary of acceptable values. Values within the range from 0.37 to 0.63 correspond to satisfactory desirability, from 0.63 to 0.8—good desirability, above 0.8—excellent desirability. Below, we present the algorithm (Algorithm 1) used to calculate the MMIM proximity metric based on the Harrington desirability function.
The highest values of the generalized desirability index (MMIM) correspond to the maximum value of mutual information considering the combination of Shannon entropy estimation methods used during the simulation process.

2.3. A Method for Estimating the Gene Expression Profiles’ Proximity Based on Pearson’s χ 2 Test

The statistical Pearson’s χ 2 test allows us to test the hypothesis that the values of gene expression profiles have the same distribution. Let the profile of the i-th gene be represented by a vector of expression values: e i = ( e i j ) , j = 1 , m ¯ , where m determines the number of objects or conditions of the experiment performed to determine the expression of the corresponding gene. Conceptually similar considerations can be adopted in structure energy in the case of gene expression profiles’ value application. If the range of the gene expression values’ variation [ e i m i n , e i m a x ] is divided into k non-intersection intervals [ e i s r , e i p r ] , r = 1 , k ¯ , the number of gene expression values belonging to the corresponding interval r, in this case, can be defined as follows: m r = j = 1 m [ e i s r < e i j e i p r ] .
The classical application of the Pearson’s χ 2 test is focused on categorized data. Its application assumes the following: At the first step, it is necessary to calculate the number of objects that fall into the appropriate interval. Then, the expected number of objects in the corresponding intervals is estimated using the probability evaluation of finding the corresponding object into the appropriate interval: m r = p r · m . Pearson’s criterion χ 2 , in this case, is calculated as follows:
χ 2 = r = 1 k ( m r m r ) 2 m r
The conclusion regarding the acceptance or rejection of the hypothesis that the data distribution corresponds to a certain distribution is made on the basis of comparing the value of the calculated criterion with the boundary value at appropriate values of the number of freedom degrees and the probability of the result obtained. If the calculated value of the consistency criterion is greater than the boundary one, then the null hypothesis concerning the incompliance of the data distribution to a given distribution is rejected.
Algorithm 1: MMIM proximity metric values calculation.
Symmetry 13 01812 i001
When the gene expression data are used, the expression of the gene is proportional to the amount of appropriate type of gene for a respective object. When comparing two gene expression profiles, e s and e p , the values of gene expressions in the first profile are taken as expected, and in the second profile as calculated. Thus, the formula (20) for the consistency criterion evaluation of the two gene expression profiles e s and e p takes the form:
χ 2 = r = 1 k ( e s j e p j ) 2 e s j
Smaller values of this criterion correspond to a greater degree of closeness of the respective gene expression profiles.

2.4. A Method for Estimating the Gene Expression Profiles Proximity Based on the Correlation Distance

When applying the correlation distance as the gene expression profiles proximity metric, the degree of consistency of the gene expressions values that correspond to different samples is estimated. As was noted hereinbefore, the main purpose of the data filtering step implementation is to extract the gene expression profiles that allow us to identify (classify) the investigated samples with the maximum accuracy. In this instance, we can assume that the gene expression profiles should be correlated with each other, and the use of a correlation distance may allow extracting the required number of the most correlated gene expression profiles. Since the vector of the gene expression profile is represented by numerical values of gene expressions, it is reasonable to calculate the correlation distance based on Pearson’s correlation:
d c o r ( e s , e p ) = 1 j = 1 m ( e s j e ¯ s ) ( e p j e ¯ p ) j = 1 m ( e s j e ¯ s ) 2 j = 1 m ( e p j e ¯ p ) 2
where e ¯ s and e ¯ p are the average values of the gene expression profiles e s and e p , respectively.
It is obvious that in the case of a high correlation of gene expression profiles, the value of this criterion is minimal.
The quality assesment of data classification using the appropriate proximity metric was performed using the criterion that contains as the components errors of both the first and second kind. The confusion matrix is presented in Table 2.
The classification accuracy was used as the main criterion to evaluate the appropriate gene expression profiles’ proximity metric effectiveness:
A C C = T P + T N T P + F P + T N + F N

3. Experiment, Results and Discussion

The simulation procedure was performed on the basis of R software [33] using the G S E 19188 dataset that includes gene expression profiles of patients who were examined for early-stage lung cancer [34]. The data were obtained using a DNA microchips experiment and contained 156 microchips. The analysis of the data annotation has shown that 65 microchips contained gene expression data of healthy patients, and 91 microchips included the gene expression data of patients with lung cancer (mild form). In [23], the authors presented the results of research concerning the complex application of methods of hierarchical clustering and binary classification to identify the most informative profiles of gene expression allowing high-precision identification of the investigated samples. A total of 401 genes out of 54,675 were allocated during the simulation process with a classification accuracy of 93.5%. This subset of gene expression profiles was used within the framework of our research.
The main idea of the simulation performed within the framework of our research was the following: Initially, one gene expression profile was randomly selected, to which the nearest profile in terms of the used proximity metric was added. Then, the resulting subset of gene expression profiles was increased by adding the next profile closest to the first gene. Then, at each step, the number of genes in the subset gradually increased by one. At each stage, binary classification of objects was performed using the random forest (RF) classifier [35], the effectiveness of which for the binary classification of gene expression profiles was proven in [23]. The RF classifier was implemented based on the c a r e t package [36] using the t r a i n ( ) function with 10 estimators. The investigated samples were broken up into two subsets, taking into account the class to which the appropriate samples belong (healthy, tumor). Sixty percent of samples were used for the training of the model and the remaining 40% were used for model testing.

3.1. Evaluation of the MIM Method’s Effectiveness When Using Various Methods of Shannon Entropy Calculation

Figure 4 shows the boxplots of the mutual information criterion values distribution calculated for all pairs of gene expression profile combinations using various methods of Shannon entropy calculation.
The evaluation of the obtained vectors of the MI metric when using various methods of Shannon entropy calculation concerning statistically distinguishing them from each other using the Mann–Whitney U test showed that all vectors were statistically distinguished from each other. The zero-hypothesis was rejected in all cases since the p-values in all cases were significantly lower than 0.05 ( 2 × 10 16 ). An analysis of the obtained diagrams also allows us to conclude that when we have applied different methods of Shannon entropy calculation, there were outliers that corresponded to the nearest gene expression profiles in terms of the MIM proximity metric. However, we would like to note that the values of this metrics differ when using different methods of Shannon entropy calculation. This fact can certainly affect the classification results of the examined objects.
Figure 5 presents diagrams of the classification accuracy criterion distribution calculated by Formula (23) when the number of the nearest gene expression profiles stepwise increases from 2 to 100.
The gene expression profiles, in this instance, were sorted from the minimum distance value to the maximum one relative to the first gene expression profile in terms of the used proximity metric. The analysis of the results allows concluding that as a result of the application of various methods of Shannon’s entropy evaluation, which was used to calculate the MIM proximity metric, the classification results do not agree with each other in many cases. However, the range of the accuracy values’ variation in all cases corresponds to the high quality of the sample classification. In this case, increasing the decision-making objectivity regarding extraction of the most informative gene expression profiles is possible using an ensemble of Shannon’s entropy estimators. Thus, there is a necessity to calculate an MMIM proximity metric, which contains as the components the MIM metrics values determined when using various methods of Shannon’s entropy calculation.

3.2. An Application and Comparison Analysis of the MMIM Proximity Metric, Pearson’s χ 2 Test and Correlation Distance

The simulation results concerning the evaluation of the classification accuracy criterion distribution versus the number of the nearest gene expression profiles extracted using the MMIM proximity metric, χ 2 test and correlation distance are presented in Figure 6.
An analysis of the obtained results allows concluding that an application of the MMIM proximity metric really contributes to increasing the objectivity of similar gene expression profiles’ extraction. The extraction of gene expression profile groups allows us to classify adequately and with high accuracy (99%) the examined objects. The increase of the objectivity, in this case, is due to the correct use of a set of methods for calculating Shannon’s entropy, the value of which is used for assessing the MIM values of the respective gene expression profiles. The simulation results have also shown the lower efficiency of the correlation distance metric compared with both the MMIM criterion and Pearson’s χ 2 test in terms of both the absolute value and sensitivity. As shown in Figure 6, the classification accuracy values, when using the correlation proximity metric (Figure 6c), are varied within the narrow range of about 0.95 classification accuracy value. When using other proximity metrics (Figure 6a,b), in the case of a low number of gene expression profiles, the classification accuracy values are varied chaotically within the larger range. This is natural, since adding several gene expression profiles in this instance can significantly change the classification results. When the number of genes is larger than 40 (approximately), the classification accuracy values were varied around larger values compared to when we applied the correlation proximity metric.

3.3. The Hybrid Metric of Gene Expression Profiles Proximity Evaluation

The simulation results presented hereinbefore regarding the evaluation of the different gene expression profiles’ proximity metrics’ effectiveness create the preconditions for calculating a hybrid metric that contains as the components different metrics, which proved to be the most effective according to the previous evaluation results. The final formation of the hybrid metric value within the framework of our research is carried out using the Harrington desirability function in accordance with Algorithm 2.
Algorithm 2: Hybrid metric of gene expression profiles proximity evaluation.
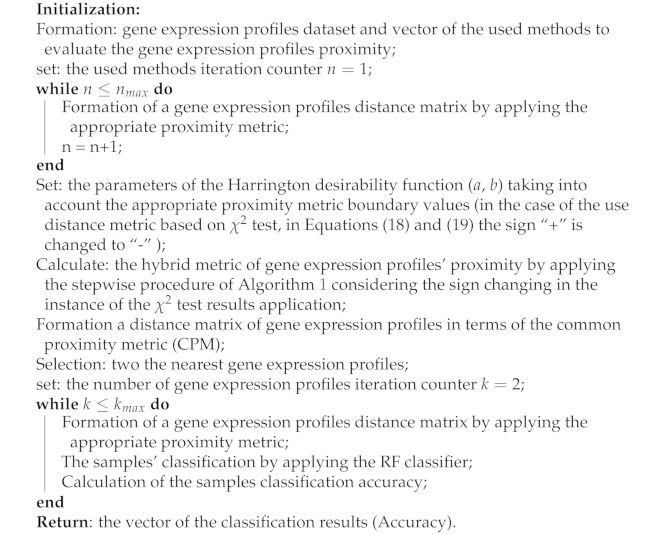
Symmetry 13 01812 i002
Figure 7 shows the simulation results regarding the practical implementation of the hereinbefore described procedure. As can be seen, an application of the proposed hybrid proximity metric allows forming the subsets of gene expression profiles that corresponds to the high classification accuracy of the investigated samples, which contain the extracted gene expression profiles as attributes. The number of genes, in this case, depends on the purpose of the current task. However, it should be noted that the examined simple classification procedure can be implemented only in the presence of known classes. This information is not always available. Therefore, in this case, it is reasonable to conduct research to assess the effectiveness of the gene expression profiles’ clustering quality criteria, calculated using the proposed hybrid proximity metric. This is the further perspective of the authors’ research.

4. Conclusions

The research presented in this manuscript is devoted to comparative analysis of the various effectiveness metrics of gene expression profiles’ proximity in order to extract the most informative genes in terms of classification accuracy of the examined samples containing the extracted genes as attributes. The three most used gene expression profiles’ proximity metrics were considered within the framework of the research: Mutual information maximization, correlation distance and Pearson’s χ 2 test. The G S E 19188 gene expression profiles dataset of patients who were examined for early-stage lung cancer was used as the experimental data during the simulation process. Various methods of Shannon entropy evaluation were considered within the framework of the mutual information maximization criterion application. The results of the simulation have shown that the sample classification accuracy differed when using various methods of Shannon entropy calculation when the mutual information maximization criterion was calculated. To increase the gene expression profiles’ extraction objectivity, we have proposed the modified mutual information maximization criterion based on the complex use of various methods of Shannon entropy calculation and the Harrington desirability function. Comparison analysis of the simulation results has also shown the lower efficiency of the correlation metric in comparison with both the modified mutual information maximization criterion and the χ 2 test in terms of both the absolute value and sensitivity. When using the correlation distance metric the sample classification accuracy of objects that make up a subset of data for testing was worse than the results obtained when using other gene expression profiles’ proximity metrics. As a result, we have proposed a hybrid metric that contains as the components different metrics, which proved to be the most effective according to the previous evaluation results. The final formation of the hybrid metric value within the framework of our research was carried out using the Harrington desirability function too. To our mind, the main benefit of the proposed hybrid metric is in increasing the objectivity of mutually similar gene expression profiles’ extraction due to the joint use of the various effective proximity metrics, which can contradict each other when they are used alone.
An analysis of the simulation results has allowed us to conclude that an application of the proposed hybrid proximity metric allows forming the subsets of gene expression profiles that correspond to the high classification accuracy of the investigated samples that contain the extracted gene expression profiles as attributes. The number of genes, in this case, depends on the goal of the current task. We believe that the extraction of groups of mutually correlated gene expression profiles contributes a further reconstruction of a qualitative gene regulatory network in terms of both the symmetry and understanding the mechanism of molecular element interaction in a biological organism at the stage of simulation of the reconstructed gene network. We believe that the obtained results create the conditions for further development of more effective hybrid models to extract gene expression profiles based on joint use of the proposed proximity metrics, data mining and machine learning techniques for creating the disease diagnostic systems and reconstruction of adequate gene regulatory networks. This is the further perspective of the authors’ research.

Author Contributions

The individual contributions of the authors are the following: Conceptualization, S.B., L.Y.-D., I.L. and B.D.; methodology, S.B., L.Y.-D., I.L. and B.D.; validation, S.B., L.Y.-D., I.L. and B.D.; writing—review and editing, S.B., L.Y.-D., I.L. and B.D. All authors have read and agreed to the published version of the manuscript.

Funding

This research received no funding from any grant.

Acknowledgments

We thank the team of the researchers from Cell Biology, Erasmus University Medical Center, Rotterdam, The Netherlands, Hou J, Aerts J, den Hamer B, et al., who have performed a genome-wide gene expression analysis on a cohort of 91 patients with tumors and 65 adjacent normal lung tissue samples.

Conflicts of Interest

The authors declare no conflict of interest.

Abbreviations

The following abbreviations are used in this manuscript:
GRNGene Regulatory Network
MIMMutual Information Maximization
MMIMModified Mutual Information Maximization
RFRandom Forest
SOTASelf Organizing Tree Algorithm
MLMaximum Likelihood
JFJeffreys
LPLaplace
MnMMiniMax
HPMHybrid Proximity Metric

References

  1. ArrayExpress—Functional Genomics Data. Available online: https://www.ebi.ac.uk/arrayexpress/ (accessed on 1 May 2014).
  2. Babichev, S.; Yasinskyi, M.; Yasinska-Damri, L.; Ratushniak, Y.; Lytvynenko, V. Current state of the problem of gene expression data processing and extraction to solve the reverse engineering tasks in the field of bioinformatics. Ceur Workshop Proc. 2021, 2853, 62–71. [Google Scholar]
  3. Wang, L.; Song, F.; Yin, H.; Zhu, W.; Fu, J.; Dong, Z.; Xu, P. Comparative microRNAs expression profiles analysis during embryonic development of common carp, Cyprinus carpio. Comp. Biochem. Physiol.—Part Genom. Proteom. 2021, 37, 100754. [Google Scholar] [CrossRef]
  4. Marchetti, M.A.; Coit, D.G.; Dusza, S.W.; Yu, A.; McLean, L.; Hu, Y.; Nanda, J.K.; Matsoukas, K.; Mancebo, S.E.; Bartlett, E.K. Performance of Gene Expression Profile Tests for Prognosis in Patients with Localized Cutaneous Melanoma: A Systematic Review and Meta-Analysis. JAMA Dermatol. 2020, 156, 953–962. [Google Scholar] [CrossRef]
  5. Almugren, N.; Alshamlan, H. A survey on hybrid feature selection methods in microarray gene expression data for cancer classification. IEEE Access 2019, 7, 78533–78548. [Google Scholar] [CrossRef]
  6. Lu, H.; Chen, J.; Yan, K.; Jin, Q.; Xue, Y.; Gao, Z. A hybrid feature selection algorithm for gene expression data classification. Neurocomputing 2017, 256, 56–62. [Google Scholar] [CrossRef]
  7. Vijay, S.A.A.; Kumar, P.G. Fuzzy expert system based on a novel hybrid stem cell (HSC) algorithm for classification of micro array data. J. Med. Syst. 2018, 42, 61. [Google Scholar] [CrossRef] [PubMed]
  8. Lee, C.P.; Leu, Y. A novel hybrid feature selection method for microarray data analysis. Appl. Soft Comput. 2011, 11, 208–213. [Google Scholar] [CrossRef]
  9. Chuang, L.-Y.; Yang, C.-H.; Wu, K.-C.; Yang, C.-H. A hybrid feature selection method for DNA microarray data. Comput. Biol. Med. 2011, 41, 228–237. [Google Scholar] [CrossRef]
  10. Jain, I.; Jain, V.K.; Jain, R. Correlation feature selection based improved-binary particle swarm optimization for gene selection and cancer classification. Appl. Soft Comput. 2018, 62, 203–215. [Google Scholar] [CrossRef]
  11. Dashtban, M.; Balafar, M. Gene selection for microarray cancer classification using a new evolutionary method employing artificial intelligence concepts. Genomics 2017, 109, 91–107. [Google Scholar] [CrossRef]
  12. Salem, H.; Attiya, G.; El-Fishawy, N. Classification of human cancer diseases by gene expression profiles. Appl. Soft Comput. 2017, 50, 124–134. [Google Scholar] [CrossRef]
  13. Sharbaf, F.V.; Mosafer, S.; Moattar, M.H. A hybrid gene selection approach for microarray data classification using cellular learning automata and ant colony optimization. Genomics 2016, 107, 231–238. [Google Scholar] [CrossRef]
  14. Dashtban, M.; Balafar, M.; Suravajhala, P. Gene selection for tumor classification using a novel bio-inspired multi-objective approach. Genomics 2018, 110, 10–17. [Google Scholar] [CrossRef]
  15. Alshamlan, H.; Badr, G.; Alohali, Y. mRMR-ABC: A hybrid gene selection algorithm for cancer classification using microarray gene expression profiling. Biomed. Res. Int. 2018, 2015, 604910. [Google Scholar] [CrossRef] [PubMed] [Green Version]
  16. Alshamlan, H.M.; Badr, G.H.; Alohali, Y.A. Genetic bee colony (GBC) algorithm: A new gene selection method for microarray cancer classification. Comput. Biol. Chem. 2015, 56, 49–60. [Google Scholar] [CrossRef] [PubMed]
  17. Moradi, P.; Gholampour, M. A hybrid particle swarm optimization for feature subset selection by integrating a novel local search strategy. Appl. Soft Comput. 2016, 43, 117–130. [Google Scholar] [CrossRef]
  18. Li, X.; Yin, M. Multiobjective binary biogeography based optimization for feature selection using gene expression data. IEEE Trans. Nanobiosci. 2013, 12, 343–353. [Google Scholar] [CrossRef] [PubMed]
  19. Shreem, S.S.; Abdullah, S.; Nazri, M.Z.A. Hybrid feature selection algorithm using symmetrical uncertainty and a harmony search algorithm. Int. J. Syst. Sci. 2016, 47, 1312–1329. [Google Scholar] [CrossRef]
  20. Izonin, I.; Tkachenko, R.; Kryvinska, N.; Zub, K.; Mishchuk, O.; Lisovych, T. Recovery of Incomplete IoT Sensed Data using High-Performance Extended-Input Neural-Like Structure. Procedia Comput. Sci. 2019, 160, 521–526. [Google Scholar] [CrossRef]
  21. Izonin, I.; Kryvinska, N.; Tkachenko, R.; Zub, K. An Approach towards Missing Data Recovery within IoT Smart System. Procedia Comput. Sci. 2019, 155, 11–18. [Google Scholar] [CrossRef]
  22. Babichev, S.; Khamula, O.; Durnyak, B.; Škvor, J. Technique of gene expression profiles selection based on SOTA clustering algorithm using statistical criteria and Shannon entropy. Adv. Intell. Syst. Comput. 2021, 1246, 23–38. [Google Scholar] [CrossRef]
  23. Babichev, S.; Škvor, J. Technique of Gene Expression Profiles Extraction Based on the Complex Use of Clustering and Classification Methods. Diagnostics 2020, 10, 584. [Google Scholar] [CrossRef] [PubMed]
  24. Babichev, S.; Barilla, J.; Fišer, J.; Škvor, J. A hybrid model of gene expression profiles reducing based on the complex use of fuzzy inference system and clustering quality criteria. In Proceedings of the 11th Conference of the European Society for Fuzzy Logic and Technology, EUSFLAT 2019, Prague, Czech Republic, 9–13 September 2020; pp. 128–133. [Google Scholar] [CrossRef] [Green Version]
  25. Thomas, M.C.; Joy, A.T. Elements of Information Theory, 2nd ed.; John Wiley & Sons: Hoboken, NJ, USA, 2006; 792p. [Google Scholar]
  26. Shannon, C.E. A mathematical theory of communication. Bell Syst. Tech. J. 1948, 27, 379–423, 623–656. [Google Scholar] [CrossRef] [Green Version]
  27. Hausser, J.; Strimmer, K. Entropy inference and the James-Stein estimator, with application to nonlinear gene association networks. J. Mach. Learn. Res. 2009, 10, 1469–1484. [Google Scholar]
  28. Miller, G. Note on the Bias of Information Estimates. Information Theory in Psychology. 1955, pp. 95–100. Available online: https://www.scienceopen.com/document?vid=357d299f-62fa-4bda-8dd2-e4d5b5abde5d (accessed on 10 August 2021).
  29. Horvitz, D.G.; Thompson, D.J. A generalization of sampling without replacement from a finite universe. J. Am. Stat. Assoc. 1952, 47, 663–685. [Google Scholar] [CrossRef]
  30. Orlitsky, A.; Santhanam, N.P.; Zhang, J. Always Good Turing: Asymptotically optimal probability estimation. Science 2003, 302, 427–431. [Google Scholar] [CrossRef]
  31. Archer, E.; Park, I.M.; Pillow, J.W. Bayesian Entropy Estimation for Countable Discrete Distributions. J. Mach. Learn. Res. 2014, 15, 2833–2868. [Google Scholar]
  32. Harrington, J. The desirability function. Ind. Qual. Control 1965, 21, 494–498. [Google Scholar]
  33. Ihaka, R.; Gentleman, R. R: A language for data analysis and graphics. J. Comput. Graph. Stat. 1996, 5, 299–314. [Google Scholar] [CrossRef]
  34. Hou, J.; Aerts, J.; den Hamer, B.; van Ijcken, W.; den Bakker, M.; Riegman, P.; Van Der Leest, C.; Van Der Spek, P.; Foekens, J.A.; Hoogsteden, H.C.; et al. Gene expression-based classification of non-small cell lung carcinomas and survival prediction. PLoS ONE 2010, 5, e10312. [Google Scholar] [CrossRef]
  35. Breiman, L. Random forests. Breiman 2001, 45, 5–32. [Google Scholar]
  36. Kuhn, M.; Wing, J.; Weston, S. Classification and Regression Training. Available online: https://github.com/topepo/caret/ (accessed on 18 May 2020).
Figure 1. Block-chart of a step-by-step procedure for the gene expression experimental data formation and processing [2].
Symmetry 13 01812 g001
Figure 2. Block chart of the methods of Shannon entropy evaluation.
Symmetry 13 01812 g002
Figure 3. Harrington desirability function.
Symmetry 13 01812 g003
Figure 4. Visualization of the MIM proximity metrics values distribution, calculated using different methods of the Shannon entropy evaluation.
Symmetry 13 01812 g004
Figure 5. Diagrams of the classification accuracy criterion values’ distribution when the objects contained genes extracted by applying the MIM metric using different methods of Shannon’s entropy estimating.
Symmetry 13 01812 g005
Figure 6. Results of the simulation concerning the evaluation of the classification accuracy criterion distribution versus the number of the nearest gene expression profiles extracted using the MMIM criterion, χ 2 test and correlation distance metric.
Symmetry 13 01812 g006
Figure 7. Results of the simulation regarding the application of the hybrid metric of gene expression profiles’ proximity.
Symmetry 13 01812 g007
Table 1. Varieties of the Bayesian method for estimating probabilities in cells at different values of the concentration parameter α .
The Concentration Parameter α ValuesMethod of the Probabilities Evaluation
0Maximum Likelihood (ML)
1/2Jeffreys (JF)
1Laplace (LP)
1/nSchurmann–Grassberger (SG)
formilaMinimax (MnM)
Table 2. Confusion matrix for the diagnosis and classification of tumors in patients examined for lung cancer.
Real State of the Examined ObjectsResults of the Objects Classification
Tumor PredictedHealthy
Tumor (1)True positives (TP)False negatives (FN)
Healthy (0)False positives (FP)True negatives (TN)
Publisher’s Note: MDPI stays neutral with regard to jurisdictional claims in published maps and institutional affiliations.

