Article

Biomechanical Evaluation on the Bilateral Asymmetry of Complete Humeral Diaphysis in Chinese Archaeological Populations

1
Key Laboratory of Vertebrate Evolution and Human Origins, Institute of Vertebrate Paleontology and Paleoanthropology, Chinese Academy of Sciences, Beijing 100044, China
2
CAS Center for Excellence in Life and Paleoenvironment, Beijing 100044, China
3
College of Earth and Planetary Sciences, University of Chinese Academy of Sciences, Beijing 100049, China
4
Institute of Archeology and Cultural Relics of Hubei Province, Wuhan 430077, China
5
School of Ethnology and Sociology, Minzu University of China, Beijing 100081, China
6
Center for the Study of Chinese Archaeology, Peking University, Beijing 100871, China
7
Ministry of Education Key Laboratory of Contemporary Anthropology, Department of Anthropology and Human Genetics, School of Life Sciences, Fudan University, Shanghai 200433, China
8
Centre for the Exploration of the Deep Human Journey, Faculty of Science, University of the Witwatersrand, 2050 Johannesburg, South Africa
*
Author to whom correspondence should be addressed.
Symmetry 2021, 13(10), 1843; https://doi.org/10.3390/sym13101843
Submission received: 28 August 2021 / Revised: 26 September 2021 / Accepted: 28 September 2021 / Published: 2 October 2021
(This article belongs to the Special Issue Symmetry in Human Evolution, from Biology to Behaviours)

Abstract

:
Diaphyseal cross-sectional geometry (CSG) is an effective indicator of humeral bilateral asymmetry. However, previous studies primarily focused on CSG properties from limited locations to represent the overall bilateral biomechanical performance of humeral diaphysis. In this study, the complete humeral diaphyses of 40 pairs of humeri from three Chinese archaeological populations were scanned using high-resolution micro-CT, and their biomechanical asymmetries were quantified by morphometric mapping. Patterns of humeral asymmetry were compared between sub-groups defined by sex and population, and the representativeness of torsional rigidity asymmetry at the 35% and 50% cross-sections (J35 and J50 asymmetry) was testified. Inter-group differences were observed on the mean morphometric maps, but were not statistically significant. Analogous distribution patterns of highly asymmetrical regions, which correspond to major muscle attachments, were observed across nearly all the sexes and populations. The diaphyseal regions with high variability of bilateral asymmetry tended to present a low asymmetrical level. The J35 and J50 asymmetry were related to the overall humeral asymmetry, but the correlation was moderate and they could not reflect localized asymmetrical features across the diaphysis. This study suggests that the overall asymmetry pattern of humeral diaphysis is more complicated than previously revealed by individual sections.

1. Introduction

Humeral bilateral asymmetry has been extensively studied in orthopedics, forensics, and paleo/archaeological anthropology [1,2,3]. Handedness can be inferred from the bilateral asymmetry of the upper limb [4,5,6]. Evidence from living athletes of unilaterally dominated sports (such as tennis and cricket) suggests a close relationship between humeral bilateral asymmetry and behavioral laterality [7,8,9]. A combined study of endocranial and humeral asymmetry can shed light on how the human body responds to dependent asymmetrical stimuli across biologically independent anatomical regions [10]. These applications make humeral bilateral asymmetry an effective approach for reconstructing the behaviors of past human populations [11,12,13,14,15,16].
Long bone diaphyses show great plasticity to remodel in response to mechanical loadings across a lifetime, especially prior to sexual maturity [17,18,19,20,21]. This remodeling makes diaphyseal cross-sectional geometry (CSG) a more effective indicator of bilateral upper-limb use and asymmetry compared to other linear measurements, such as articular breath or bone length [13,20,22,23,24].
Polar moment of area (J) and second moment of area (SMA) are two commonly adopted CSG parameters in humeral biomechanical analysis. J indicates the cross-section’s torsional and average bending rigidity, whereas SMA denotes the exact bending rigidity along a certain axis of a cross-section [3,25]. Owing to the difficulties of obtaining sequential histological cross-sections, most earlier studies focused on the CSG properties of cross-sections placed at 35% or 50% of the humeral biomechanical length (see the definition made by Ruff [26]). J at the 35% cross-section (J35) can reasonably estimate the minimum rigidity of humeral diaphysis and avoids the interference of other anatomical features, as it is situated below the distal edge of deltoid tuberosity and above the supracondylar crest [13,14,16,27,28,29]. J at the 50% cross-section (J50) provides reasonable estimates of midshaft rigidity [9,14,30,31,32,33,34], and is known to be a reliable indicator of hand preference [5]. When evaluating the directional biomechanical performance of a cross-section, most previous studies only calculated the maximum/minimum SMA or SMA along the standard anatomical axis (anteroposterior or mediolateral) to avoid the complexity of acquiring CSG values in multiple directions [35,36,37].
However, CSG properties of limited cross-sections and directions are insufficient to estimate the overall biomechanical performance of long bone diaphysis, especially in studies about humeral bilateral asymmetry. According to experimental data from professional baseball players, tensile and shear strains vary among different diaphyseal sections during throwing activities [38], and the degree of bilateral asymmetry evaluated by J was variable along the humeral shaft [16,38]. The shape asymmetry of different cross-sections also indicates that the asymmetry patterns vary in different anatomical directions [24,39].
Morphometric mapping is a 2D visualizing method that is commonly used for displaying the distribution patterns of morphometric and biomechanical properties across the entire diaphysis of a long bone [40,41]; for example, the distribution patterns of cortical bone thickness along the femoral diaphysis, visualized by morphometric maps, differentiate in Neanderthals and Homo erectus from modern humans [42,43]. Additionally, morphometric maps, quantifying the external radius across the entire femoral diaphysis, reveal the ontogenetic disparities between wild and captive chimpanzees [44]. The cortical structure of hallucal metatarsals, represented by morphometric maps of cortical bone thickness and bending rigidity, reflects locomotor adaptations of humans, chimpanzees, and gorillas [45]. Finally, morphometric mapping has been established to be an effective approach for quantifying the humeral biomechanical asymmetry across the complete diaphysis [16].
Factors such as geographic location, chronological age, subsistence pattern, and sex are known to influence the pattern of humeral asymmetry in human populations. Varying degrees of humeral asymmetry have been detected among Upper Paleolithic populations from Europe, Africa, and Asia [11]. European samples show a general decrease in humeral asymmetry from the early Upper Paleolithic populations through to the 20th century [13,22]. Foragers and farmers from the pre-Hispanic American Southwest present different humeral asymmetry patterns [36]. Due to the existence of the sexual division of labor, modern human populations with various geographic locations, chronological ages, and subsistence patterns tend to exhibit diverse sexual dimorphism patterns in humeral asymmetry [31,36,37,46].
In the present study, we aim to (1) generate a more comprehensive understanding of humeral asymmetry by evaluating the biomechanical performance across complete diaphysis compared to previous studies, which only used individual cross-sections; and (2) check the reliability of using J35 and J50 to represent the overall humeral biomechanical performance in bilateral asymmetry analysis. To fulfil these targets, specimens were scanned using high-resolution micro-computed tomography (micro-CT), and morphometric mapping was applied to quantify the overall biomechanical asymmetry of humeral diaphysis for its effectiveness in visualization and statistical analysis. To cover as wide a variety of specimens as possible, 40 pairs of humeri from three Chinese archaeological populations, which differ in geographic location, chronological age, and subsistence strategy, were selected to represent East Asian modern humans in the present study.

2. Materials and Methods

2.1. Materials

Forty pairs of modern human humeri are included in this study. All paired humeri were collected from archaeological sites with populations that varied in geographic location, chronological age, and subsistence pattern. Agricultural and nomadic/gathering populations are included because these lifestyles were the dominant subsistence patterns in pre-industrial East Asia. The subsistence patterns of these populations were determined by associated burial assemblages and relevant historical records. The populations will be referred to by their geographic locations, which are as follows: ①Hubei population (HB): 9 males and 4 females collected from agricultural sites from Hubei Province, Central China spanning Qin-Han-Tang dynasties (221 BC ~ 907 AD). For some sites of this population, analyses of charred plant remains indicate that Setaria italica and Panicum miliaceum were the main food crops [47]. ②Henan population (HN): 6 males and 5 females collected from an agricultural population from Junzicun cemetery, Henan Province, North China, which dates to Qing dynasty (1636 AD ~ 1912 AD). Historical records indicate that an agricultural economy was the dominant lifestyle of this population [48]. ③Xinjiang population (XJ): 10 males and 6 females collected from nomadic populations attributed to Subeixi culture (1000 BC ~ 200 BC) from the Turpan Basin, Xinjiang Province, Northwest China. Burial assemblages such as bows, arrows, and stone artifacts for males and spinning wheels and potteries for females indicate a subsistence pattern of nomadism and gathering [49,50,51]. All individuals were adults. Their age and sex were determined according to cranial and pelvic osteological indicators. All humeral specimens were intact, well preserved, and showed no symptoms of osteoporosis or other pathologies.

2.2. Data Collecting and Processing

All humeri were scanned by a 450 kV micro-CT scanner (designed by Institute of High Energy Physics, Chinese Academy of Sciences) located in Key Laboratory of Vertebrate Evolution and Human Origins, Institute of Vertebrate Paleontology and Paleoanthropology, Chinese Academy of Sciences. The scanning was performed under a voltage of 380 kV, current of 1.5 mA, 360° rotation with a step of 0.5°, and an isometric voxel size of 160 μm. Raw data were virtually reconstructed and segmented in VGStudio Max 3.0. Volume renderings of all humeri were aligned to anatomical position using the standard protocol defined by Ruff [26]. To ensure that the humeri were consistently aligned and to avoid inter-observer error, all alignments were made by one author (Y.Z.). Paired humeri were always aligned synchronously. Three-dimensional meshes of each aligned humerus were generated and saved as PLY files in Avizo 8.1 for the following analyses.

2.3. Cross-Sectional Geometric Parameters Calculation

Customized in-house scripts, mainly sourced from R package ‘morphomap’, were applied to calculate the CSG parameters [52]. For each humerus, the single-layer periosteum and endosteum surface meshes were firstly detached from the original humeral mesh. Second, 61 equidistant cross-sections were extracted from the surface meshes along the proximodistal diaphysis (between 20 and 80% of the biomechanical length). Third, 360 equiangular landmarks were placed along both the inner and outer contours on each cross-section. Finally, J values of the cross-sections at 35% and 50% of biomechanical length (J35 and J50), and SMA values of 360 directions on 61 cross-sections were calculated based on the landmark coordinates.

2.4. Bilateral Asymmetry Quantification

Commonly used practices for assessing bilateral asymmetry are absolute asymmetry ([(max − min)/((max + min)/2)] × 100%) and directional asymmetry ([(right − left)/((right + left)/2)] × 100%). However, absolute asymmetry is not appropriate in this study, as the magnitude relationship between the left and right side is not consistent among different landmarks at humeral diaphysis. However, our study still focuses on absolute information of overall bilateral asymmetry, so directional asymmetry is also not suitable, because it does not eliminate the impact of handedness as well as behavioral laterality, which is not the issue this study attempts to investigate and may bring about bias to the conclusion. Therefore, bilateral asymmetry was quantified using dominant asymmetry ([(dominant − non-dominant)/((dominant + non-dominant)/2)] × 100%). The dominant side was decided according to the magnitude of J50, given that it is a valid indicator of handedness [5].

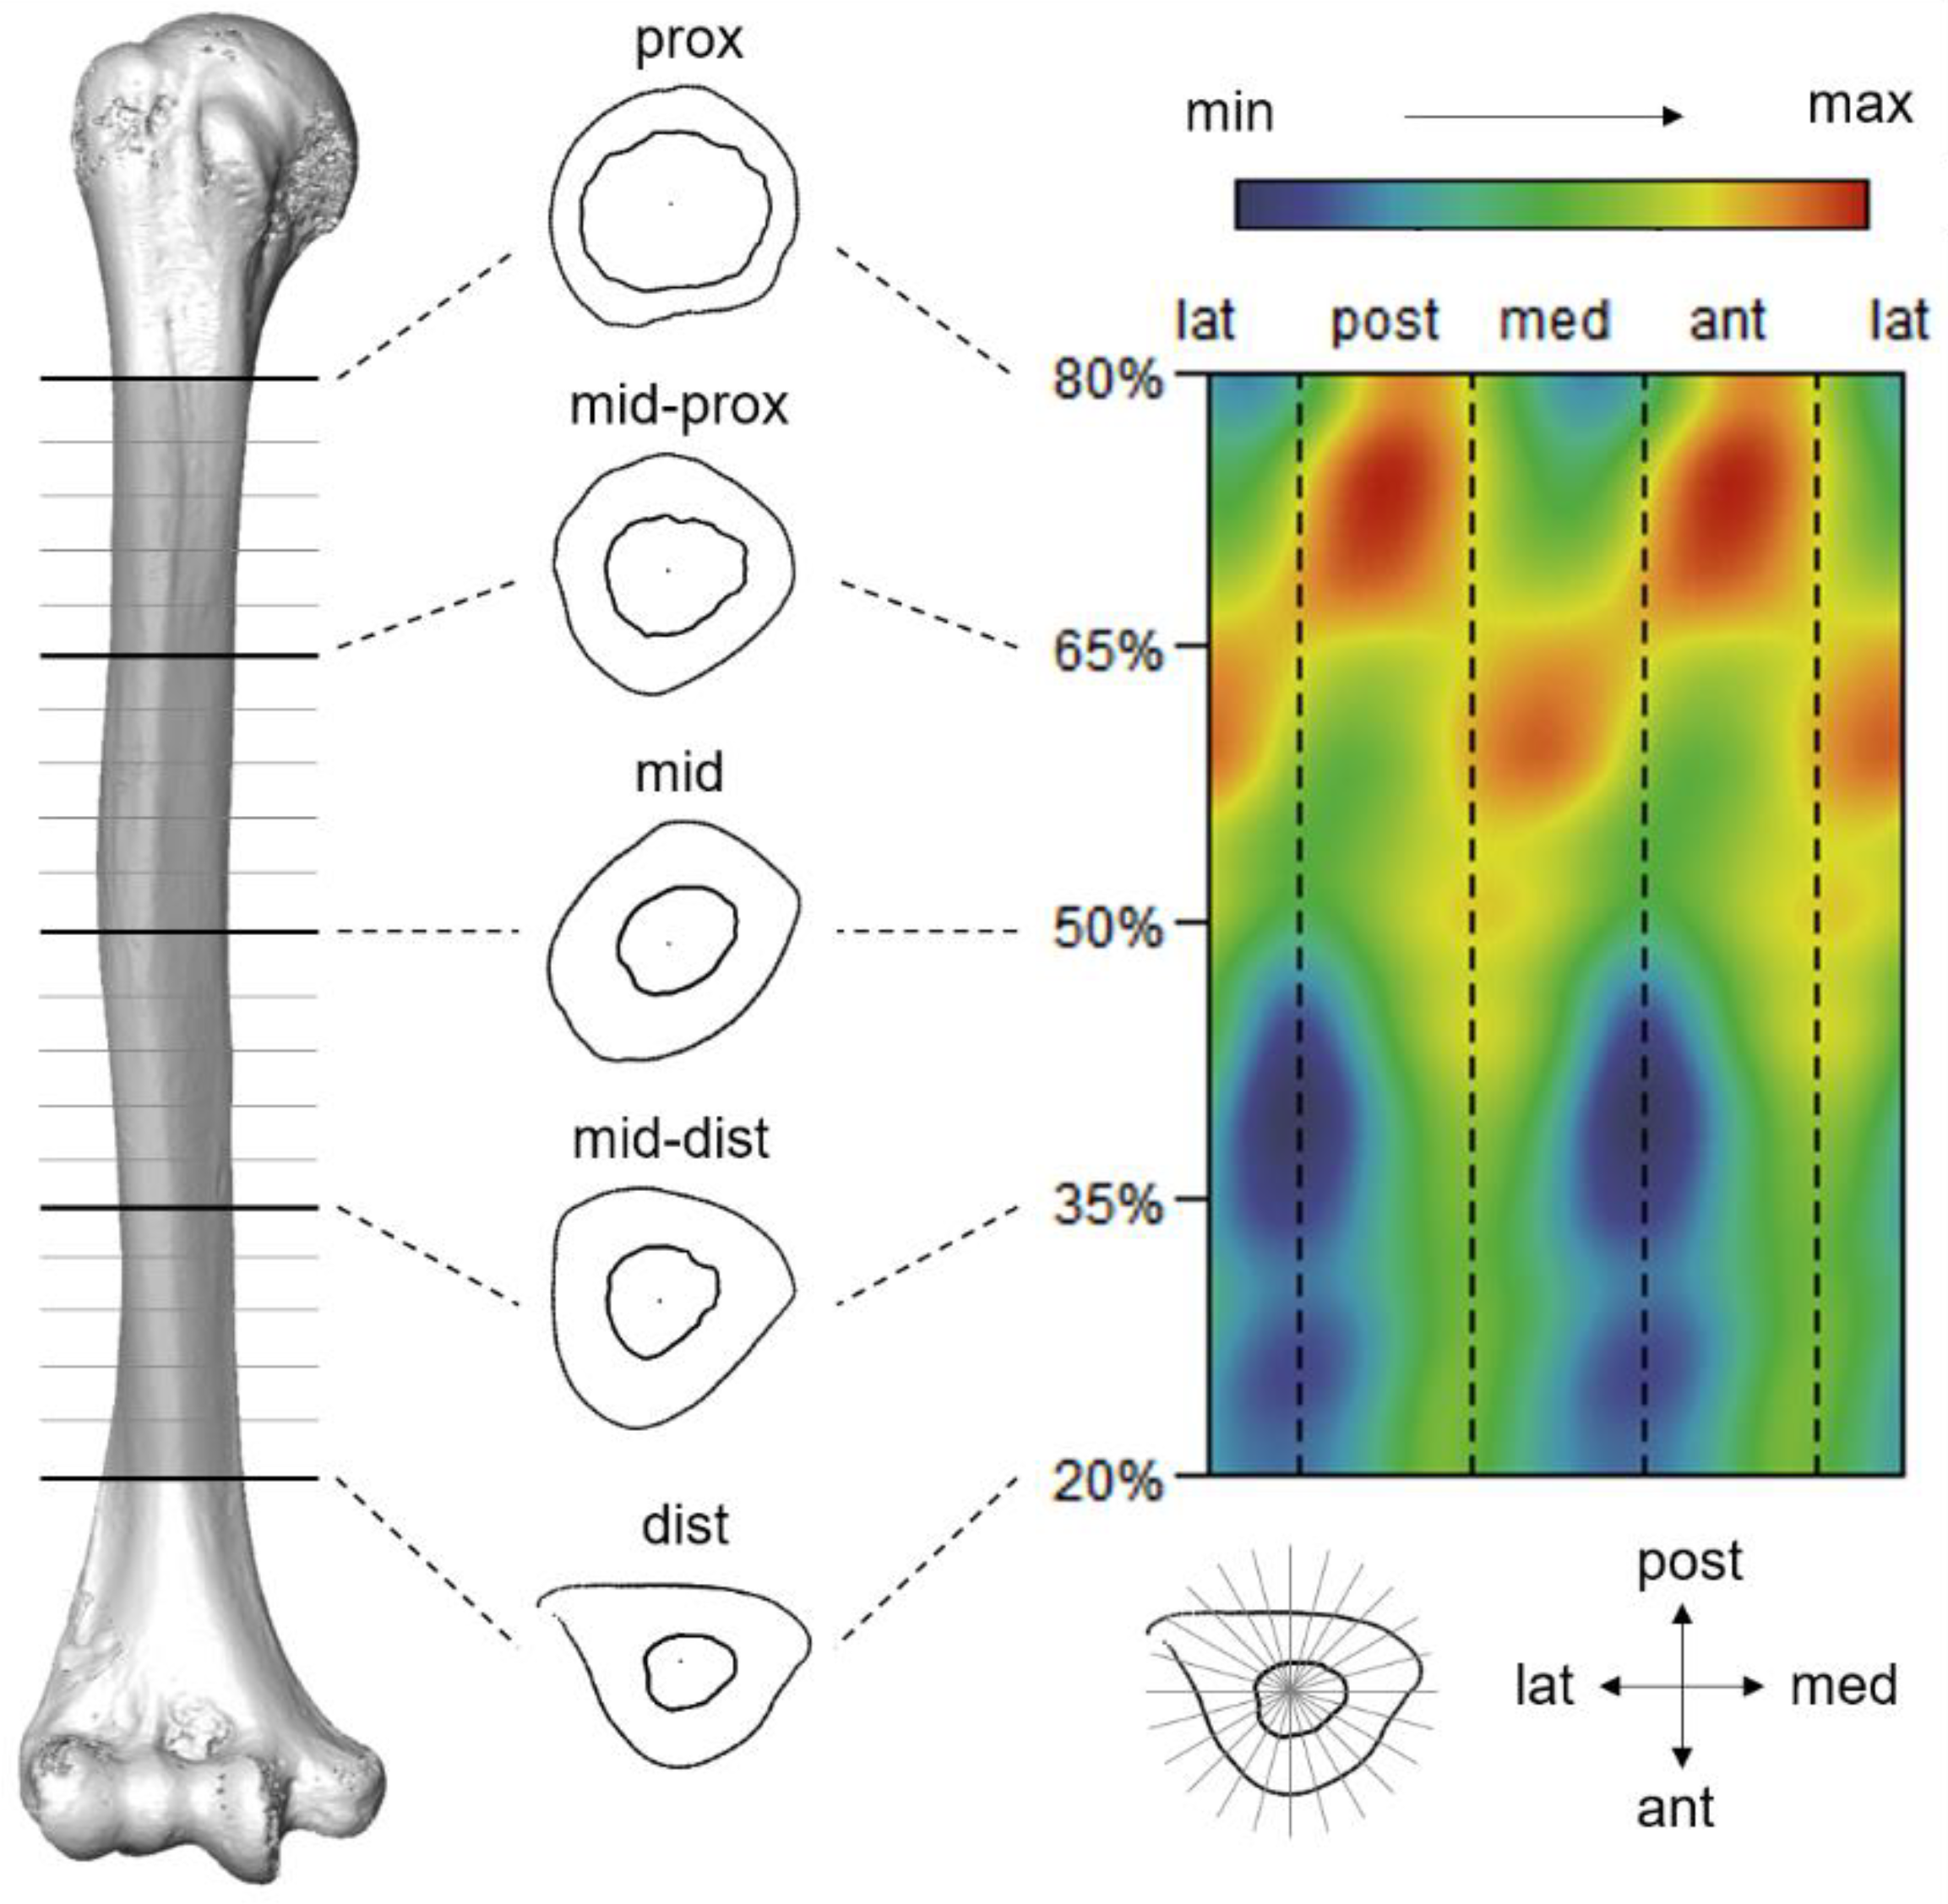
2.5. Morphometric Mapping

The SMA asymmetry values were obtained using the dominant asymmetry equation for all 21,960 (360 × 61) landmarks, and the results for each paired humeri were deposited in a matrix with 61 rows (sorted by the order of cross-sections) and 360 columns (sorted by the order of directions). These matrices were then visualized as morphometric maps to display the distribution characteristics of bending rigidity asymmetry along the proximodistal humeral diaphysis (Figure 1 and Figure A1). The asymmetry values of J35 and J50 for all individuals were also calculated using the same equation.

2.6. Methods to Estimate the Variation of Humeral Biomechanical Asymmetry

To explore the variation in humeral asymmetry patterns in modern humans, 40 individuals were divided into sub-groups defined by sex and population. The three populations, which varied in geographic location, chronological age, and subsistence pattern, were supposed to vary in their habitual behaviors, so population was set as one variable. Sexual division of labor is an important issue when discussing historical populations, and the sexual dimorphism of humeral asymmetry can be affected by non-behavioral factors such as genetics or hormones [27]. Therefore, sex was set as another variable. Mean morphometric maps exhibiting SMA asymmetry values for each sub-group were qualitatively compared. Additionally, a two-way multivariate analysis of variance (MANOVA) was conducted to quantitatively test whether sex and/or population were significant sources of variation. When fitting the regression model for MANOVA, SMA asymmetry values at all landmarks were set as the dependent variables, while sex and population were set as the independent variables with interaction. Customized in-house scripts, mainly sourced from R package ‘geomorph’ and ‘RRPP’, were utilized to conduct MANOVA [53,54]. In addition, the coefficients of variation (CV) for SMA asymmetry values at all landmarks were calculated in sub-groups and visualized by morphometric maps to exhibit intra-group variation characteristics. Only sub-groups defined by sex or by population were included in this analysis to reduce the impact of outliers.

2.7. Methods to Test the Representativeness of J35 or J50 Asymmetry

The reliability of using J35 or J50 asymmetry to represent the overall humeral asymmetry was tested using several statistical methods. First, a multivariate regression model was built on all specimens to statistically test the degree of correlation between overall SMA asymmetry and J asymmetry. When fitting the model, the SMA asymmetry values at all landmarks were set as the dependent variables, and the J35 or J50 asymmetry value as the independent variable. Customized in-house scripts, mainly sourced from R package ‘geomorph’ and ‘RRPP’, were utilized to carry out this fitting [53,54]. Second, to investigate the association of every SMA asymmetry value and J asymmetry value across the entire humeral diaphysis, the correlation coefficients between each SMA asymmetry value and J35 or J50 asymmetry value (CC35 and CC50) were calculated within sub-groups. The same protocols for visualizing SMA asymmetry values were applied to CC results to generate morphometric maps. The CC morphometric maps of sub-groups were qualitatively compared to reveal inter-group variations.

3. Results

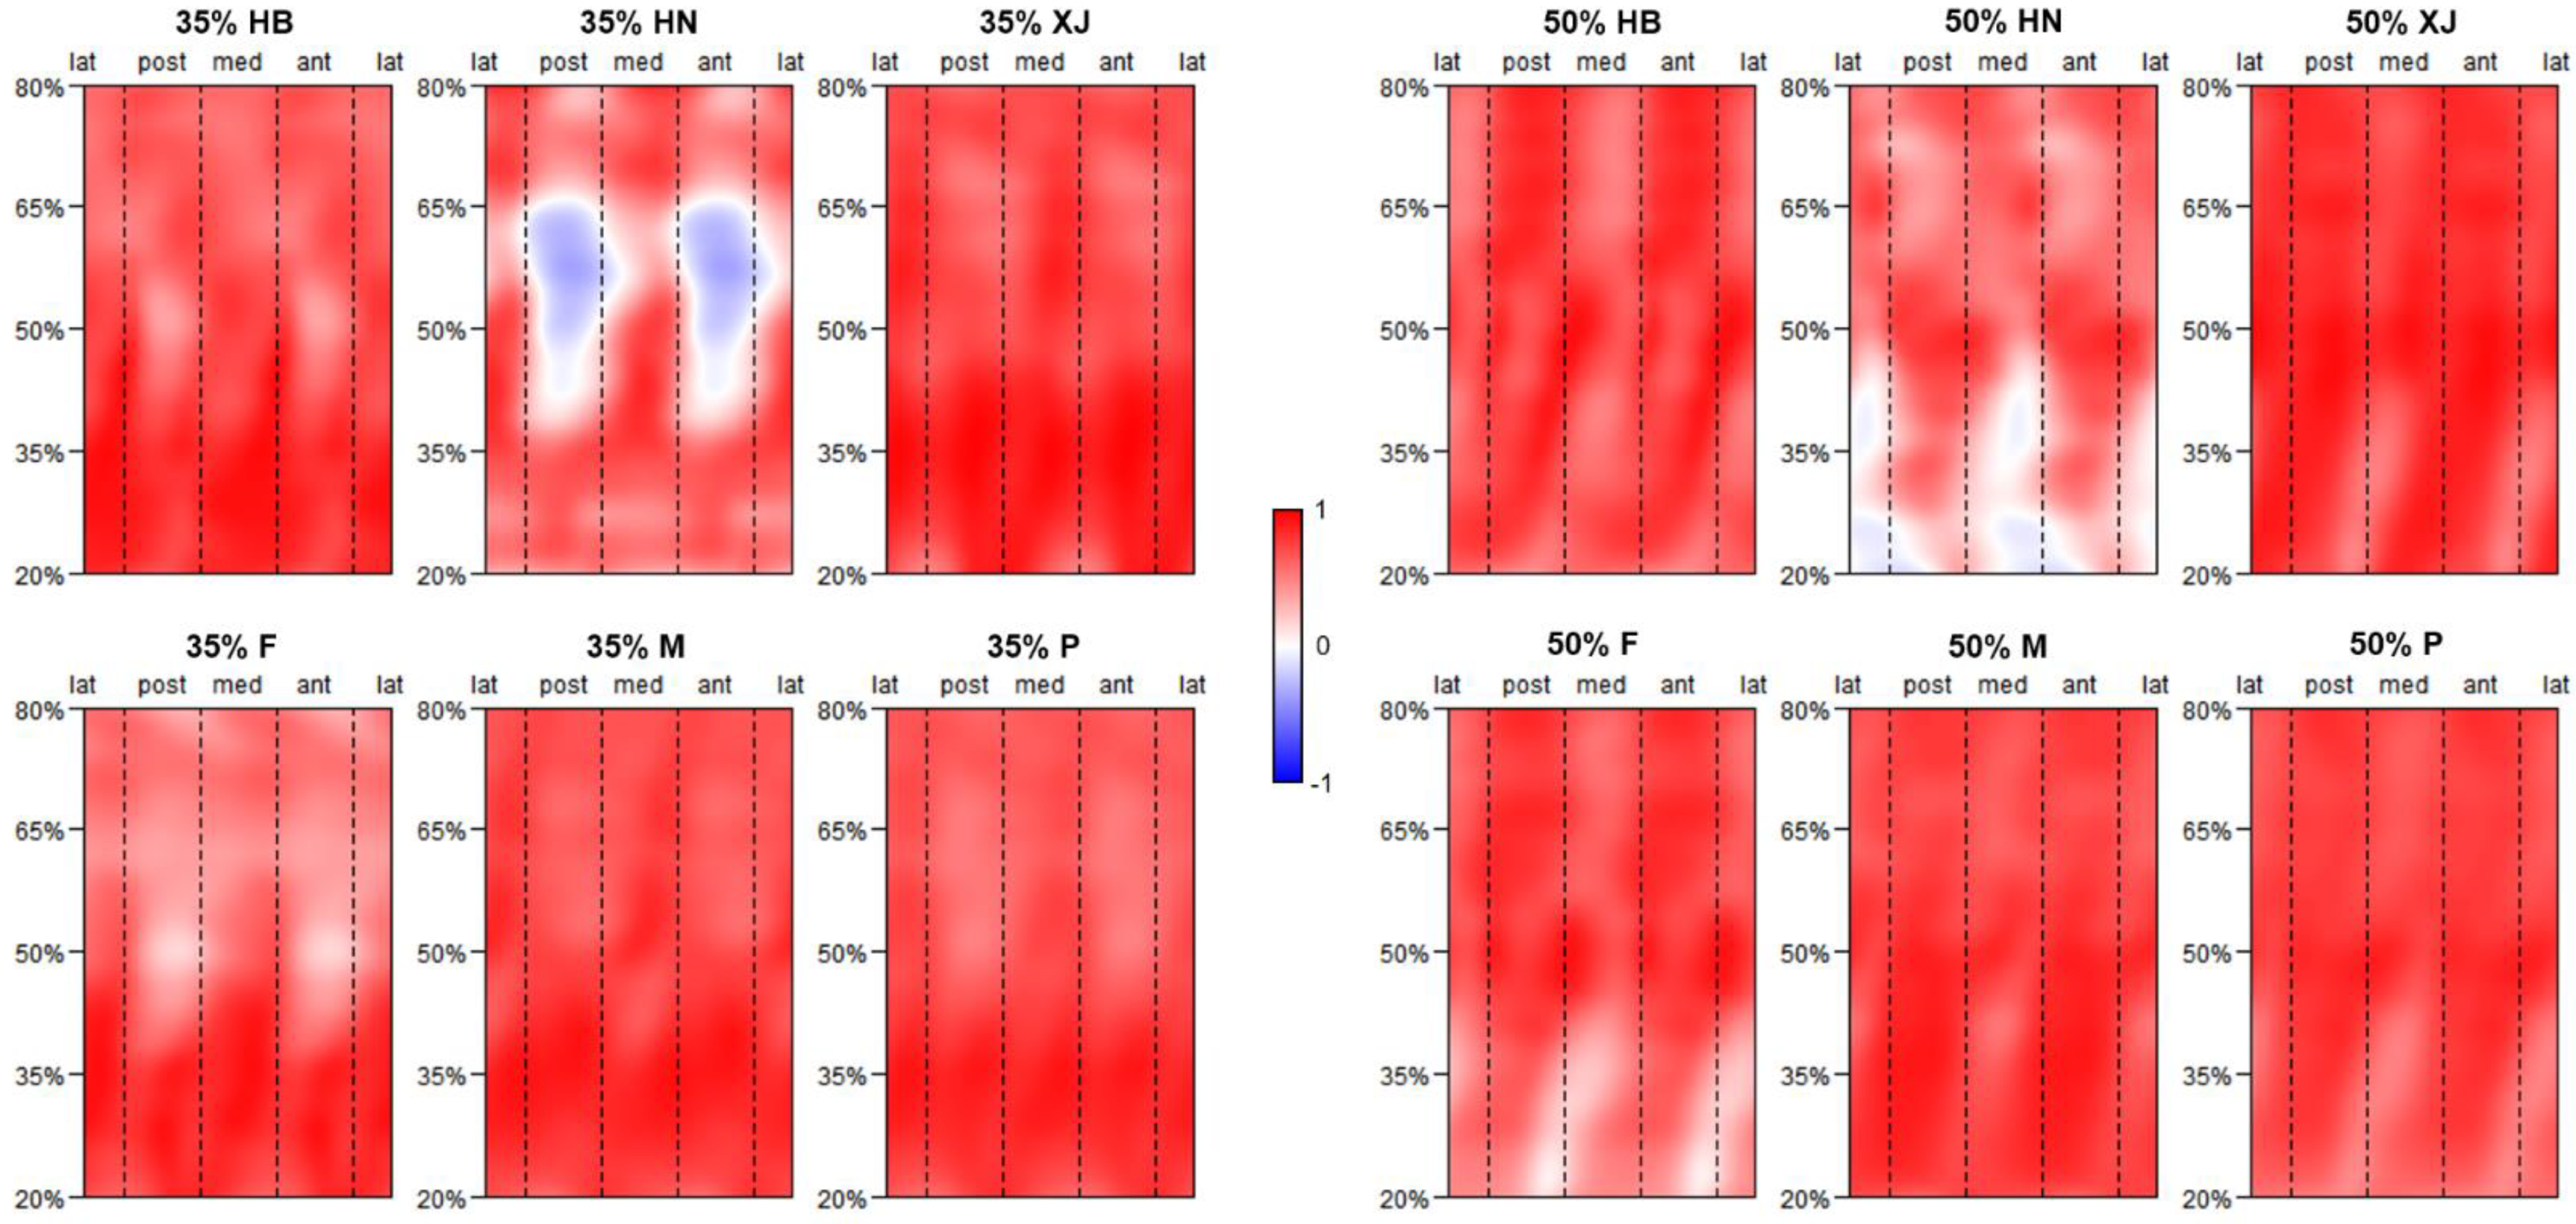
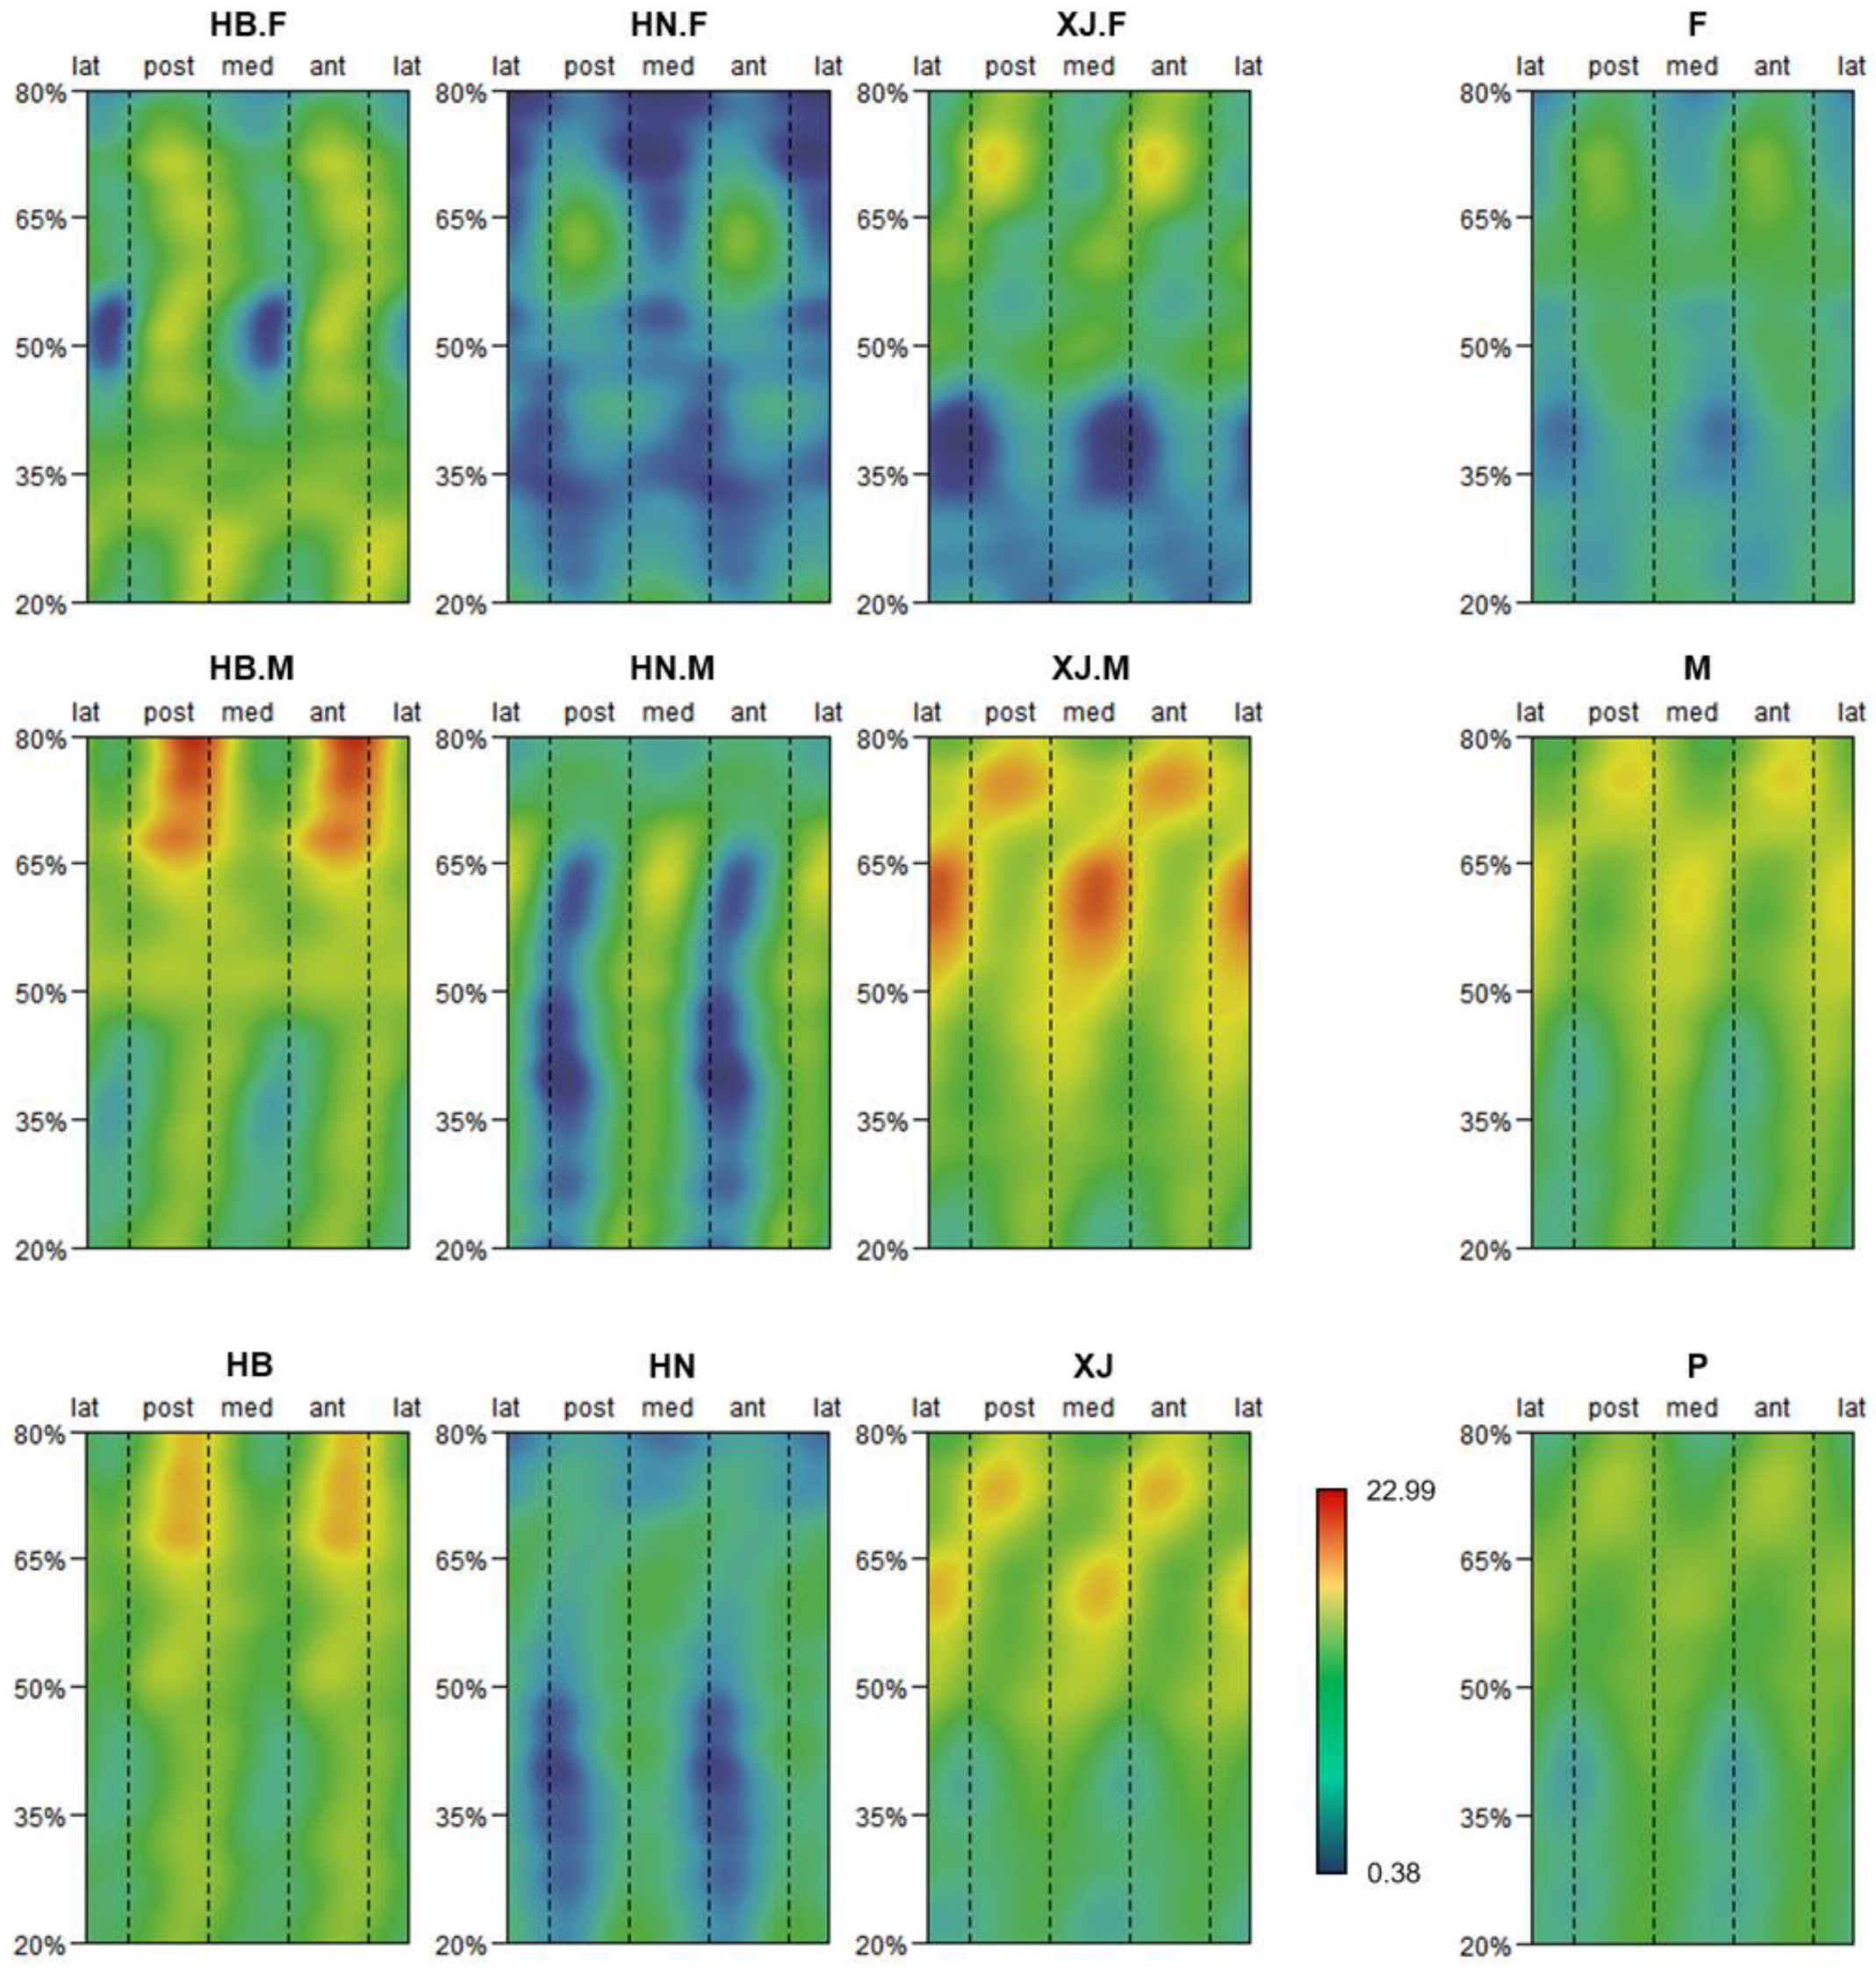
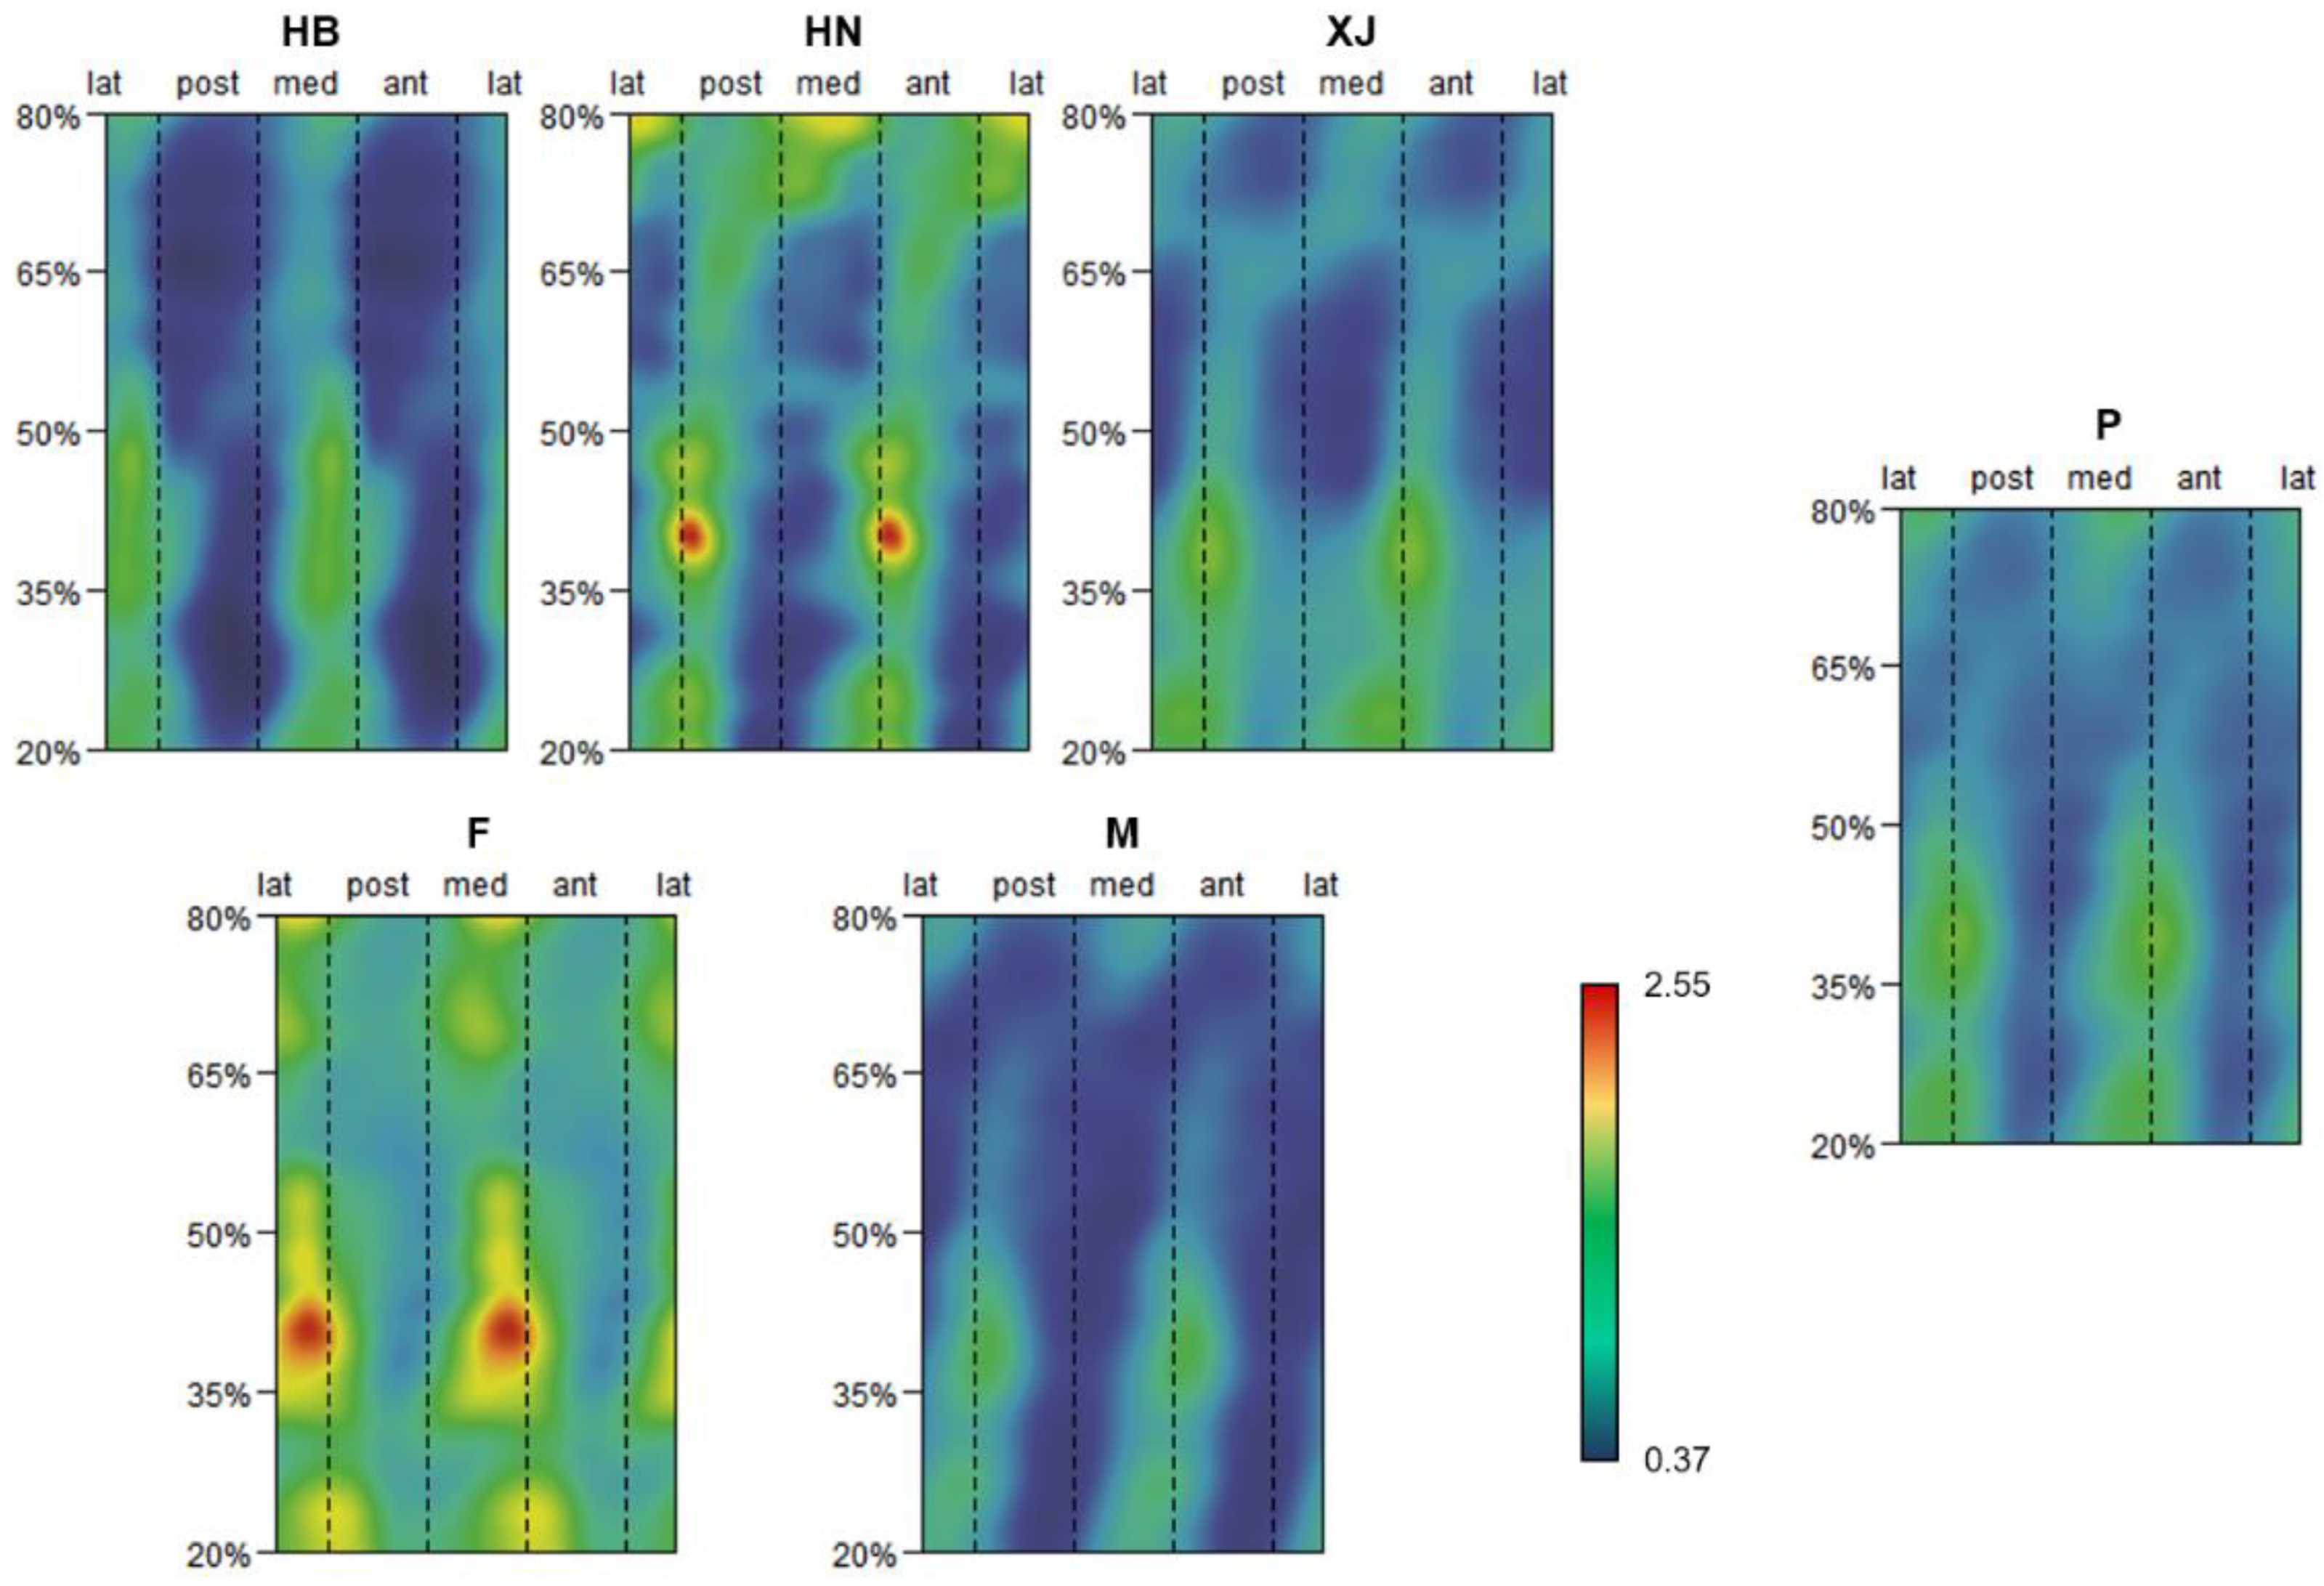
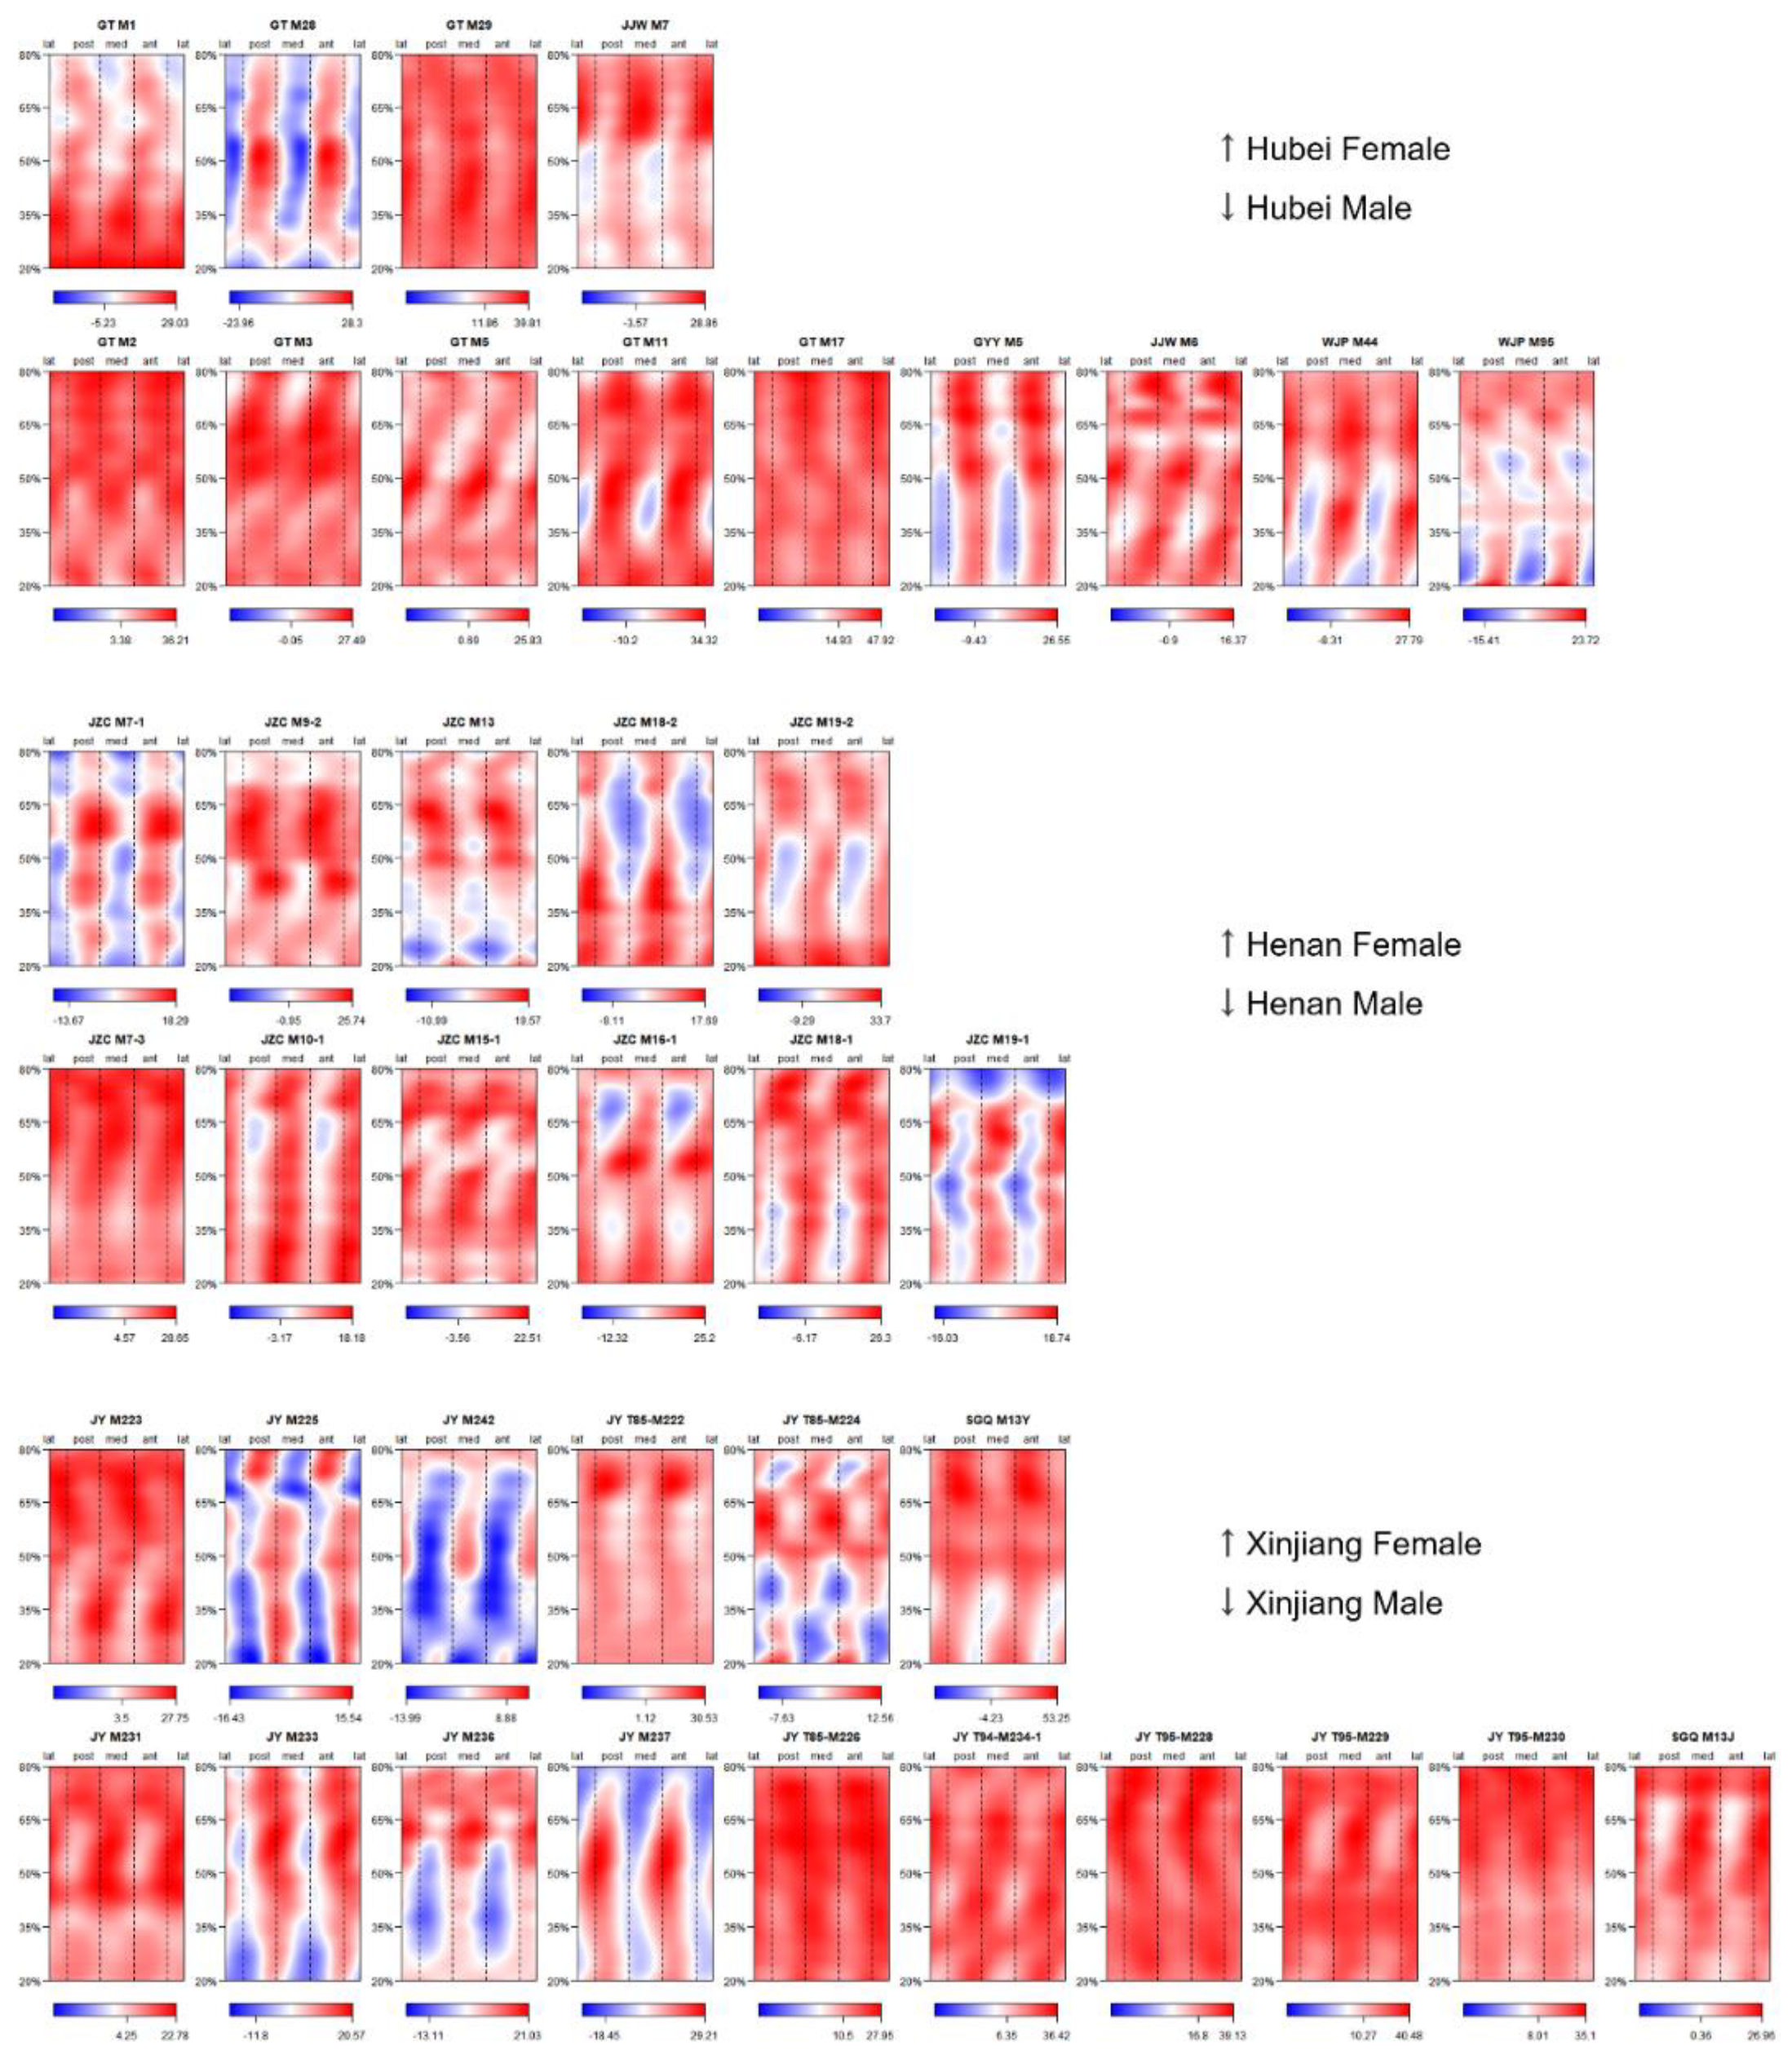
3.1. Pattern of Humeral Biomechanical Asymmetry in Modern Humans

The mean morphometric maps exhibiting SMA asymmetry values for each sub-group and pooled samples are presented in Figure 2. Hubei females and males are more asymmetrical in the near-anterolateral posteromedial aspect along the entire proximodistal diaphysis. The degree of asymmetry is transversely uniform around the mid-distal diaphysis for Hubei females, and around the midshaft for Hubei males. Hubei males have higher anteroposterior asymmetry from the proximal to mid-proximal diaphysis. Henan females have a restricted area of relatively higher anteroposterior asymmetry around the mid-proximal diaphysis, while Henan males are more asymmetrical in the near-anterolateral posteromedial aspect spanning the mid-proximal to distal diaphysis. Both Xinjiang females and males have reinforced anteroposterior asymmetrical areas around the proximal diaphysis, as well as the region between the proximal to mid-proximal diaphysis, mediolaterally. The region with a relatively higher asymmetry of Xinjiang males extends from the midshaft to the distal diaphysis in the near-anterolateral posteromedial aspect.
For the mean morphometric maps that are defined only by population, Hubei is more asymmetrical across the entire proximodistal diaphysis in the near-anterolateral posteromedial aspect, with a reinforcement of anteroposterior asymmetry along the proximal to mid-proximal diaphysis. The region with high asymmetry for Henan is located in the anterolateral posteromedial aspect between the mid-proximal to distal diaphysis. Xinjiang has higher anteroposterior asymmetry around the proximal diaphysis, connecting with another area with high mediolateral asymmetry around the mid-proximal diaphysis, which continuously extends to the midshaft in the anterolateral posteromedial aspect. Hubei and Xinjiang are more asymmetrical than Henan, according to their overall magnitude of SMA asymmetry values. For the mean morphometric maps that are defined only by sex, females are more anteroposteriorly asymmetrical between the proximal and mid-distal diaphysis, with a reinforcement of asymmetry near the mid-proximal section. The distribution patterns of males resemble that of Xinjiang, but the regions with highest asymmetry at the proximal and mid-proximal diaphysis are not so prominent, and the region with relatively higher asymmetry along the distal half of the diaphysis in the anterolateral posteromedial aspect is more developed. Males are more asymmetrical than females in general. The mean morphometric map for pooled samples shows uniform areas of asymmetry spanning from the proximal diaphysis, anteroposteriorly, to the mid-proximal diaphysis, mediolaterally, and continuing distally in the anterolateral posteromedial aspect.
According to the results of MANOVA (Table 1), the differences sourced from sex (P = 0.11), population (P = 0.296), and the interaction of sex and population (P = 0.783) are not statistically significant. The R-squared values reveal that sex, population, and the interaction of sex and population accounted for 5.49%, 5.99%, and 2.74% of the total variation, respectively. Residuals accounted for 85.77% of the total variation.
The CV morphometric maps show nearly identical distribution patterns across all the sub-groups and pooled samples (Figure 3). Relatively high CV values are concentrated in the region between the middle and mid-distal diaphysis, and at the distal extreme in the anteromedial posterolateral aspect. Similarly high CV values appear at the proximal section, mediolaterally, but to a smaller extent compared to the distal section. Henan has localized regions of higher CV values at the proximal extreme, mediolaterally, and at the mid-distal diaphysis in the anteromedial posterolateral aspect, but displays no other differences compared to Hebei and Xinjiang. Females present higher overall CV values than males.

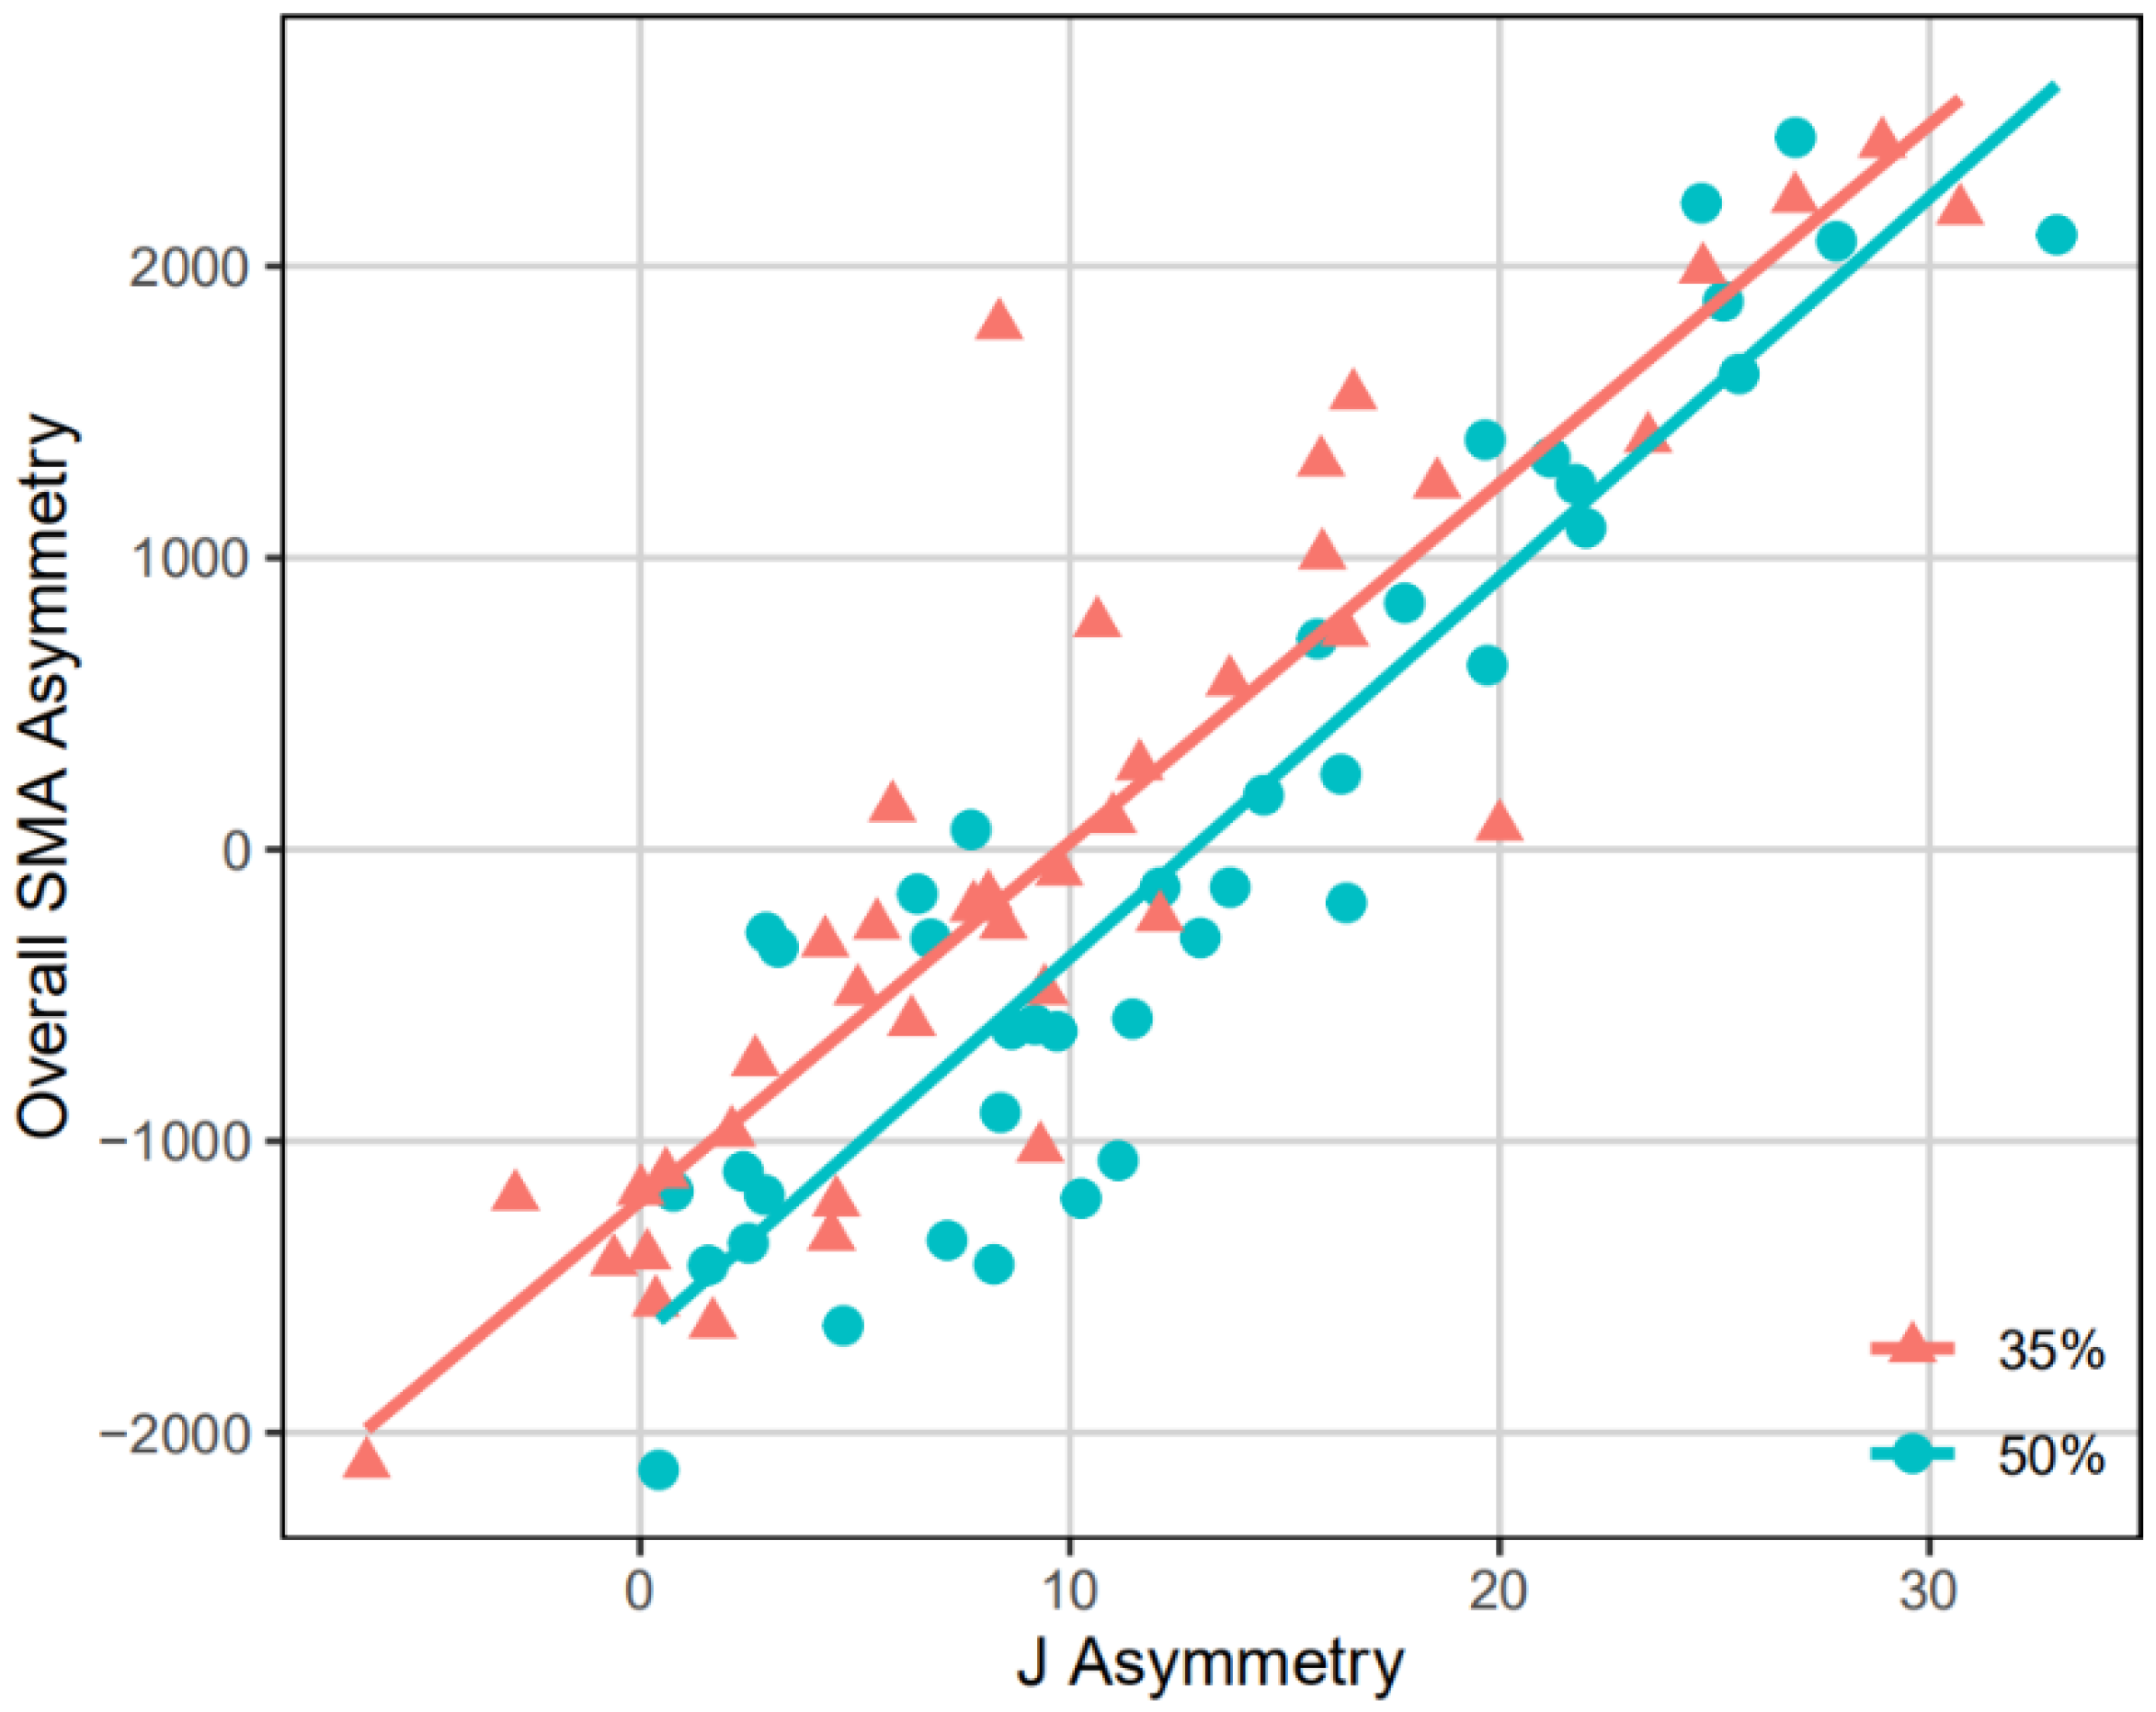
3.2. Representativeness of J35 and J50 Bilateral Asymmetry

Table 2 and Figure 4 show the result of a multivariate regression fitting all the SMA asymmetry values on the J35 or J50 asymmetry value using pooled samples. The results of J35 and J50 asymmetry are highly significant (P < 0.001), indicating that the multivariate regression model is effective. According to the R-squared values, J35 asymmetry accounts for 48.66% of the total variation, whereas J50 asymmetry accounts for 50.93%. The remaining variations are explained by the residuals, which is 51.34% in the J35 asymmetry model and 49.07% in the J50 asymmetry model.
The CC morphometric maps of the sub-groups and pooled samples are shown in Figure 5. Across all the CC morphometric maps, the SMA asymmetry values and the J35 or J50 asymmetry value are positively correlated among the entire humeral diaphysis, except for some areas of Henan. When specific to the morphometric maps of CC35, high CC35 values are detected primarily among the distal half of the diaphysis, particularly around the mid-distal to distal section, while lower CC35 values are more inclined to distribute anteroposteriorly over the proximal half of the diaphysis. Henan differs from the other sub-groups in that its SMA asymmetry values are negatively correlated with the J35 asymmetry value in the region between the mid-proximal and middle diaphysis, anteroposteriorly. For the morphometric maps of CC50, high CC50 values are found between the proximal and middle diaphysis, anteroposteriorly, which gradually shift in the anterolateral posteromedial aspect, from the middle to distal diaphysis. Comparatively, low CC50 values tend to follow the approximately anterolateral posteromedial aspect between the mid-distal and distal diaphysis. In comparison to other sub-groups, Henan exhibits a distinct distribution pattern of CC50 values at the distal humeral section, mediolaterally, with the SMA asymmetry values being negatively correlated with the J50 asymmetry value.

4. Discussion

The objective of this study was to reveal the humeral asymmetry patterns of East Asian modern humans with diverse backgrounds, by evaluating the biomechanical performance across complete humeral diaphysis rather than individual cross-sections only, as well as to identify the reliability of torsional rigidity at the 35% and 50% cross-sections (J35 and J50) in bilateral asymmetry analysis.
By quantifying the overall bending rigidity asymmetry of humeral proximodistal diaphysis using morphometric mapping of SMA asymmetry values, the variation range and pattern of humeral asymmetry in East Asian modern humans represented by our samples were investigated. In all the sub-groups, male humeri are more asymmetrical than female humeri. The Henan population has lower humeral asymmetry overall compared to the Hubei and Xinjiang populations. Although three populations show unique distributions of bending rigidity asymmetry, the inter-group differences are not significant in MANOVA. This suggests that, at least for the samples used in this study, the behavioral differences among different populations and between different sexes are not significant enough to generate discernable differences in bilateral asymmetry. The relatively small sample size of the present study might be a factor in this result. Future studies with larger sample sizes and populations from more varied backgrounds may reveal significant differences.
Overall, the mean morphometric maps of most the sub-groups and pooled samples show the following common distribution pattern: the asymmetry of the proximal section is reinforced anteroposteriorly, connecting it to another relatively asymmetrical area between the mid-proximal and middle diaphysis, mediolaterally, and finally extending to the distal end in the anterolateral posteromedial aspect. Previous research found that humeral asymmetry was most prominent at the midshaft and decreased towards both the proximal and distal diaphyseal ends, and this pattern can be attributed to the general mechanical model that bending loads should be the greatest at mid-diaphyseal regions [55]. However, as revealed in the present study, the proximal to middle diaphysis tends to have a higher asymmetrical level than the distal half, and the differences tend to be more prominent among different anatomical directions than between different sections along the humeral diaphysis. This asymmetry pattern emphasizes the necessity of examining multiple anatomical directions when analyzing bilateral asymmetry, and suggests that the mechanism regulating the response of the long bone to external stimuli might be more complicated than previously understood.
As some highly asymmetrical regions correspond with the positions of major muscle attachments, such as deltoid tuberosity and the crest of the greater tubercle [56], the distribution of areas with reinforced asymmetry might reflect adaptions to muscle loadings, which were proved to be an important determinant of upper-limb strength [57,58,59]. In our study, factors such as genetic regulation and health condition can be excluded from the elements influencing the bilateral asymmetry because the analysis was based on paired humeri from the same individual. However, more experimental evidences are needed to verify this hypothesis in future studies.
According to the results of the CV morphometric maps, the variability in bilateral asymmetry is not consistent across the humeral diaphysis. Highly variable regions are restricted to the distal half of humeral diaphysis in the anteromedial posterolateral aspect, corresponding to the medial/lateral border and medial/lateral supracondylar. Since this feature is shared by all the sub-groups as well as the pooled data, it may represent a generality of East Asian modern humans. It is noteworthy that highly variable regions on the humeral diaphysis tend to overlap with areas presenting a low asymmetrical level, which may be a signal of relative insensitivity to lateralized mechanical stimuli (see previous paragraph). Previous studies found that humeral distal articular properties, such as articular surface area, did not just respond to mechanical loadings, but were also ontogenetically constrained and genetically canalized [60]. As the structure of the medial/lateral border and medial/lateral supracondylar are closely related to the distal articular morphology, according to their anatomical adjacency [56], one possible interpretation for the high variability of asymmetry is that these regions might present fluctuating asymmetry that is attributable to genetic, nutrient, and health factors instead of the mechanical environment alone [60,61,62].
This study supports the previous perspective that torsional rigidity at a specific cross-section (35% or 50% of the humeral biomechanical length) can be used to indicate the overall biomechanical asymmetry of humeral diaphysis, because the multivariate regression model built on all the specimens is effective, and a positive correlation exists between the SMA asymmetry and J asymmetry at most diaphyseal locations. However, we should also note that a single J asymmetry value cannot convey the complexity of the entire humerus’ asymmetry. The correlation between overall SMA asymmetry and J asymmetry is moderate, because J35 and J50 asymmetry can only explain about half of the total variation in humeral bilateral asymmetry. In addition, the degree of correlation between SMA asymmetry and J asymmetry varies across the humeral diaphysis, and is only strong in specific regions.

5. Conclusions

This study evaluated humeral biomechanical asymmetry across complete humeral diaphysis based on high-resolution micro-CT, and by quantifiable visualization and statistical methods. Using specimens from three Chinese archaeological populations that varied in geographic location, chronological age, and subsistence pattern, the pattern of humeral asymmetry in East Asian modern humans was investigated. Distinct humeral asymmetry patterns are observed on the mean morphometric map, but are not statistically significant. Analogous distributions of highly asymmetrical regions and CV are observed across nearly all the sexes and populations, indicating possible universality of the humeral asymmetry pattern in East Asian modern humans. These highly asymmetrical regions correspond with major muscle attachments. The diaphyseal regions that are highly varied in bilateral asymmetry tend to present a low asymmetrical level. Although J35 and J50 asymmetry are related to the overall humeral asymmetry, it can only explain about half of the total variation. These findings suggest that the overall biomechanical asymmetry of humeral diaphysis is more complicated than previously assumed. This study complements previous findings on humeral asymmetry, and accumulate data and knowledge for future works in this area.

Author Contributions

Conceptualization, Y.Z.; methodology, Y.Z.; software, Y.Z.; validation, Y.Z., S.X.; formal analysis, Y.Z.; investigation, Y.Z.; resources, M.Z., H.L., J.H.; data curation, Y.Z., S.X.; writing—original draft preparation, Y.Z.; writing—review and editing, P.W., S.X.; visualization, Y.Z.; supervision, S.X.; project administration, S.X.; funding acquisition, H.L., S.X. All authors have read and agreed to the published version of the manuscript.

Funding

This research was funded by the Strategic Priority Research Program of the Chinese Academy of Sciences (XDB26000000), the National Natural Science Foundation of China (41872030), and the National Social Science Fund of China (19BKG039, 19VJX066).

Institutional Review Board Statement

Not applicable.

Informed Consent Statement

Not applicable.

Data Availability Statement

The data supporting this study are available from the corresponding author on reasonable request.

Acknowledgments

The authors thank Yemao Hou, Pengfei Yin, and Jiawei Ma for their help in scanning and image processing. The authors also thank Xiujie Wu and Mackie O’Hara Ali for optimizing the manuscript.

Conflicts of Interest

The authors declare no conflict of interest. The funders had no role in the design of the study; in the collection, analyses, or interpretation of data; in the writing of the manuscript, or in the decision to publish the results.

Appendix A

Figure A1. Morphometric maps exhibiting SMA asymmetry values of all specimens.
Symmetry 13 01843 g0a1

References

  1. DeLude, J.A.; Bicknell, R.T.; MacKenzie, G.A.; Ferreira, L.M.; Dunning, C.E.; King, G.J.W.; Johnson, J.A.; Drosdowech, D.S. An anthropometric study of the bilateral anatomy of the humerus. J. Shoulder Elbow Surg. 2007, 16, 477–483. [Google Scholar] [CrossRef] [PubMed]
  2. Ubelaker, D.H.; Zarenko, K.M. Can handedness be determined from skeletal remains? A chronological review of the literature. J. Forensic Sci. 2012, 57, 1421–1426. [Google Scholar] [CrossRef] [PubMed]
  3. Ruff, C.B. Biomechanical analyses of archaeological human skeletons. In Biological Anthropology of the Human Skeleton, 3rd ed.; Katzenberg, M.A., Grauer, A.L., Eds.; Wiley-Blackwell: Hoboken, NJ, USA, 2018; pp. 189–224. [Google Scholar]
  4. Faurie, C.; Raymond, M. Handedness, homicide and negative frequency-dependent selection. Proc. R. Soc. B 2005, 272, 25–28. [Google Scholar] [CrossRef] [PubMed] [Green Version]
  5. Shaw, C.N. Is ‘hand preference’ coded in the hominin skeleton? An in-vivo study of bilateral morphological variation. J. Hum. Evol. 2011, 61, 480–487. [Google Scholar] [CrossRef] [PubMed]
  6. Ozener, B. Extreme behavioral lateralization and the remodeling of the distal humerus. Am. J. Hum. Biol. 2012, 24, 436–440. [Google Scholar] [CrossRef] [PubMed]
  7. Haapasalo, H.; Kannus, P.; Sievänen, H.; Pasanen, M.; Uusi-Rasi, K.; Heinonen, A.; Oja, P.; Vuori, I. Effect of long-term unilateral activity on bone mineral density of female junior tennis players. J. Bone Miner. Res. 1998, 13, 310–319. [Google Scholar] [CrossRef] [PubMed]
  8. Bass, S.L.; Saxon, L.; Daly, R.M.; Turner, C.H.; Robling, A.G.; Seeman, E.; Stuckey, S. The effect of mechanical loading on the size and shape of bone in pre-, peri-, and postpubertal girls: A study in tennis players. J. Bone Miner. Res. 2002, 17, 2274–2280. [Google Scholar] [CrossRef] [PubMed]
  9. Shaw, C.N.; Stock, J.T. Habitual throwing and swimming correspond with upper limb diaphyseal strength and shape in modern human athletes. Am. J. Phys. Anthropol. 2009, 140, 160–172. [Google Scholar] [CrossRef]
  10. Balzeau, A.; Ball-Albessard, L.; Kubicka, A.M. Variation and correlations in departures from symmetry of brain torque, humeral morphology and handedness in an archaeological sample of Homo sapiens. Symmetry 2020, 12, 432. [Google Scholar] [CrossRef] [Green Version]
  11. Shackelford, L.L. Regional variation in the postcranial robusticity of late upper paleolithic humans. Am. J. Phys. Anthropol. 2007, 133, 655–668. [Google Scholar] [CrossRef] [PubMed]
  12. Sparacello, V.S.; d’Ercole, V.; Coppa, A. A bioarchaeological approach to the reconstruction of changes in military organization among Iron Age Samnites (Vestini) From Abruzzo, Central Italy. Am. J. Phys. Anthropol. 2015, 156, 305–316. [Google Scholar] [CrossRef] [PubMed] [Green Version]
  13. Sládek, V.; Ruff, C.B.; Berner, M.; Holt, B.; Niskanen, M.; Schuplerová, E.; Hora, M. The impact of subsistence changes on humeral bilateral asymmetry in Terminal Pleistocene and Holocene Europe. J. Hum. Evol. 2016, 92, 37–49. [Google Scholar] [CrossRef] [PubMed] [Green Version]
  14. Sparacello, V.S.; Villotte, S.; Shackelford, L.L.; Trinkaus, E. Patterns of humeral asymmetry among Late Pleistocene humans. Comptes Rendus Palevol 2017, 16, 680–689. [Google Scholar] [CrossRef]
  15. Wei, P.; Lu, H.; Carlson, K.J.; Zhang, H.; Hui, J.; Zhu, M.; He, K.; Jashashvili, T.; Zhang, X.; Yuan, H.; et al. The upper limb skeleton and behavioral lateralization of modern humans from Zhaoguo Cave, southwestern China. Am. J. Phys. Anthropol. 2020, 173, 671–696. [Google Scholar] [CrossRef] [PubMed]
  16. Wei, P.; Zhao, Y.; Walker, C.S.; He, J.; Lu, X.; Hui, J.; Shui, W.; Jin, L.; Liu, W. Internal structural properties of the humeral diaphyses in an early modern human from Tianyuan Cave, China. Quat. Int. 2021, 591, 107–118. [Google Scholar] [CrossRef]
  17. Hsieh, Y.-F.; Robling, A.G.; Ambrosius, W.T.; Burr, D.B.; Turner, C.H. Mechanical loading of diaphyseal bone in vivo: The strain threshold for an osteogenic response varies with location. J. Bone Miner. Res. 2001, 16, 2291–2297. [Google Scholar] [CrossRef] [PubMed]
  18. Burr, D.B.; Robling, A.G.; Turner, C.H. Effects of biomechanical stress on bones in animals. Bone 2002, 30, 781–786. [Google Scholar] [CrossRef]
  19. Pearson, O.M.; Lieberman, D.E. The aging of Wolff’s “law”: Ontogeny and responses to mechanical loading in cortical bone. Am. J. Phys. Anthropol. 2004, 125, 63–99. [Google Scholar] [CrossRef] [PubMed]
  20. Ruff, C.; Holt, B.; Trinkaus, E. Who’s afraid of the big bad wolff? “Wolff is law” and bone functional adaptation. Am. J. Phys. Anthropol. 2006, 129, 484–498. [Google Scholar] [CrossRef] [PubMed]
  21. Gosman, J.H.; Hubbell, Z.R.; Shaw, C.N.; Ryan, T.M. Development of cortical bone geometry in the human femoral and tibial diaphysis. Anat. Rec. 2013, 296, 774–787. [Google Scholar] [CrossRef]
  22. Sládek, V.; Berner, M.; Holt, B.; Niskanen, M.; Ruff, C.B. Past human manipulative behavior in the European Holocene as assessed through upper limb asymmetry. In Skeletal Variation and Adaptation in Europeans; Wiley-Blackwell: Hoboken, NJ, USA, 2018; pp. 163–208. [Google Scholar]
  23. Perchalski, B.; Placke, A.; Sukhdeo, S.M.; Shaw, C.N.; Gosman, J.H.; Raichlen, D.A.; Ryan, T.M. Asymmetry in the cortical and trabecular bone of the human humerus during development. Anat. Rec. 2018, 301, 1012–1025. [Google Scholar] [CrossRef] [PubMed] [Green Version]
  24. Hong, E.; Kwak, D.-S.; Kim, I.-B. Morphometric evaluation of detailed asymmetry for the proximal humerus in Korean population. Symmetry 2021, 13, 862. [Google Scholar] [CrossRef]
  25. Ruff, C.B.; Burgess, M.L.; Bromage, T.G.; Mudakikwa, A.; McFarlin, S.C. Ontogenetic changes in limb bone structural proportions in mountain gorillas (Gorilla beringei beringei). J. Hum. Evol. 2013, 65, 693–703. [Google Scholar] [CrossRef] [PubMed]
  26. Ruff, C.B. Long bone articular and diaphyseal structure in old world monkeys and apes. I: Locomotor effects. Am. J. Phys. Anthropol. 2002, 119, 305–342. [Google Scholar] [CrossRef] [PubMed]
  27. Weiss, E. Humeral cross-sectional morphology from 18th century Quebec prisoners of war: Limits to activity reconstruction. Am. J. Phys. Anthropol. 2005, 126, 311–317. [Google Scholar] [CrossRef] [PubMed]
  28. Wescott, D.J.; Cunningham, D.L. Temporal changes in Arikara humeral and femoral cross-sectional geometry associated with horticultural intensification. J. Archaeol. Sci. 2006, 33, 1022–1036. [Google Scholar] [CrossRef]
  29. Sládek, V.; Berner, M.; Sosna, D.; Sailer, R. Human manipulative behavior in the Central European Late Eneolithic and Early Bronze Age: Humeral bilateral asymmetry. Am. J. Phys. Anthropol. 2007, 133, 669–681. [Google Scholar] [CrossRef] [PubMed]
  30. Rhodes, J.A.; Knüsel, C.J. Activity-related skeletal change in medieval humeri: Cross-sectional and architectural alterations. Am. J. Phys. Anthropol. 2005, 128, 536–546. [Google Scholar] [CrossRef] [PubMed] [Green Version]
  31. Hill, E.C.; Pearson, O.M.; Durband, A.C.; Walshe, K.; Carlson, K.J.; Grine, F.E. An examination of the cross-sectional geometrical properties of the long bone diaphyses of Holocene foragers from Roonka, South Australia. Am. J. Phys. Anthropol. 2020, 172, 682–697. [Google Scholar] [CrossRef] [PubMed]
  32. Cowgill, L.W.; Mednikova, M.B.; Buzhilova, A.P.; Trinkaus, E. The Sunghir 3 Upper Paleolithic juvenile: Pathology versus persistence in the Paleolithic. Int. J. Osteoarchaeol. 2015, 25, 176–187. [Google Scholar] [CrossRef]
  33. Shaw, C.N.; Stock, J.T. Extreme mobility in the Late Pleistocene? Comparing limb biomechanics among fossil Homo, varsity athletes and Holocene foragers. J. Hum. Evol. 2013, 64, 242–249. [Google Scholar] [CrossRef] [PubMed]
  34. Trinkaus, E. Epipaleolithic human appendicular remains from Ein Gev I, Israel. Comptes Rendus Palevol 2018, 17, 616–627. [Google Scholar] [CrossRef]
  35. Kubicka, A.M.; Nowaczewska, W.; Balzeau, A.; Piontek, J. Bilateral asymmetry of the humerus in Neandertals, Australian aborigines and medieval humans. Am. J. Phys. Anthropol. 2018, 167, 46–60. [Google Scholar] [CrossRef]
  36. Ogilvie, M.D.; Hilton, C.E. Cross-sectional geometry in the humeri of foragers and farmers from the prehispanic American Southwest: Exploring patterns in the sexual division of labor. Am. J. Phys. Anthropol. 2011, 144, 11–21. [Google Scholar] [CrossRef] [PubMed]
  37. Sparacello, V.S.; Pearson, O.M.; Coppa, A.; Marchi, D. Changes in skeletal robusticity in an iron age agropastoral group: The samnites from the Alfedena necropolis (Abruzzo, Central Italy). Am. J. Phys. Anthropol. 2011, 144, 119–130. [Google Scholar] [CrossRef] [PubMed]
  38. Warden, S.J.; Mantila Roosa, S.M.; Kersh, M.E.; Hurd, A.L.; Fleisig, G.S.; Pandy, M.G.; Fuchs, R.K. Physical activity when young provides lifelong benefits to cortical bone size and strength in men. Proc. Natl. Acad. Sci. USA 2014, 111, 5337–5342. [Google Scholar] [CrossRef] [PubMed] [Green Version]
  39. Wilson, L.A.B.; Humphrey, L.T. A Virtual geometric morphometric approach to the quantification of long bone bilateral asymmetry and cross-sectional shape. Am. J. Phys. Anthropol. 2015, 158, 541–556. [Google Scholar] [CrossRef]
  40. Bondioli, L.; Bayle, P.; Dean, C.; Mazurier, A.; Puymerail, L.; Ruff, C.; Stock, J.T.; Volpato, V.; Zanolli, C.; Macchiarelli, R. Technical note: Morphometric maps of long bone shafts and dental roots for imaging topographic thickness variation. Am. J. Phys. Anthropol. 2010, 142, 328–334. [Google Scholar] [CrossRef]
  41. Zhao, Y.; Zhou, M.; Wei, P.; Xing, S. 2D visualization and quantitative analysis of the humeral diaphysis cortical thickness. Acta Anthropol. Sin. 2020, 39, 632–647. [Google Scholar] [CrossRef]
  42. Puymerail, L.; Ruff, C.B.; Bondioli, L.; Widianto, H.; Trinkaus, E.; Macchiarelli, R. Structural analysis of the Kresna 11 Homo erectus femoral shaft (Sangiran, Java). J. Hum. Evol. 2012, 63, 741–749. [Google Scholar] [CrossRef] [PubMed]
  43. Puymerail, L.; Volpato, V.; Debénath, A.; Mazurier, A.; Tournepiche, J.-F.; Macchiarelli, R. A Neanderthal partial femoral diaphysis from the "grotte de la Tour", La Chaise-de-Vouthon (Charente, France): Outer morphology and endostructural organization. Comptes Rendus Palevol 2012, 11, 581–593. [Google Scholar] [CrossRef]
  44. Morimoto, N.; Ponce de León, M.S.; Zollikofer, C.P.E. Exploring femoral diaphyseal shape variation in wild and captive chimpanzees by means of morphometric mapping: A test of Wolff’s law. Anat. Rec. 2011, 294, 589–609. [Google Scholar] [CrossRef] [PubMed]
  45. Jashashvili, T.; Dowdeswell, M.R.; Lebrun, R.; Carlson, K.J. Cortical structure of hallucal metatarsals and locomotor adaptations in hominoids. PLoS ONE 2015, 10, e0117905. [Google Scholar] [CrossRef]
  46. Cameron, M.E.; Pfeiffer, S. Long bone cross-sectional geometric properties of Later Stone Age foragers and herder-foragers. S. Afr. J. Sci. 2014, 110, 01–11. [Google Scholar] [CrossRef] [Green Version]
  47. Tian, J.; Tang, L.; Shi, D.; Luo, Y.; Zhao, Z. Research on the charred plant remains unearthed from the Jijiawan site in Fang County, Hubei Province. Cult. Relics South. China 2019, 5, 180–188. (In Chinese) [Google Scholar] [CrossRef]
  48. Xing, S.; Carlson, K.J.; Wei, P.; He, J.; Liu, W. Morphology and structure of Homo erectus humeri from Zhoukoudian, Locality 1. PeerJ 2018, 6, e4279. [Google Scholar] [CrossRef] [PubMed] [Green Version]
  49. Wang, L.; Xiao, G.; Liu, Z.; Lv, E.; Wu, Y. Brief report on excavation of Jiayi cemeteries in Turpan, Xinjiang. Turfanological Res. 2014, 1, 1–19. [Google Scholar] [CrossRef]
  50. Xing, K.; Zhang, Y.; Li, Z. 新疆鄯善三个桥墓葬发掘简报. Cult. Relics 2002, 6, 46–56. (In Chinese). Available online: http://www.cqvip.com/qk/97337x/2002006/11400528.html (accessed on 27 August 2021).
  51. Xiao, G. The Review and Study of Jia Yi Cemetery in Turfan, Xinjiang. Master’s Thesis, Northwest University, Xi’an, China, 2018. [Google Scholar]
  52. Profico, A.; Bondioli, L.; Raia, P.; O’Higgins, P.; Marchi, D. morphomap: An R package for long bone landmarking, cortical thickness, and cross-sectional geometry mapping. Am. J. Phys. Anthropol. 2021, 174, 129–139. [Google Scholar] [CrossRef]
  53. Collyer, M.L.; Adams, D.C. RRPP: An r package for fitting linear models to high-dimensional data using residual randomization. Methods Ecol. Evol. 2018, 9, 1772–1779. [Google Scholar] [CrossRef] [Green Version]
  54. Adams, D.C.; Otárola-Castillo, E. geomorph: An r package for the collection and analysis of geometric morphometric shape data. Methods Ecol. Evol. 2013, 4, 393–399. [Google Scholar] [CrossRef]
  55. Zelazny, K.G.; Sylvester, A.D.; Ruff, C.B. Bilateral asymmetry and developmental plasticity of the humerus in modern humans. Am. J. Phys. Anthropol. 2021, 174, 418–433. [Google Scholar] [CrossRef] [PubMed]
  56. White, T.D.; Black, M.T.; Folkens, P.A. Arm: Humerus, Radius, and Ulna. In Human Osteology, 3rd ed.; Academic Press: San Diego, CA, USA, 2012; pp. 175–198. [Google Scholar]
  57. Ruff, C. Growth in bone strength, body size, and muscle size in a juvenile longitudinal sample. Bone 2003, 33, 317–329. [Google Scholar] [CrossRef]
  58. Schoenau, E.; Neu, C.M.; Mokov, E.; Wassmer, G.; Manz, F. Influence of puberty on muscle area and cortical bone area of the forearm in boys and girls. J. Clin. Endocrinol. Metab. 2000, 85, 1095–1098. [Google Scholar] [CrossRef] [PubMed]
  59. Niinimäki, S. The relationship between musculoskeletal stress markers and biomechanical properties of the humeral diaphysis. Am. J. Phys. Anthropol. 2012, 147, 618–628. [Google Scholar] [CrossRef] [PubMed]
  60. Lieberman, D.E.; Devlin, M.J.; Pearson, O.M. Articular area responses to mechanical loading: Effects of exercise, age, and skeletal location. Am. J. Phys. Anthropol. 2001, 116, 266–277. [Google Scholar] [CrossRef] [PubMed]
  61. Plochocki, J.H. Bilateral variation in limb articular surface dimensions. Am. J. Hum. Biol. 2004, 16, 328–333. [Google Scholar] [CrossRef] [PubMed]
  62. Hallgrímsson, B.; Willmore, K.; Hall, B.K. Canalization, developmental stability, and morphological integration in primate limbs. Am. J. Phys. Anthropol. 2002, 119, 131–158. [Google Scholar] [CrossRef] [Green Version]
Figure 1. The positional and directional correspondence between humeral external structure, diaphyseal cross-sections, and morphometric map exhibiting bending rigidity asymmetry. Abbreviations for anatomical terms are as follows: prox: proximal; mid: middle; dist: distal; lat: lateral; post: posterior; med: medial; ant: anterior.
Symmetry 13 01843 g001
Figure 2. Mean morphometric maps exhibiting SMA asymmetry values for sub-groups and pooled samples (P). Sub-groups are defined by population, sex, and the pairwise combination of these two factors. Populations include Hubei (HB), Henan (HN), and Xinjiang (XJ); sexes include female (F) and male (M). All mean morphometric maps are under the same chromatic scale.
Symmetry 13 01843 g002
Figure 3. Morphometric maps exhibiting the coefficient of variation (CV) for SMA asymmetry values in sub-groups and pooled samples (P). Sub-groups are defined by population and sex. Populations include Hubei (HB), Henan (HN), and Xinjiang (XJ); sexes include female (F) and male (M). All CV morphometric maps are under the same chromatic scale.
Symmetry 13 01843 g003
Figure 4. Multivariate regression of all SMA asymmetry values on J asymmetry value at the 35% or 50% cross-section using pooled samples.
Symmetry 13 01843 g004
Figure 5. Morphometric maps exhibiting the correlation coefficient (CC) between SMA asymmetry values and J asymmetry value at the 35% or 50% cross-section in sub-groups and pooled samples (P). Sub-groups are defined by population and sex. Populations include Hubei (HB), Henan (HN), and Xinjiang (XJ); sexes include female (F) and male (M). All CC morphometric maps are under the same chromatic scale.
Symmetry 13 01843 g005
Table 1. MANOVA results interpreting the differences between sexes and among populations.
DfSSMSRsqFZP (>F)
Sex15,309,4155,309,4150.054942.17781.311400.110
Population25,792,2182,896,1090.059931.18790.580140.296
Sex:Population22,652,0771,326,0390.027440.5439−0.788750.783
Residuals3482,891,4032,437,9820.85769
Total3996,645,113
Df: degree of freedom; SS: sums of squares; MS: mean squares; Rsq: R-squared values.
Table 2. Multivariate regression of all SMA asymmetry values on J asymmetry value.
DfSSMSRsqFZP (>F)
J35 asymmetry147,026,55847,026,5580.4865936.0153.54790.001 **
Residuals3849,618,5551,305,7510.51341
Total3996,645,113
J50 asymmetry149,218,06849,218,0680.5092739.4353.74750.001 **
Residuals3847,427,0461,248,0800.49073
Total3996,645,113
Df: degree of freedom; SS: sums of squares; MS: mean squares; Rsq: R-squared values; **: statistically highly significant.
Publisher’s Note: MDPI stays neutral with regard to jurisdictional claims in published maps and institutional affiliations.

