Article

Investigation and Control of Damping in VSC–MTDC System with DC Circuit Breakers

1
Institute of New Energy, China University of Petroleum (East China), Qingdao 266580, China
2
Shandong Energy Group Co., Ltd., Jining 273500, China
*
Author to whom correspondence should be addressed.
Symmetry 2021, 13(11), 2037; https://doi.org/10.3390/sym13112037
Submission received: 23 August 2021 / Revised: 11 October 2021 / Accepted: 21 October 2021 / Published: 28 October 2021
(This article belongs to the Special Issue Advanced Technologies in Electrical and Electronic Engineering)

Abstract

:
DC circuit breaker (DCCB) systems with a DC reactor in series are normally equipped in the voltage-sourced-converter-based multi-terminal DC (VSC–MTDC) systems for DC fault clearance. However, it is revealed that the use of DC reactors could undermine the system damping and deteriorate the system stability. In this paper, a controller based on hybrid sensitivity is proposed to improve the stability of power system and realize the power symmetry of multi-terminal systems. Firstly, based on a generalized MTDC small-signal model, an eigenvalue analysis is performed to provide deep insight into the stability issue imposed by DC reactors. Furthermore, a local controller based on hybrid sensitivity was proposed, and on this basis, a global controller was designed to solve asymmetrical power flow. Finally, a four-terminal VSC–MTDC model was built in Simulink to evaluate the performance of DC-PSS. Simulation results verify the effectiveness of the proposed controller in stabilizing MTDC systems and symmetrizing of power flow.

1. Introduction

In recent years, there has been an increasing penetration of renewable energy sources (RESs) such as wind energy and solar energy. However, since the conventional AC transmission suffers greatly from the intermittent and stochastic characteristics of RESs, voltage-sourced-converter-based high-voltage direct current (VSC–HVDC) power transmission has lately drawn great attention in large-scale RES integration applications. For point-to-point VSC–HVDC links, a DC fault could lead to a system failure, thereby resulting in the loss of massive transmission power. By enhancing energy reliability and flexibility, VSC–MTDC, which consists of multiple point-to-point HVDC links, is considered as a promising technology from the network operators’ perspectives [1,2].
The stable and safe operation of VSC–MTDC remains an ongoing challenge, because commonly used VSC topologies, such as the two-level VSC and half-bridge modular multilevel converter (MMC), cannot isolate DC faults [3,4,5]. Therefore, it is required to paralyze all the converters until the DC fault is totally cleared. Presently, MMCs with fault-blocking capability and DC circuit breakers (DCCBs) are regarded as the main methods to handle DC faults [5,6,7,8,9,10]. Considering the cost and technology maturity, the DCCB-based fault ride-through strategy is more suitable for VSC–MTDC applications.
For a VSC–MTDC, instabilities can take place in a DC network if connected converters interact undesirably with other parts in the system [11,12,13,14]. Moreover, in a MTDC system equipped a proactive hybrid DCCB or solid-state DCCB, a DC reactor is used to limit the changing rate of a fault current. However, the DC reactor could deteriorate the system transient process and even cause instabilities. Therefore, if we want to use a DC circuit breaker to solve the DC fault in an MTDC system, it is very important to deeply analyze the instability mechanism and explore its solutions.
A lot of research attention has focused on VSC–HVDC stability issues [11,12,13,14,15,16,17,18]. Nevertheless, conventional frequency domain methods are not suitable for a multi-input multi-output (MIMO) system like the VSC–MTDC system. To deal with this issue, modal analysis is performed to expose impacts of dynamic interactions in a multivariable VSC–MTDC system [14,15,16,17,18,19,20]. Based on a derived general small-signal model of VSC–MTDC, modal analysis is used to investigate the interactions between multi-machine AC systems and a DC grid in Reference [17]. The main focus of Reference [19] was modeling a MTDC system which connects weak and passive grid. In these works, although interactions between AC grid and MTDC system were studied in detail, the dynamics among converters were not investigated. Particularly, key effects of DCCBs have not been sufficiently considered in above papers.
The concept of the DC power system stabilizer (DC-PSS) was proposed to eliminate negative effects caused by the DC reactor, and the best location for the installation was discussed in Reference [21]. Similar to a conventional power system stabilizer (PSS), the DC-PSS provides additional damping by modulating power references of converters. However, the design method of this DC-PSS was not discussed thoroughly. Impedance-based methods were applied in the DC oscillation damping [22], and the proposed DC-PSS acted as a virtual resistance to enhance the damping ratio. However, the relevant modeling and parameter tuning is very complex.
The conventional method of designing a damping controller has focused on a single nominal operating point without considering the robustness performance. This practice can lead to a lack of damping performance in a volatile operation condition. A passive robust controller was proposed in Reference [23], but the selection of controller parameters was complex. An active damping control method applied in Reference [24] to suppress DC side oscillations. Reference [25] proposes a coordinated flexible damping mechanism, which allows the MTDC system to autonomously provide emulated inertial response with flexible damping effect to AC systems without communication.
Droop control has been widely used in MTDC systems for communication-free and high reliability, but due to different out impedances of each converter, the power flow will become asymmetric. In Reference [26] a method based on virtual impedances are used to distribute the power flow. However, to the best of the authors’ knowledge, there are few researches on the simultaneous realization of system oscillation suppression and power sharing. H∞ optimization method [27] provides a theoretical mechanism for dealing with uncertainties and bounded disturbances, and has been widely used in the field of power system control [28,29,30,31,32,33]. The PSS designed by H∞ optimization was reported to damp sub-synchronous oscillations in Reference [29]. The mixed-sensitivity technique [31] was employed to handle power system oscillations using flexible alternating current transmission (FACTs) devices. As for the frequency control problem of power systems, a robust controller was designed to implement the secondary control of frequencies in multiple areas [32]. Though robust control has gotten widely attentions in these areas, there have been no attempts to damp DC oscillations and symmetrize of power flow utilizing optimization method to date.
For the above reasons, a H∞ robust controller to damp DC oscillations and symmetrize power flows in a MTDC system with DCCBs is proposed. Firstly, a local robust damping controller is synthesized to depress the disturbances, and on this basic process, a global controller is designed accordingly to implement accurate symmetric power sharing among converters. An eigenvalue analysis and a time-domain simulation on a four-terminal MTDC system are used to validate the effectiveness of the proposed approach.
This paper is organized as follows: The small-signal model of the VSC–MTDC system is derived in Section 2. The system stability is examined by using the eigenvalue analysis in Section 3. Section 4 presents the design of the robust DC-PSS in detail. Section 5 conducts thorough case studies based on a four-terminal MTDC system. Finally, the paper concludes in Section 6.

2. VSC–MTDC System Modeling

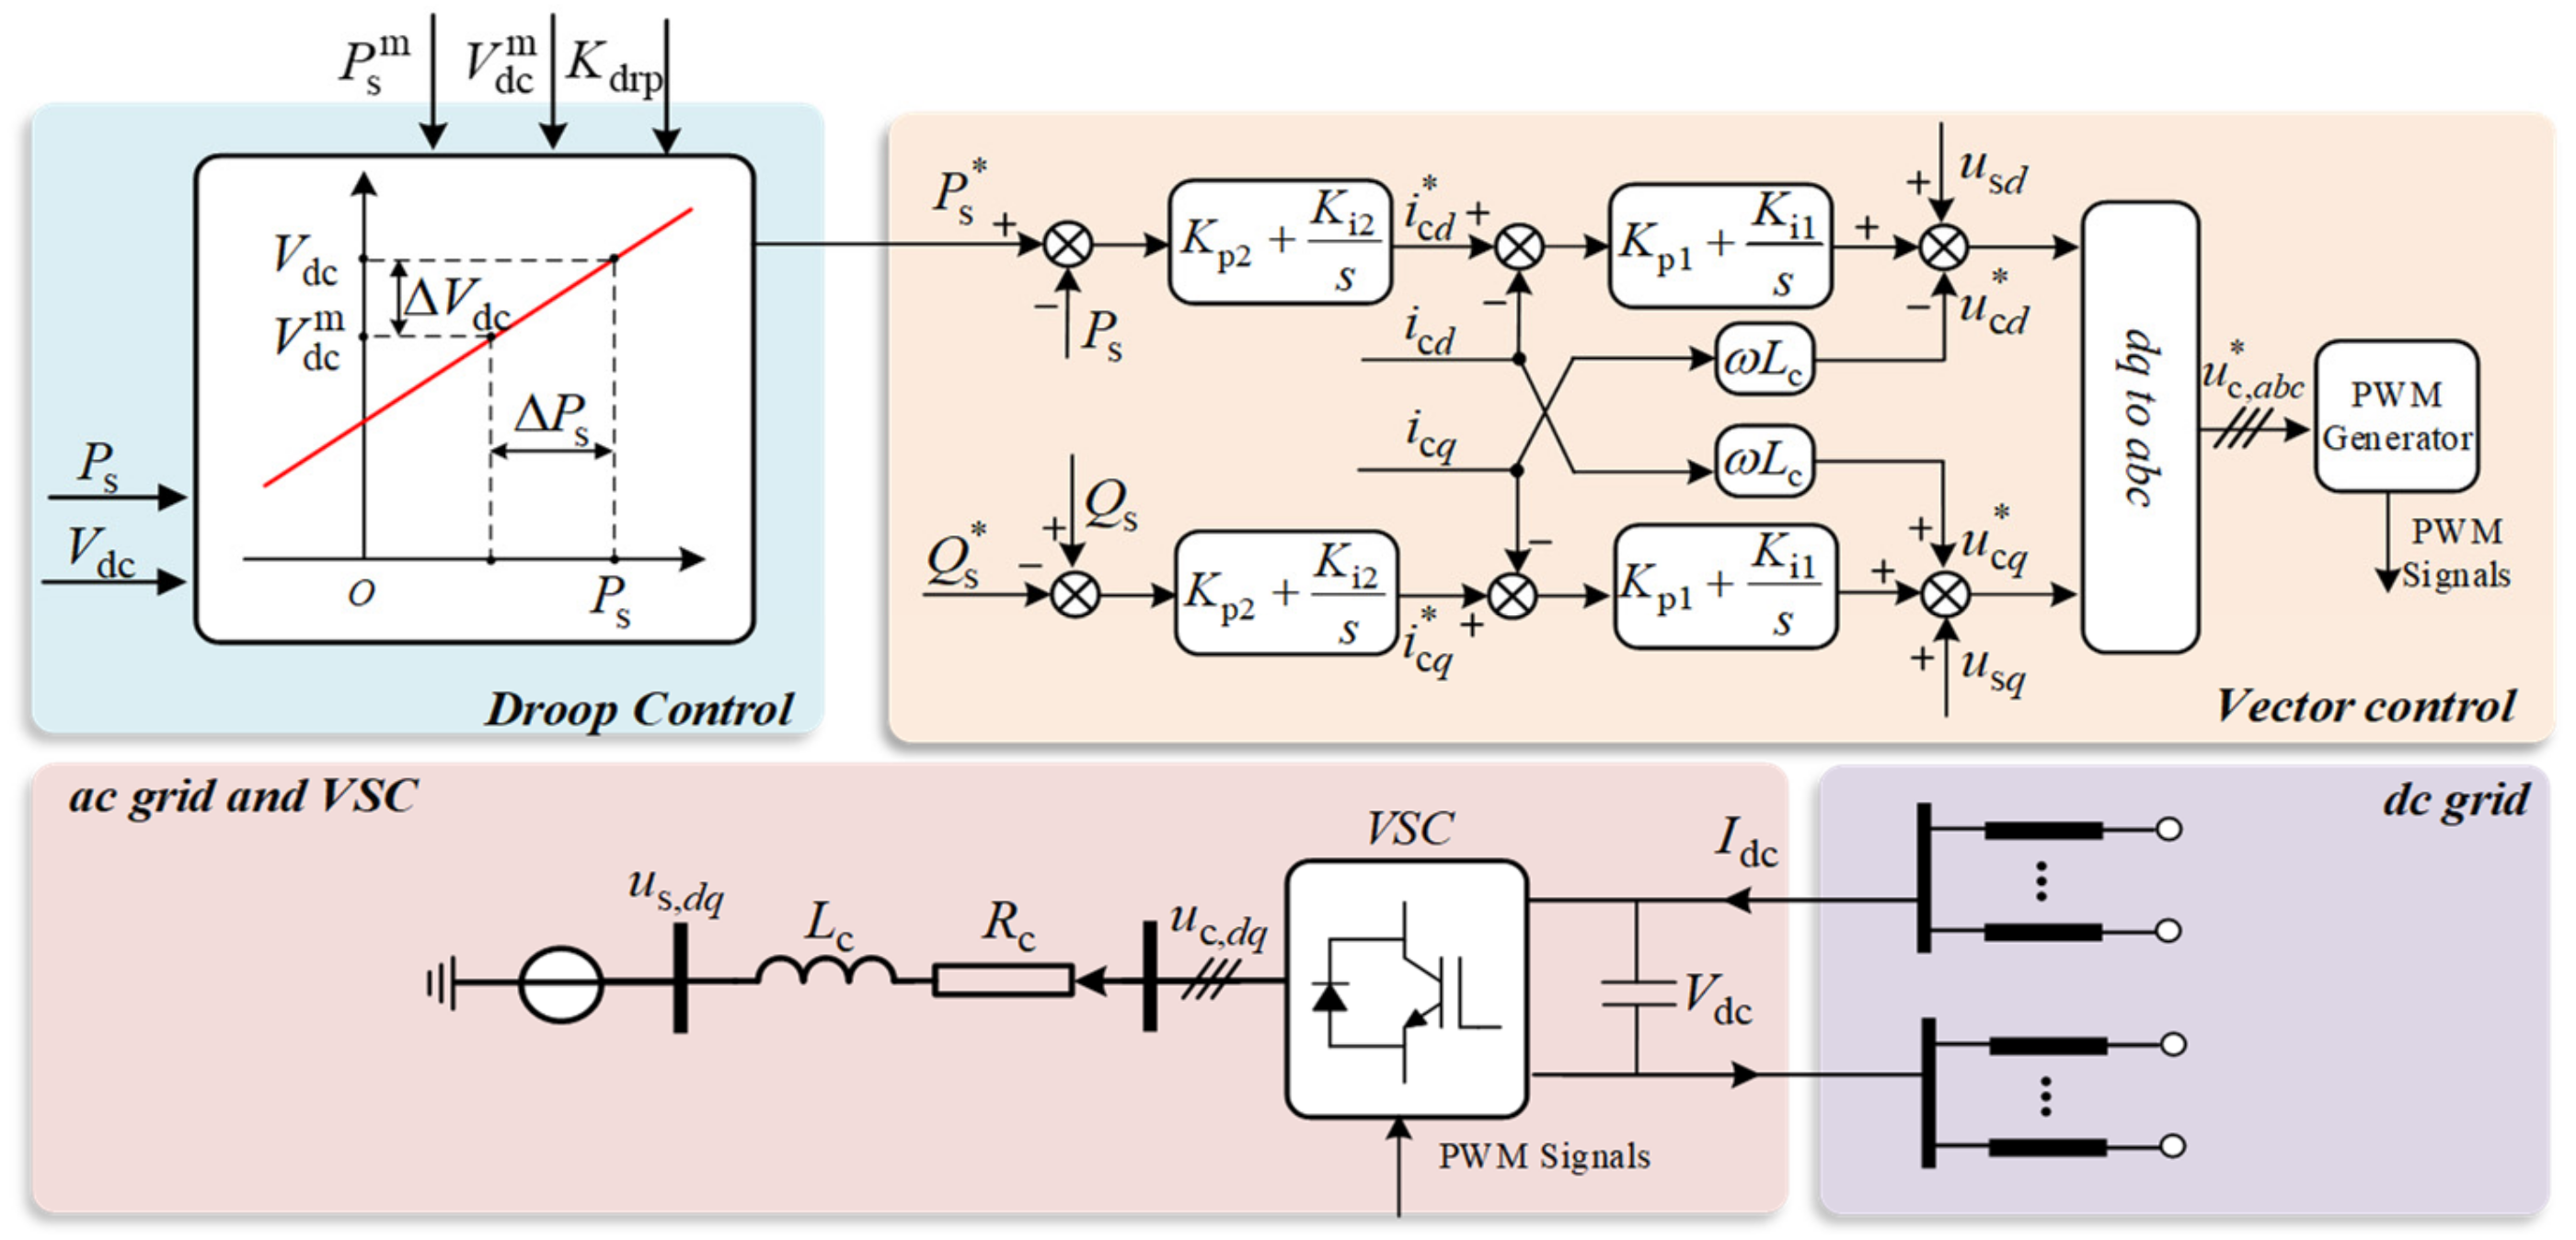
2.1. Average-Value Model

A converter station can be represented by an average-value model (AVM) by ignoring the switching transients. The AVM has two main parts: the AC side and the DC side. At the AC side, there is a reactor, L c , between grid terminals and converter terminals.
At the DC side, the high-voltage DC grid can be modeled as a controlled current source in parallel with a DC link capacitor, C dc .
Assuming the power at the point of common coupling (PCC) P s equals the power that the converter draw from the DC grid P dc , the DC voltage V dc can be derived as (1) by ignoring the conversion power loss:
C dc d V dc d t = I dc P s V dc
It is noteworthy that (1) reflects the power coupling between the DC and AC side, as the DC voltage is determined by both the total injected DC current ( I dc ) and the power transferred by the converter. The expression of DC voltage is nonlinear and needed to be linearized for further study; one can write the following:
C dc d Δ V dc d t = Δ I dc 1 V dc 0 Δ P s + P s 0 ( V dc 0 ) 2 Δ V dc
For the dynamics of a symmetric three-wire, three-phase AC system, the space phasor method is commonly used to transform the variables in abc-frame to a quiescent dq-frame, which brings a more efficient way to describe and analyze AC systems. By this method, the differential equations of AC sider current in dq-frame are mathematically formulated as follows:
L c d Δ i cd d t = R c Δ i cd + ω L c Δ i cq + Δ u cd Δ u sd L c d Δ i cq d t = R c Δ i cq ω L c Δ i cd + Δ u cq Δ u sq
where i cd and i cq are the currents of the RL filter, u cd and u cq are the voltages of the converter terminal, and u sd and u sq are the voltages of the grid terminal, respectively. According to the definition of active power in dq-frame, one can write the following:
P s = 1.5 u sd i cd + 1.5 u sq i cq Q s = 1.5 u sd i cq + 1.5 u sq i cd
Generally, the voltage of PCC is aligned with d-axis by a phase-locked loop, which means that u cd = 0 . Assuming that the PCC voltage remains constant Δ u sd = 0 , the linearized form of (4) is written as follows:
Δ P s = 1.5 ( Δ u sd i cd 0 + Δ i sd u sd 0 ) 1.5 Δ i cd u sd 0

2.2. Controller Modeling

The commonly adopted VSC control method is the so-called vector control method, which is displayed in Figure 1. A two-level hierarchy is used to regulate the power or voltages of the converter being controlled. In vector control theory, a pair of PI controllers, called inner loop controllers, has the duty of regulating the current injected into PCC and produces the reference value of converter terminal voltages, which could be expressed in the follows:
Δ u cd * = K p 1 Δ e 1 + Δ z 1 + ω L c Δ i cq + Δ u sd Δ u cq * = K p 1 Δ e 2 + Δ z 2 ω L c Δ i cd + Δ u sq
where
Δ e 1 = Δ i cd * Δ i cd , Δ e 2 = Δ i cq * Δ i cq Δ z 1 = K i 1 Δ e 1 d t , Δ z 2 = K i 1 Δ e 2 d t
In (6) and (7), Kp1 and Ki1 are the control gains; z1 and z2 are the supplementary integral variables; and e1 and e2 are the error variables, respectively.
Considering the principle depicted in (5), the active power and reactive power can be independently controlled by regulating i cd , i cq . A pair of PI controllers is introduced to regulate active power and reactive power, and its expressions are as follows:
Δ i cd * = K p 2 Δ e 3 + Δ z 3 Δ i cq * = K p 2 Δ e 4 + Δ z 4
where
Δ e 3 = Δ P s * Δ P s , Δ e 4 = Δ Q s * Δ Q s Δ z 3 = K i 2 Δ e 3 d t , Δ z 4 = K i 2 Δ e 4 d t
In general, droop control can be regarded as one of the most suitable choices for controlling the voltages of DC grids in a distributed control structure. Hence, droop control is used as the default DC voltage control strategy in this work. A typical droop structure is expressed as follows:
P s * = ( V dc V dc m ) K drp + P s m
where V dc m and P s m are the voltage and power references of droop controller, respectively. K drp is the droop gain which measure the impact of voltage deviations on the reference power. In addition, K drp also identifies the converter operation mode. When K drp is equal to zero, the converter operates in the power-control mode. When K drp is not equal to zero, the converter operates in the droop-control mode.
By aggregating the expressions of different subsystems, a general state-space model of the ith converter (VSCi) in the droop-controlled mode or power-controlled mode can be formulated as follows:
Δ x ˙ g , i = A g , i Δ x g , i + B g , i Δ u g , i Δ x g , i = [ Δ V dc , i , Δ i cd , i , Δ i cq , i , Δ z 1 , i , Δ z 2 , i , Δ z 3 , i , Δ z 4 , i ] T Δ u g , i = [ Δ P s , i m , Δ I dc , i ] T
where A g , i and B g , i are the system matrix and input matrix with appropriate dimensions, and Δ x g , i and Δ u g , i are the state vector and the input vector, respectively.

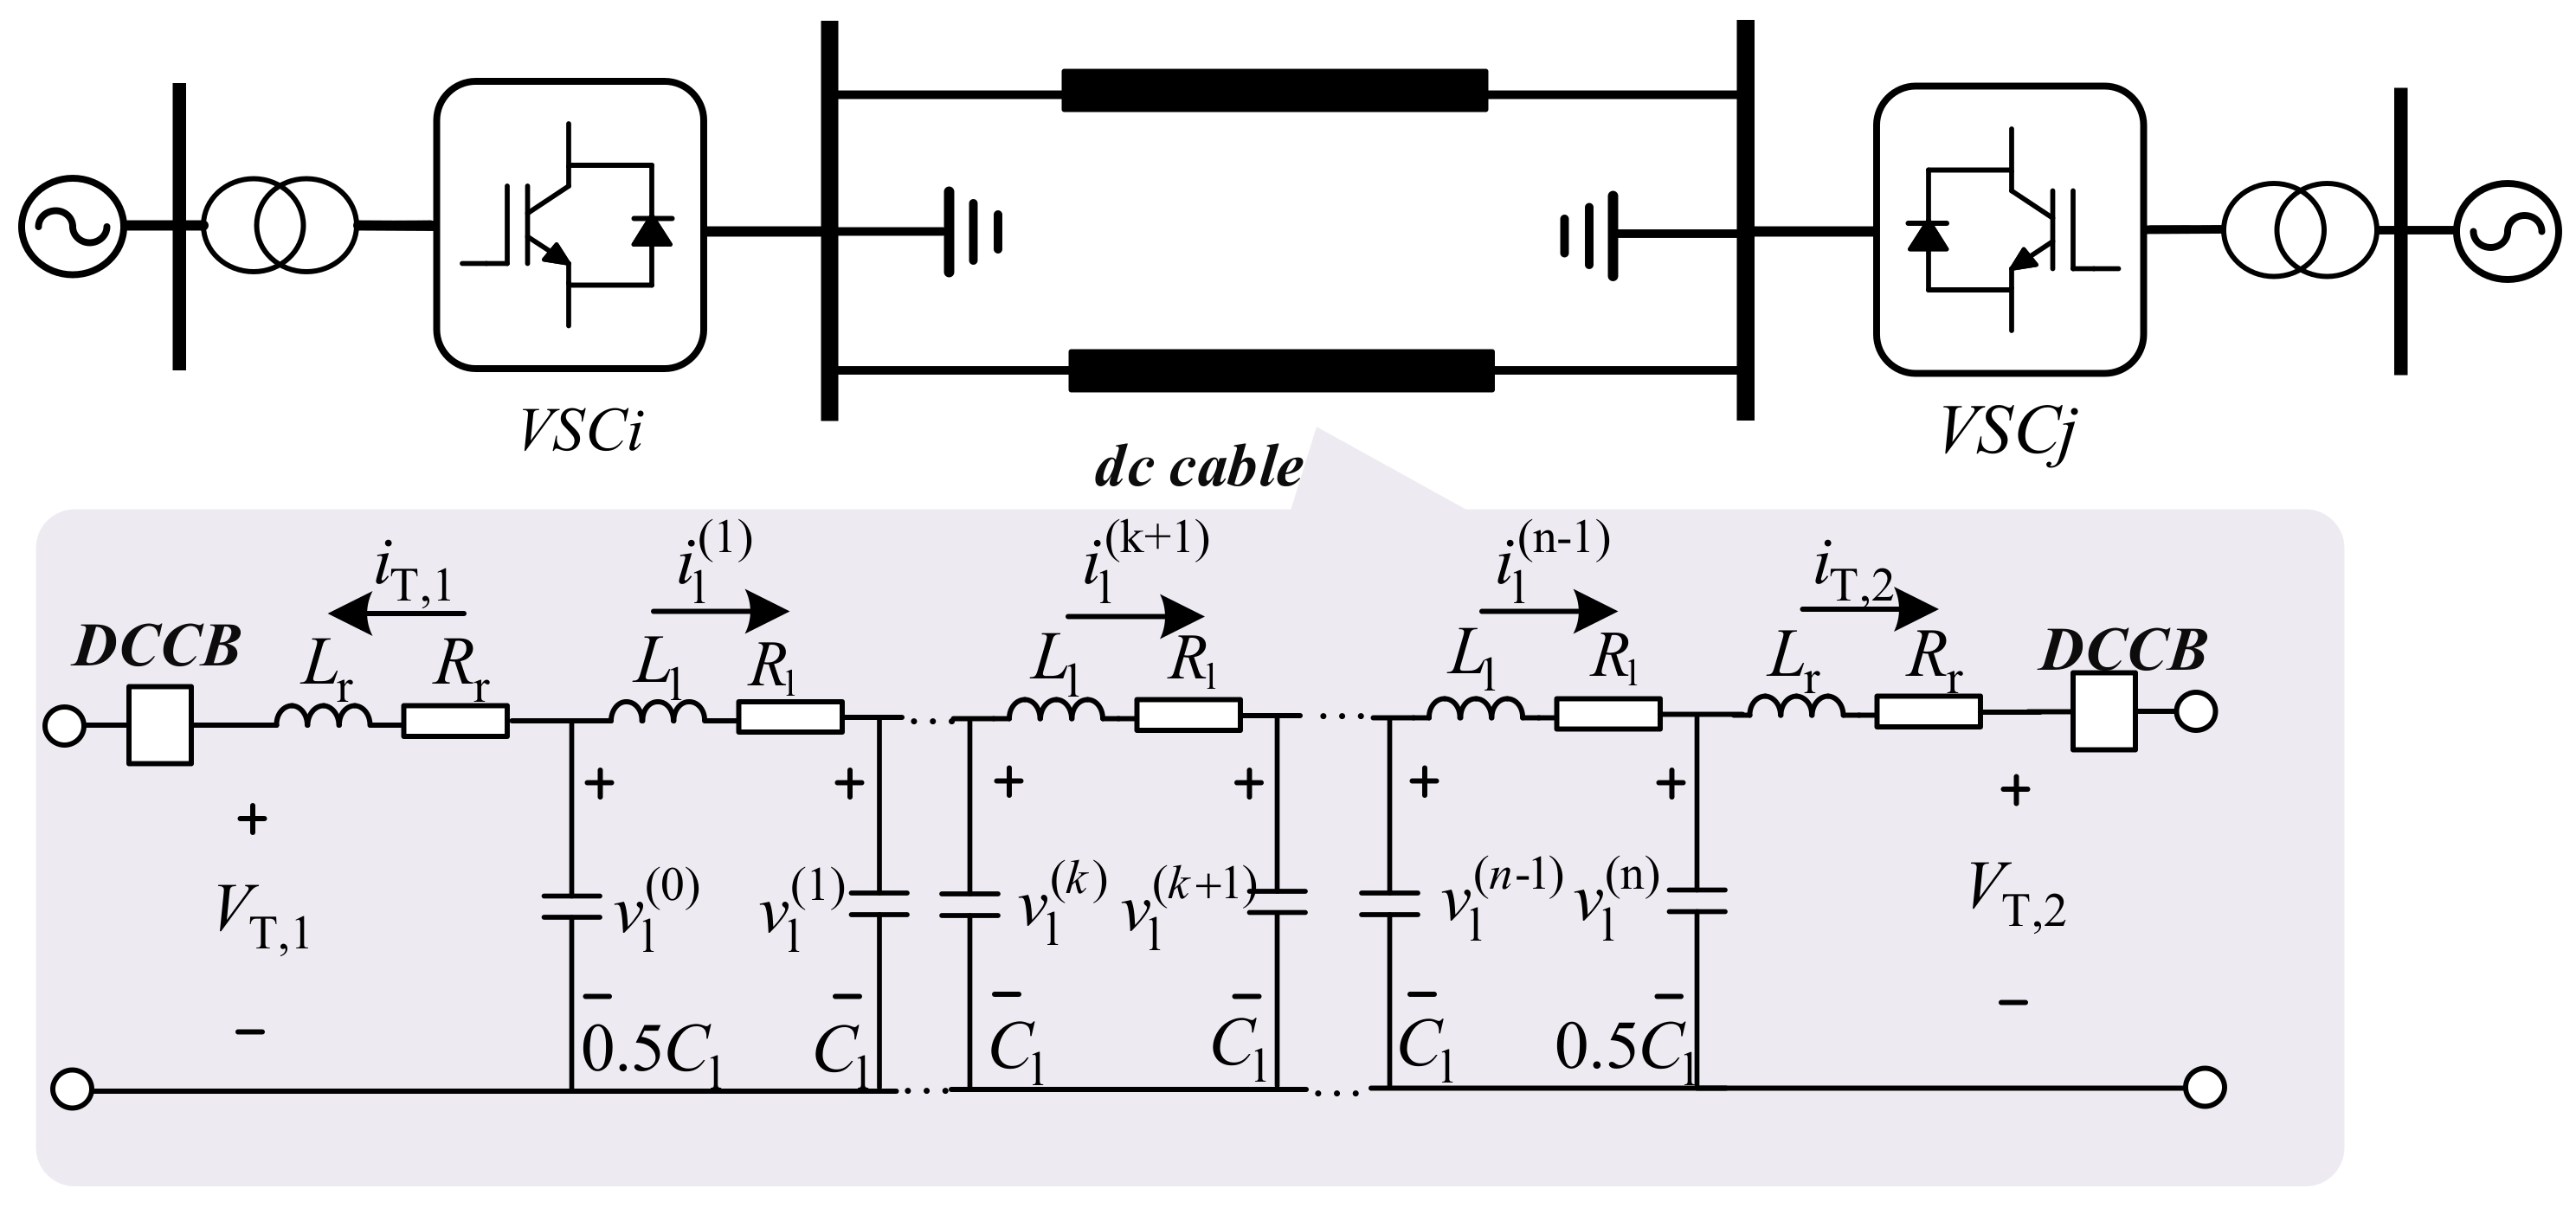
2.3. DC Cable Network Modeling

Since a DC network could impose a significant impact on the dynamic properties and stability of a MTDC system, the accuracy of modeling of the DC cable must be considered. According to the frequency range of interest, a detailed cascaded π-section model is used, which could decrease the model complexity and computation burden. Moreover, the DCCBs are equipped on the both ends of the cable, and the DC reactors are modeled by RL branches.
The studied DC cable with n π-sections are shown in Figure 2, and the differential equations can be formulated as follows:
d i T 1 d t = 1 L r ( v l ( 0 ) V T 1 R r i T , 1 ) d i T 2 d t = 1 L r ( v l ( n ) V T 2 R r i T , 2 ) d i l ( k ) d t = 1 L 1 ( v l ( k + 1 ) v l ( k ) R l i l ( k ) ) , k = 1 , 2 , , n d v l ( 0 ) d t = 2 C 1 ( i l ( 1 ) i T 1 ) d v l ( n ) d t = 2 C l ( i l ( n ) i T 1 ) d v l ( k ) d t = 1 C l ( i l ( k + 1 ) i l ( k ) ) , k = 1 , 2 , , n 1
where Lr and Rr represent the lumped inductance and resistance of the DC reactors, respectively; iT,x (x = 1, 2) is the current of DC reactor; il is the current of inductance; and vl is the voltage of capacitance. The state space form of (12) consists n + 1 voltage states and n + 2 current states.
Nonetheless, the relationships between cables and converters are still implicit. For the purpose of overall aggregating, some variable manipulations are necessary to build the interconnections, which are as follows:
[ Δ V dc , 1 , , Δ V dc , N l ] T = T V [ Δ V T 1 , 1 , , Δ V T 1 , n , Δ V T 2 , 1 , , Δ V T 2 , n ] T [ Δ I dc , 1 , , Δ I dc , N l ] T = T I [ Δ i T 1 , 1 , , Δ i T 1 , n , Δ i T 2 , 1 , , Δ i T 2 , n ] T
According to (12) and (13), a universal DC network model with Nl lines can be written in a compact form, as follows:
Δ x ˙ DC = A DC Δ x DC + B DC Δ u DC Δ y DC = C DC Δ x DC Δ x DC = [ Δ x l , 1 , , Δ x l , N l ] T Δ u DC = [ Δ V dc , i , , Δ V dc , N l ] T Δ y DC = [ Δ I dc , i , , Δ I dc , N l ] T

2.4. Formulation of the Overall Linearized System

The objective of this section is to build a general model of an MTDC system. Assuming that the system consists of N converters and Nl DC cables, the VSC subsystems and the DC network derived in (11) and (14) can be established by the methods described above. By eliminating the “interface variables”, such as Δ I dc , i , , Δ I dc , N l and Δ V dc , 1 , , Δ V dc , N l , the subsystems can be aggregated, and a generalized state-space model for arbitrary topology is derived as follows:
Δ x ˙ M = A M Δ x M + B M Δ u M Δ y M = C M Δ x M
where Δ x M = [ Δ x g , 1 , , Δ x g , N c , Δ x DC ] T is the state vector that contains all dynamic states of the MTDC grid components like converter currents, DC voltages, DC line states and so on. Δ u M represents the system inputs. For a supplementary damping control application, it is reasonable to choose the power reference of converters as the control variables, which means that Δ u M = [ Δ P s , 1 m , , Δ P s , N c m ] T . In this work, the DC voltages are the main concerns, so that the outputs are selected as Δ y M = [ Δ V dc , 1 , Δ V dc , 2 , , Δ V dc , N c ] T . The system studied in this paper is shown in Figure 3.

3. Modal Analysis

In this section, a modal analysis is performed to analyze the stability of a VSC–MTDC system. The test system is composed of two VSCs that use droop control (VSC1 and VSC2), and the other two VSCs use power control (VSC3 and VSC4). The DC cables are represented by the analytic model introduced in Section 2. All DC cables are equipped with DCCBs, and the inductances of the DC reactors are set as 100 mH.

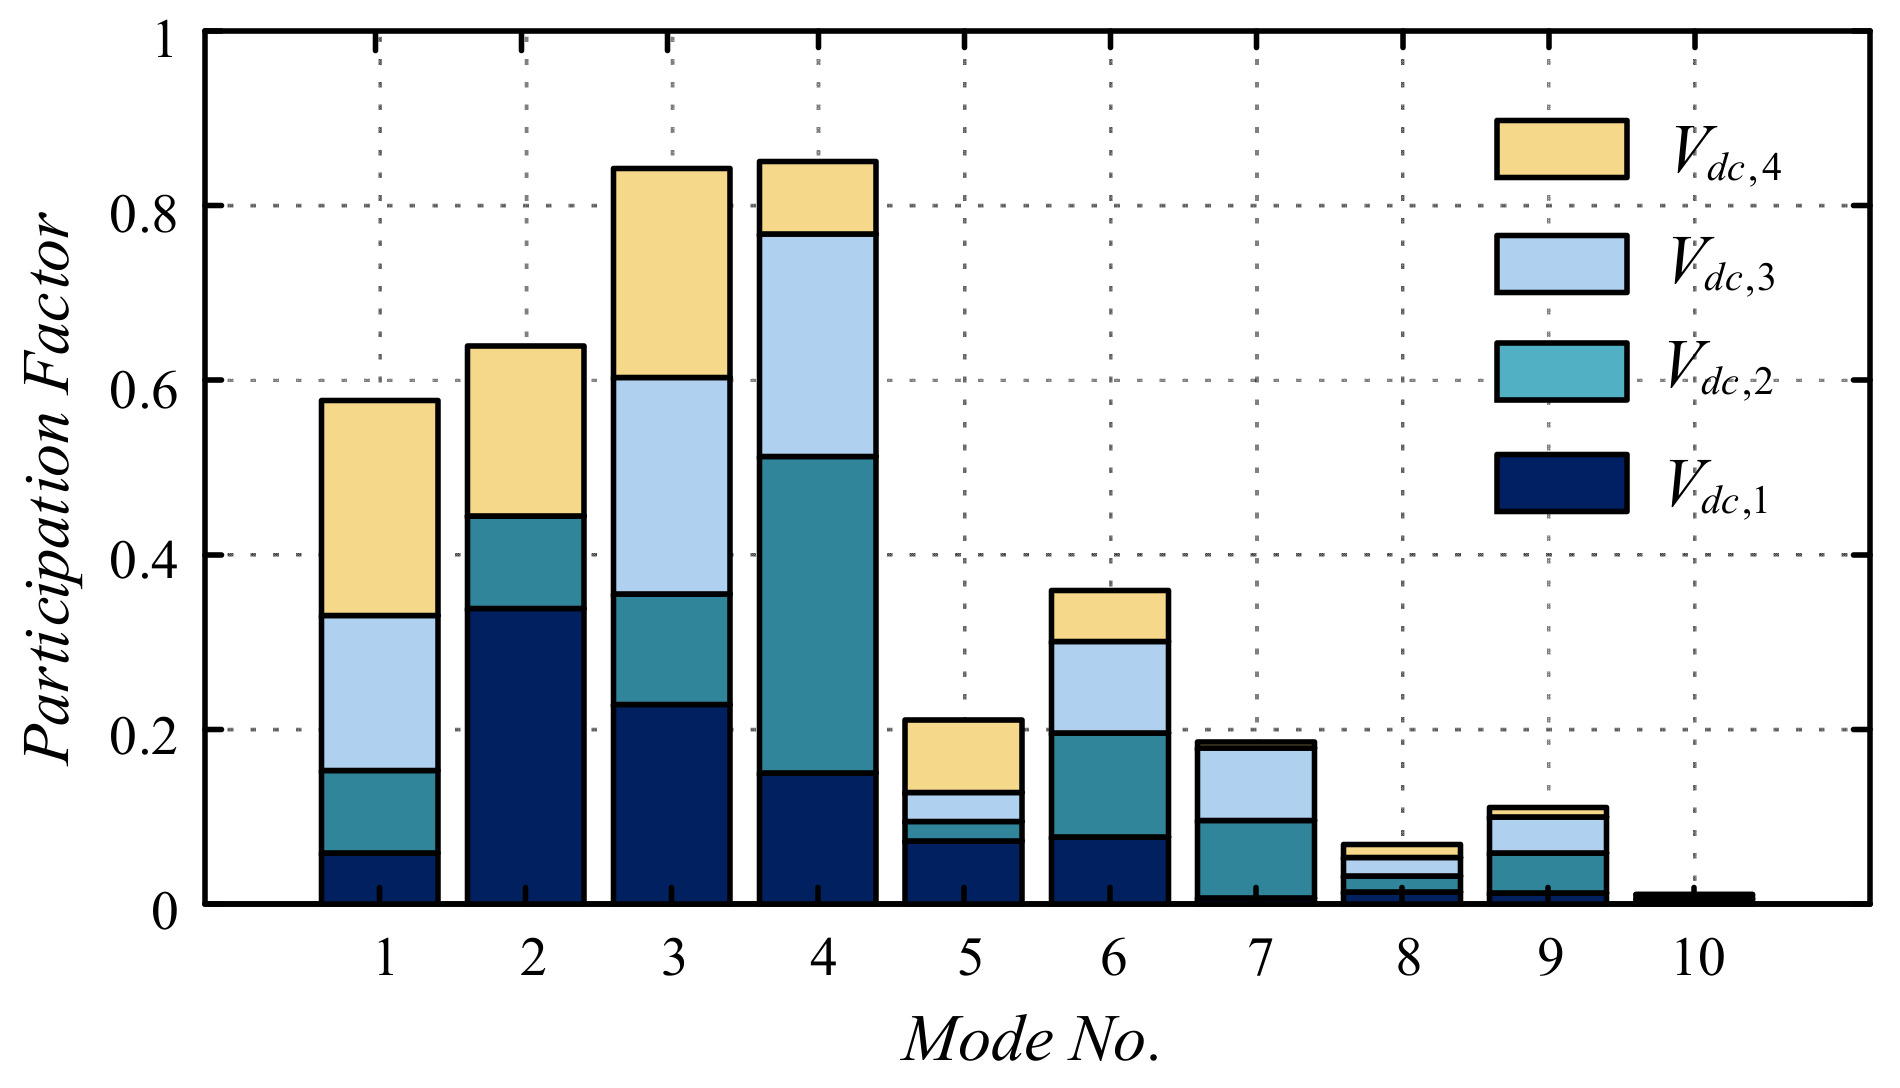
3.1. Participation Factor Analysis

The power-flow pattern Equilibrium I in Table 1 is selected as the default operating point. The test system is linearized around the equilibrium and the small-signal model is derived. The associations between the state variables and the eigenvalues are identified by participation factor analysis.
The participation factors of main modes in the DC voltages are illustrated in Figure 4. Particularly, the modes which have high relationships with DC voltages are denoted by M1 to M4 and are listed in Table 2.
The damping ratios of critical eigenvalues play an important role in the modal analysis, since they measure the damping speed of oscillations. More specifically, the lack of damping for critical modes could cause underdamped oscillations when the system is disturbed, resulting in adverse effects on the system stability.

3.2. Participation Sensitivity Analysis

In this section, the influences of parameter variation are evaluated by a series of parametric sensitivity analysis. By observing the trajectories of critical modes, relevant conclusions about system stability can be drawn in the following analysis.

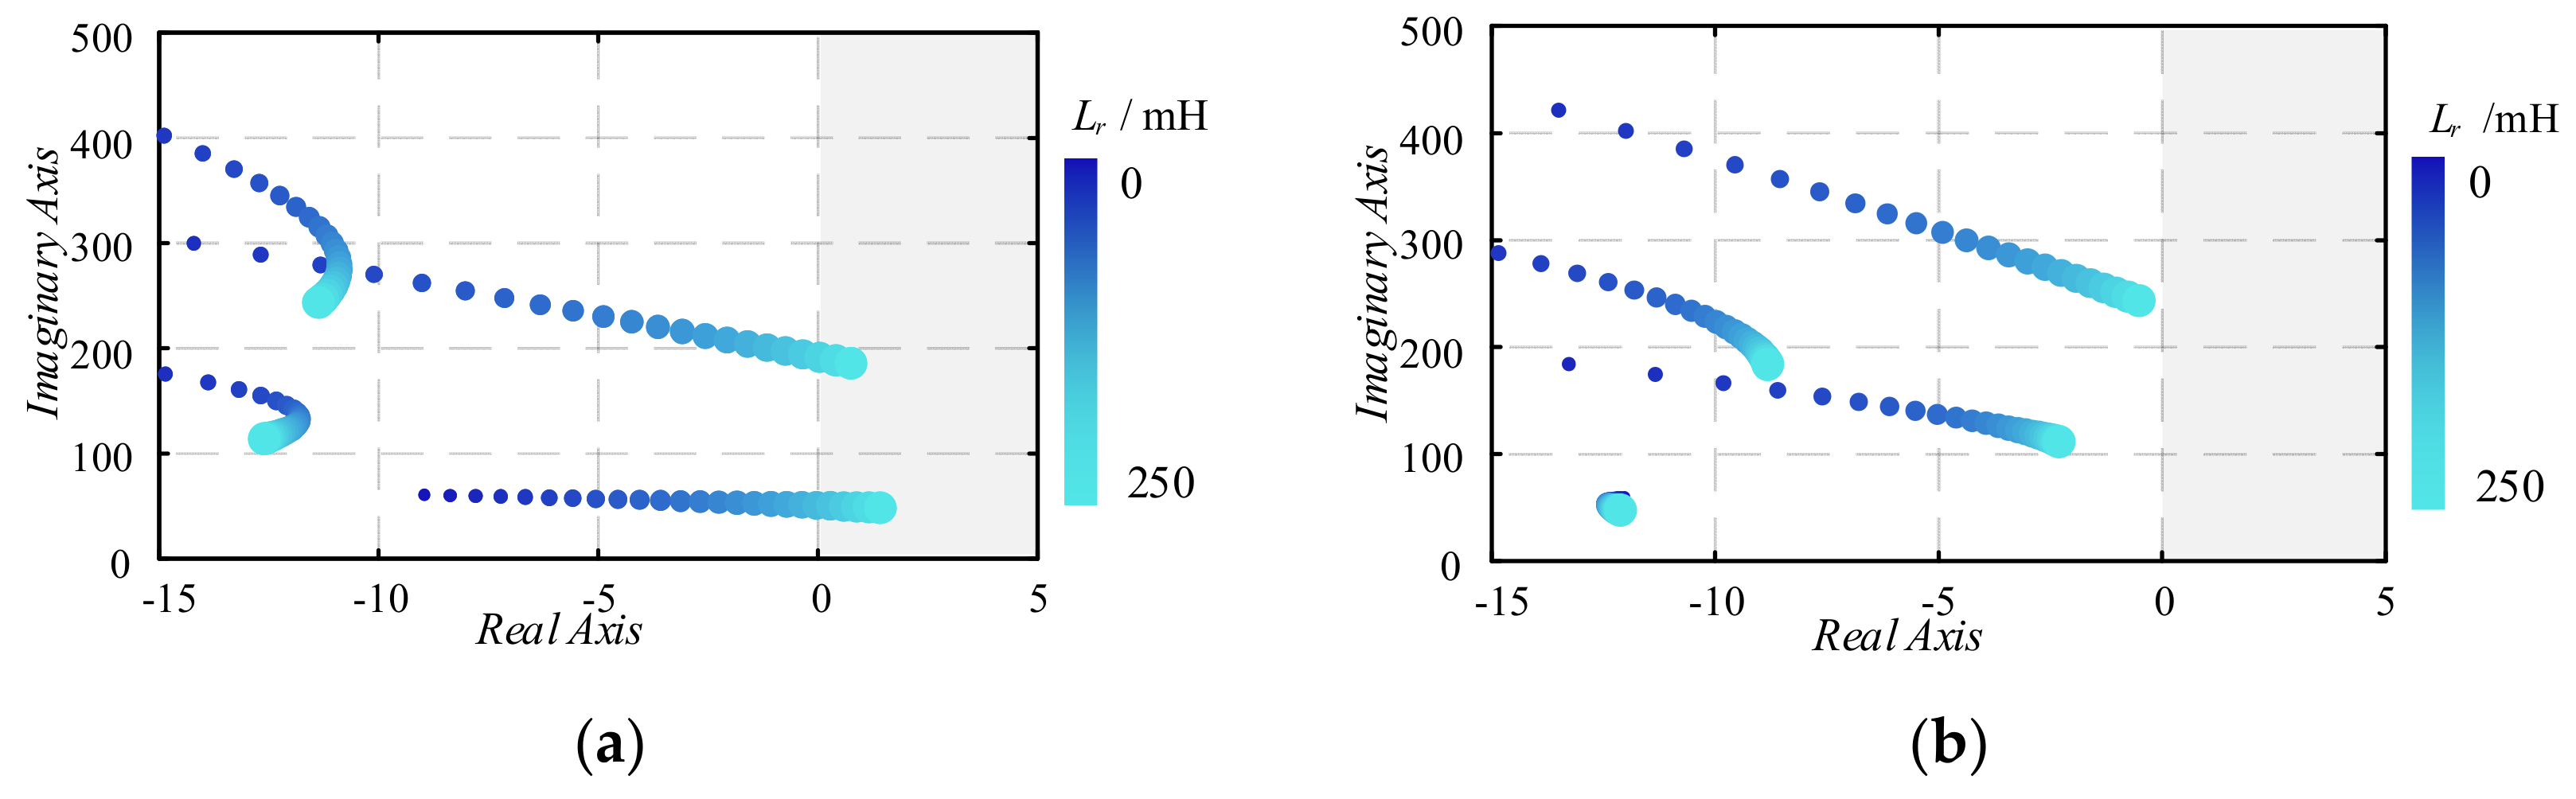
3.2.1. Impact of DC Reactor

Figure 5a demonstrates the eigenvalues configuration as the inductance of the DC reactor varies from 0 to 250 mH. Moreover, in Figure 5 and the subsequent analysis, only the critical eigenvalues are shown for the purpose of clarity. The color deepness and sizes of the marks indicate the movement of poles with a variation of parameters.
It can be observed that the critical poles which possess higher participation from DC voltage dynamics move toward the right-hand plane (RHP) as the inductance increases.

3.2.2. Impact of Power Flow

In this subsection, the impacts of power-flow scenarios are focused on, and the stable limitations are certificated. It is a common practice that the voltage-controlled converter or droop-controlled converter operates as an inverter and the power-controlled converter operates as a rectifier [15]. The mentioned power-flow condition is denoted by positive p.f. case and negative p.f. case, respectively. Indeed, it is required that the VSCs could operate in both directions without changing the controls in many applications. Therefore, the impacts of both power-flow directions are studied here.
Figure 6a shows the result when the power of VSC3 and VSC4 increase from 0 p.u. to 1 p.u. simultaneously. As the inverting power increases, the critical modes, M1 and M2, move towards RHP, and the system becomes instable when the inverting power of a single power-controlled converter arrives at 0.64 p.u.
In Figure 6b, the adverse power direction is evaluated. When the rectifying power increased from 0 to 1 p.u., the move directions of critical modes are similar, which implies that enlarging of the transmitted power can reduce the system stability in both power directions. Compared with the positive p.f. case, this issue is more severe.

4. Additional Damping Control Strategy for MTDC

4.1. Parametric Sensitivity Analysis

The relationship of the MIMO system in Figure 7 can be expressed in transfer function matrix form, as given by the following:
z y = P 11 ( s ) P 12 ( s ) P 21 ( s ) P 22 ( s ) P ( s ) w u , u = K ( s ) y
After augmentation, the state-space form of the plant and the controller can be rewritten as follows:
P ( s ) = A B 1 B 2 C 1 C 2 D 11 D 12 D 21 D 22 , K ( s ) = A k B k C k D k
Having completed formulating the generalized plant, the key task is to find a control law, u = K s y , to stabilize P for meeting the condition:
T wz ( s ) < γ T wz ( s ) = D cl + C cl ( s I A cl ) 1 B cl
where γ is a positive constant, and we have the following:
A cl = A + B 2 D k C 2 B 2 C k B k C 2 A k B cl = B 1 + B 2 D k D 21 B k D 21 T C cl = C 1 + D 12 D k C 2 D 12 C k D cl = D 11 + D 12 D k D 21
From the LMI prospective, the condition in (16) is equivalent to the existence of a solution X = X T > 0 to the following matrix inequality:
X A cl + A cl T X B cl X C cl T B cl T γ I D cl T C cl X D cl γ I < 0
The solve method of (17) is given in Reference [34].

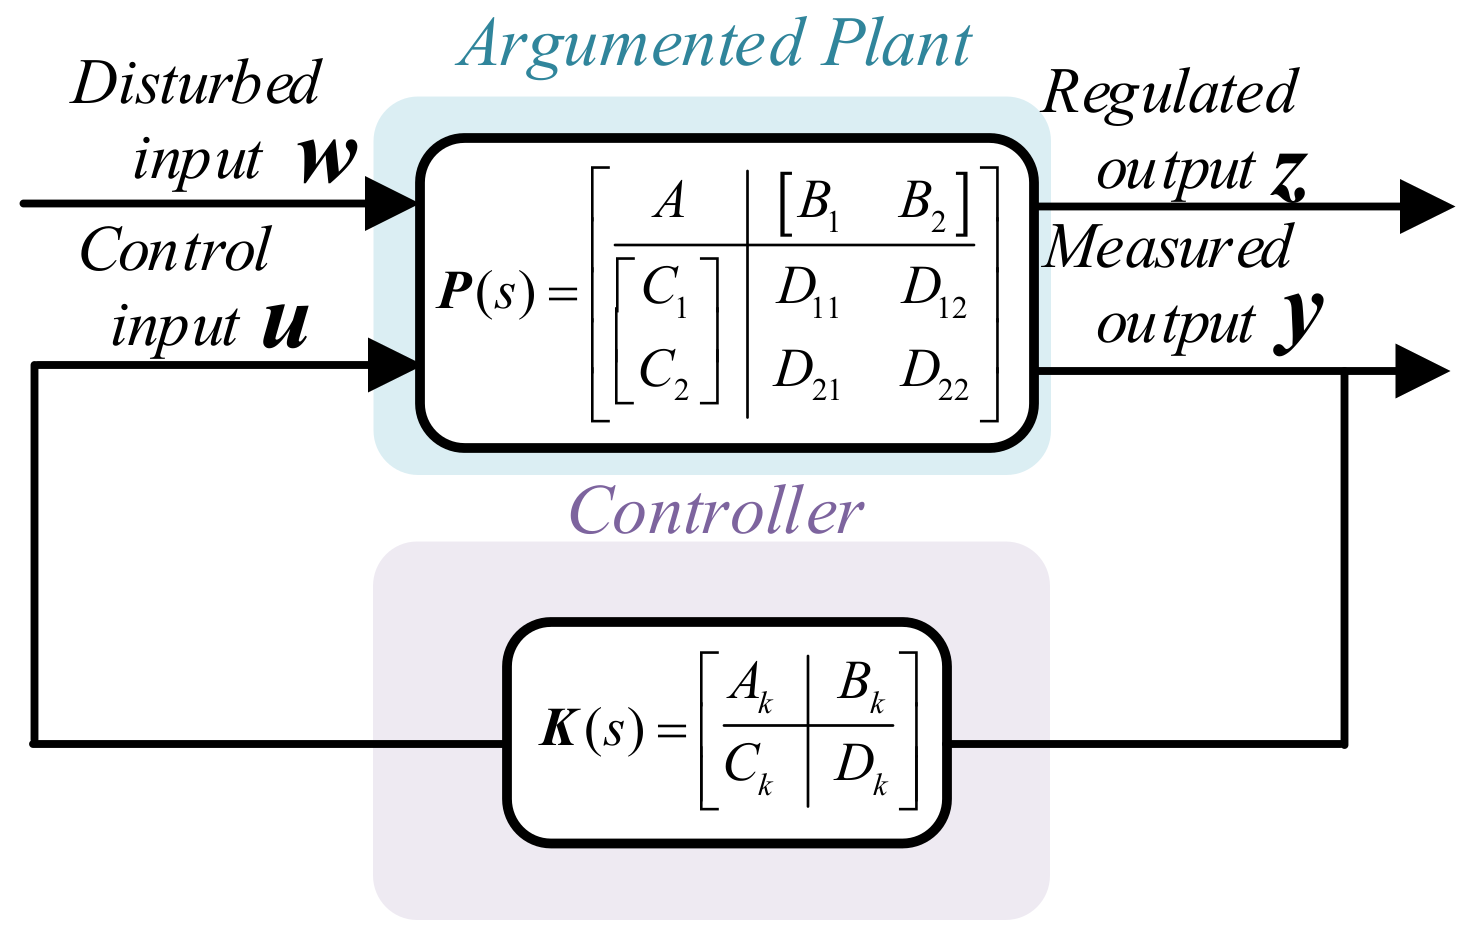
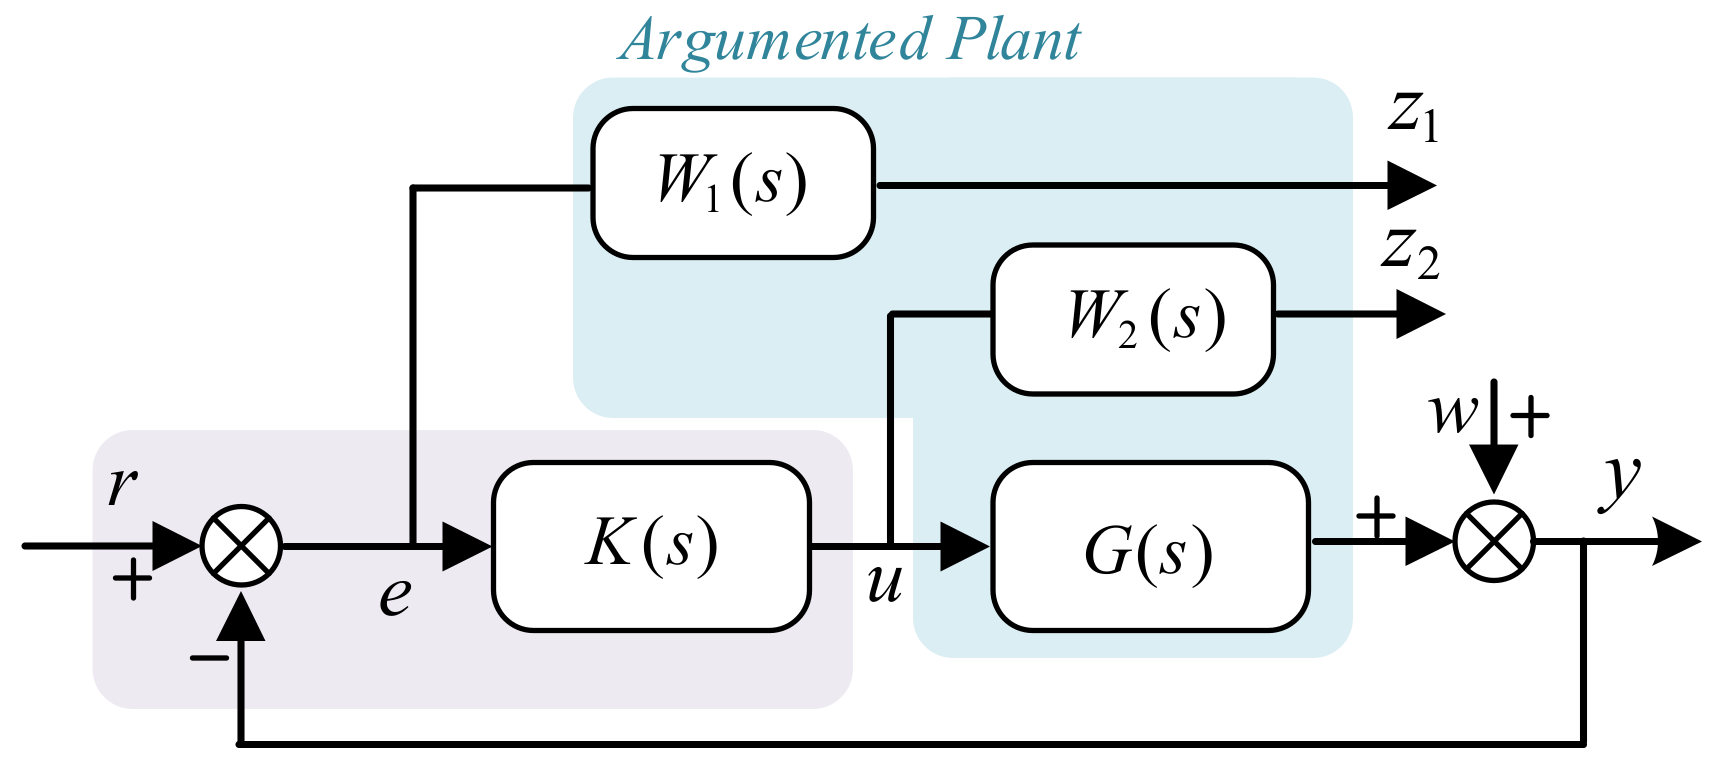
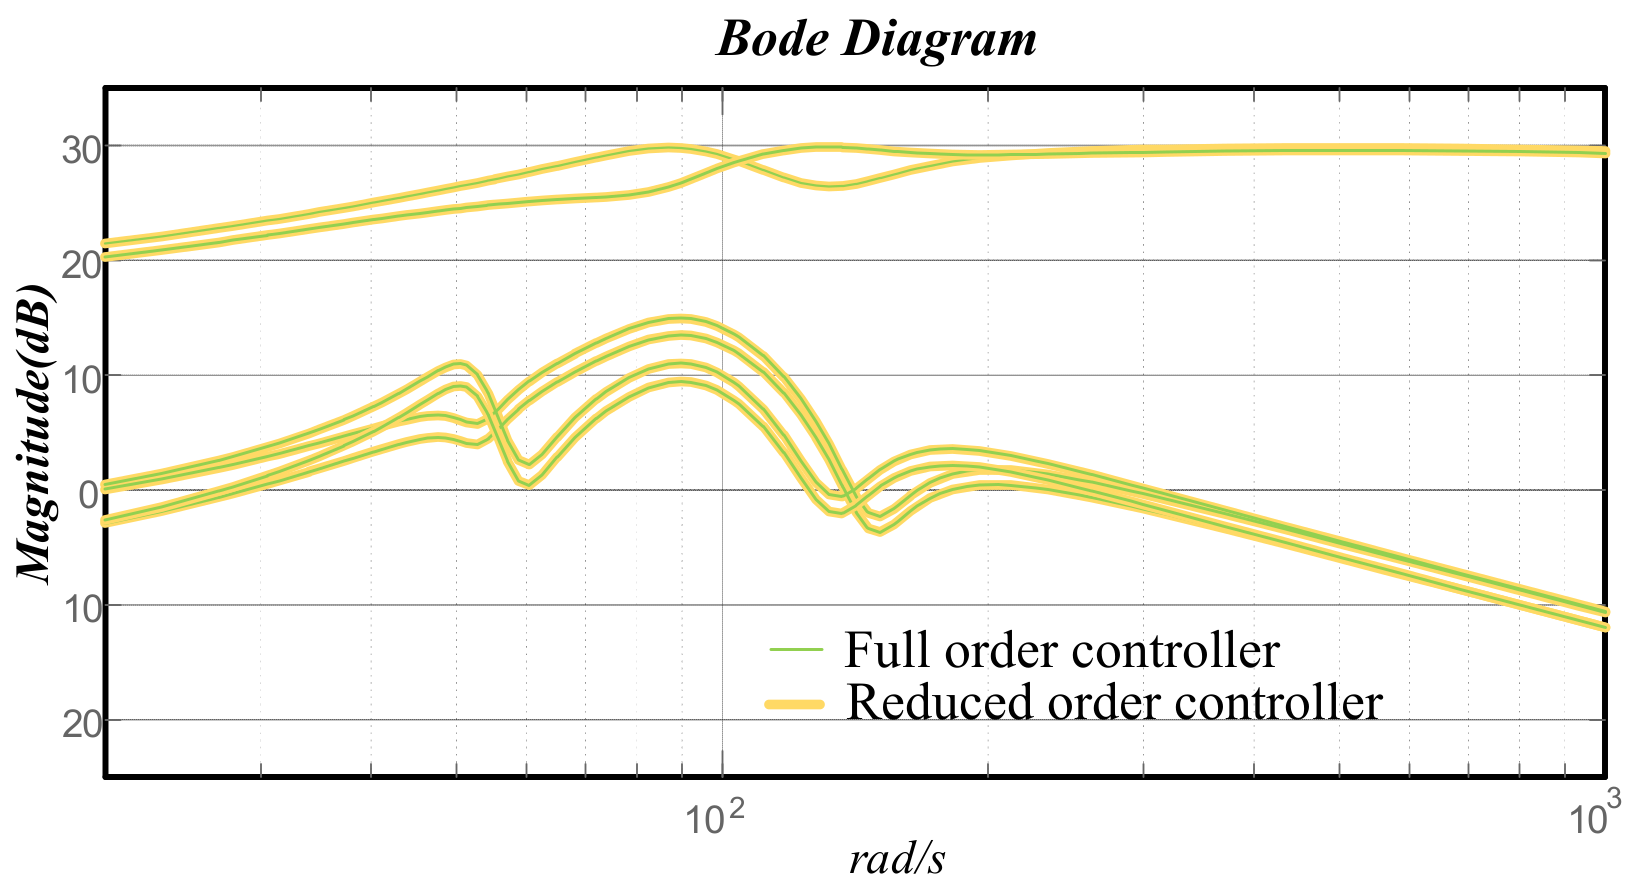
4.2. DC Power System Stabilizer Design Utilizing H∞ Mix-Sensitivity Optimization

In an MTDC system, DC oscillations occur due to the sudden variations in wind generation fluctuations, converter outages, etc. These contingencies are regarded as disturbances from the view of the damping controller design. Figure 8 depicts the output disturbance rejection problem in the standard mixed-sensitivity configuration. The basic idea of mixed-sensitivity optimization is to minimize the weighted mixture of the transfer function S = I / I + G K and K S = K / I + G K . The mixed-sensitivity (S/KS) design objective can be represented as follows:
min W 1 S W 2 K S
which can be converted to a standard H∞ framework and then solved [35]. First, this paper proposes a local controller which improves the stability of MTDC. Assuming the DC-PSS is located at a droop-controlled converter and utilizes local measurements to damping DC oscillations, the active power reference, Δ P s , j m , is selected as the control input, and the DC voltage, Δ V dc , j , is selected as the measured output. The weight functions W 1 ( s ) and W 2 ( s ) are selected as follows:
W 1 ( s ) = 0.051 × s + 70 s + 50 2 × s 2 + 48.4 s + 2343 s 2 + 0.968 s + 2343 W 2 ( s ) = 4 × 10 4 × s + 100 s + 200 2 × s + 10 s + 0.01
The reasoning behind these selections is summarized below.

4.2.1. Selection of W1(s)

According to the analysis in Section 3, the main frequency components of disturbance signal lie in the range of 50 to 400 rad/s. In this range, the weight function W 1 ( s ) is dominated by a second-order band-pass filter. Actually, the cascaded connection of multiple second-order filters is also practical to extract other oscillation frequency components. In the high-frequency range, a low-pass filter or its cascaded connection is selected to avoid the high-frequency noises.

4.2.2. Selection of W2(s)

In order to ensure robustness against high-frequency uncertainties in the plant, the weight function W 2 ( s ) should be designed as a high-pass filter. Since this form can hardly suppress the steady control effort which could lead the deviations of equilibriums, the performance of both high-frequency and low-frequency should be concerned. Accordingly, a low-pass filter is included into W 2 ( s ) .
Furthermore, based on the local controller, the global controller was designed. The active power reference, Δ P s , j m , of each droop-controlled converter was selected as the control input, and the DC voltage ( Δ V dc , j ) and Δ P s , j m are selected as the measured output. The weight functions W 1 ( s ) and W 2 ( s ) are selected as follows:
W 1 ( s ) = 0.1 ( s + 70 ) 2 ( s 2 + 52.8 s + 2788 ) ( s + 50 ) 2 ( s 2 + 10.56 s + 2788 ) 0 0 0 0.1 ( s + 70 ) 2 ( s 2 + 52.8 s + 2788 ) ( s + 50 ) 2 ( s 2 + 10.56 s + 2788 ) 0 0 0 800 ( s + 80 ) W 2 ( s ) = 0.01 ( s + 10 ) ( s + 0.1 ) 0 0 0.01 ( s + 10 ) ( s + 0.1 )
The principle of selection of W 1 ( s ) and W 2 ( s ) is the same as the local controller.

5. Case Study

The analytical model of the four-terminal system depicted in Section 3 was built in Simulink for the verification of proposed controllers. The steady operating point was selected as Equilibrium I; VSC1 and VSC2 were equipped by the proposed DC-PSS.
To facilitate control design and reduce the controller complexity, the nominal plant model can be effectively simplified by using model-reduction techniques. The Bode diagram of global controllers, offering a comparison between the full 25th-order controller and the reduced 12th-order controller, is illustrated in Figure 9. It can be concluded that the model reductions effectively simplify the controller design. The local controller, K1, is shown under Table 3, and the global controller, K2, can be figured out the same way.
K 1 ( s ) = K G N G ( s ) / D G ( s ) , K G = 4452.5 N G ( s ) = ( s + 88.31 ) ( s 2 8.924 s + 21.65 ) ( s 2 + 24.88 s + 19740 ) ( s 2 + 22.42 s + 59540 ) ( s 2 + 43.59 s + 109000 ) D G ( s ) = ( s + 408 ) ( s + 3.878 ) ( s 2 + 117.4 s + 12930 ) ( s 2 + 8.208 s + 17890 ) ( s 2 + 28.53 s + 56630 ) ( s 2 + 42.85 s + 100800 )

5.1. Eigenvalue Analysis

The differences between the original case and the case with DC-PSS equipped are shown in Table 3. It can be observed that the damping of critical modes, which is highly related to DC voltage, increases significantly. The damping controller effectively enhances system stability.

5.2. Eigenvalue Analysis

Time-domain simulations were performed with different cases to validate the performance of the robust controller. The local controller is applied in Section 5.2.1 and Section 5.2.2.

5.2.1. Impact of DC Reactor Evaluation of Influence of DCCBs

The impacts of DCCBs were investigated by comparing the time-domain responses of a MTDC system with DCCBs and its counterpart; time-domain simulations are shown in Figure 10. As illustrated in Figure 10a, the power of VSC3 and VSC4 step simultaneously from 0 to −0.2, −0.4 and −0.6 p.u., at 0.5, 2.5, 4.5 and 7.5 s, respectively. Without loss of generality, the DC voltage of VSC2 is employed to represent the overall trends of the DC voltages. The overshoot ratio of the voltage in the system without DCCBs is roughly 80%, whereas, for the DCCB-equipped system, this value is 180%. High transient over-voltages may give risk to the malfunction of protection equipment.
The negative p.f. case was tested, and the results are shown in Figure 10b. Clearly, the transient oscillations are more intense and hardly damped. When the inverting power of VSC3 and VSC4 rise to 0.6 p.u., the system becomes instable. The above simulations validate the proposition that the DCCB could impose stability limitations to the operating area of MTDC systems, which is consistent with the conclusions drawn from the discussions in modal analysis.

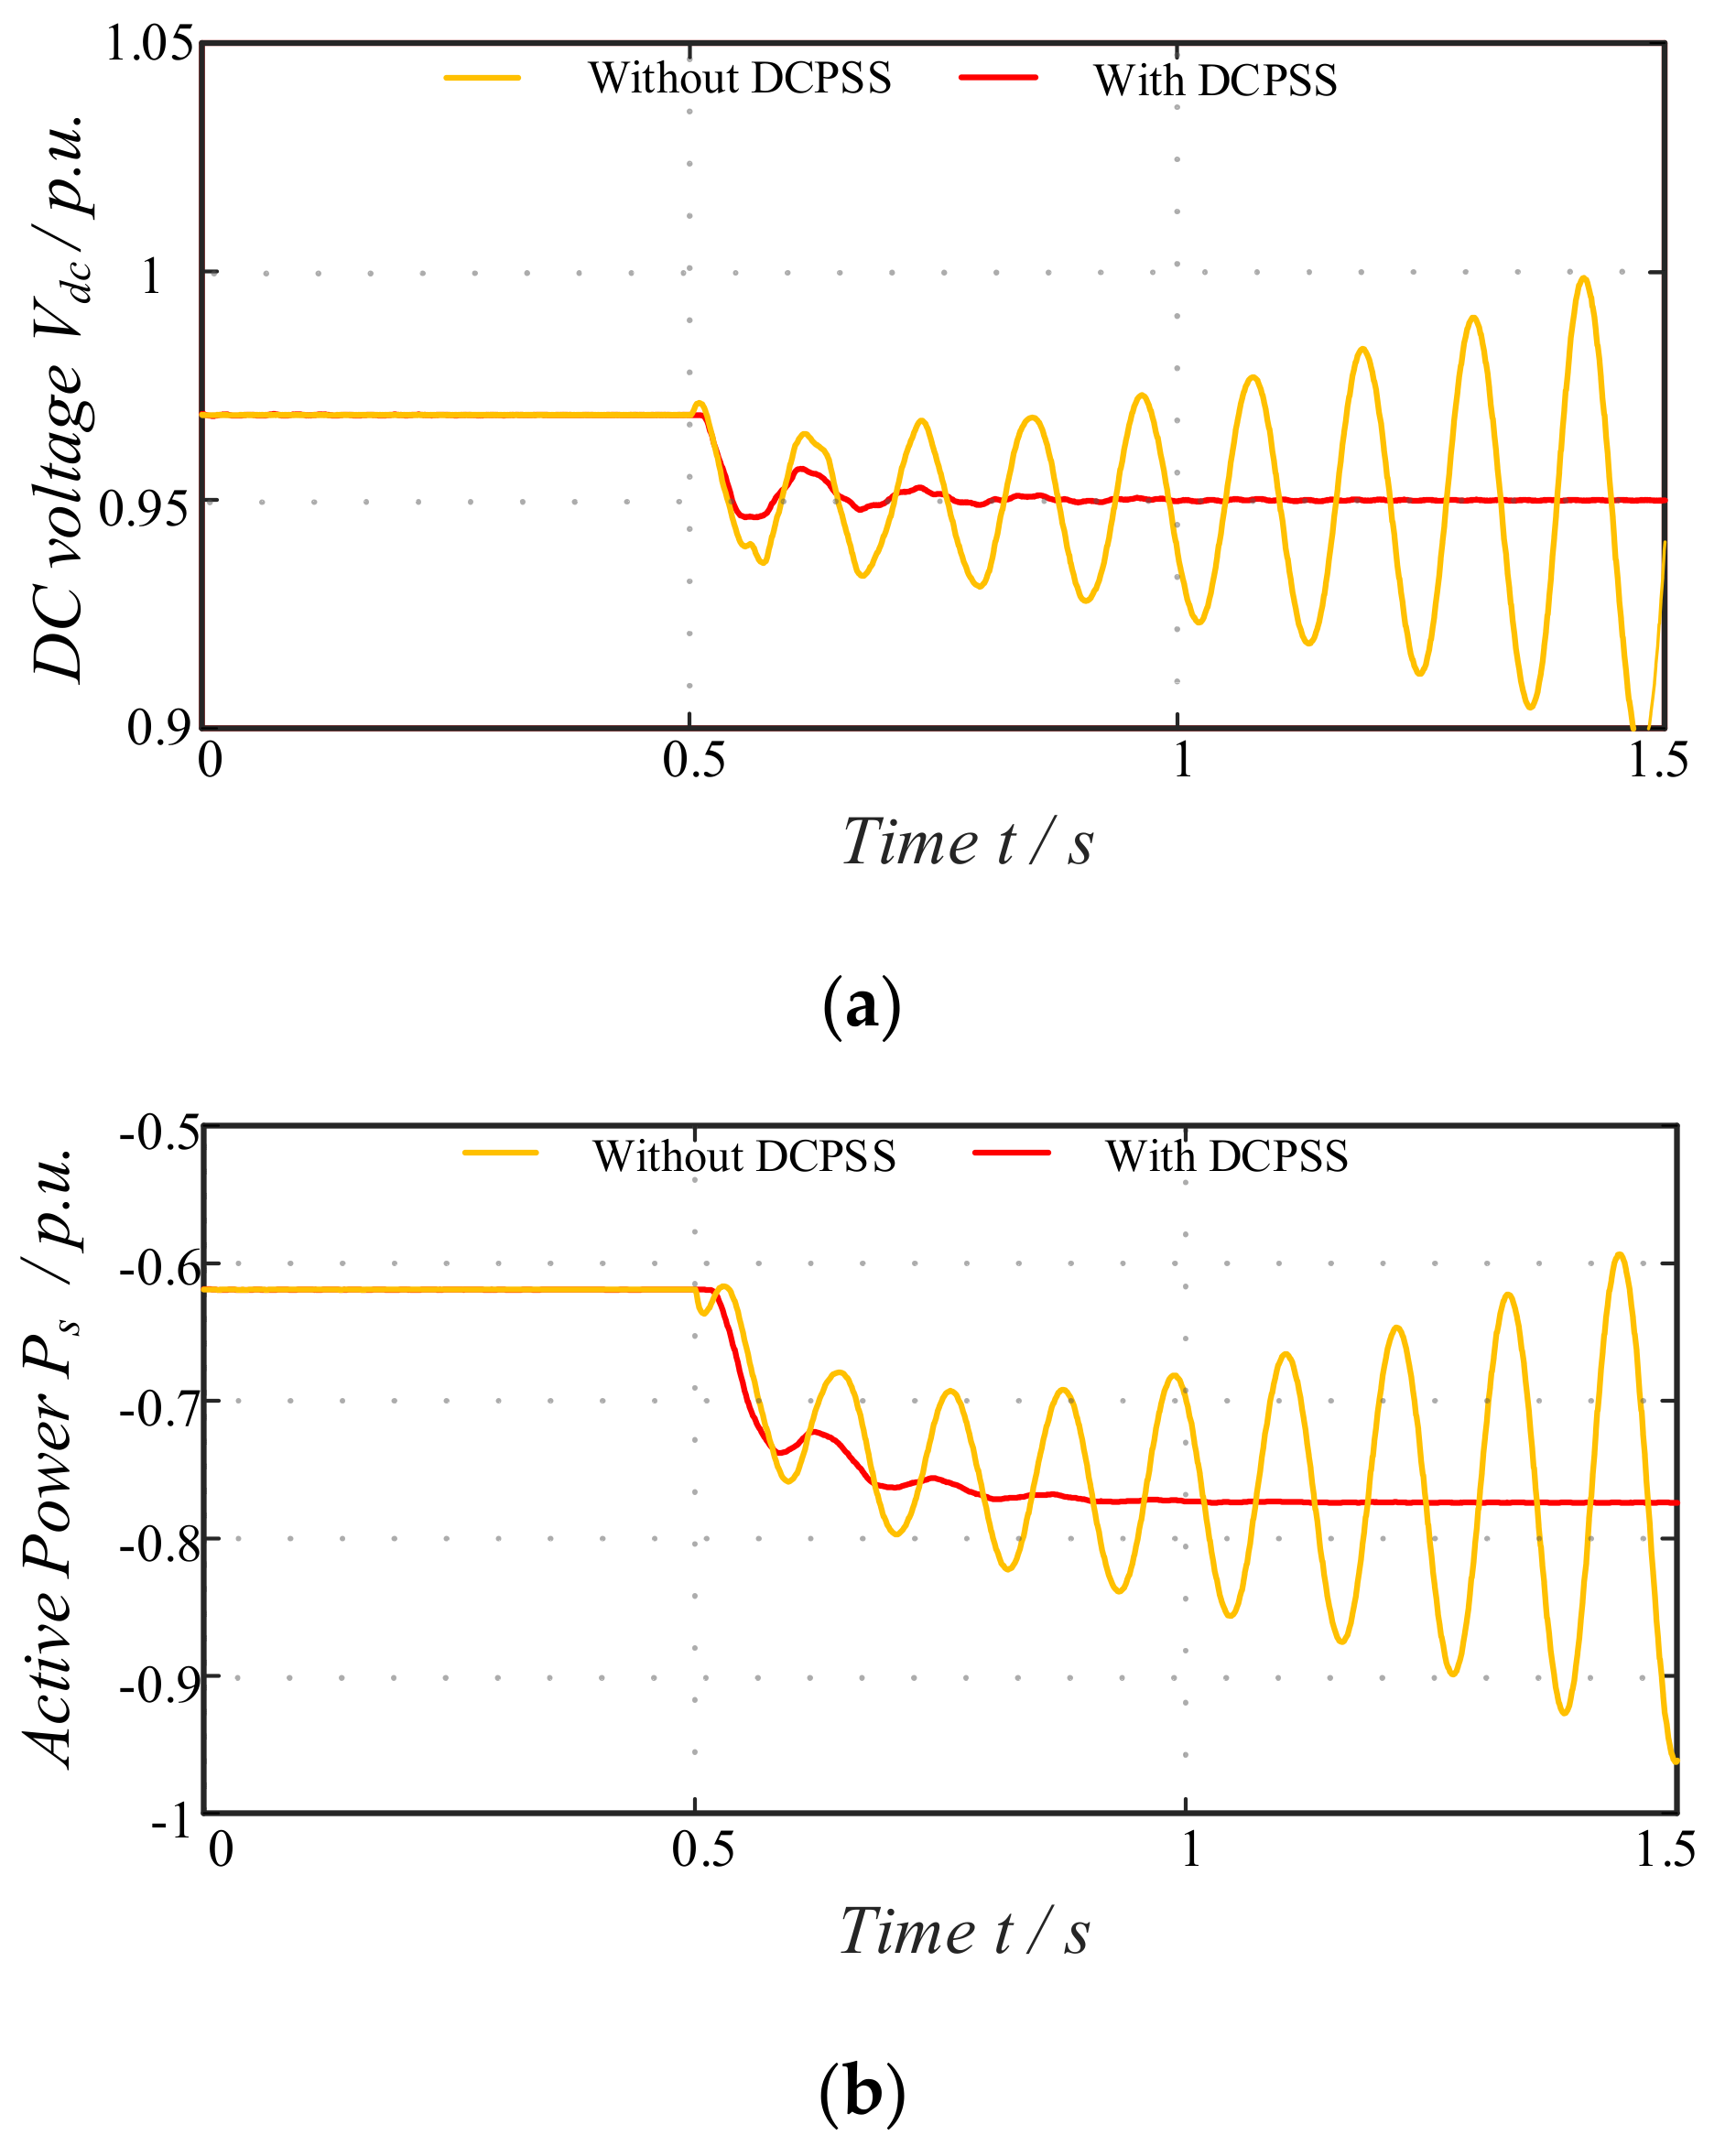
5.2.2. Instability Suppression Scenario

As discussed in Section 5.2.1, the existing of DCCBs could limit the stable operating area. In this subsection, the instable scenarios are studied. The state of the studied system is selected as Equilibrium I. The time responses of a MTDC system utilizing DC-PSS and its counterpart are shown in Figure 11. When the system is not equipped DC-PSS, instable oscillations arise after the contingency, with a 55.6 rad/s oscillating frequency. On the other hand, after activating the DC-PSS, the DC oscillations are effectively damped. The comparisons show that the proposed controller could enhance the transitions and enlarge the stable operation area, which is limited by the DCCBs.

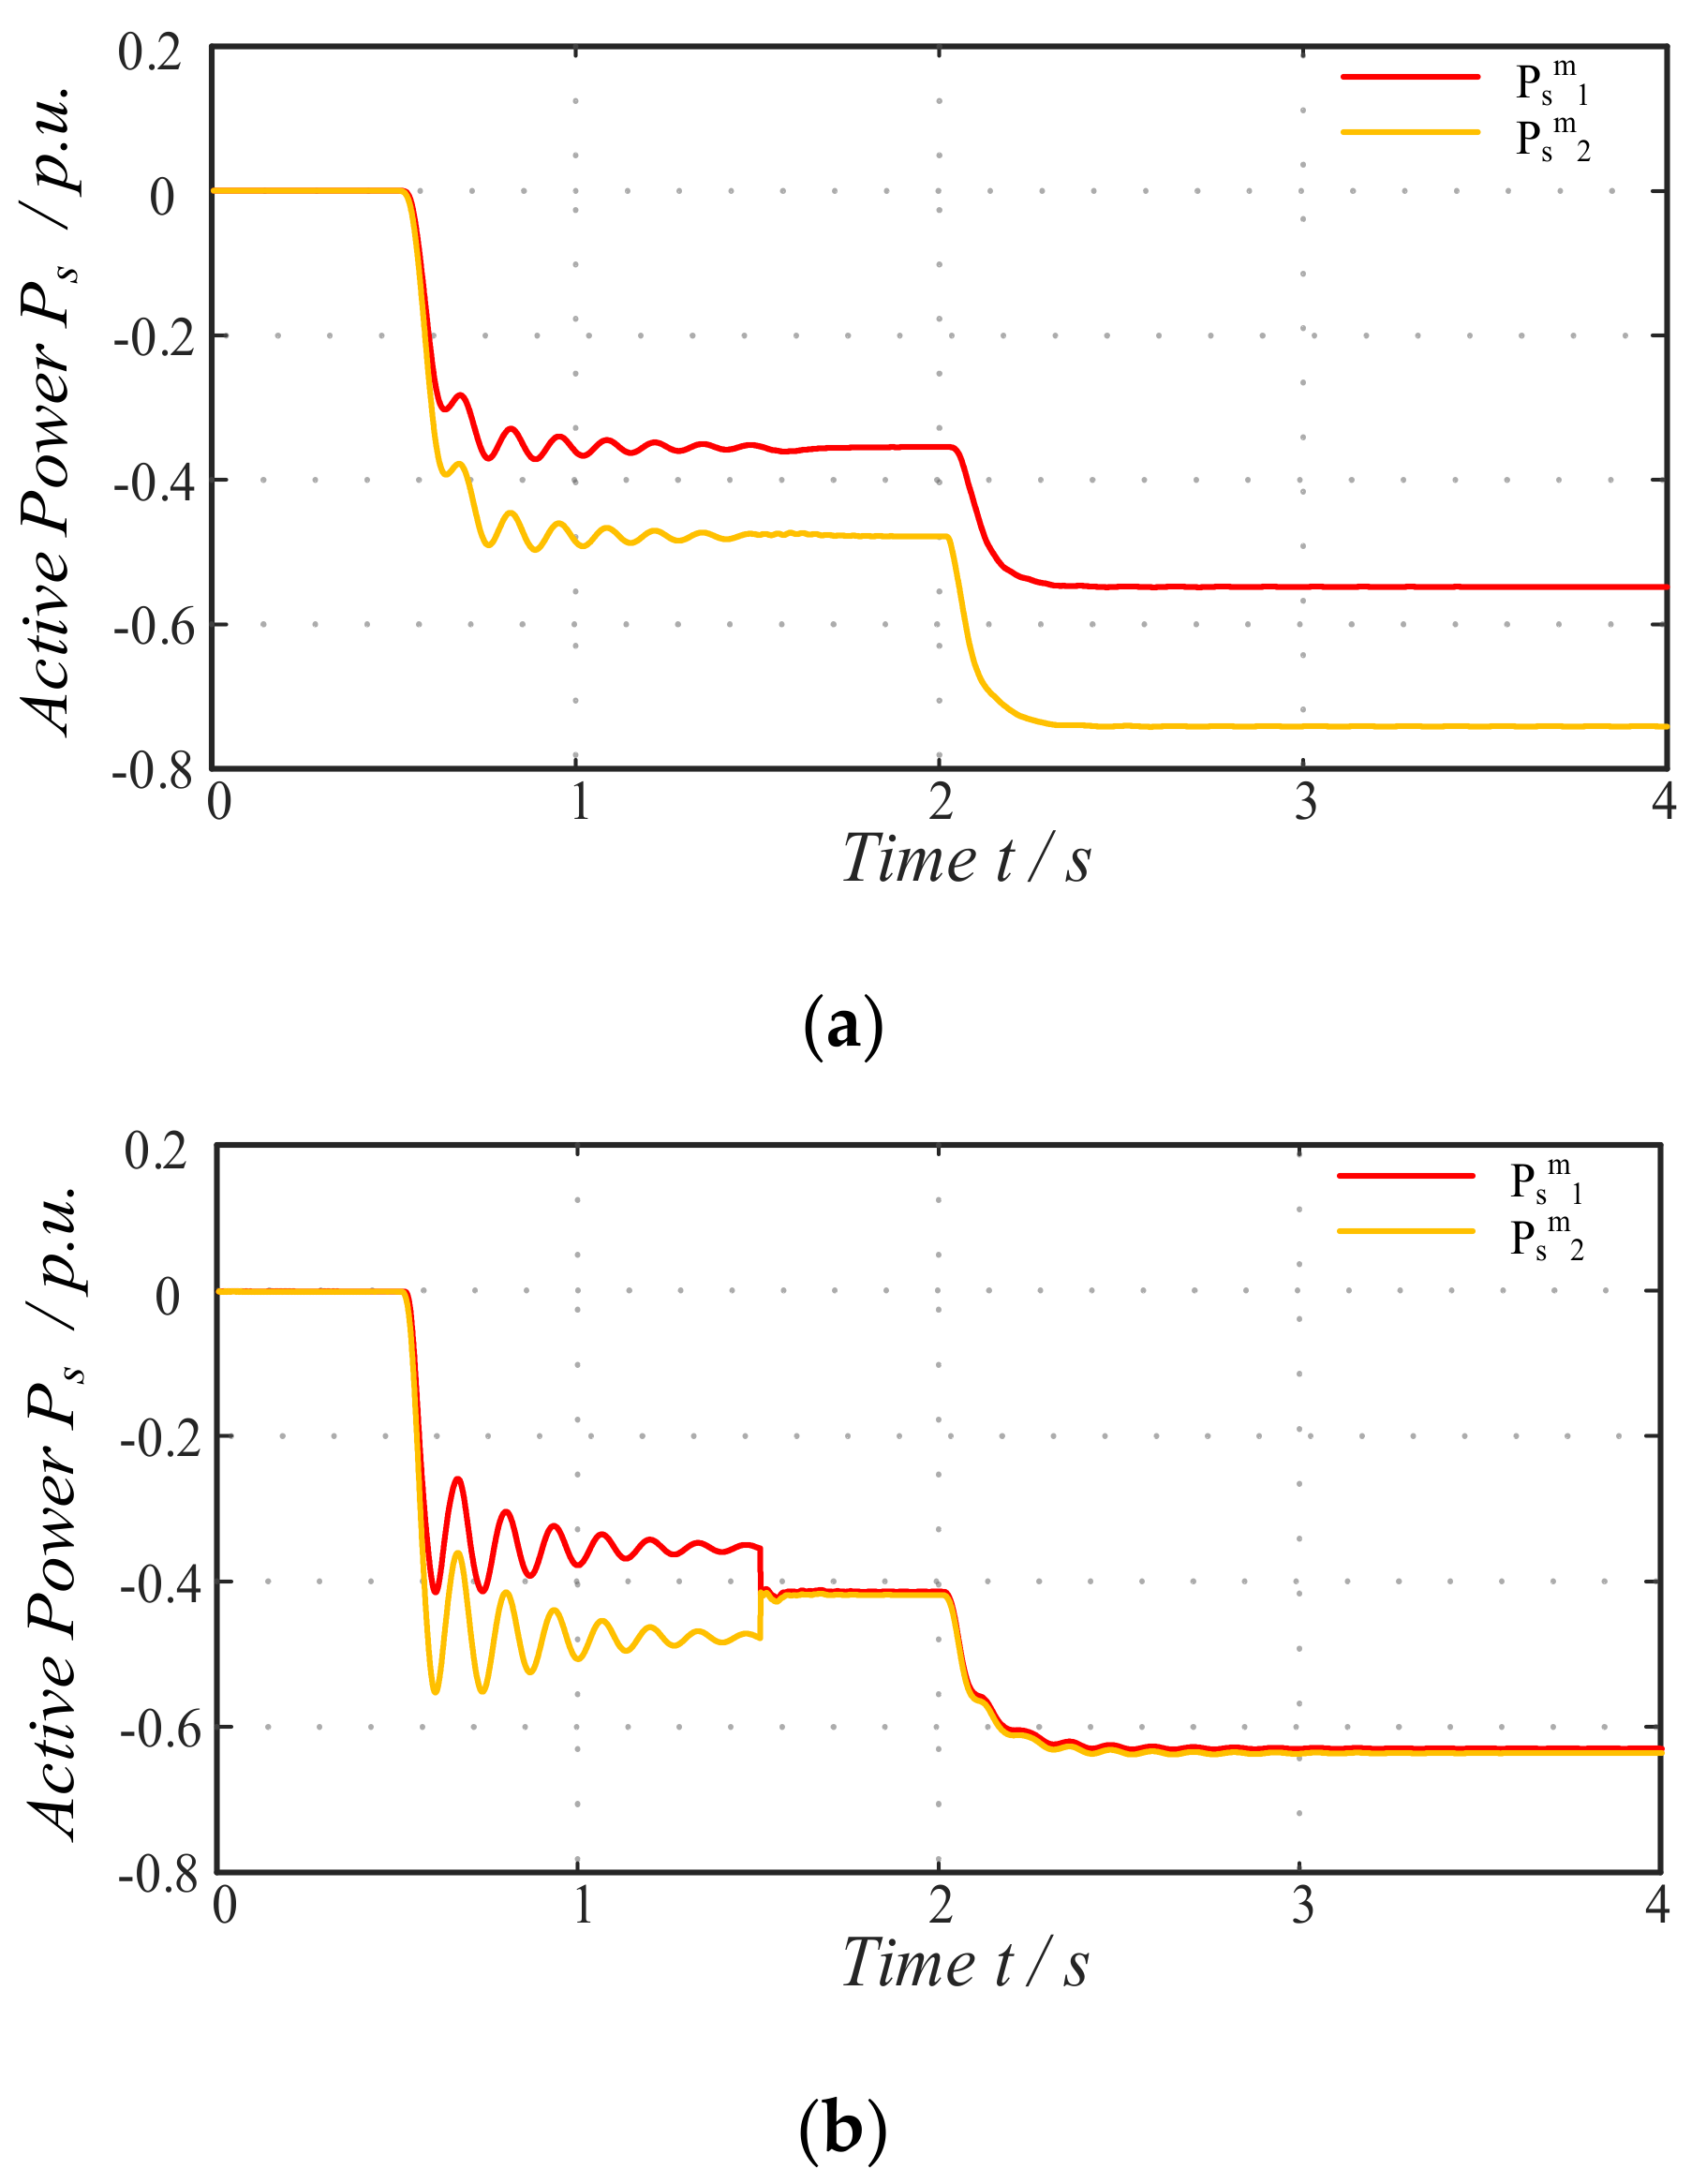
5.2.3. Accurate Power Sharing between VSCs

When power controlled VSC has a big power jump, the local controller cannot keep power balance of voltage controlled VSCs’ output power. As shown in Figure 12, the power of VSC3 and VSC4 step simultaneously from 0 to 0.4 p.u., at 0.5 s, and a 0.4 p.u. power jump of VSC4 occur at 2 s; DC-PSS is equipped at 1.5 s. The time-domain response of the power flow of VSC1 and VSC2 is shown in Figure 12. Figure 12a shows the power waveform with local controller, and Figure 12b shows the power waveform with the global controller. At the beginning of the simulation, DC-PSS is not equipped; the jump of the power contributes to the output of VSC1, and VSC2 is unbalanced. After DC-PSS is available, the local controller stabilizes the power flow faster, but it cannot coordinate the output power of each VSC. Compared with the local controller, the global controller realizes balance power sharing, which improves the synergies between VSC1 and VSC2, and improves the robustness of the power transmission performance of the system. Moreover, by changing the input of the global controller, the output power of each converter can be combined arbitrarily in theory.

6. Conclusions

In this study, DC resonance problems in DCCB-equipped VSC–MTDC systems were thoroughly investigated. A modal analysis and a time-domain simulation were performed to identify key factors influencing the VSC–MTDC system stability. It was found that a large reactor has an adverse effect on the system stability and limits the stable operating area, especially for the negative power factor case. To damp DC oscillations and improve the robustness of MTDC system, a novel damping controller based on mixed sensitivity was proposed, which can stabilize the system and specified distribution of power among multiple terminals. The effectiveness of proposed method has been verified by transient time-domain simulations. The simulation results show that the proposed DC-PSS can increase the damping ratio of the critical mode by 327%.
The DC-PSS greatly improves the stability of the system and the transportable capacity of the system, which has practical significance. However, the proposed controllers use the empirical method to select the weight function, which is convenient, but the controller performance may not be the best. Furthermore, the artificial intelligence algorithm can be used to adjust the weight function to improve the performance of the controller.

Author Contributions

Conceptualization, W.M.; methodology, J.G.; software, G.Z.; validation, J.G., and G.Z.; formal analysis, G.Z.; investigation, J.G.; writing—original draft preparation, Y.Z.; writing—review and editing, K.Z.; visualization, J.H.; supervision, L.D.; project administration, Y.Z.; funding acquisition, W.M. All authors have read and agreed to the published version of the manuscript.

Funding

This research was funded by National Natural Science Foundation of China: 51777216 and 51507191.

Institutional Review Board Statement

Not applicable.

Informed Consent Statement

Not applicable.

Data Availability Statement

Not applicable.

Conflicts of Interest

The authors declare no conflict of interest.

Nomenclature

N1, NCTotal number of cables and converters in a MTDC system
VSCi, VSCjThe i-th and j-th voltage-sourced converter in a MTDC system
Vdc0The steady-state value of a DC voltage
ΔVdc0The small signal value of a DC voltage
Vdc, PsThe measurement value of a DC voltage and the active power injections atthe point of the common coupling
Psm, Ps*The modulation value of a droop controller and the reference value of an active power controller
Lr, RrThe inductance and resistance of a DC reactor
Kp, KiThe proportional coefficient and integral coefficient of a PI controller
en, znThe error and its integral values of the n-th PI controller. (n = 1, 2, 3, 4)

References

  1. Abedin, T.; Lipu, M.S.H.; Hannan, M.A.; Ker, P.J.; Rahman, S.A.; Yaw, C.T.; Tiong, S.K.; Muttaqi, K.M. Dynamic modeling of hvdc for power system stability assessment: A review, issues, and recommendations. Energies 2021, 14, 4829. [Google Scholar] [CrossRef]
  2. Flourentzou, N.; Agelidis, V.G.; Demetriades, G.D. VSC-based HVDC power transmission systems: An overview. IEEE Trans. Power Electron. 2009, 24, 592–602. [Google Scholar] [CrossRef]
  3. Rodriguez, P.; Rouzbehi, K. Multi-terminal DC grids: Challenges and prospects. J. Mod. Power Syst. Clean Energy 2017, 5, 515–523. [Google Scholar] [CrossRef] [Green Version]
  4. Lei, Z.; Zou, Y.; Yu, J.; Vittal, V.; Wang, Z. Modeling, control, and protection of modular multilevel converter-based multi-terminal HVDC systems: A review. CSEE J. Power Energy Syst. 2017, 3, 340–352. [Google Scholar]
  5. Sun, J.; Wang, H.; Zhu, X.; Pu, Q. A self-regulation strategy for the power fluctuation of the islanded voltage source converter (VSC) station delivering large-scale wind power. Energies 2020, 13, 560. [Google Scholar] [CrossRef] [Green Version]
  6. Zhang, J.P.; Zhao, C. The research of SM topology with DC fault tolerance in MMC-HVDC. IEEE Trans. Power Deliv. 2015, 30, 1561–1568. [Google Scholar] [CrossRef]
  7. Zeng, R.; Xu, L.; Yao, L.; Morrow, D.J. Precharging and DC Fault Ride-Through of Hybrid MMC-Based HVDC Systems. IEEE Trans. Power Deliv. 2015, 30, 1298–1306. [Google Scholar] [CrossRef] [Green Version]
  8. Miyara, R.; Nakadomari, A.; Matayoshi, H.; Takahashi, H.; Hemeida, A.M.; Senjyu, T. A Resonant Hybrid DC Circuit Breaker for Multi-Terminal HVDC Systems. Sustainability 2020, 12, 7771. [Google Scholar] [CrossRef]
  9. Schmitt, D.; Wang, Y.; Weyh, T.; Marquardt, R. DC-side fault current management in extended multiterminal-HVDC-grids. In Proceedings of the International Multi-Conference on Systems, Signals & Devices, Chemnitz, Germany, 21–24 March 2012. [Google Scholar]
  10. Kontos, E.; Pinto, R.T.; Rodrigues, S.; Bauer, P. Impact of HVDC transmission system topology on multiterminal DC network faults. In Proceedings of the 2015 IEEE Power & Energy Society General Meeting, Denver, CO, USA, 26–30 June 2015. [Google Scholar]
  11. Bayo-Salas, A.; Beerten, J.; Rimez, J.; Hertem, D.V. analysis of control interactions in multi-infeed VSC HVDC connections. IET Gener. Transm. Distrib. 2016, 10, 1336–1344. [Google Scholar] [CrossRef]
  12. Bidadfar, A.; Nee, H.P.; Zhang, L.; Harnefors, L.; Namayantavana, S.; Abedi, M. Power system stability analysis using feedback control system modeling including HVDC transmission links. IEEE Trans. Power Syst. 2016, 31, 116–124. [Google Scholar] [CrossRef]
  13. Zhang, Z.; Lee, J.; Han, C.; Jeong, S.; Jang, G. An advance index to evaluate the stability of MMC-HVDC and offshore wind power generation. In Proceedings of the IEEE 8th International Conference on Advanced Power System Automation and Protection (APAP 2019), Xi’an, China, 21–24 October 2019. [Google Scholar]
  14. Yuan, Z.; Zhengchun, D.; Li, G. Analysis on the dynamic behaviours and interactions of VSC-MTDC grid. IET Gener. Transm. Distrib. 2018, 12, 1756–1764. [Google Scholar] [CrossRef]
  15. Pinares, G.; Bongiorno, M. Analysis and mitigation of instabilities originated from DC-side resonances in VSC-HVDC systems. IEEE Trans. Ind. Appl. 2016, 52, 2807–2815. [Google Scholar] [CrossRef]
  16. Amin, M.; Molinas, M.; Lyu, J.; Cai, X. Impact of power flow direction on the stability of VSC-HVDC seen from the impedance Nyquist Plot. IEEE Trans. Power Electron. 2017, 32, 8204–8217. [Google Scholar] [CrossRef]
  17. Chaudhuri, N.R.; Majumder, R.; Chaudhuri, B. Stability analysis of VSC MTDC grids connected to multimachine AC systems. In Proceedings of the 2012 IEEE Power and Energy Society General Meeting, San Diego, CA, USA, 22–26 July 2012. [Google Scholar]
  18. Kalcon, G.O.; Adam, G.P.; Anaya-Lara, O.; Lo, S.; Uhlen, K. Small-signal stability analysis of multi-terminal VSC-based DC transmission systems. IEEE Trans. Power Syst. 2012, 27, 1818–1830. [Google Scholar] [CrossRef]
  19. Jie, Y.; Kaipei, L.; Dongxu, W. Small signal stability analysis of VSC-HVSC applied to passive network. Proc. CSEE 2015, 35, 2400–2408. [Google Scholar]
  20. Das, K.; Guo, F.; Nuño, E.; Cutululis, N.A. Frequency stability of power system with large share of wind power under storm conditions. J. Mod. Power Syst. Clean Energy 2020, 8, 219–228. [Google Scholar] [CrossRef]
  21. Azizi, N.; Moradi CheshmehBeigi, H.; Rouzbehi, K. Optimal placement of direct current power system stabiliser (DC-PSS) in multi-terminal HVDC grids. IET Gener. Transm. Distrib. 2020, 14, 2315–2322. [Google Scholar] [CrossRef]
  22. Li, Y.; Tang, G.; Ge, J.; He, Z.; Wu, Y. Modeling and damping control of modular multilevel converter based DC grid. IEEE Trans. Power Syst. 2018, 33, 723–735. [Google Scholar] [CrossRef]
  23. Herrera, M.L.; Subramanyam, S.A.; Zhang, X. Robust control and optimal operation of multiple microgrids with configurable interconnections. In Proceedings of the 2019 IEEE Green Technologies Conference, Lafayette, LA, USA, 3–5 April 2019. [Google Scholar]
  24. Wu, W.; Wu, X.; Jing, L. Active damping control of multi-port DC power flow controller for suppressing power oscillation of MMC-MTDC under unbalanced grid. In Proceedings of the IEEE Energy Conversion Congress and Exposition (ECCE 2020), Detroit, MI, USA, 11–15 October 2020. [Google Scholar]
  25. Jiebei, Z.; Zhipeng, S.; Siqi, B.; Xialin, L.; Booth Campbell, D.; Qiu, W.; Hongjie, J.; Chengshan, W. Coordinated flexible damping mechanism with inertia emulation capability for MMC-MTDC transmission systems. IEEE J. Emerg. Sel. Top. Power Electron. 2020, 1. [Google Scholar] [CrossRef]
  26. Cao, W.; Han, M.; Zhang, X.; Xie, W.; Agundis-Tinajero, G.; Guerrero, J.M. A novel power sharing scheme of controlling parallel-operated inverters in islanded microgrids. IEEE J. Emerg. Sel. Top. Power Electron. 2021, 9, 5732–5746. [Google Scholar] [CrossRef]
  27. Zhou, K.; Doyle, J.C.; Glover, K. Robust and Optimal Control, 2st ed.; Prentice Hall: Hoboken, NJ, USA, 1995; pp. 373–399. [Google Scholar]
  28. Pal, B.; Chaudhuri, B. Robust Control in Power Systems, 1st ed.; Springer Science & Business Media: Berlin/Heidelberg, Germany, 2005; pp. 79–81. [Google Scholar]
  29. Chen, S.; Malik, O.P. H∞ optimisation-based power system stabiliser design. IEE Proc. Gener. Transm. Distrib. 1995, 142, 179–184. [Google Scholar] [CrossRef]
  30. Prieto-Araujo, E.F.; Bianchi, D.; Junyent-Ferre, A.; Gomis-Bellmunt, O. Methodology for droop control dynamic analysis of multiterminal VSC-HVDC grids for offshore wind farms. IEEE Trans. Power Deliv. 2011, 26, 2476–2485. [Google Scholar] [CrossRef]
  31. Chaudhuri, B.; Pal, B.C.; Zolotas, A.C.; Jaimoukha, I.M.; Green, T.C. Mixed-sensitivity approach to h-infinity control of power system oscillations employing multiple facts devices. IEEE Trans. Power Syst. 2003, 18, 1149–1156. [Google Scholar] [CrossRef] [Green Version]
  32. Banerjee, A.; Chaudhuri, N.R. Robust damping of inter-area oscillation in AC-MTDC grids using H∞ Mixed-sensitivity approach. In Proceedings of the IEEE Power and Energy Society General Meeting (PESGM 2016), Boston, MA, USA, 17–21 July 2016. [Google Scholar]
  33. Banerjee, A.; Chaudhuri, N.R.; Kavasseri, R.G. A novel explicit disturbance model-based robust damping of interarea oscillations through MTDC grids embedded in AC systems. In Proceedings of the IEEE Power & Energy Society General Meeting (PESGM 2019), Atlanta, GA, USA, 4–9 April 2019. [Google Scholar]
  34. Gahinet, P.; Nemirovskii, A.; Laub, A.J.; Chilali, M. The LMI control toolbox. In Proceedings of the 33rd IEEE Conference on Decision and Control, Lake Buena Vista, FL, USA, 14–16 December 1994. [Google Scholar]
  35. Chilali, M.; Gahinet, P. H∞ design with pole placement constraints: An LMI approach. IEEE Trans. Autom. Control 1996, 41, 358–367. [Google Scholar] [CrossRef]
Figure 1. Voltage-sourced converter model using vector control.
Symmetry 13 02037 g001
Figure 2. Voltage-sourced converter model using vector control.
Symmetry 13 02037 g002
Figure 3. Studied four-terminal VSC–MTDC system with DCCBs.
Symmetry 13 02037 g003
Figure 4. Participation factors of main eigenvalues in DC voltages under Equilibrium I.
Symmetry 13 02037 g004
Figure 5. Trajectories of eigenvalues corresponding to the variations of circuit parameters. (a) Inductance of DC reactors varies from 0 to 250 mH under Equilibrium I. (b) Inductance of DC reactors varies from 0 to 250 mH under Equilibrium II.
Symmetry 13 02037 g005
Figure 6. Trajectories of eigenvalues corresponding to the variations power flow. (a) The rectifying power of the power-controlled converter vary from 0 to 1 p.u. (b) The inverting power of the power-controlled converter varies from 0 to 1 p.u.
Symmetry 13 02037 g006
Figure 7. H∞ standard structure.
Symmetry 13 02037 g007
Figure 8. Standard structure of mixed-sensitivity optimization.
Symmetry 13 02037 g008
Figure 9. Bode plot of full-order controller and reduced-order controller.
Symmetry 13 02037 g009
Figure 10. Time−domain simulation results of the MTDC system under a series power change. (a) DC voltage of VSC2 (active power jump). (b) DC voltage of VSC2 (negative power jump).
Symmetry 13 02037 g010
Figure 11. Time−domain simulation results under instabilities. (a) DC voltage of VSC2. (b) Active power of VSC2.
Symmetry 13 02037 g011
Figure 12. Time−domain simulation results of power under reference power change. (a) Active power of VSC1 and VSC2 with local controller. (b) Active power of VSC1 and VSC2 with global controller.
Symmetry 13 02037 g012
Table 1. Studied equilibriums of the test system.
VSC1VSC2VSC3VSC4
Equilibrium I V dc / p . u . 0.96040.94650.92690.9121
P s / p . u . −0.3961−0.53530.40000.5000
Equilibrium II V d c / p . u . 1.03771.05001.06681.0793
P s / p . u . 0.37710.4997−0.5000−0.4000
Table 2. Critical eigenvalues of studied system under equilibrium. i stands for imaginary units.
ModeEigenvalue
(p.u.)
Damping Ratio ζ
(%)
Frequency
(rad/s)
M1−4.06 ± 56.00i0.07256.15
M2−11.94 ± 141.94i0.084142.45
M3−7.14 ± 247.84i0.029247.95
M4−11.89 ± 334.36i0.035335
Table 3. A comparison of the eigenvalues under different conditions. i stands for imaginary units.
ModePolesDamping Ratio ξωn (rad/s)
Open LoopClosed LoopOpen LoopClosed LoopOpen LoopClosed Loop
M1−4.06 ± 56.00i−13.69 ± 56.39i0.0720.23656.1558
M2−11.94 ± 141.94i−12.97 ± 143.9i0.0840.09142.4144
M3−7.14 ± 247.84i−10.80± 139.8i0.0290.07247.9140
ModePolesDamping Ratio ξωn (rad/s)
Open LoopClosed LoopOpen LoopClosed LoopOpen LoopClosed Loop
M1−4.06 ± 56.00i−19.45 ± 54.48i0.0720.43056.1553.9
M2−11.94 ± 141.94i−20.23 ± 141.9i0.0840.14142.4143
M3−7.14 ± 247.84i−27.6 ± 246.5i0.0290.11247.9248
Publisher’s Note: MDPI stays neutral with regard to jurisdictional claims in published maps and institutional affiliations.

