Abstract
Is Mr. Hyde more similar to his alter ego Dr. Jekyll, because of their physical identity, or to Jack the Ripper, because both evoke fear and loathing? The relative weight of emotional and visual dimensions in similarity judgements is still unclear. We expected an asymmetric effect of these dimensions on similarity perception, such that faces that express the same or similar feeling are judged as more similar than different emotional expressions of same person. We selected 10 male faces with different expressions. Each face posed one neutral expression and one emotional expression (five disgust, five fear). We paired these expressions, resulting in 190 pairs, varying either in emotional expressions, physical identity, or both. Twenty healthy participants rated the similarity of paired faces on a 7-point scale. We report a symmetric effect of emotional expression and identity on similarity judgements, suggesting that people may perceive Mr. Hyde to be just as similar to Dr. Jekyll (identity) as to Jack the Ripper (emotion). We also observed that emotional mismatch decreased perceived similarity, suggesting that emotions play a prominent role in similarity judgements. From an evolutionary perspective, poor discrimination between emotional stimuli might endanger the individual.
1. Introduction
Emotional similarity refers to the tendency to group stimuli together because they evoke the same feelings in us, even when they are visually different. For example, we may judge two different individuals with fearful faces either as similar, because they both express negative emotion, or different, because identity aspect of faces do not look alike. At present, it is not clear whether different stimulus attributes (i.e., emotional expression, identity aspect) have a symmetrical or asymmetrical influence on similarity perception. In other words, is Mr. Hyde more similar to Dr. Jekyll, because they have the same facial features (same identity), or to Jack the Ripper, because of the emotions they trigger in witnesses of their crimes?
The investigation of emotional similarity has a long tradition, with both replicated and controversial results. First, as framed by Russell’s circumplex model, participants rate the similarity between emotional stimuli according to their resemblance in valence and arousal. These orthogonal dimensions (valence and arousal) define participants’ emotional similarity space, wherein proximities reflect the similarity among stimuli [1]. This was replicated both in adults and children [2,3,4], using simple stimuli, such as words [5,6,7], objects [8,9], and faces [10,11,12,13], and with more complex stimuli, such as real world photographs [14,15,16]. Based on this line of research, an increasing number of studies aim to decode the nature of emotions in the brain [17], particularly where and how valence and arousal are represented, by computing the correlation between behavioural and neural measures of similarity [18,19,20,21].
One of the most controversial findings in the emotional similarity literature is related to asymmetries in similarity judgements between different levels of valence (i.e., negative vs. positive). Specifically, in a series of experiments, Koch et al. (2016) demonstrated that ‘good is more alike than bad’, that is, there is higher similarity among positive than negative emotional stimuli [5,13]. By contrast, others report higher semantic relatedness among negative than randomly selected non-emotional pictures [22] and wider generalisation in conditioned than unconditioned stimuli in healthy controls [23]. One of the reasons for these mixed results might be related to differences in semantic similarity among the various levels of valence of the experimental stimuli used. This may confound the relationship between emotional dimensions and perceived similarity [24]. One way to control for this confounding factor is to select simple stimuli, possibly from the same semantic category, such as faces.
Many datasets of prototypical emotional and neutral faces are currently available [25,26,27,28]. These are widely used in emotion cognition research to uncover how facial expressions are processed and perceived. In general, evidence from neural data shows that regions in the occipitotemporal lobe, including the fusiform face area, the inferior temporal cortex, and the superior temporal sulcus, encode facial identity and similarity among facial expressions [29,30,31]. In addition, Said et al. (2010) observed a positive correlation between neural similarity in the posterior superior temporal sulcus and affect-based similarity ratings [32]. In behaviour, faces depicting basic emotions that share the same valence and arousal elicited similar subjective experiences in healthy participants [33,34]. Among basic emotions, happiness is the one recognized with highest accuracy and lowest ambiguity [35,36]. Anger and disgust [37], as well as fear and surprise [35], are most frequently confused, probably because of an perceptual overlap, with lowered eyebrows in anger and disgust, and raised eyebrows in fear and surprise [38]. This similarity in emotional expression and physical appearance might explain part of the overall similarity observed between faces expressing different emotions in the face similarity space [39]. This is in line with the results from Said et al. (2010), who instructed two groups of participants to rate either the visual or the emotional similarity among faces, and reported high correlation (r = 0.93) between the visual and the affect-based similarity ratings [32].
However, these studies have so far failed to investigate the relative weight of emotional expression and visual identity in global similarity judgements among faces, since they did not ask participants to focus on one of these features. Only a handful of studies [12,39,40,41] explored the latter effect. Among them, Wegrzyn et al. (2017) asked participants to recognize emotions from faces that depicted two identities (one male and one female), which expressed seven different emotions. Faces were masked by a grid of white tiles, which started with one tile randomly shown and subsequently one additional tile was revealed every second. Participants were instructed to click a button below the image when they recognized the facial expression, and to select the labelled button corresponding to it in a forced-choice decision task. The multidimensional scaling (MDS) analysis of the emotion recognition task revealed that faces clustered according to the emotion they expressed in similarity space. Conversely, the MDS with the low-level visual features (grey-scale value in each pixel) of the faces as input showed that faces were dispersed according to the identity they depicted. However, in this study, participants were not asked to process inter-stimulus relationships. Conversely, Halberstadt and Niedenthal (1997) manipulated emotions by instructing participants to watch either emotional (positive or negative) or neutral movies, and then to judge the similarity among faces. Participants in the emotional compared to the non-emotional states weighted the emotional dimension of faces more than the gender or head orientation. Taken together, these studies suggest that the relevance of emotional expression and identity may be malleable according to task instructions, and that both are salient features that define participants’ face similarity space. However, it seems that these dimensions interact during subjective similarity judgement tasks.
One promising technique for disentangling emotional and visual facial features is to computes objective measures of low-level visual similarity among faces, as in the eigenfaces method [39]. According to this approach, the low-level visual similarity among faces is conceptualized as correlation between pixel values of grey-scale intensity; the eigenfaces are extracted by performing principal component analysis (PCA) on the correlations among faces, and represent unique visual features of a set of human faces as dimensions, which define the face-space [42]. This approach has been widely adopted in the context of face recognition and identification, because of the speed of recognition and a higher success rate in comparison to other computational methods [43]. Several studies [43,44,45,46] used eigenfaces to predict the emotions evoked from images. Success is greater when this method is used, compared to other low-level visual features (e.g., GIST, colour histograms). For example, Yuan et al. (2013) developed a novel algorithm based on eigenfaces, Sentribute, which reached a level of accuracy of 82% in predicting image sentiments based on mid-level attributes [44]. A similar approach was adopted in another study by Hsu (2013), wherein the authors automatically identified and discriminated emotions according to the two-dimensional subspace of valence-arousal [45].
We computed objective measures of low-level visual similarity, in order to control for visual similarity as confounding factor of the effect of interest: asymmetry between emotional expression and identity features on similarity judgements. In particular, we expected that paired faces with different identity that express the same or similar emotions (Mr. Hyde and Jack the Ripper) would be perceived as more similar than faces with the same identity, but different emotional expressions (Mr. Hyde vs. Dr. Jekyll), as shown in Figure 1. With this aim, we selected negative and neutral faces, that differed in either emotional or visual aspects. We also expected higher similarity ratings for faces with the same emotional expression or same identity (similarity within-category) than for faces with different emotional expressions and identities (similarity between categories). The first prediction represents our main hypothesis; the second one serves as manipulation check, since a good category boundary simultaneously maximizes the within-category similarity and minimizes the between categories similarity.
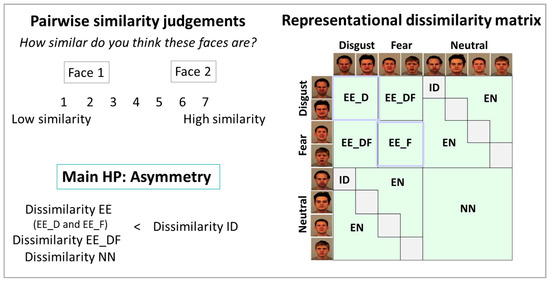
Figure 1.
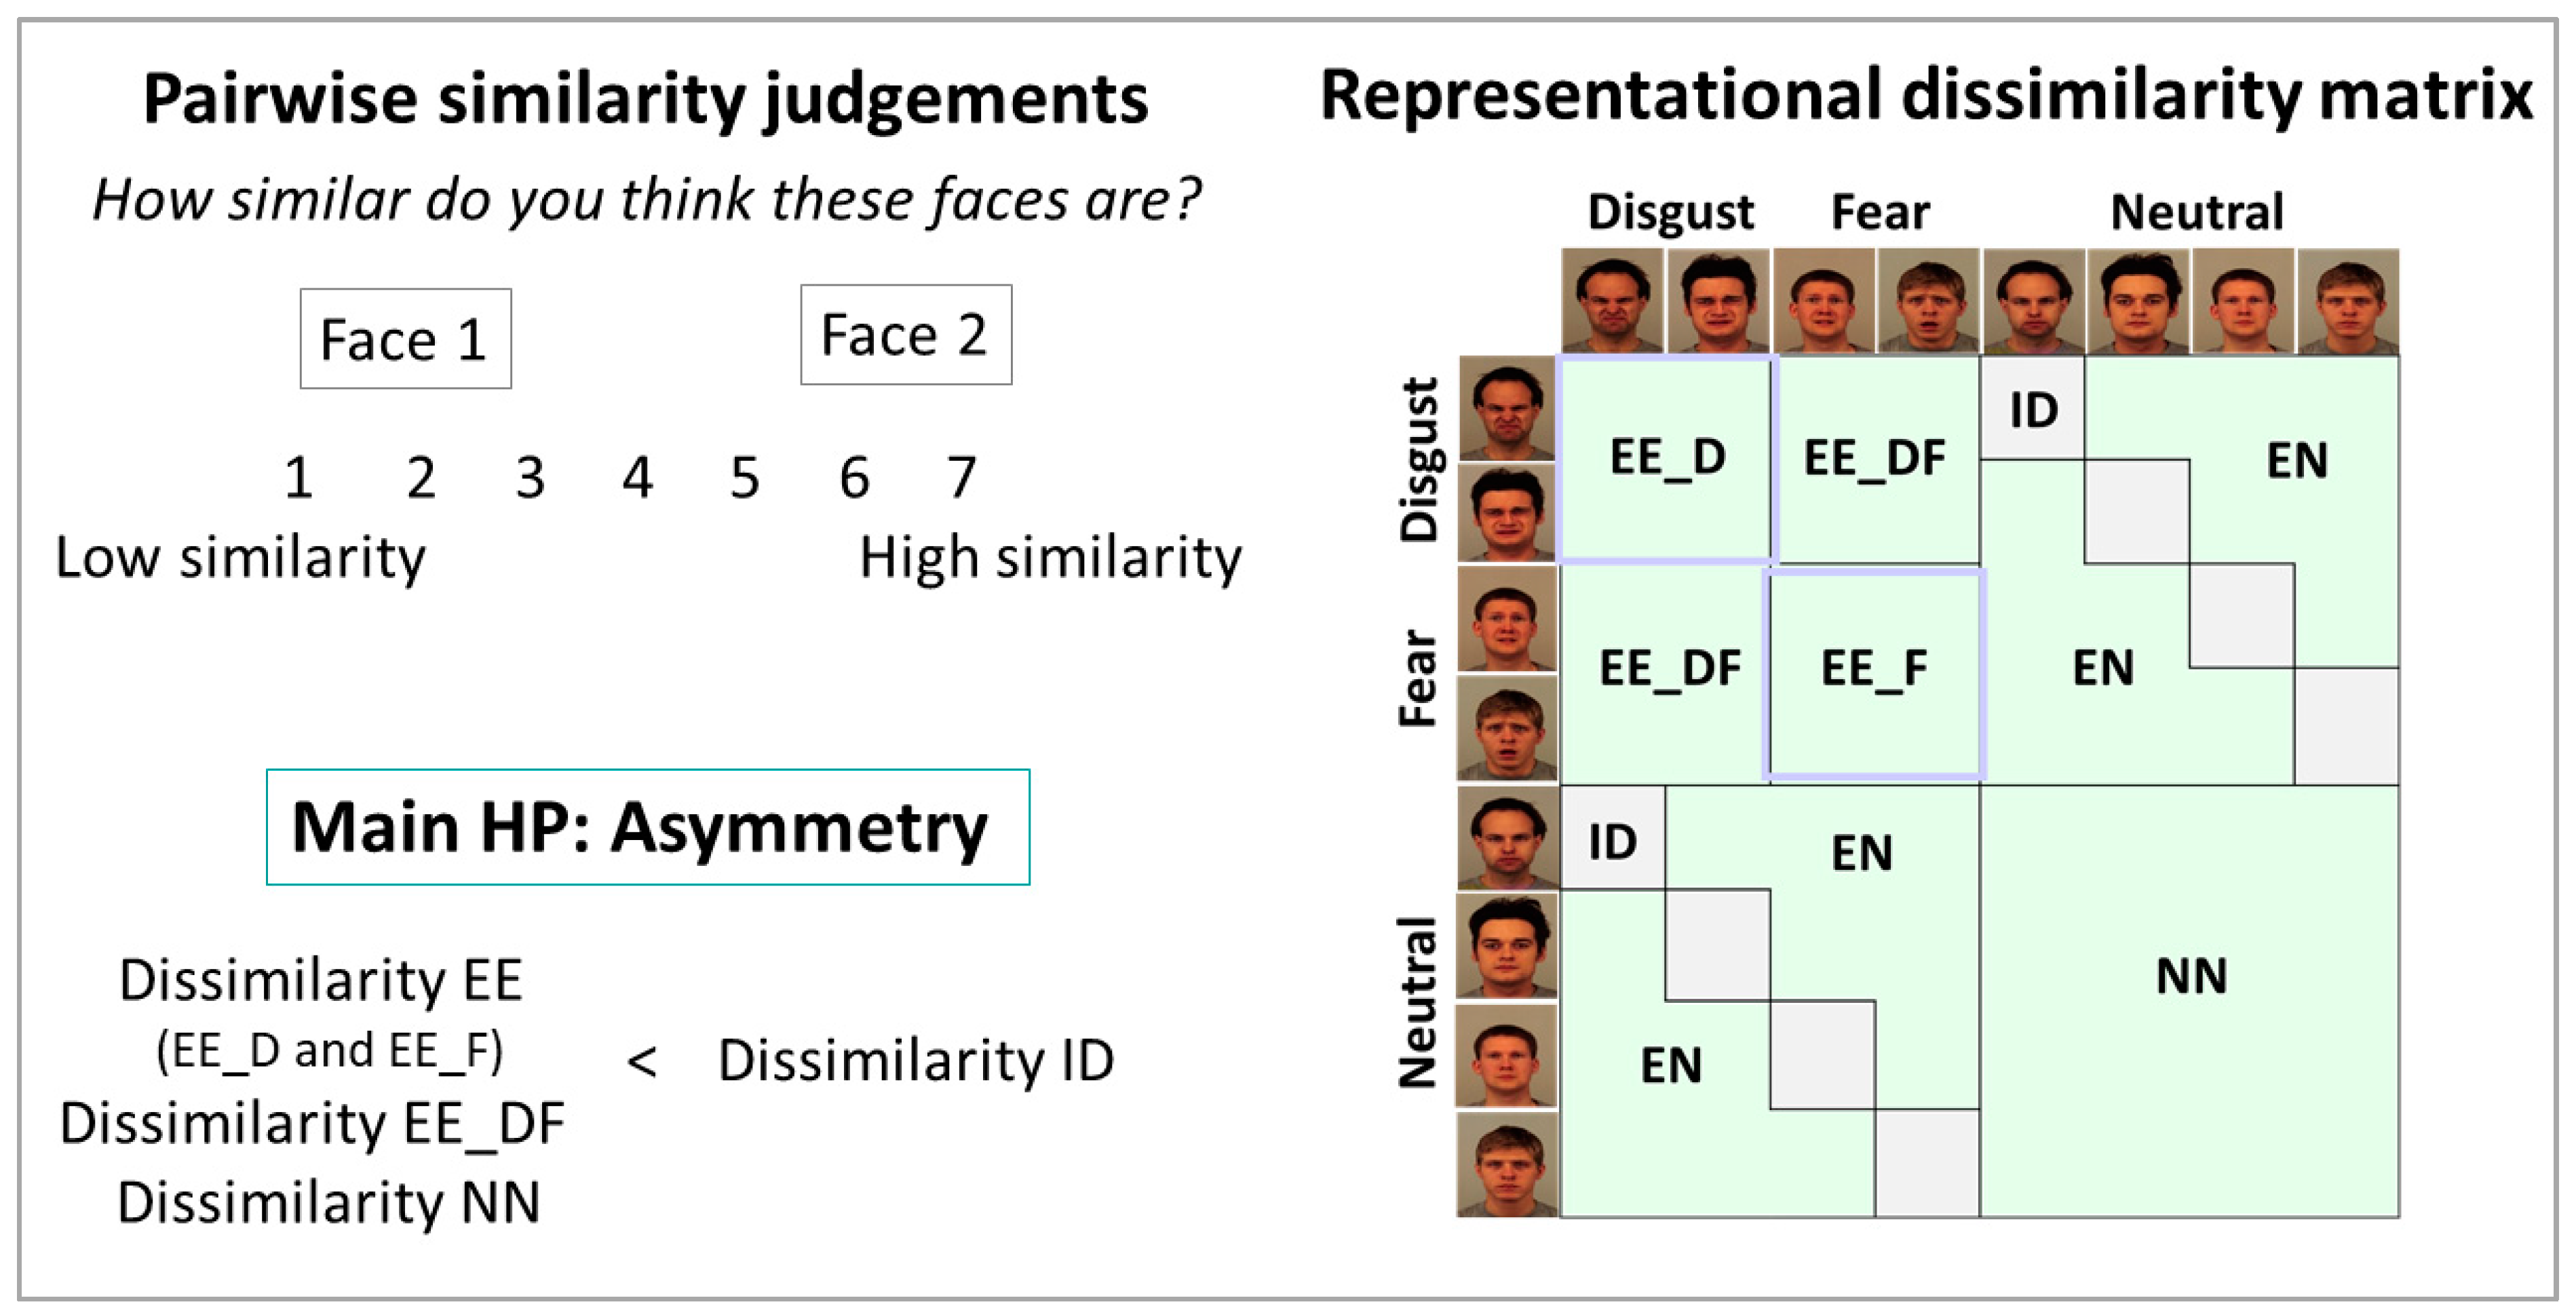
Graphical representation of the task structures, conditions of interest and key hypotheses. During the task, participants rated the similarity among all the possible combinations of 20 faces (5 disgust, 5 fear, 10 neutral) on a 7-point scale (1 = low similarity, 7 = high similarity). The similarity ratings were standardized, transformed into dissimilarity measures (correlational distance) and entered in a 20 × 20 representational dissimilarity matrix (RDM). In the RDM, the rows and the columns represented the stimuli (disgust: 1 to 5; fear: 6 to 10; neutral: 11 to 20), and each cell a correlational distance between faces in each pair. In the RDM, the violet squares represent the dissimilarity within emotional pictures (EE), calculated by averaging the dissimilarity within disgusted (EE_D) and fearful (EE_F) faces; EE_DF is the dissimilarity between disgusted and fearful faces, and NN the dissimilarity within neutral faces; ID, depicted in grey colour, indicates the dissimilarity between emotional and neutral faces, with the same identity, and EN the dissimilarity between emotional and neutral faces, with different identities. We expected an asymmetric effect of emotional expression and identity on similarity judgements, resulting in higher similarity (lower dissimilarity) in EE, EE_DF and NN compared to ID.
2. Materials and methods
2.1. Participants
A total of twenty healthy participants (13 females, 7 males; mean age 32.10 ± 10.17) were recruited from the University of Manchester to take part in the study. This sample size is comparable to other publications on this topic [47,48]. All participants had normal or corrected-to-normal vision and were older than 18 years. Participants provided informed consent prior to the experiment and were reimbursed for their participation. The exclusion criteria were: a history of neurological (e.g., head injury or concussion) or psychiatric (e.g., depression, anxiety) conditions, drug or alcohol abuse, or regular medication that could influence emotional processing. The study was approved by the ethics board number 2018-3619-5928 of the University of Manchester.
2.2. Stimuli
Twenty images of faces (562 pixels × 762 pixels) were selected from the Karolinska Directed Emotional Faces (KDEF) dataset [26], which comprises 490 colour pictures of human facial expressions from 70 selected individuals (35 women and 35 men), each displaying six basic emotions (angry, fearful, disgusted, happy, sad, and surprised) and a neutral facial expression. Each expression is photographed from the front. In particular, we selected 10 emotional (five disgust, IDs: 02, 06, 10, 17, 27; five images of fear, IDs: 04, 08, 11, 23, 28) male facial expressions, and their neutral equivalents (n = 10), which corresponded to the same IDs. We chose fear and disgust, because the most distinguishing characteristics of the emotion of fear appear in the upper half of the face (eyes), whereas for disgust these appear in the lower half of the face (mouth). We chose this to minimise the visual similarity between emotional faces such that their similarities were more related to emotional aspects. Males were selected in order to exclude gender as an additional dimension to consider in the judgement of similarity, which is beyond the scope of this experiment.
2.3. Experimental Procedure
Participants viewed all possible pairs of the 20 images, resulting in 190 different combinations, presented side by side on a blank screen. Participants were instructed to rate the similarity of each pair by using a 7-point scale (1 = low similarity, 7 = high similarity). Each trial started with a central fixation cross for 500 ms, the task cue (‘how similar do you think these pictures are?’) was presented at the top of the screen, and the judgement scale at the bottom. Participants were told to respond as quickly as possible by clicking the appropriate number key, and were informed that there was not a right or wrong answer. The task ended after approximately twenty minutes.
2.4. Data Analysis
Similarity ratings. We analysed the similarity ratings using Representational Similarity Analysis (RSA) [49], implemented in Matlab R2018, and SPSS. A graphical representation of the conditions of interest and key hypotheses is shown in Figure 1. Specifically, the similarity ratings were entered into a 20 × 20 similarity matrix for each participant. The rows and the columns represent the experimental stimuli, and each cell reflects the similarity rating for each pair. Then, for each subject, a Representational Dissimilarity Matrix (RDM) was computed. We first normalized the similarity ratings, by subtracting 1 (the lowest similarity rating) from each rating x, and then dividing by 6 (highest similarity rating—lowest similarity rating). Second, we transformed them into correlational distances, by subtracting the ratings from 1. These values were entered into each cell of the RDM. The RDM is therefore symmetric about a diagonal of zeros. Next, we extracted from the single-subject RDM the mean dissimilarities and standard deviations of our conditions of interest, shown in Figure 1: within emotional faces (EE), calculated by averaging the dissimilarity within disgusted (EE_D) and within fearful (EE_F) faces; within neutral faces (NN); between emotional and neutral faces with the same identity (ID); between emotional and neutral faces with different identities (EN). The latter served as a measure of dissimilarity between categories, and the first three as within-category dissimilarity. We also considered the dissimilarity between fearful and disgusted faces (EE_DF) as part of dissimilarity within-category, because the faces in this condition shared negative valence and high arousal. We included this measure to further test our main hypothesis with a dimensional approach to emotions. The dissimilarity measures were entered as dependent variables in two one-way repeated- measures ANOVAs, with conditions as grouping factor. The main hypothesis was tested in the first ANOVA, which included the conditions EE, NN, EE_DF, and ID, and used a planned contrast to test lower similarity (higher dissimilarity) in ID compared to the other conditions, as displayed in Figure 1. The second ANOVA used a planned contrast to test lower similarity (higher dissimilarity) in EN than in EE, NN, EE_DF and ID. Bonferroni post hoc corrections for multiple comparisons (p < 0.05) were used to explore the nature of the effect.
Multidimensional scaling (MDS) analysis. To visualize the structure of the similarity space, we performed a multidimensional scaling (MDS) analysis on the similarity ratings, where proximities reflect similarities among stimuli and are measured on an ordinal scale. The rank order of proximities determines the dimensionality of the space and the metric configuration of the points representing the stimuli [50]. In line with previous studies in this research field, we assumed this space to be two-dimensional, with valence and arousal as orthogonal dimensions [2]. The goodness-of-fit of the MDS representation was estimated with the Stress measure. We expected that faces clustered according to their similarity in emotional expression rather than identity in the bidimensional face space.
Pixel-based similarity. We measured low level visual similarity among faces by computing the Pearson correlations between pixel values of light intensity for each pair of faces. This was done to exclude the possibility that differences in similarity judgements among conditions were due to low level visual similarity only. In particular, we first prepared the dataset of images by transforming them into grey-scale and applying histogram equalization to enhance the contrast of the image and maximize the prominence of discernible features. Second, we computed the correlation coefficients between the pixels of each pair of images. To always obtain positive values, we converted the correlation coefficients into correlational distances (1—Pearson correlation). These were entered in a 20 × 20 representational dissimilarity matrix, wherein the row and the columns represented the faces and each cell the correlational distance between faces in each specific pair. We extracted from this matrix the mean and the standard deviation of each condition of interest, which resembled those in the similarity ratings matrix. These were used as dependent variables in a one-way repeated-measures ANOVA, wherein we used a planned contrast to test the same main hypothesis, that is, lower similarity (higher dissimilarity) in ID compared to EE, NN and EE_DF (p < 0.05).
3. Results
In contrast to our hypothesis, we did not observe lower similarity ratings in ID compared to EE, F(1, 19) = 1.80, p = 0.20, ηp2 = 0.09; EE_DF, F(1, 19) = 0.65, p = 0.43, ηp2 = 0.03; and NN, F(1, 19) = 2.30, p = 0.15, ηp2 = 0.11), indicating a symmetric rather than an asymmetric effect of emotional expression and identity on similarity judgements. Crucially, in post hoc tests, we did observe higher dissimilarity in EE_DF than NN (p < 0.001) and EE (p < 0.001), suggesting that any mismatch in emotion results in lower similarity judgements. As predicted, the manipulation check revealed higher dissimilarity in EN compared to EE, F(1, 19) = 77.83, p < 0.001, ηp2 = 0.80; EE_DF, F(1, 19) = 35.34, p < 0.001, ηp2 = 0.65; NN, F(1, 19) = 54.49, p < 0.001, ηp2 = 0.74; and ID, F(1, 19) = 37.20, p < 0.001, ηp2 = 0.66. Given the small sample size, we calculated the inter-rater reliability, which resulted in a very good Cronbach’s Alpha (α= 0.97). We also measured the visual similarity among faces by computing the correlational distance among them, in order to exclude the possibility that differences in similarity judgements among conditions were due to visual similarity. We found higher visual similarity (lower correlational distance) in ID compared to EN_DF, F(1, 9) = 33.93, p < 0.001, ηp2 = 0.79; and NN, F(1, 9) = 18.02, p = 0.002, ηp2 = 0.67, but only a trend towards significance was observed between ID and EE, F(1, 9) = 4.01, p = 0.08, ηp2 = 0.31. The MDS solution showed that the faces were clustered according to their similarity in valence and arousal (but not visual similarity) in a two-dimensional space. It had a Stress value of 0.04, indicating a good fit for this model. These findings are reported in Figure 2.
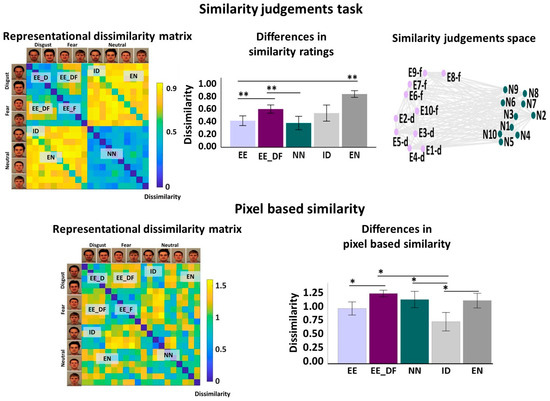
Figure 2.
Top panel. Similarity Judgements task.Left panel: Representational Dissimilarity Matrix (RDM) of the similarity ratings of 20 faces (5 disgust, 5 fear, 10 neutral), averaged across participants. It is symmetric about a diagonal of zeros, the rows and the columns represent the stimuli, and each cell the dissimilarity (measured as correlational distance: 1—standardized similarity ratings) between stimuli within each specific pair. Yellow colours denote high dissimilarity, blue colours low dissimilarity. Centre: differences in dissimilarity (measured as correlational distance) among conditions during the similarity judgements task: average dissimilarity within emotional faces (averaged across disgusted and fearful faces) (EE), between emotional faces (EE_DF), within neutral faces (NN), between emotional and neutral faces of the same identity (ID), and between emotional and neutral faces (with different identities) (EN). Right bottom panel: Multidimensional Scaling (MDS) plot of the 20 faces in a bidimensional space. Stimuli from E1_d to E5_d represented 5 disgusted faces, from E6_f to E10_f 5 fearful faces, and from N1 to N10 10 neutral faces. Pixel-based similarity. Left bottom panel: Representational Dissimilarity Matrix (RDM) of the visual similarity of 20 faces (5 disgust, 5 fear, 10 neutral). It is symmetric about a diagonal of zeros, the rows and the columns represent the stimuli, and each cell the correlational distance between stimuli within each specific pair. Yellow colours denote high dissimilarity, blue colours low dissimilarity. Right bottom panel: differences in visual similarity (measured as correlational distance) among conditions. Error bars represent ± 2 SEM; * pFWE < 0.05; ** pFWE < 0.001. Abbreviations: E, Emotional; f, fearful faces; d, disgusted faces; N, neutral faces.
4. Discussion
In this study, we investigated the asymmetric effect of emotional expression and identity on the perception of similarity between faces. We explored whether participants relied more on emotional or identity features while judging the similarity between emotional and neutral faces, without instructing them on which aspect to focus. We report two new findings. First, emotional and visual identity features had the same relevance in similarity judgements: Mr. Hyde is perceived as equally similar to Jack the Ripper and to his alter ego Dr. Jekyll. This result suggests a symmetric rather than an asymmetric effect on similarity perception. Second, similarity ratings were not fully explained by the identity of faces, evident in that NN and EE conditions were less visually similar (higher correlational distance) than ID, yet participants did not perceive these conditions to be different from each other in similarity. We also found that emotional similarity among faces may influence overall, global similarity perception, given the higher dissimilarity in conditions with an emotional mismatch (i.e., EE_DF and EN) compared to those with emotional congruency (i.e., EE and NN). Below we discuss the implications of these findings.
Symmetrical effects of emotional and identity features on similarity judgements provide additional evidence for the relevance of emotion in similarity judgements. Further support comes from the observation that an emotional mismatch (i.e., EN and EE_DF conditions) makes people perceive faces as less similar compared to conditions with emotional congruency (i.e., EE and NN). As previously proposed [12,41], this process is evolutionarily advantageous: poor discrimination among emotional expressions that have the same meaning (expressions of disgust, for example) possibly would not endanger the individual; however, when the stimulus is emotional, small dissimilarities can create large differences in similarity perception and action planning (e.g., fight or flight). Disgusted and fearful faces in the EE_DF condition have similar values in valence and arousal (low scores in valence and high scores in arousal). This is also the case for the neutral faces in the NN condition (medium scores in both valence and arousal). Yet, small variations in valence and arousal were more relevant when the faces were emotional, rather than neutral. Emotions convey specific information about one’s internal and external environment that each individual takes into consideration for congruent action planning and decision making. This is made possible by selectively focusing attention to the emotional aspects of the world, and it will probably result in a lower latency in detecting the emotional content of any stimulus and increased discriminability of stimuli exhibiting those features. Furthermore, we have shown that our emotional similarity judgments are not determined by the low-level visual similarity judgements. We observed less low-level visual similarity between emotionally similar faces, both neutral and negative emotional, than between faces with the same identity but different emotions. This suggests that the symmetric effect observed in the similarity ratings task is not explained by low-level visual similarity.
Our study has several limitations that can be addressed in future work. First, we studied only two negative emotions, neglecting positively valenced emotions. We chose this to increase the statistical power in terms of number of trials per condition, while keeping the experiment short enough to ensure participants’ attention. It would be relevant in future studies to examine whether the same effects are replicated with positive emotions. Second, we only selected male facial expressions. This was a deliberate choice, to ensure that participants would focus on the visual and emotional similarity among faces. However, it would be interesting to include gender as an additional dimension in face space and to explore its relative weight in similarity judgements. Finally, our sample size was quite small, even though the inter-rater reliability was very high. However, given the significance and applicability of the findings, it would be appropriate to replicate the experiment by increasing its sample size, and by including an equal number of male and female faces. This would test whether gender moderates the previously reported effects.
Overall, in the present study, we report a symmetrical effect of emotional expression and identity on similarity judgements. Mr. Hyde is equally similar to Dr. Jekyll and to Jack the Ripper, despite the higher visual similarity to the latter. Determining the relative importance of identity and emotion in similarity judgements is of paramount importance to combine the emotion cognition and computer science literatures to fill the ‘affective gap’ between facial visual features and their psychological representations in human observers [51].
Author Contributions
Conceptualization, M.R., D.T. and G.P.; methodology, M.R., D.T. and G.P.; software, M.R.; validation M.R., D.T. and G.P.; formal analysis, M.R.; investigation, M.R.; resources, D.T. and G.P.; data curation, M.R.; writing—original draft preparation, M.R., D.T. and G.P.; writing—review and editing, M.R., D.T. and G.P.; visualization, M.R., D.T. and G.P.; supervision, D.T. and G.P.; project administration, D.T. and G.P.; funding acquisition, M.R., D.T. and G.P. All authors have read and agreed to the published version of the manuscript.
Funding
This research was funded by the UK-Weizmann Studentship awarded to M.R., G.P. and D.T.
Institutional Review Board Statement
The study was conducted according to the guidelines of the Declaration of Helsinki, and approved by ethics board number 2018-3619-5928 of the University of Manchester.
Informed Consent Statement
Informed consent was obtained from all subjects involved in the study.
Data Availability Statement
All data will be available from authors upon request.
Conflicts of Interest
The authors declare no competing financial interest.
References
- Russell, J.A.; Pratt, G. A description of the affective quality attributed to environments. J. Personal. Soc. Psychol. 1980, 38, 311. [Google Scholar] [CrossRef]
- Russell, J.A.; Bullock, M. Multidimensional scaling of emotional facial expressions: Similarity from preschoolers to adults. J. Personal. Soc. Psychol. 1985, 48, 1290. [Google Scholar] [CrossRef]
- Hoemann, K.; Xu, F.; Barrett, L.F. Emotion words, emotion concepts, and emotional development in children: A constructionist hypothesis. Dev. Psychol. 2019, 55, 1830. [Google Scholar] [CrossRef] [PubMed]
- Tseng, A.; Bansal, R.; Liu, J.; Gerber, A.J.; Goh, S.; Posner, J.; Colibazzi, T.; Algermissen, M.; Chiang, I.C.; Russell, J.A.; et al. Using the circumplex model of affect to study valence and arousal ratings of emotional faces by children and adults with autism spectrum disorders. J. Autism Dev. Disord. 2014, 44, 1332–1346. [Google Scholar] [CrossRef] [PubMed] [Green Version]
- Koch, A.; Alves, H.; Krüger, T.; Unkelbach, C. A general valence asymmetry in similarity: Good is more alike than bad. J. Exp. Psychol. Learn. Mem. Cogn. 2016, 42, 1171. [Google Scholar] [CrossRef] [Green Version]
- Talmi, D.; Moscovitch, M. Can semantic relatedness explain the enhancement of memory for emotional words? Mem. Cogn. 2004, 32, 742–751. [Google Scholar] [CrossRef]
- Cowen, A.S.; Keltner, D. Self-report captures 27 distinct categories of emotion bridged by continuous gradients. Proc. Natl. Acad. Sci. USA 2017, 114, E7900–E7909. [Google Scholar] [CrossRef] [PubMed] [Green Version]
- Leclerc, C.M.; Kensinger, E.A. Effects of age on detection of emotional information. Psychol. Aging 2008, 23, 209. [Google Scholar] [CrossRef] [PubMed] [Green Version]
- Biondi, G.; Franzoni, V.; Yuanxi, L.; Milani, A. Web-based similarity for emotion recognition in web objects. In Proceedings of the 9th International Conference on Utility and Cloud Computing, New York, NY, USA, 6–9 December 2016. [Google Scholar]
- Aviezer, H.; Hassin, R.R.; Ryan, J.; Grady, C.; Susskind, J.; Anderson, A.; Moscovitch, M.; Bentin, S. Angry, disgusted, or afraid? Studies on the malleability of emotion perception. Psychol. Sci. 2008, 19, 724–732. [Google Scholar] [CrossRef]
- Van Tilburg, W.A.; Igou, E.R. Boredom begs to differ: Differentiation from other negative emotions. Emotion 2017, 17, 309. [Google Scholar] [CrossRef] [PubMed] [Green Version]
- Halberstadt, J.B.; Niedenthal, P.M. Emotional state and the use of stimulus dimensions in judgment. J. Personal. Soc. Psychol. 1997, 72, 1017. [Google Scholar] [CrossRef]
- Mondloch, C.J.; Nelson, N.L.; Horner, M. Asymmetries of influence: Differential effects of body postures on perceptions of emotional facial expressions. PLoS ONE 2013, 8, e73605. [Google Scholar] [CrossRef] [PubMed]
- Gallo, D.A.; Foster, K.T.; Johnson, E.L. Elevated false recollection of emotional pictures in young and older adults. Psychol. Aging 2009, 24, 981. [Google Scholar] [CrossRef] [Green Version]
- Chavez, R.S.; Heatherton, T.F. Representational similarity of social and valence information in the medial pFC. J. Cogn. Neurosci. 2015, 27, 73–82. [Google Scholar] [CrossRef] [Green Version]
- Levine, S.M.; Wackerle, A.; Rupprecht, R.; Schwarzbach, J.V. The neural representation of an individualized relational affective space. Neuropsychologia 2018, 120, 35–42. [Google Scholar] [CrossRef] [PubMed]
- Kragel, P.A.; LaBar, K.S. Decoding the nature of emotion in the brain. Trends Cogn. Sci. 2016, 20, 444–455. [Google Scholar] [CrossRef] [PubMed] [Green Version]
- King, M.L.; Groen, I.I.A.; Steel, A.; Kravitz, D.J.; Baker, C.I. Similarity judgments and cortical visual responses reflect different properties of object and scene categories in naturalistic images. NeuroImage 2019, 197, 368–382. [Google Scholar] [CrossRef]
- Chikazoe, J.; Lee, D.H.; Kriegeskorte, N.; Anderson, A.K. Population coding of affect across stimuli, modalities and individuals. Nat. Neurosci. 2014, 17, 1114. [Google Scholar] [CrossRef] [Green Version]
- Yuen, K.; Johnston, S.J.; Martino, F.; Sorger, B.; Formisano, E.; Linden, D.E.J.; Goebel, R. Pattern classification predicts individuals’ responses to affective stimuli. Transl. Neurosci. 2012, 3, 278–287. [Google Scholar] [CrossRef]
- Todd, R.M.; Miskovic, V.; Chikazoe, J.; Anderson, A.K. Emotional objectivity: Neural representations of emotions and their Interaction with cognition. Annu. Rev. Psychol. 2020, 71, 25–48. [Google Scholar] [CrossRef] [PubMed]
- Talmi, D. Enhanced emotional memory: Cognitive and neural mechanisms. Curr. Dir. Psychol. Sci. 2013, 22, 430–436. [Google Scholar] [CrossRef] [Green Version]
- Starita, F.; Kroes, M.C.W.; Davachi, L.; Phelps, E.A.; Dunsmoor, J.E. Threat learning promotes generalization of episodic memory. J. Exp. Psychol. Gen. 2019, 148, 1426. [Google Scholar] [CrossRef] [PubMed]
- Riberto, M.; Pobric, G.; Talmi, D. The emotional facet of subjective and neural indices of similarity. Brain Topogr. 2019, 32, 956–964. [Google Scholar] [CrossRef] [PubMed] [Green Version]
- Ekman, P.; Friesen, W.V. Measuring facial movement. Environ. Psychol. Nonverbal Behav. 1976, 1, 56–75. [Google Scholar] [CrossRef]
- Lundqvist, D.; Flykt, A.; Öhman, A. The Karolinska Directed Emotional Faces-KDEF; Department of Clinical Neuroscience, Karolinska Institutet: Stockholm, Sweden, 1998. [Google Scholar]
- Tottenham, N.; Tanaka, J.W.; Leon, A.C.; McCarry, T.; Nurse, M.; Hare, T.; Marcus, D.J.; Westerlund, A.; Casey, B.; Nelson, C. The NimStim set of facial expressions: Judgments from untrained research participants. Psychiatry Res. 2009, 168, 242–249. [Google Scholar] [CrossRef] [Green Version]
- Mollahosseini, A.; Hasani, B.; Mahoor, M.H. Affectnet: A database for facial expression, valence, and arousal computing in the wild. IEEE Trans. Affect. Comput. 2017, 10, 18–31. [Google Scholar] [CrossRef] [Green Version]
- Guntupalli, J.S.; Wheeler, K.G.; Gobbini, M.I. Disentangling the representation of identity from head view along the human face processing pathway. Cereb. Cortex 2016, 27, 46–53. [Google Scholar] [CrossRef] [Green Version]
- Haxby, J.V.; Guntupalli, J.S.; Connolly, A.C.; Halchenko, Y.; Conroy, B.R.; Gobbini, M.I.; Hanke, M.; Ramadge, P.J. A common, high-dimensional model of the representational space in human ventral temporal cortex. Neuron 2011, 72, 404–416. [Google Scholar] [CrossRef] [PubMed] [Green Version]
- Charest, I.; Kievit, R.; Schmitz, T.W.; Deca, D.; Kriegeskorte, N. Unique semantic space in the brain of each beholder predicts perceived similarity. Proc. Natl. Acad. Sci. USA 2014, 111, 14565–14570. [Google Scholar] [CrossRef] [PubMed] [Green Version]
- Said, C.P.; Moore, C.D.; Engell, A.D.; Todorov, A.; Haxby, J.V. Distributed representations of dynamic facial expressions in the superior temporal sulcus. J. Vis. 2010, 10, 11. [Google Scholar] [CrossRef] [Green Version]
- Plutchik, R.E.; Conte, H.R. Circumplex Models of Personality and Emotions; American Psychological Association: Washington, DC, USA, 1997. [Google Scholar]
- Posner, J.; Russell, J.A.; Peterson, B.S. The circumplex model of affect: An integrative approach to affective neuroscience, cognitive development, and psychopathology. Dev. Psychopathol. 2005, 17, 715–734. [Google Scholar] [CrossRef] [PubMed]
- Palermo, R.; Coltheart, M. Photographs of facial expression: Accuracy, response times, and ratings of intensity. Behav. Res. Methods Instrum. Comput. 2004, 36, 634–638. [Google Scholar] [CrossRef]
- Leppänen, J.M.; Hietanen, J.K. Positive facial expressions are recognized faster than negative facial expressions, but why? Psychol. Res. 2004, 69, 22–29. [Google Scholar] [CrossRef]
- Pochedly, J.T.; Widen, S.C.; Russell, J.A. What emotion does the “facial expression of disgust” express? Emotion 2012, 12, 1315. [Google Scholar] [CrossRef] [PubMed]
- Matsumoto, D.; Ekman, P. Facial expression analysis. Scholarpedia 2008, 3, 4237. [Google Scholar] [CrossRef]
- Valentine, T.; Lewis, M.B.; Hills, P.J. Face-space: A unifying concept in face recognition research. Q. J. Exp. Psychol. 2016, 69, 1996–2019. [Google Scholar] [CrossRef] [PubMed] [Green Version]
- Nestor, A.; Plaut, D.C.; Behrmann, M. Feature-based face representations and image reconstruction from behavioral and neural data. Proc. Natl. Acad. Sci. USA 2016, 113, 416–421. [Google Scholar] [CrossRef] [Green Version]
- Wegrzyn, M.; Vogt, M.; Kireclioglu, B.; Schneider, J.; Kissler, J. Mapping the emotional face. How individual face parts contribute to successful emotion recognition. PLoS ONE 2017, 12, e0177239. [Google Scholar] [CrossRef] [Green Version]
- Sirovich, L.; Kirby, M. Low-dimensional procedure for the characterization of human faces. JOSA A 1987, 4, 519–524. [Google Scholar] [CrossRef]
- üge Çarıkçı, M.; Özen, F. A face recognition system based on eigenfaces method. Procedia Technol. 2012, 1, 118–123. [Google Scholar] [CrossRef] [Green Version]
- Yuan, J.; Mcdonough, S.; You, Q.; Luo, J. Sentribute: Image sentiment analysis from a mid-level perspective. In Proceedings of the Second International Workshop on Issues of Sentiment Discovery and Opinion Mining, Chicago, IL, USA, 11 August 2013. [Google Scholar]
- Hsu, L.-K.; Tseng, W.S.; Kang, L.W.; Wang, Y.C.F. Seeing through the expression: Bridging the gap between expression and emotion recognition. In Proceedings of the 2013 IEEE International Conference on Multimedia and Expo (ICME), San Jose, CA, USA, 15–19 July 2013. [Google Scholar]
- Sharma, P.; Esengönül, M.; Khanal, S.R.; Khanal, T.T.; Filipe, V.; Reis, M.J.C.S. Student concentration evaluation index in an e-learning context using facial emotion analysis. In Proceedings of the International Conference on Technology and Innovation in Learning, Teaching and Education, Thessaloniki, Greece, 20–22 June 2018; Springer: Berlin/Heidelberg, Germany, 2018. [Google Scholar]
- Leal, S.L.; Tighe, S.K.; Yassa, M.A. Asymmetric effects of emotion on mnemonic interference. Neurobiol. Learn. Mem. 2014, 111, 41–48. [Google Scholar] [CrossRef] [PubMed] [Green Version]
- Gray, K.L.; Adams, W.J.; Hedger, N.; Newton, K.E.; Garner, M. Faces and awareness: Low-level, not emotional factors determine perceptual dominance. Emotion 2013, 13, 537. [Google Scholar] [CrossRef] [PubMed]
- Kriegeskorte, N.; Mur, M.; Bandettini, P. Representational similarity analysis–connecting the branches of systems neuroscience. Front. Syst. Neurosci. 2008, 2, 4. [Google Scholar] [CrossRef] [Green Version]
- Shinkareva, S.V.; Wang, J.; Wedell, D.H. Examining similarity structure: Multidimensional scaling and related approaches in neuroimaging. Comput. Math. Methods Med. 2013, 2013, 1–9. [Google Scholar] [CrossRef] [Green Version]
- Zhao, S.; Ding, G.; Huang, Q.; Chua, T.-S.; Schuller, B.W.; Keutzer, K. Affective Image Content Analysis: A Comprehensive Survey. IJCAI 2018, 5534–5541. [Google Scholar] [CrossRef] [Green Version]

Publisher’s Note: MDPI stays neutral with regard to jurisdictional claims in published maps and institutional affiliations. |
© 2021 by the authors. Licensee MDPI, Basel, Switzerland. This article is an open access article distributed under the terms and conditions of the Creative Commons Attribution (CC BY) license (https://creativecommons.org/licenses/by/4.0/).