Abstract
In order to research train derailment law under ship impact, the spatial vibration calculation model of a freight train-track-bridge (FTTB) system is used to establish the vibration model of the FTTB system under ship impact. Meanwhile, the calculation method of a train derailment process under ship impact is proposed based on the random analysis method of train derailment energy. Further, the train derailment process on a bridge under ship impact is calculated, and the variation law of the FTTB system spatial vibration response under different impact loads and speeds is analyzed. The results show that the ship impact load has a great influence on wheel lift value. When the impact load is greater than 15 MN, the wheel derails more easily. With the increase of impact load, the derailment coefficient, wheel load reduction rate, and lateral relative displacement of bogie and rail, the lateral displacement of the bridge increases significantly, but the limits of them make it difficult to determine whether the wheel has derailed. The lateral relative displacement of the bogie and rail considering the safety factor is calculated at the moment of derailment, which is taken as the early warning threshold of train derailment. The above conclusions can provide a reference for controlling train safety under ship impact.
1. Introduction
With the rapid construction of heavy haul railways, it has become inevitable for railway lines to cross rivers, lakes, and seas, resulting in frequent ship impacts [1,2,3,4]. Ship impact not only causes damage to bridge structures, but also affects traffic safety and can lead to train derailment accidents in serious cases. In 1983, the passenger ship Drew Ivanov of Arneshan collided with the Volga Railway Bridge, where four carriages were derailed and fell into water, killing 240 people. In 1993, the CSX railway bridge was seriously struck by a tugboat fleet, resulting in a huge displacement of the bridge structure and derailment of the train, while 47 people died [5]. Wuhan Yangtze River Bridge has also seen a ship collision accident which interrupted the railway line. In fact, as the wheel derailment under ship impact destroys the symmetry of the wheel-rail system, it is necessary to carry out further research concerning running safety.
On the problem of running safety caused by ship impact, Wilson et al. [6] established the static model of a bridge anti-collision plate by finite element software ANSYS and studied the mechanical properties of the anti-collision plate under ship impact. Consolazio et al. [7,8,9,10] used the finite element method to simulate a ship collision course with different barge types and velocity. Yuan et al. [11] used LS-DYNA to simulate the process of a single ship and fleet impacting a bridge pier, revealing the mechanism of ship impacting a bridge pier and pointing out the limitations of AASHTO specification [12]. Sha et al. [13,14] made a cylindrical reinforced concrete bridge pier model, assessing equivalent ship collision processes by drop hammer impact, and addressing the link between impact force and velocity. Meanwhile, they simulated the impact process by LS-DYNA software considering the elastic-plastic deformation of piers. Fan et al. [15,16] used a multi-degree of freedom analysis model to simulate the ship-bridge collision process. Gholipour et al. [17,18] carried out research concerning the collision process considering the interaction of pile and soil and proposed that the greater the flexibility of the lower structure, the greater the deformation of the pier during the collision.
In addition, Xuan et al. [19] evaluated the risk of train derailment on a bridge and pointed out that further study of train derailment under ship impact load is necessary. Chen et al. [20] used LS-DYNA software to simulate the interaction between ship and pier, and the time history curve of ship collision force under different impact conditions was obtained. Wang et al. [21] simulated and analyzed the collision process between cargo ships and piers considering the HJC concrete model with strain rate. Fang Hai et al. [5] simulated the process of a ship impacting the bridge at different angles, calculated the lateral vibration responses of the beam and pier, and took the peak lateral acceleration of pier 1 m/s2 as the standard to judge the derailment of trains. Xia et al. [4,22] used the dynamic model to calculate and analyze the responses of a (32 + 48 + 32) m double-line prestressed concrete continuous girder bridge under impact and proposed the safety threshold curve of vehicle speed–impact strength.
However, the existing research mainly focuses on the ship impact force and the dynamic response of a vehicle-bridge system. There are few studies on train derailment caused by ship collision. In fact, the most ideal measure to control the derailment accident caused by ship collision is to avoid the occurrence of ship collision. Yet, it is difficult to completely eliminate this incident due to complex environments or mismanagement among other factors. In the operation of freight trains, derailment accidents caused by ships hitting bridges are sometimes difficult to detect in time due to the large number of vehicles and secondary accidents of vehicles rushing out of the bridge and falling. In order to minimize the derailment accidents caused by ship collision with bridges, it is necessary to ensure that the train wheels alarm or stop in time before derailment.
Therefore, according to the spatial vibration calculation model of the FTTB system and random analysis method of train derailment energy [23], a model of the FTTB system and the calculation method of the train derailment process under ship impact is established. Further, the calculation of FTTB system responses in the process of train derailment is realized, and the variation law of system response is analyzed. The threshold value with wheel derailment alarm information is obtained from the angle of the wheel-rail contact state and its relative position, which provides a reference for the development of a train wheel derailment warning device under ship impact.
2. Materials and Methods
2.1. Model of FTTB System under Ship Impact
2.1.1. Model of FTTB System
The FTTB system is a dynamic coupling system composed of freight trains, tracks, and bridges. At time t, a freight train consisting of one locomotive and M wagons is running on the track with the calculation length of L.
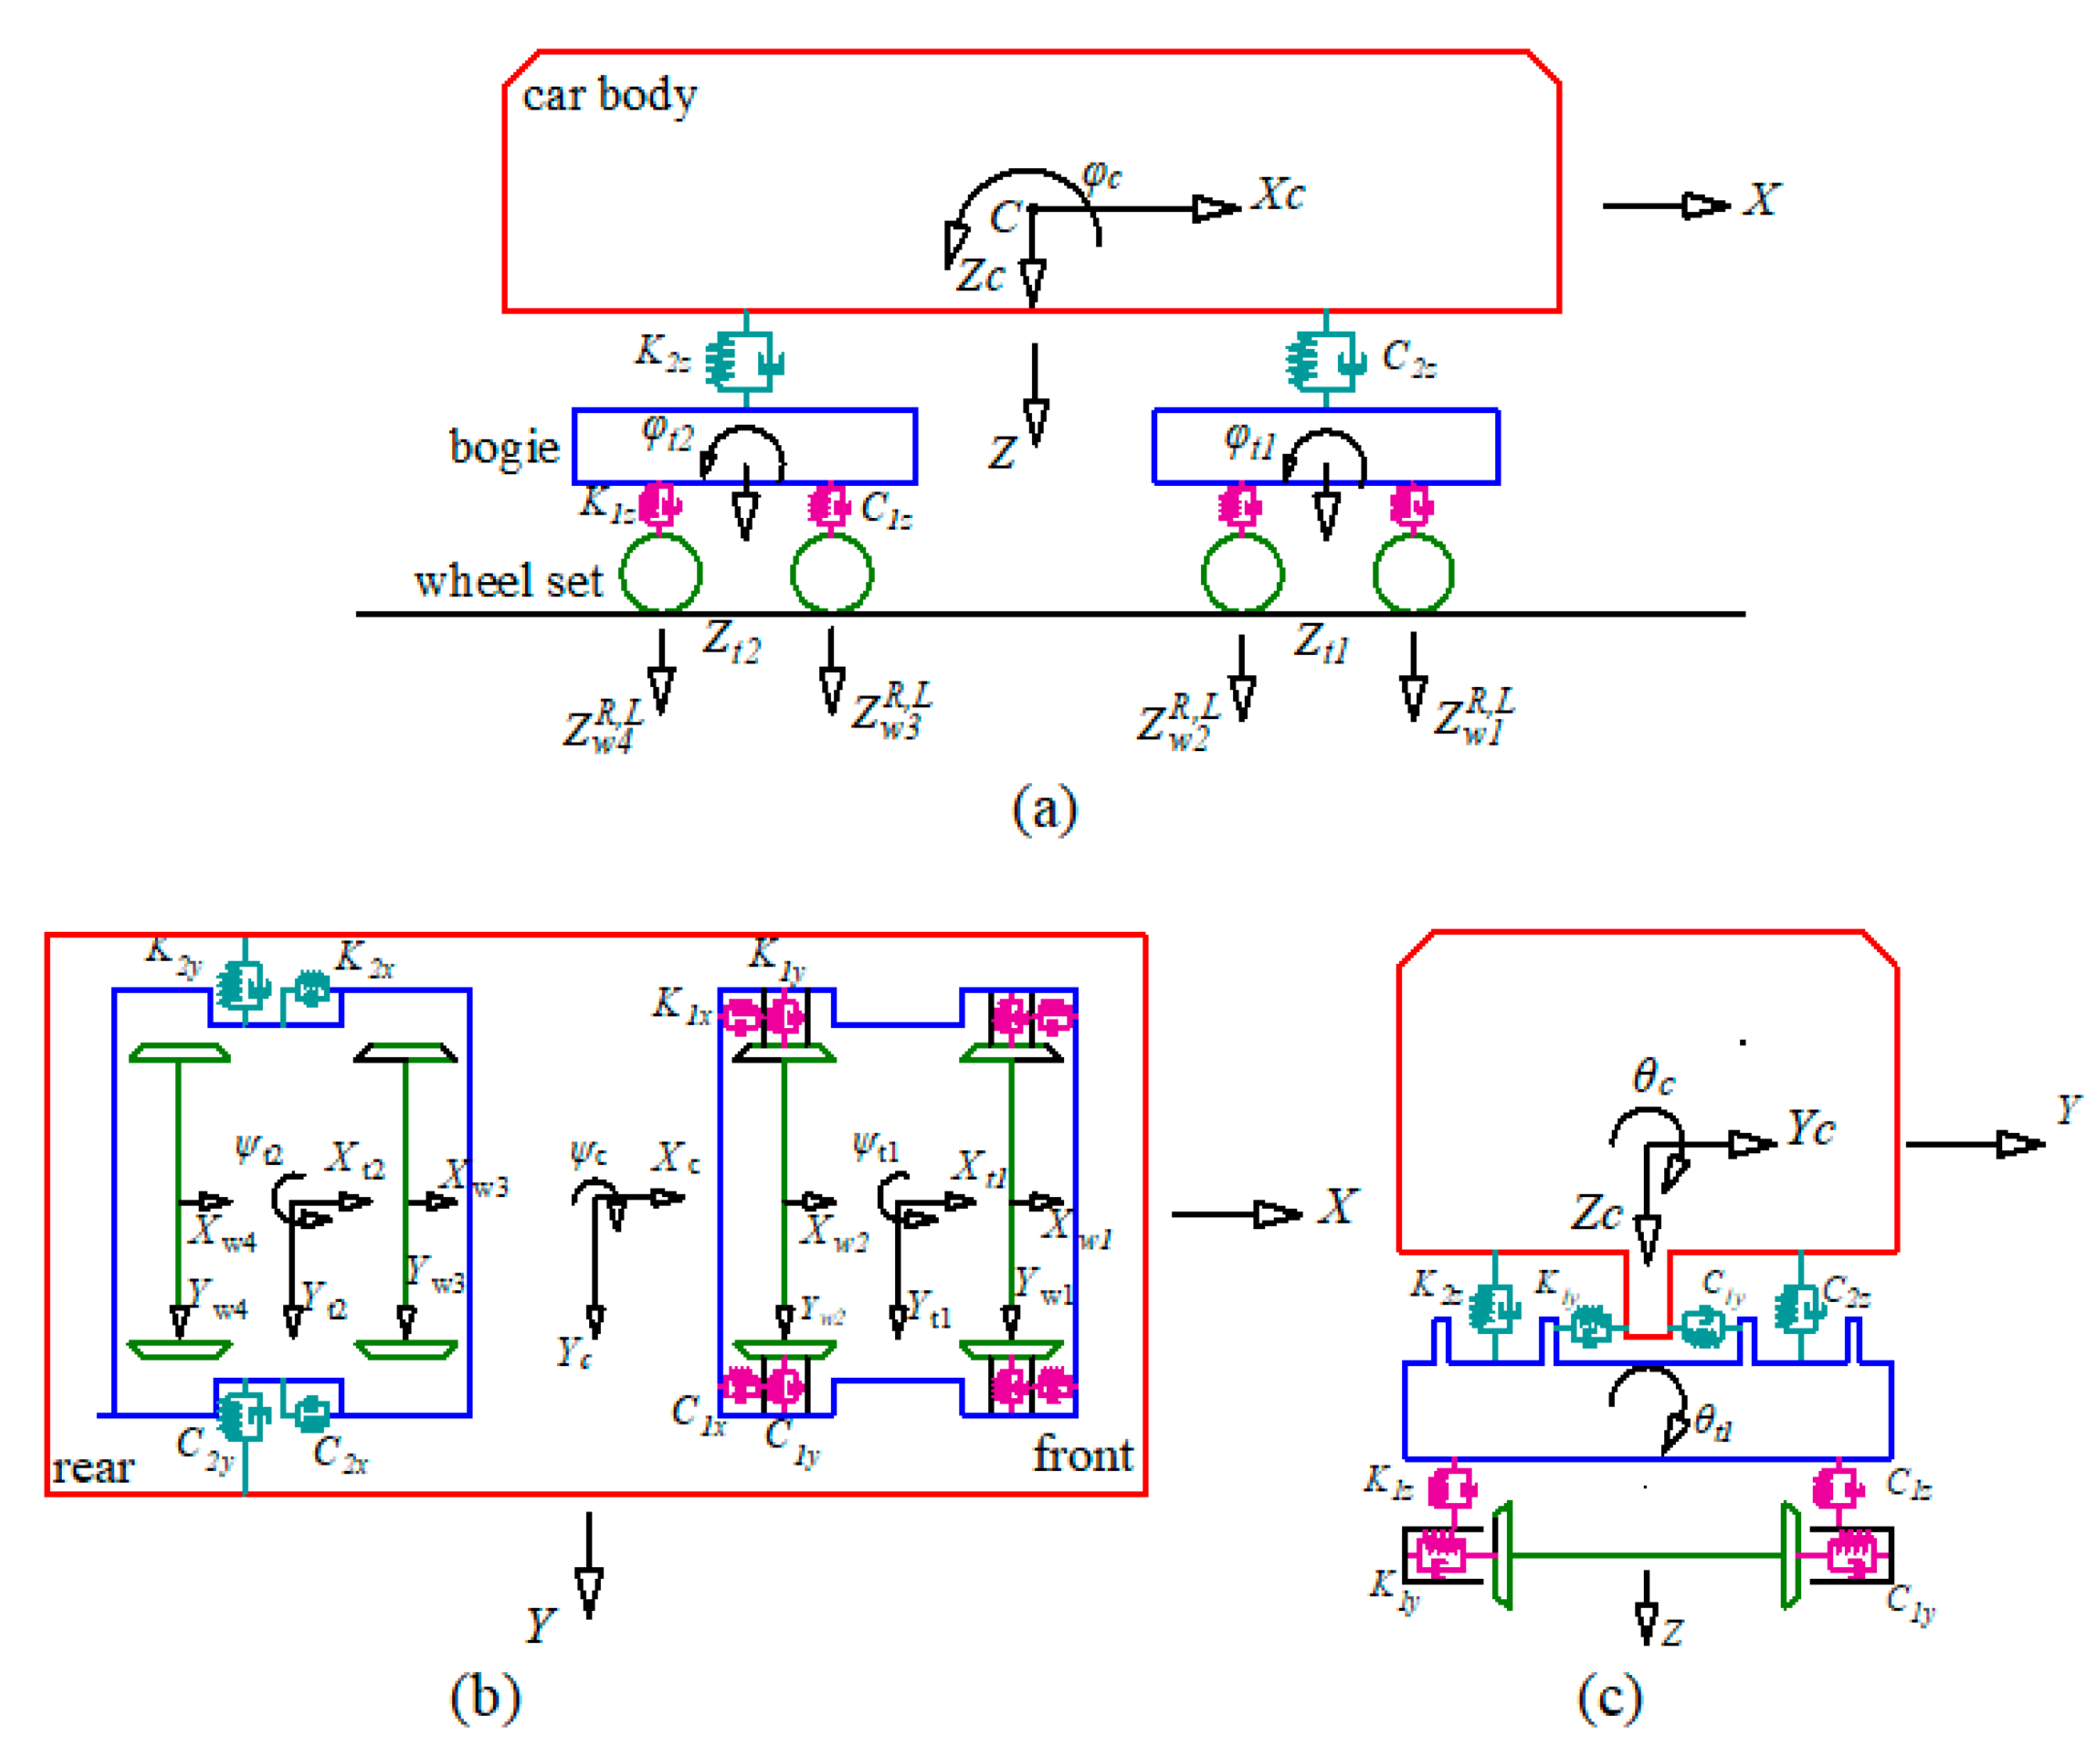
The freight train is divided into M + 1 units, and each unit includes 26 degrees of freedom. Each unit moves at a constant speed, and the car body and bogie have front and rear, left and right symmetry. A model of each unit is shown in Figure 1. In Figure 1, the linear springs and viscous dampers are used to simulate the suspension between bogie and wheelset and the suspension between car body and bogie. Among them, the coefficients of spring and damping between bogie and wheelset are K1x, K1y, K1z, C1x, C1y, and C1z, respectively. Meanwhile, the coefficients of spring and damping between car body and bogie are K2x, K2y, K2z, C2x, C2y, and C2z, respectively.
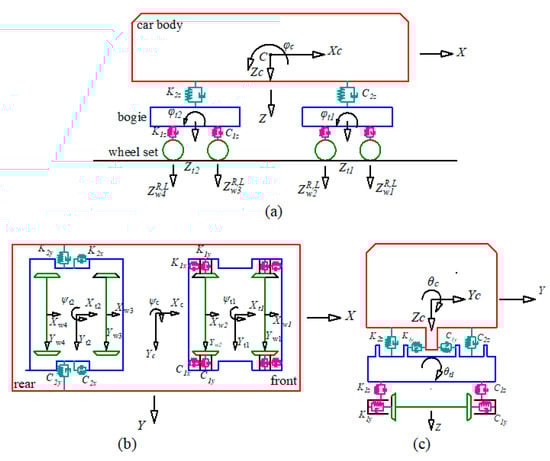
Figure 1.
Model of each unit: (a) Main view. (b) Side view. (c) Vertical view.
According to the above assumptions, the displacement mode of unit is shown in Equation (1).
In Equation (1), the subscripts are respectively the longitudinal, lateral, vertical, rolling, pitching, and yawing vibrations of car body. The subscripts are respectively the longitudinal, lateral, vertical, rolling, pitching, and yawing vibrations of the front bogie. The subscripts are respectively the longitudinal, lateral, vertical, rolling, pitching, and yawing vibrations of the rear bogie. The subscripts are respectively the lateral vibrations of each wheelset. The subscripts are respectively the vertical vibrations of the wheelset.
According to the Equation (1), the vibration potential energy (Πvi) of each unit can be derived [23]. The vibration potential energy ΠV of train can be obtained by adding the Πvi of each unit which is shown in Equation (2). The derivation process is shown in Reference [23].
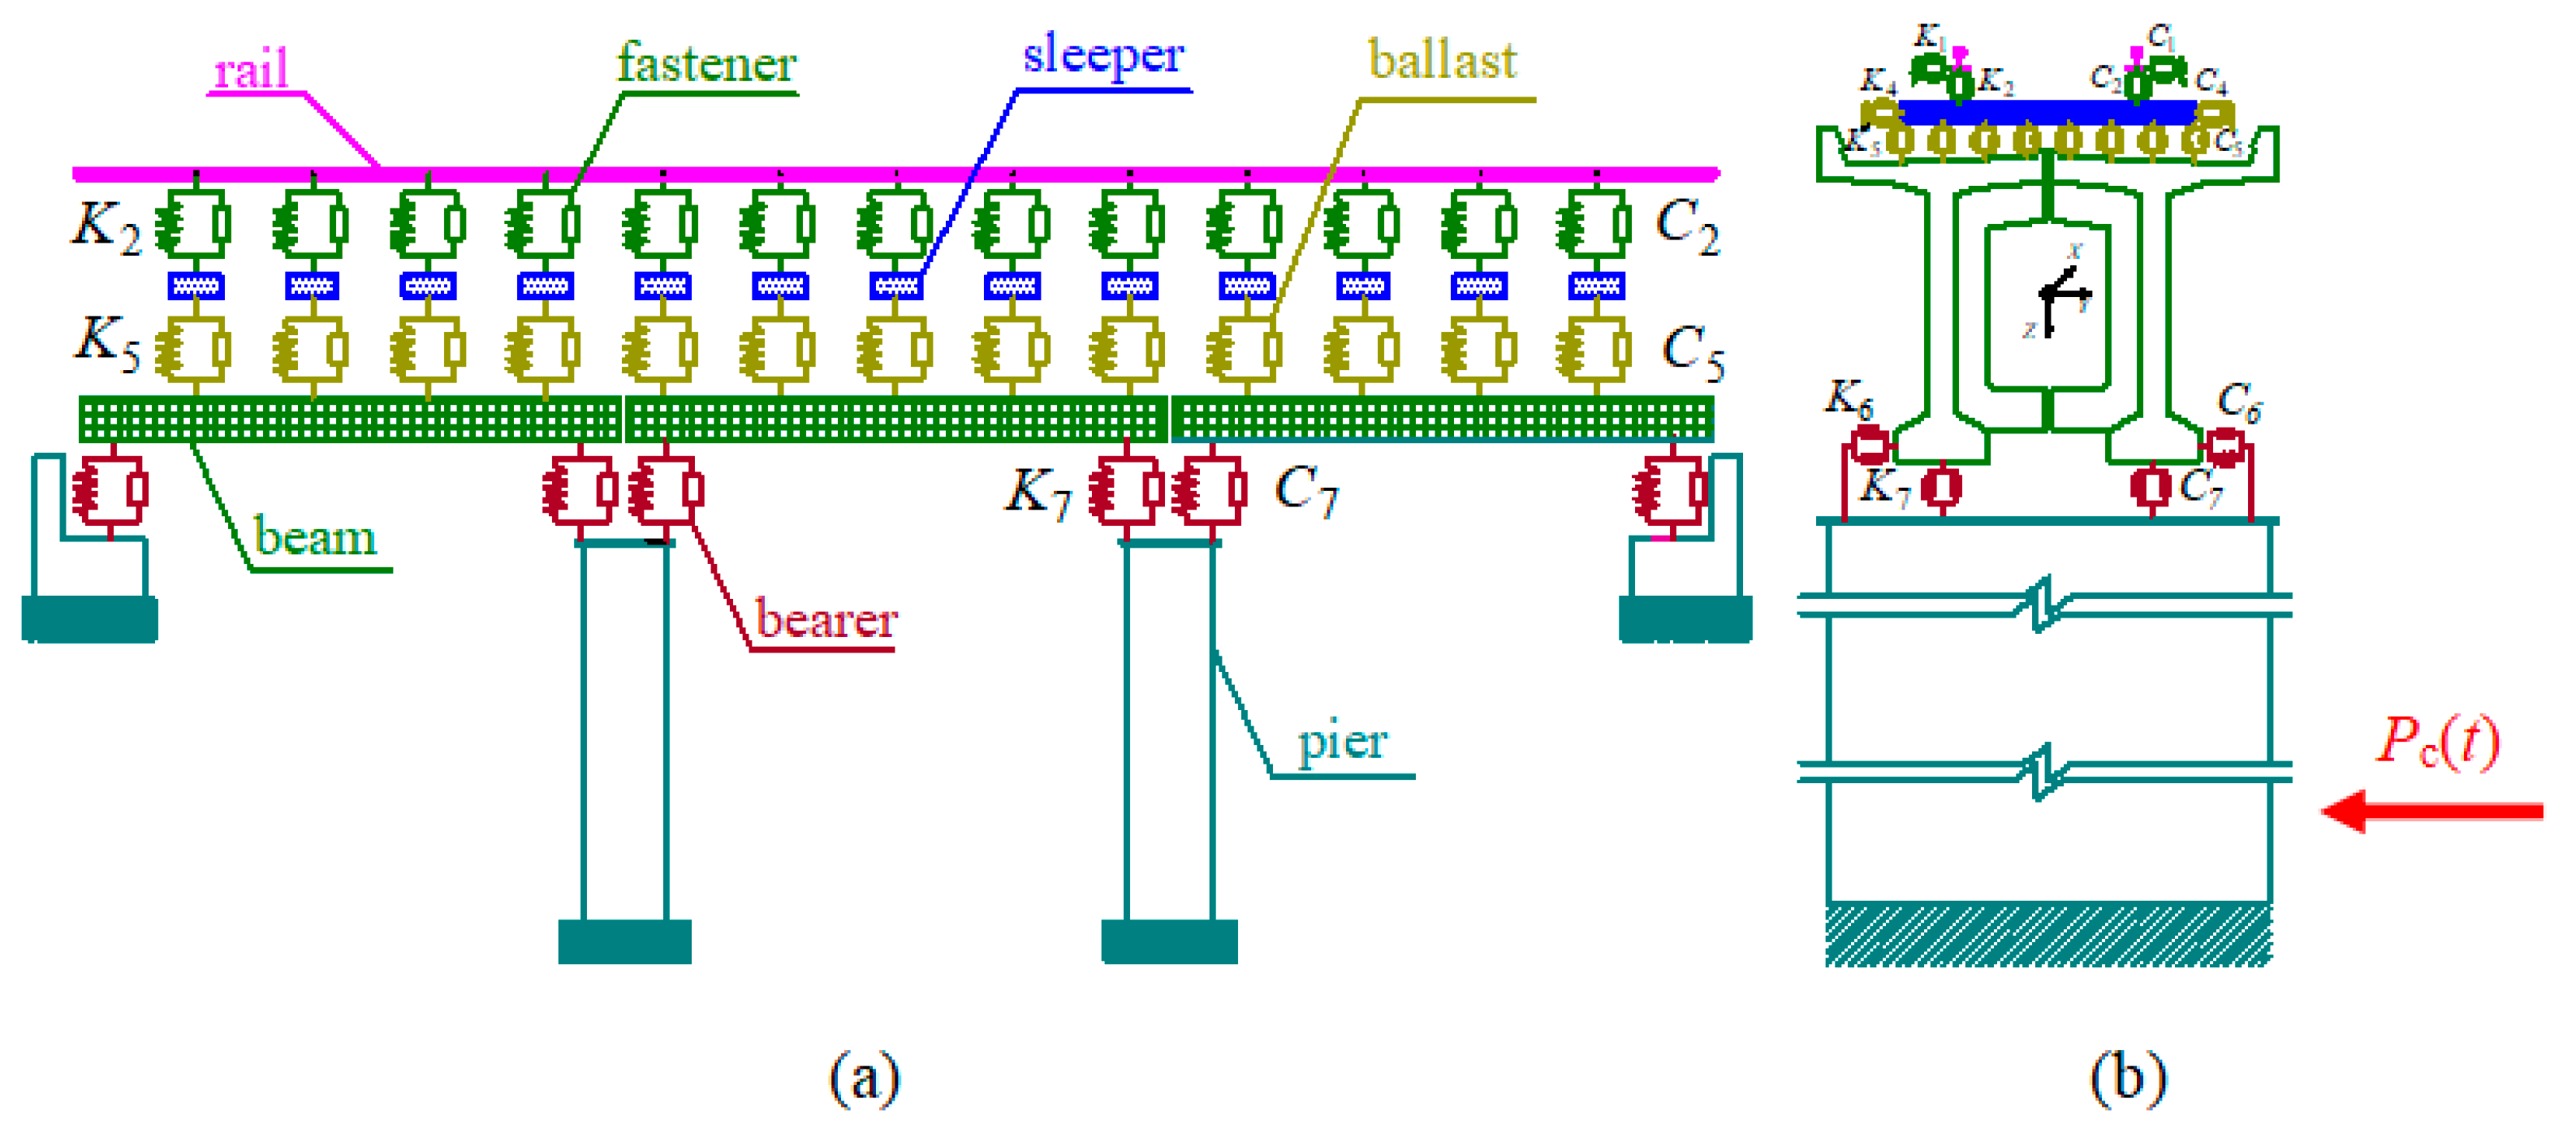
In addition, the typical simple-supported double-T girder bridge of a heavy haul railway is taken as an example. The beam element is used to simulate the rail, sleeper, and bridge beam. Meanwhile, the linear spring and viscous damper are used to simulate the fastener, ballast, and bearing. Among them, the coefficients of spring are K1, K2, K4, K5, K6, and K7, respectively, and the coefficients of damping are C1, C2, C4, C5, C6, and C7, respectively. The model of the track-bridge system is shown in Figure 2.
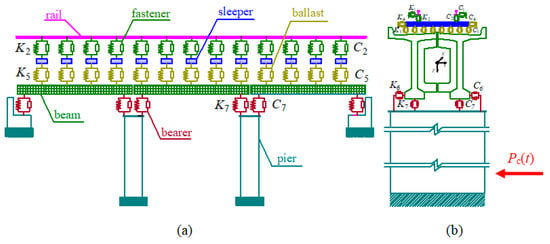
Figure 2.
Model of track-bridge system. (a) Main view. (b) Side view.
Furthermore, the beam of the bridge is divided into n elements with the adjacent diaphragm spacing. Each element included 50 degrees of freedom, as shown in Equation (3). The numbers 1 and 2 represent the left and right end nodes of the element, respectively.
In Equations (4) and (5), the U, V, W, θ, and γ are the longitudinal, transverse, and vertical linear displacement, angular displacement, and the change rate of the longitudinal torsional angle along the element, respectively; the subscripts R and L represent the right and left side of element respectively; the superscripts T, S and B are respectively the displacements of rail, sleeper and bridge girder. In addition, the subscripts U and D represent the upper and lower flanges of the bridge girder respectively, the subscripts X, Y and Z are the element direction which is longitudinal, transverse and vertical direction.
At the same time, the pier is divided into P elements according to the cross-sectional characteristics of the pier. The node displacement of the mode is shown in Equation (6).
In Equations (7) and (8), V, W, and θ are the transverse, vertical, and angular displacement of the element, respectively; the superscript D is the displacement of the pier.
According to the Equations (3) and (6), the vibration potential energy ΠTBj and ΠPk can be derived, respectively. The vibration potential energy of track-bridge system ΠTBP is obtained by superimposing each element, which is shown as Equation (9). The derivation process is shown in References [23,24].
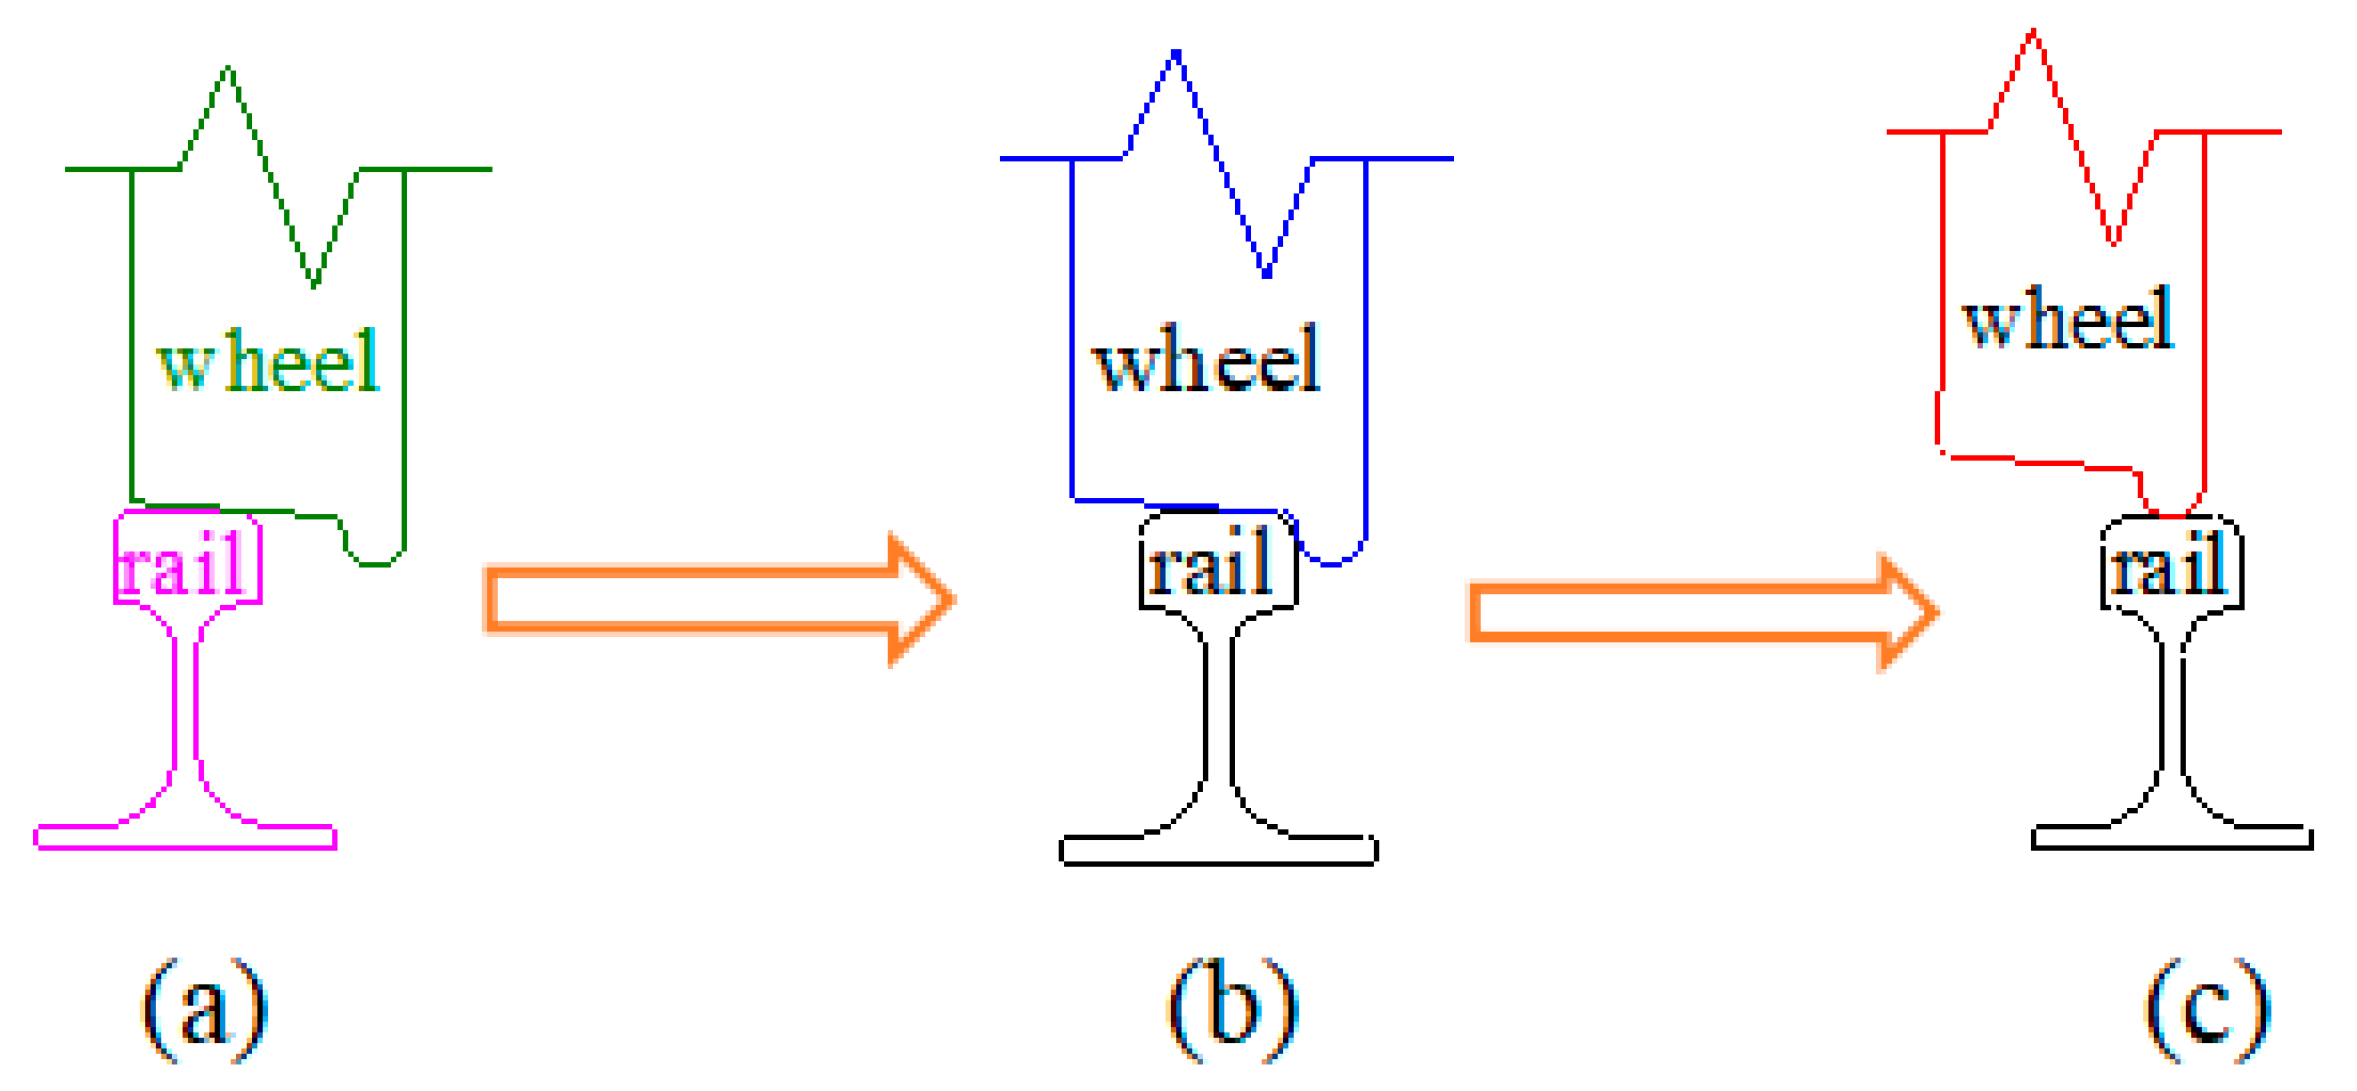
The wheel-rail connection condition is the link between the train and track-bridge system. In order to realize the whole process of train derailment, the relative motion state between wheel and rail should be considered in Figure 3. When the wheel is in a normal state (Figure 3a) and gradually closes to the rail head (Figure 3b) until it climbs up the top of the rail (Figure 3c), the wheel derailment occurs (as shown in Figure 3).
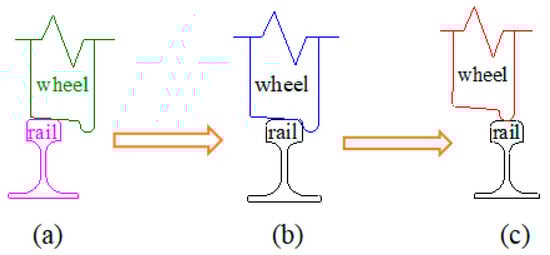
Figure 3.
Process of wheel climbing rail: (a) Wheel normal state. (b) Wheel attachment state. (c) Wheel climb up the top of rail.
According to the above motion state, the convergence condition of relative displacement between wheel and rail [18] is established as shown in Equations (10) and (11).
In Equations (10) and (11), , , and represent the lateral displacement of wheel, rail, and wheel-rail, respectively, where i denotes the number of wheelsets, i = 1~4; , , and represent the vertical displacement of wheel, rail, and wheel-rail respectively, where i denotes the number of wheelsets, i = 1~4; and are the lateral and vertical geometric irregularity of rail respectively. Meanwhile, the clearance between wheel flange and gauge line is considered in the FTTB system model.
Thus, the total potential energy of FTTB system can be derived as shown in Equation (12).
According to the principle of total potential energy with stationary value in elastic system dynamics [25], Equation (12) is changed and set to 0, as shown in Equation (13).
Using the “set in right position” rule [26] that forms the stiffness, damping and mass matrix of FTTB system which are represented by the K, C, and M, respectively. Meanwhile, the bogie frame hunting wave and track vertical geometric irregularity to the FTTB system are used to form the load array which is represented by the P. So, the FTTB system matrix equation at time t is shown in Equation (14).
In Equation (14), , , and are represent the displacement, velocity, and acceleration arrays. The results of Equation (14) is solved by the Wilson-θ step-by-step integration method, and the FORTRAN program of Equation (14) is established for calculation.
2.1.2. Simulation of Ship Impact
Ship impact has the characteristics of short time, large energy, and strong destruction. The ship impact load proposed by AASHTO code of the United States [12] and Code for Design of Railway Bridges of China [27] does not reflect the interaction between ship and pier, and it is difficult use for dynamic analysis. In addition, the European Union and British norms [28] propose that the ship impact on the pier is mainly characterized by nonlinear fluctuations. Chen et al. [20,21] simulated the process of ship collision and obtained a ship collision load with nonlinear wave characteristics. So, in order to calculate the dynamic response of a FTTB system under ship impact, the impact load curve from the Figure 4.4 of reference [20] is used as the external excitation input to the FTTB system.
Then, the FTTB system matrix equation under ship impact is established, as shown in Equation (15).
In Equation (15), the subscripts w and c represent the state of non-impact and impact. The implication of M, C, K is consistent with Equation (14). , , and represent the acceleration, velocity, and displacement vectors of freedom degrees at non-impact. , , and are the acceleration, velocity, and displacement vectors of freedom degrees at impact, while and are the load array of non-impact and impact, respectively.
2.2. Calculation Method of Train Derailment Process on Bridge under Ship Impact
The method of train derailment energy random analysis [24] shows that the wheel derailment is the process of the wheel flange climbing up the midpoint of the rail top from the normal driving state, and the process of wheel climbing caused by wheel lateral movement. The lateral movement of wheel is a kind of the lateral vibration response of FTTB system. Lateral vibration of the FTTB system is caused by many factors. Reference [24] proposed taking the measured or artificial bogie frame hunting wave as the excitation source of FTTB system lateral vibration, and taking it as input energy. Through the measurement and statistics of a large number of bogie frame hunting waves, the standard deviation σp of bogie frame hunting waves with 99% probability level at different vehicle speed V is obtained, and the σp-V curve is established. According to the σp at a certain speed, a bogie frame hunting wave is simulated by the Monte-Carlo method. Then, the bogie frame hunting wave is input into the FTTB system and the lateral vibration response of the FTTB system is calculated. However, σp is the input energy of normal train operation, which struggles to reflect the state of abnormal train operation (i.e., train derailment). However, according to the principle of function conversion, the greater input energy, the greater vibration response. Similarly, σpn must be greater than σp when the train derails. The σpn requires carrying out a large number of derailment tests to obtain. The damage caused by derailment tests discourages attempts, and this test is difficult to realize easily. Therefore, σpn cannot be obtained through measurement and statistics. With the help of theoretical simulation calculation, starting from the calculation process of the bar stability critical load, the trial algorithm is used to try to calculate the σpn of the train derailment under the ship impact, which realizes the calculation of the whole train derailment process. The calculation method is as follows.
Step 1: Taking the ship impact load as an external excitation on pier, the model of the FTTB system under ship impact is established.
Step 2: According to the curve of σp-V, the standard deviation σp of a certain speed is found. Moreover, a bogie frame hunting wave is simulated by the Monte-Carlo method which is adopted as the lateral vibration source of the FTTB system, and track irregularity is taken as the vertical vibration source.
Step 3: The spatial vibration response under ship impact is calculated. Each time step is calculated to determine whether the value of wheel lift meets the wheel derailment geometric criterion, 25 mm. If it is reached, the calculation is stopped and the whole process of train derailment is completed. The vibration response obtained reflects the whole process of train derailment. If not, the response of the next time step is calculated until the end of the calculation.
Step 4: If the train is not derailed at the end of the calculation, the ship impact load or speed is increased. Step 1–3 are repeated until the whole process of train derailment is completed.
So far, the calculation method of the train derailment process on bridge under ship impact has been expounded. According to the above method, the train derailment process is calculated, and the wheel-rail contact state and relative position at the moment of wheel derailment are analyzed. The corresponding vibration response reflecting wheel derailment information can be obtained. At the same time, it is difficult to install the early warning device on the wheel considering the space at the bottom of the vehicle and the fact that the wheel is the running part of the train. Thus, the vibration response of the bogie closest to the wheel is used to describe the wheel-rail contact state and its relative position. So, ΔYtr/1.25 is calculated, where 1.25 [29] is the safety factor when Japanese scholars use the derailment coefficient to calculate train safety. The threshold with the derailment warning function is obtained through calculation, which can provide basic data for a wheel derailment warning device installed on bogies.
3. Results
3.1. Calculation of Train Derailment Process under Ship Impact
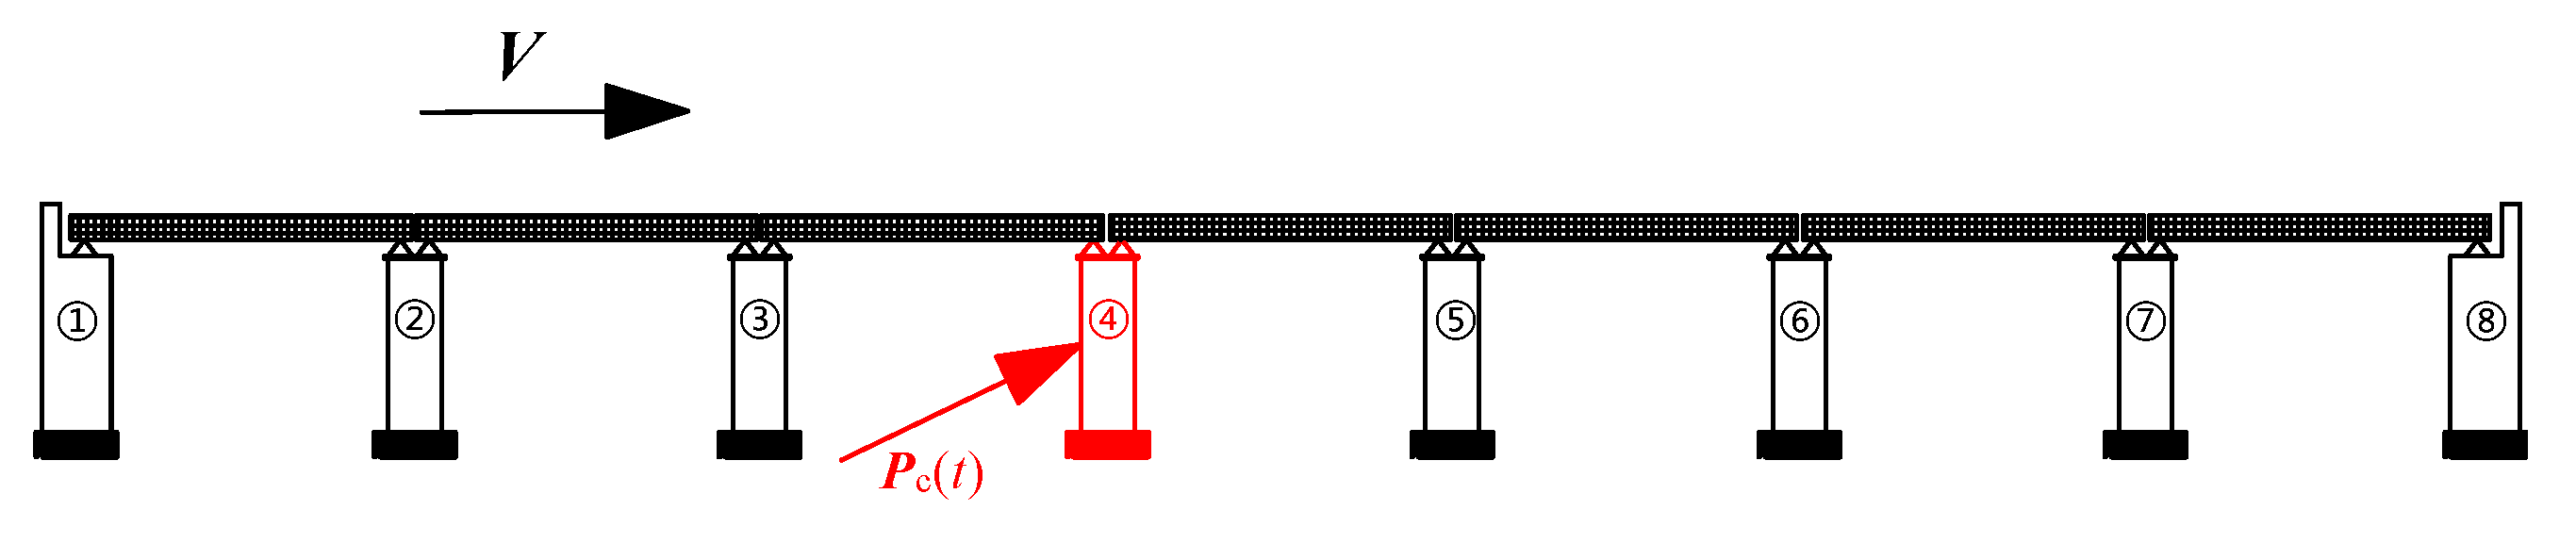
In view of the derailment accident and calculation results, empty wagons are more likely to derail [24]. the formation of a train is set to be one locomotive and 16 empty wagons, and the speed is 60 km/h. For a heavy haul railway, the 32 m concrete simple supported beam bridge is taken as the object. The bridge type is the reference bridge 2019, the pier height is 10 m, and the pier cross section is round with a diameter of 2.4 m. In addition, the track structure on the bridge is a ballasted track which consists of 60 kg/m rail, type II concrete sleeper, and crushed stone ballast. The time history curve of impact load was adopted from Reference [20], which was normalized according to the impact peak Pc, max as 0, 5, 10, 15, and 20 MN, respectively, and then input into the FTTB system. In order to simulate the most unfavorable driving condition on the bridge under the ship impact, the train starts driving on the bridge for 10 s when the bridge is full of vehicles. The impact load is applied on pier 4 in the X direction perpendicular to the bridge (In Figure 4), and the impact position is 5 m away from the bottom of the pier.
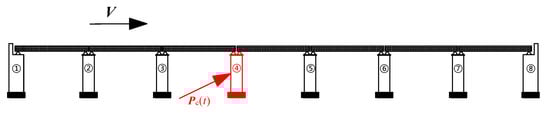
Figure 4.
Diagram of ship impact on pier 4.
The process of train derailment under ship impact is calculated and the vibration responses of the FTTB system is obtained. In order to analyse the response of the FTTB system, some representative indicators are listed. This included ΔZ, Q/P, ΔP/P, Bh, Dh, and ΔYtr, which represent the wheel lift value, derailment coefficient, wheel reduction rate, lateral displacement of beam and pier, and lateral displacement between bogie and rail. The time history curves of the above indicators are shown in Figure 5, Figure 6, Figure 7, Figure 8, Figure 9 and Figure 10. The “0 line” in the diagram represents the centerline of model.
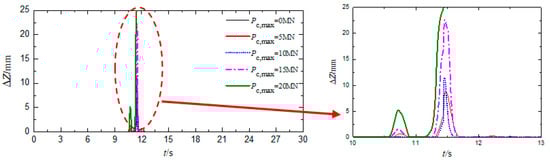
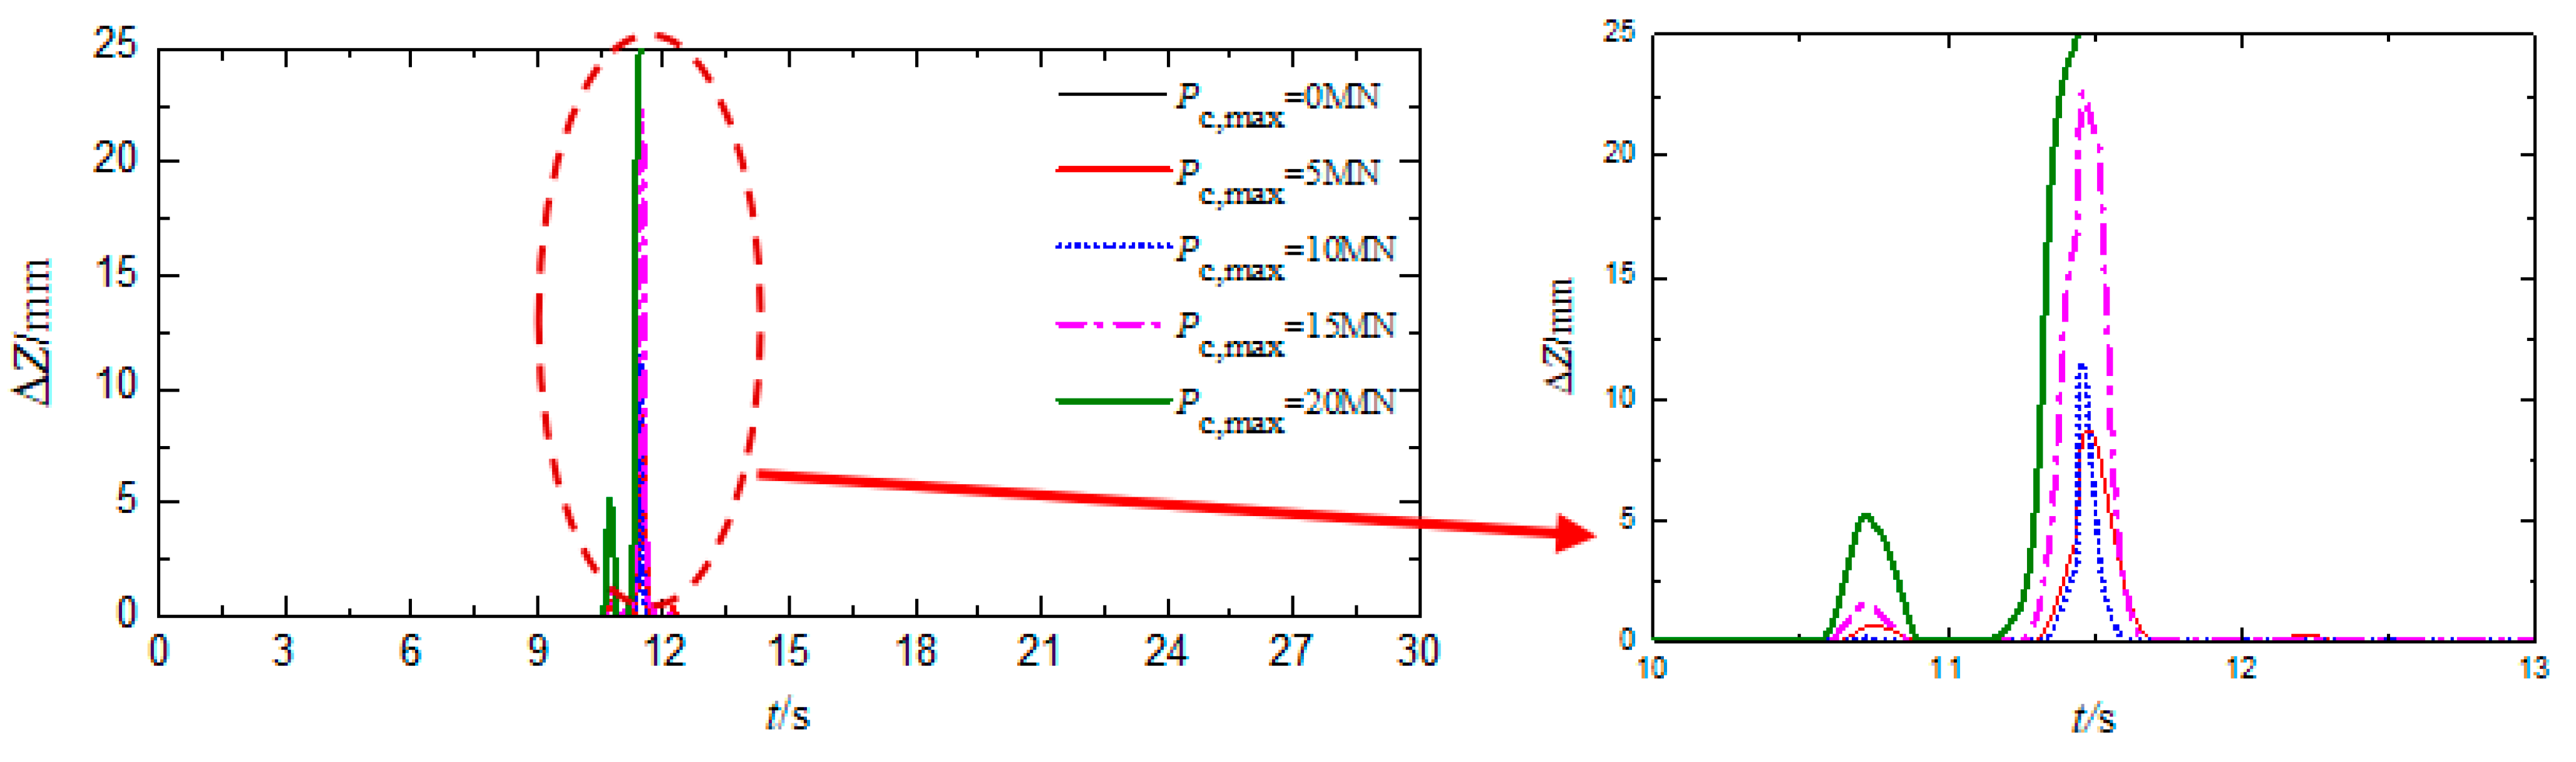
Figure 5.
Left wheel lift value time history curve of 1st axletree of 7th wagon under different ship impact load.
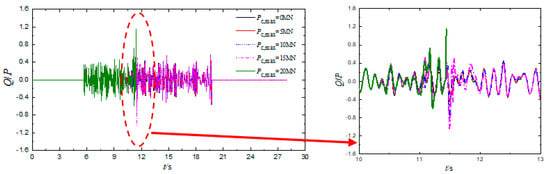
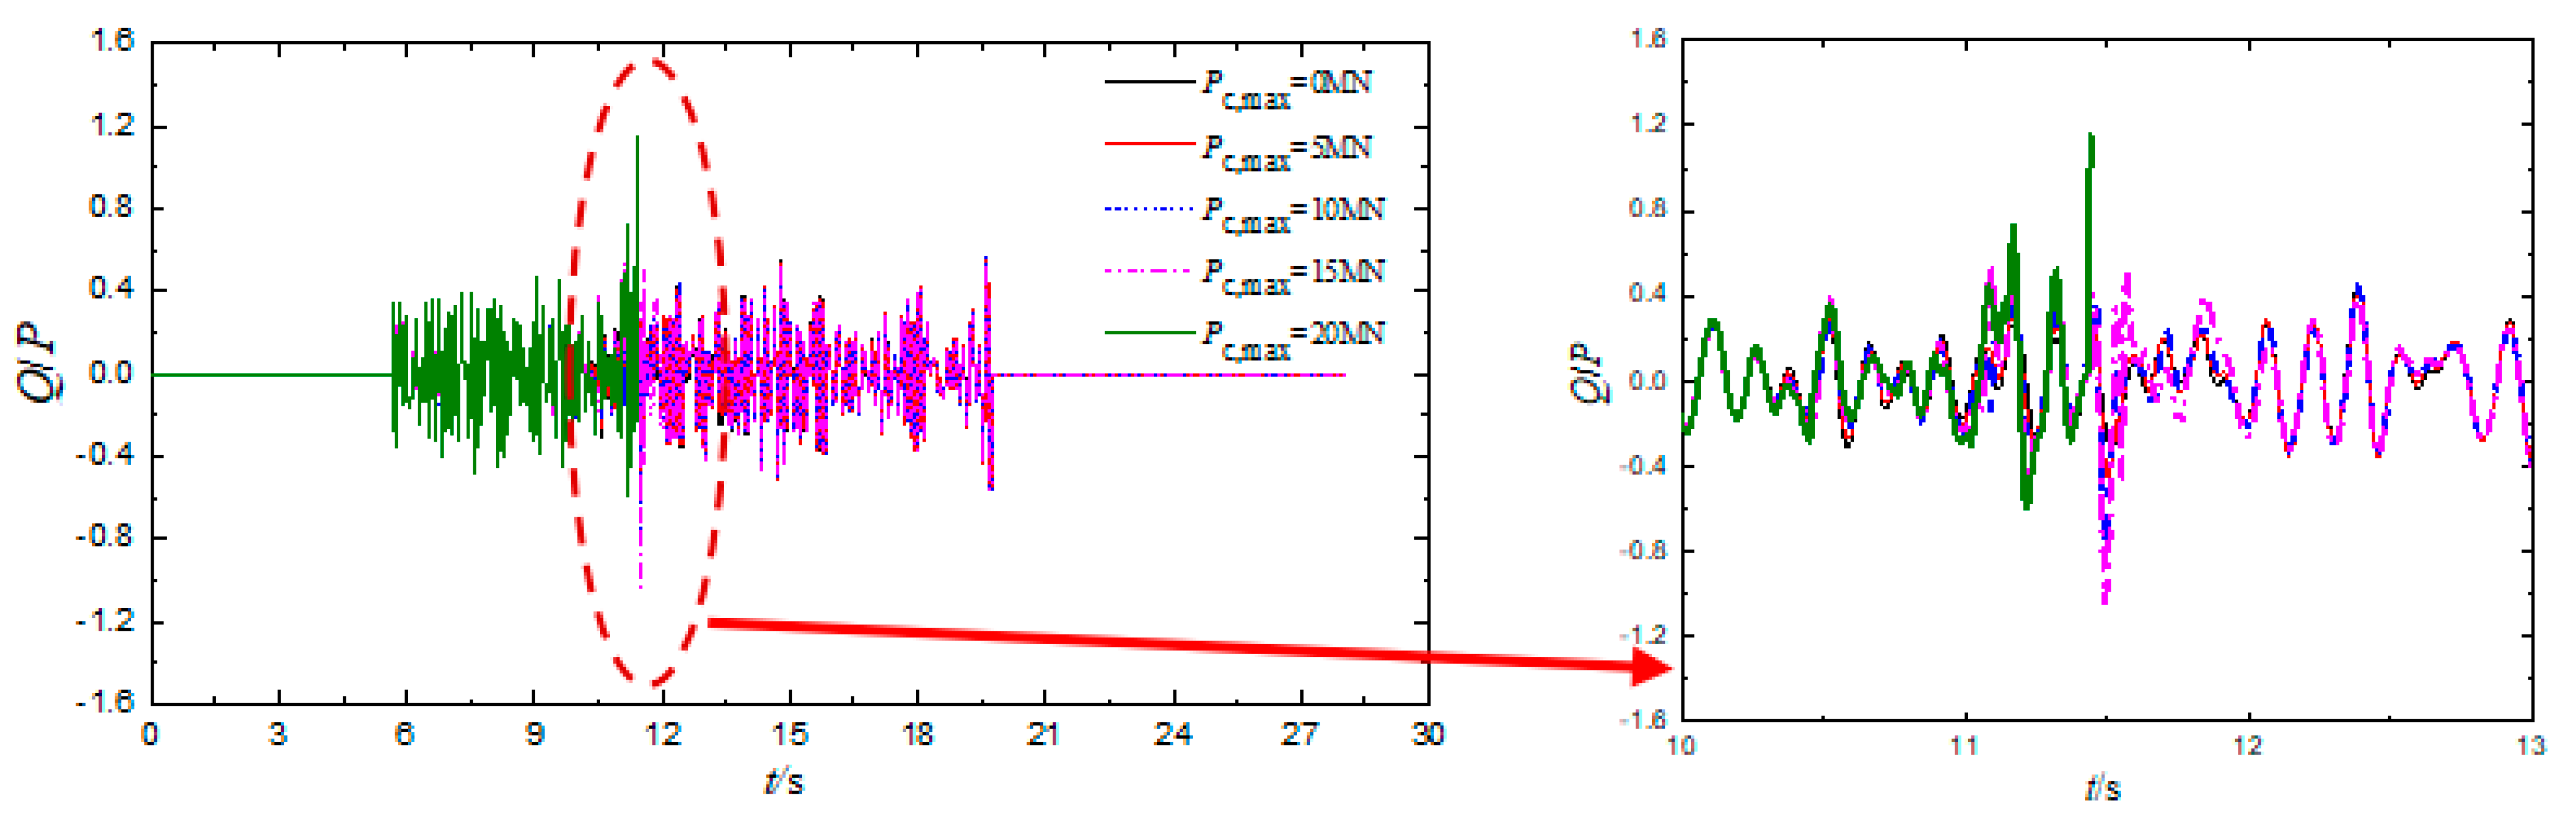
Figure 6.
Derailment coefficient time history curve of 1st axletree of 7th wagon under different ship impact load.

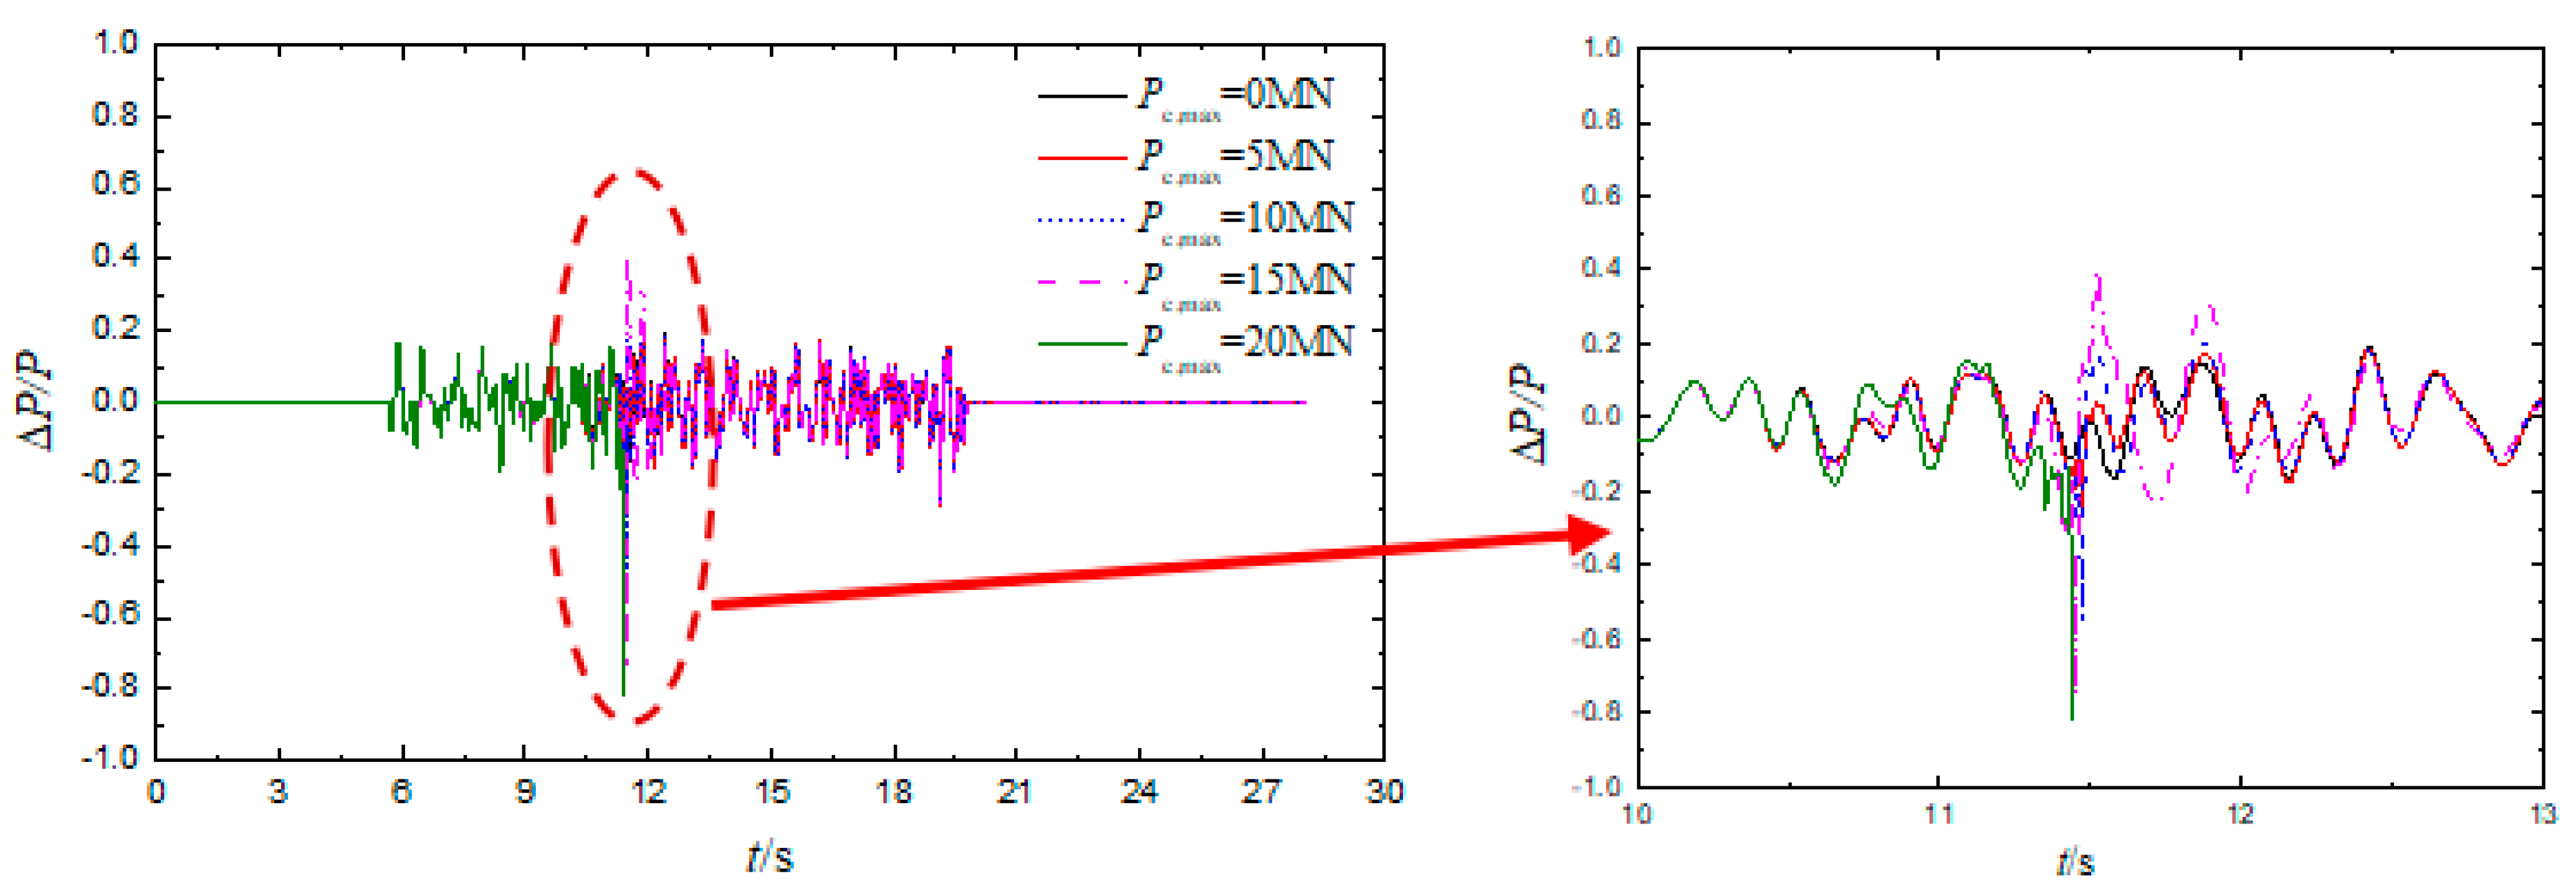
Figure 7.
Wheel reduction rate time history curve of 1st axletree of 7th wagon under different ship impact load.
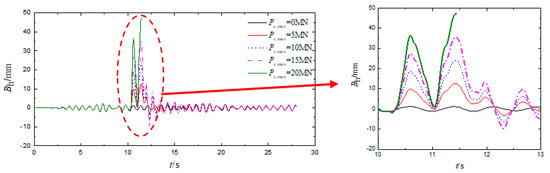
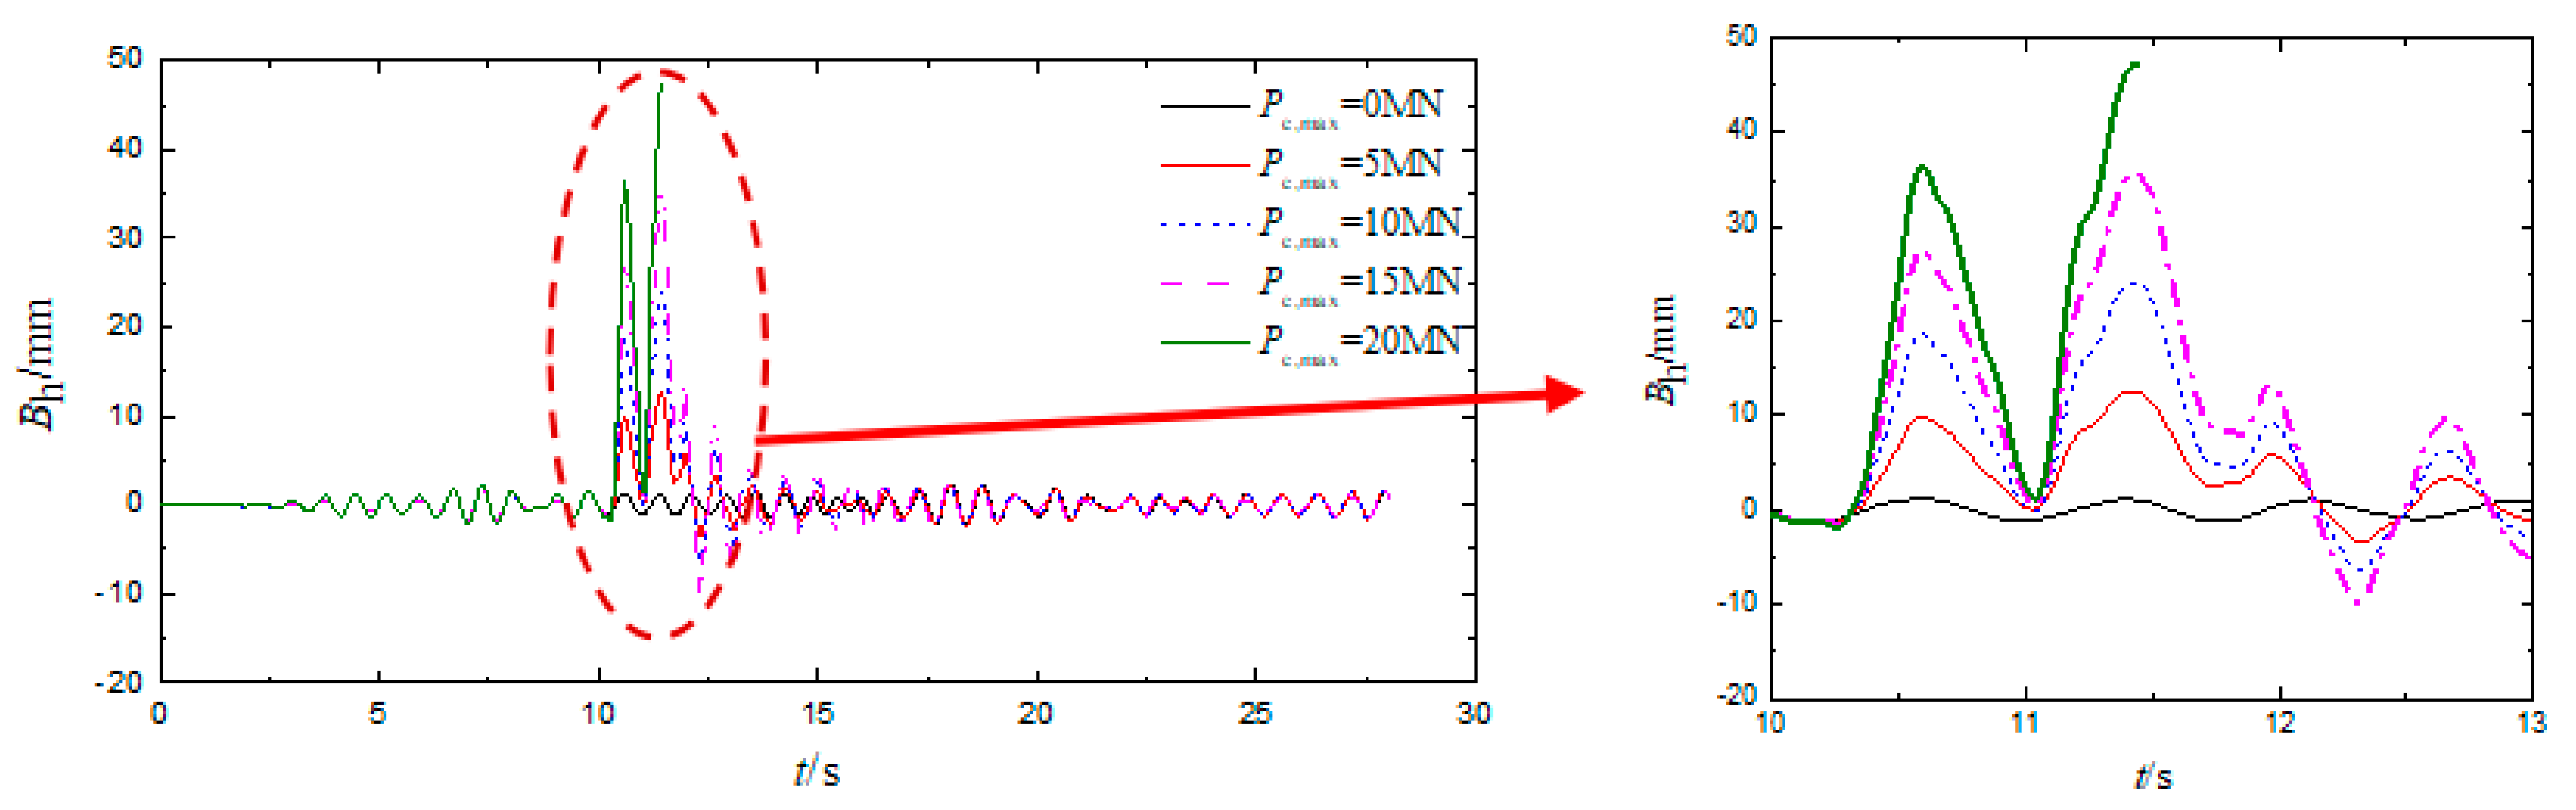
Figure 8.
Transverse displacement time history curve of midspan of the 3rd span under different ship impact load.
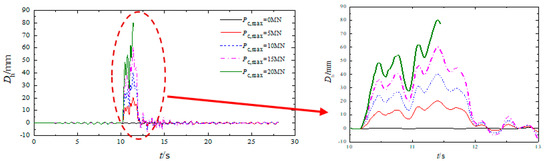
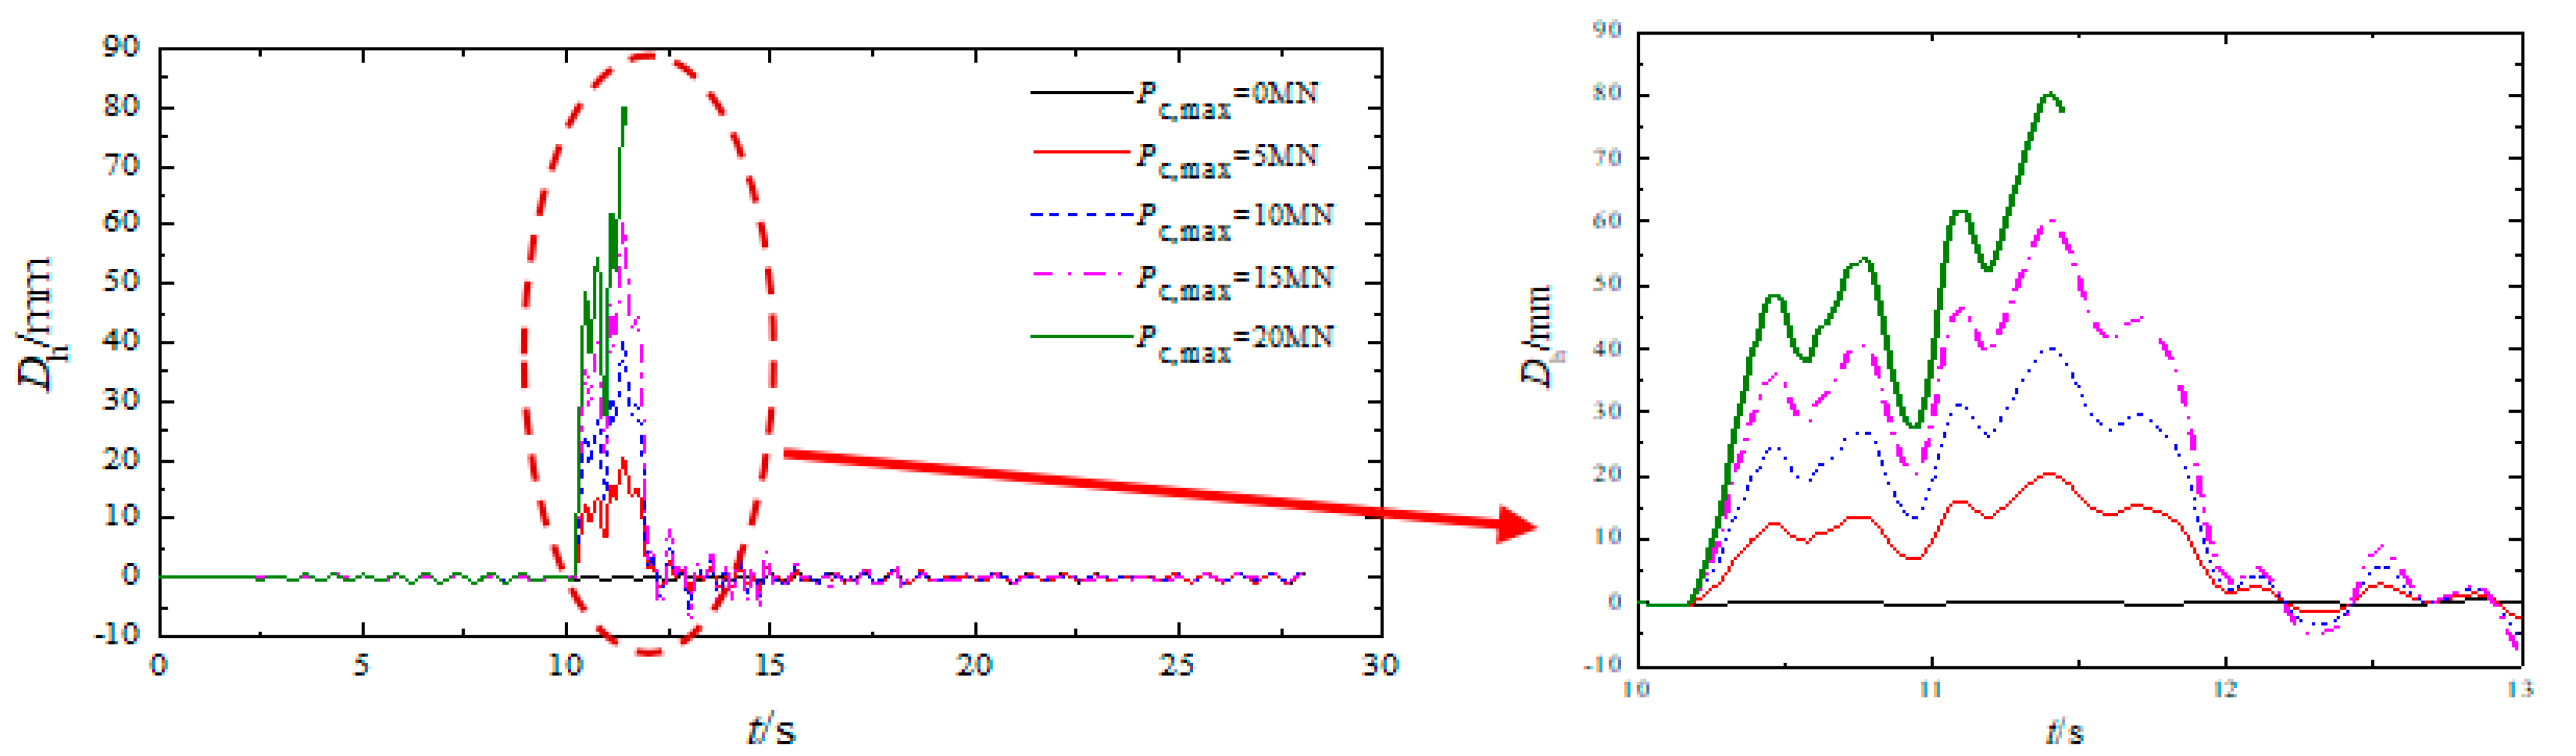
Figure 9.
Transverse displacement time history curve of top of the 4th pier under different ship impact load.
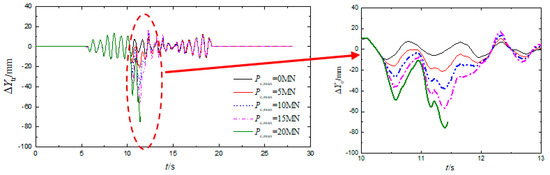
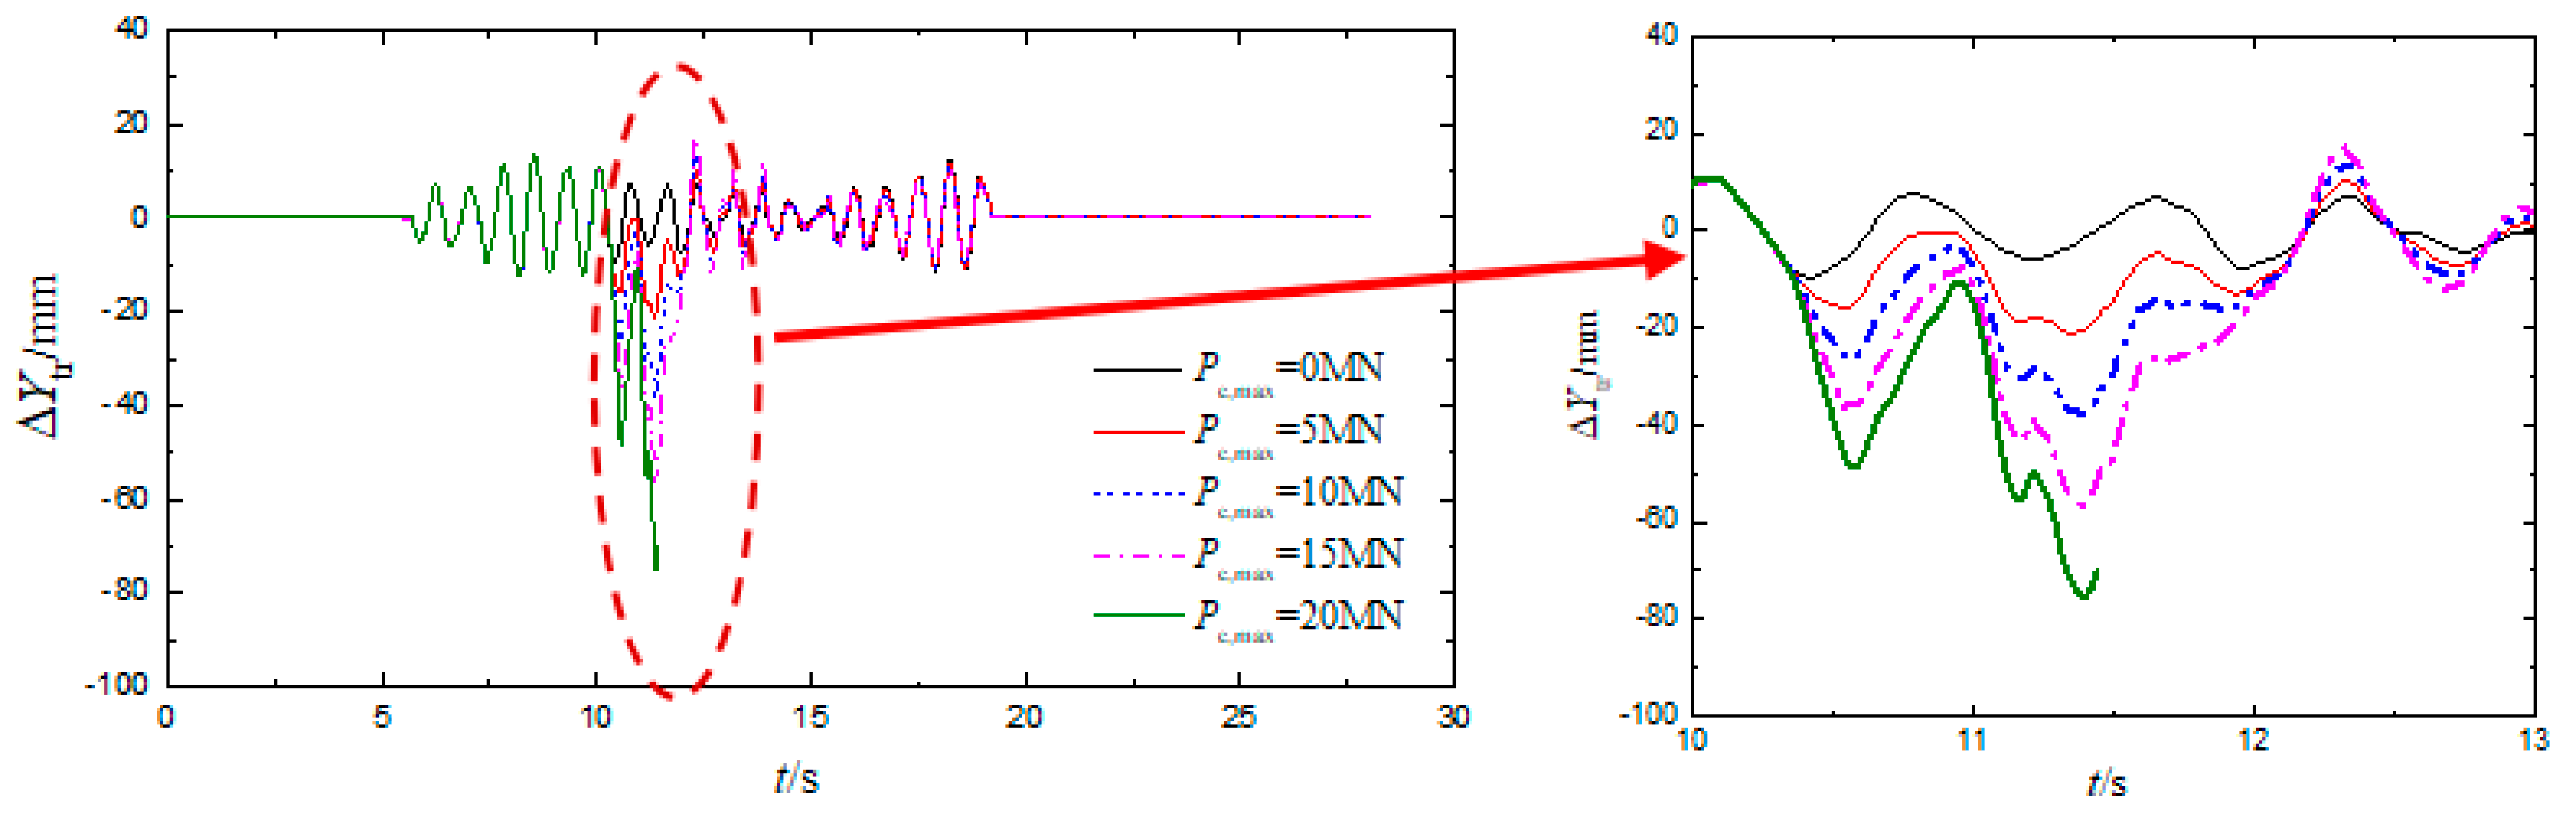
Figure 10.
Lateral displacement between front bogie and rail time history of 7th wagon under different ship impact load.
Figure 5 reflects the left wheel lift value time history curve of the 1st axletree of the 7th wagon under different ship impact load. In Figure 5, the wheel does not suspend before the ship impact. When the train runs to the 10th s, the ship begins to hit the pier, and ΔZ increases significantly. The maximum value of ΔZ increases with Pc, max. The maximum values of ΔZ are 8.7, 11.5, 22.6, and 25.0 mm, respectively, when Pc, max is 5, 10, 15, and 20 MN. Among them, when Pc, max is 15 MN, the maximum value of ΔZ is close to the wheel derailment geometric criterion limit, 25 mm [24]. When Pc, max is 20 MN, the maximum value of ΔZ is equal to 25 mm, which reaches the limit value of the wheel derailment geometric criterion [24]. At this time, the wheel is derailed. Then, it can be seen that the train wheel is more prone to derailment when Pc, max is greater than or equal to 15 MN. It is necessary to control train derailment in time before the peak value of impact load is reached.
In addition, the maximum value of ΔZ increases with Pc, max. The maximum values of ΔZ are 8.7, 11.5, 22.6, and 25.0 mm, respectively, when Pc, max is 5, 10, 15, and 20 MN. Among them, when Pc, max is 15 MN, the maximum value of ΔZ is close to the wheel derailment geometric criterion limit, 25 mm [24]. When Pc, max is 20 MN, the maximum value of ΔZ is equal to 25 mm, which reaches the limit value of the wheel derailment geometric criterion [24]. At this time, the wheel is derailed. Then, it can be seen that the train wheel is more prone to derailment when Pc, max is greater than or equal to 15 MN.
Figure 6 reflects the derailment coefficient time history curve of the 1st axletree of the 7th wagon under different ship impact load. In Figure 6, the Q/P changes gently before ship impact, and the maximum value of Q/P is 0.32. When the train runs to 10th s, the ship begins to hit the pier, Q/P increases with the increase of Pc, max. Among them, the maximum values of Q/P are 0.45, 0.77, 1.03, and 1.15, respectively, when Pc, max are 5, 10, 15, and 20 MN. When Pc, max is 15MN, the maximum value of Q/P exceeds the specification limit 1.0 [30], but the train does not derail. When Pc, max is 20 MN, the maximum value of Q/P is equal to 1.15 which also exceeds the specification limit 1.0 [30], but the train derails. Then, the derailment coefficient increases, induced by ship impact, affecting running safety. However, the derailment coefficient limit cannot determine the train wheel derailment.
Figure 7 reflects the wheel reduction rate time history curve of the 1st axletree of the 7th wagon under different ship impact load. In Figure 7, the ΔP/P changes gently before ship impact, and the maximum value of ΔP/P is 0.15. When the train runs to 10th s, the ship begins to hit the pier, and ΔP/P increases with the increase of Pc, max. Among them, the maximum value of ΔP/P were 0.27, 0.55, 0.75, and 0.81, respectively, when Pc, max were 5, 10, 15, and 20 MN. When Pc, max is equal to 15 MN, the maximum value of ΔP/P exceeds the specification limit 0.65 [30], but the train does not derail. When Pc, max is equal to 20 MN, the maximum value of ΔP/P is is equal to 0.85 which also exceeds the specification limit 1.0 [30], but the train derails. From above analysis, the derailment coefficient increases significantly, induced by ship impact, but the wheel reduction rate limit cannot determine the train wheel derailment. In addition, Xiao et al. [31] also proposed that the derailment coefficient and wheel load reduction rate limit are conservative when assessing the influence of a complex environment on the wheel derailment of high-speed trains.
Figure 8 and Figure 9 reflect the transverse displacement time history curve of the midspan of 3rd span and top of 4th pier under different ship impact load. In Figure 8, the Bh changes gently before ship impact, and the maximum value of Bh is 1.1 mm. When the train runs to 10th s, the ship begins to hit the pier, Bh increases with the increase of Pc, max. Among them, the maximum values of Bh are 12.4, 24.2, 35.7, and 47.3 mm, respectively, when Pc, max are 5, 10, 15, and 20 MN. Besides, in Figure 9, the Dh changes gently before ship impact, and the maximum value of Dh is 0.2 mm. When the ship begins to hit the pier, Dh increases significantly with the increase of Pc, max. Among them, the maximum values of Dh are 19.5, 38.7, 58.1, and 77.5 mm respectively when Pc, max are 5, 10, 15, and 20 MN.
According to the specification [32], the limit values of lateral displacement of the mid-span beam and the lateral displacement of the pier top are 3.56 and 0.44 mm, respectively. The maximum values of Bh and Dh meet the limit requirements before ship impact. When Pc, max is 5, 10, and 15 MN, the maximum value of Bh and Dh exceeds the specification limit [32]. However, there is no wheel derailment. So, it can be seen that the transverse displacement of the beam span and the pier top increase significantly after the ship impacts the pier, but it does not affect the running safety when it exceeds the limit value. The mapping relationship between existing limits and train wheel derailment remains to be further studied.
Figure 10 reflects the lateral displacement between front bogie and rail time history of the 7th wagon under different ship impact load. In Figure 10, the ΔYtr changes gently before ship impact, and the maximum value of ΔYtr is 8.7 mm. When the train runs to 10th s, the ship begins to hit the pier, ΔYtr increases with increase of Pc, max and the wheel has a large displacement towards the line side. Among them, the maximum values of ΔYtr are 20.2, 37.7, 56.5, and 75.1 mm, respectively, when Pc, max are 5, 10, 15, and 20 MN. When Pc, max is 20 MN, the maximum value of ΔYtr is 75.1 mm. This value is the vibration response of train derailment and reflects the relative position of wheel and rail. In order to predict wheel derailment in advance, ΔYtr/1.25 is calculated as 60.1 mm, which can be used as a warning threshold of train wheel derailment.
3.2. Influence of Impact Load on the Train Derailment Process
In order to analyze the train derailment process at different ship loads and speeds, the V is from 60 to 80 km/h, and the train formation, track and bridge structure, impact load, and action time are consistent with Section 3.1. The vibration responses reflecting the whole process of train derailment are obtained. The ΔZ, Q/P, ΔP/P, Bh, Dh, ΔYtr, and ΔYtr/1.25 are listed in Table 1, and their changes with V and Pc, max are shown in Figure 11, Figure 12, Figure 13, Figure 14, Figure 15 and Figure 16. The red dotted line in the figure represents the specification limits of different indicators.

Table 1.
Calculation results.
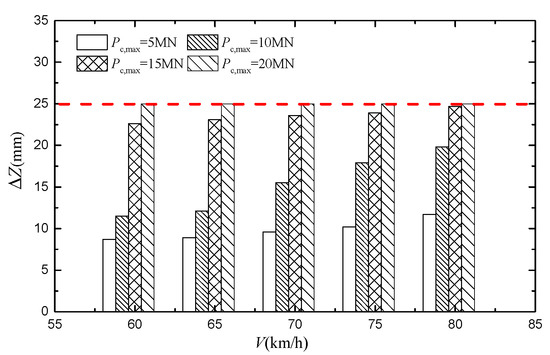
Figure 11.
ΔZ changes with V and Pc, max.

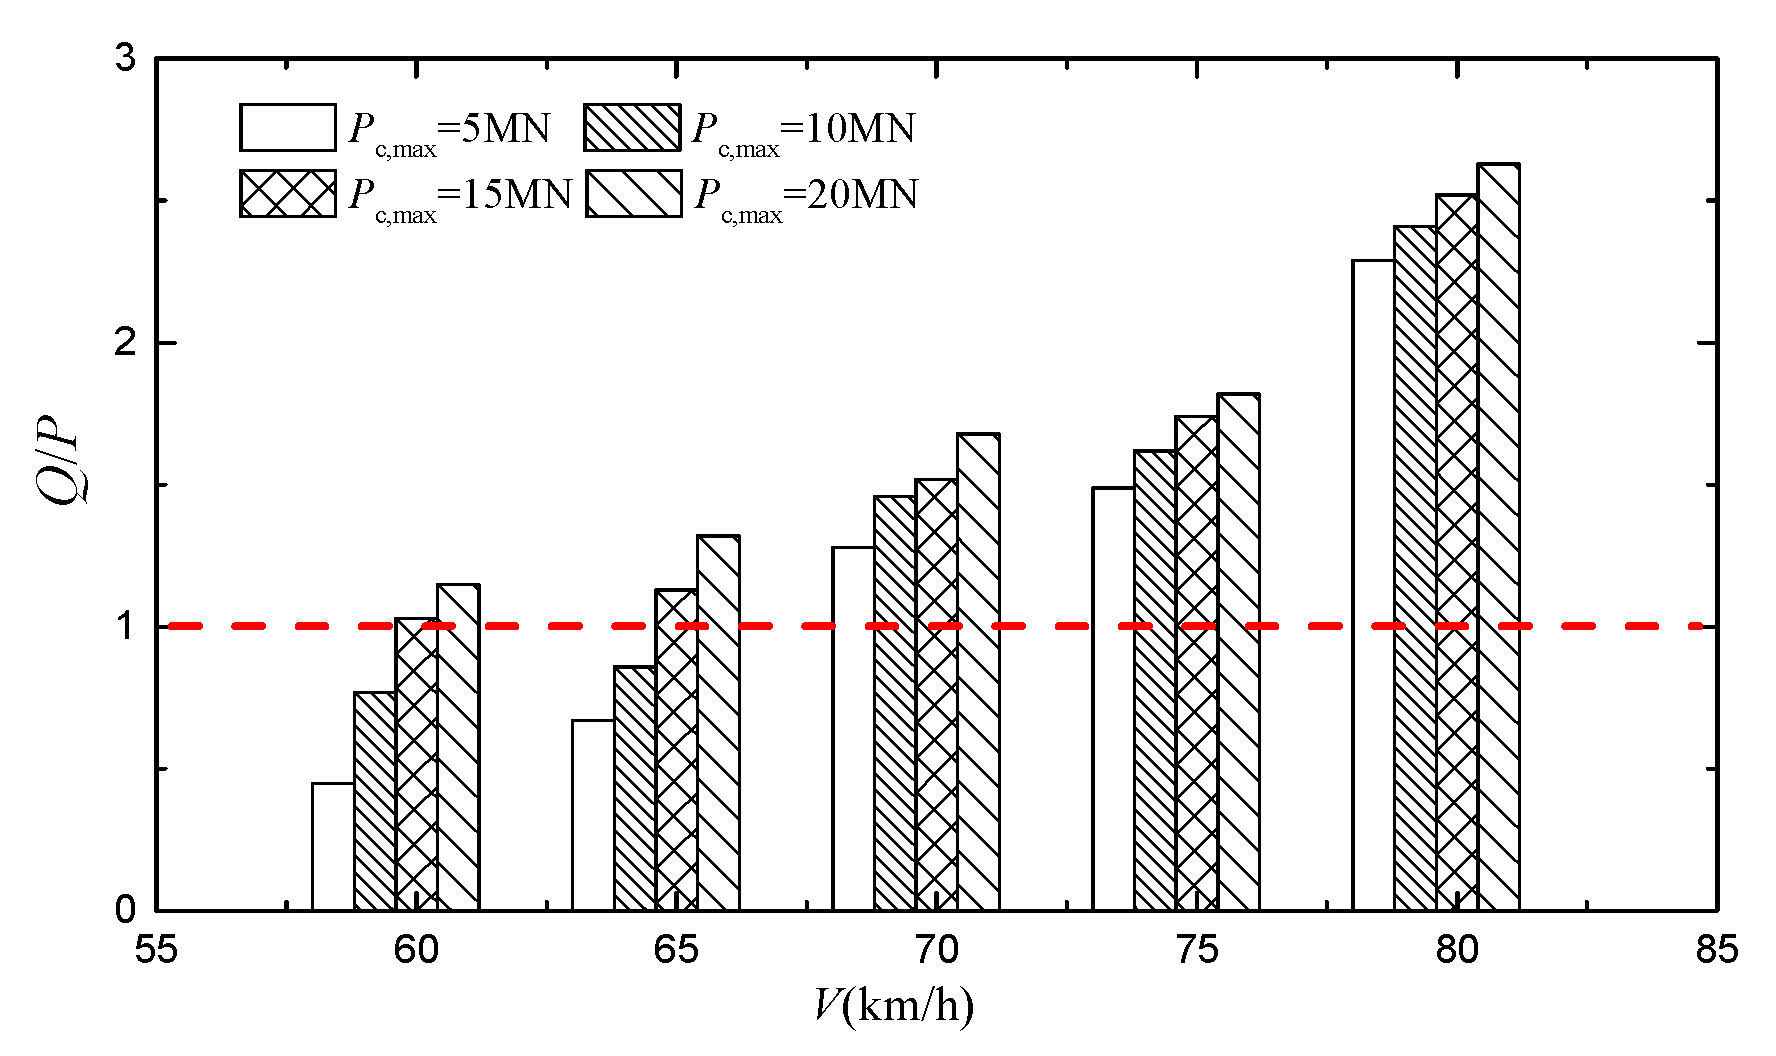
Figure 12.
Q/P changes with V and Pc, max.
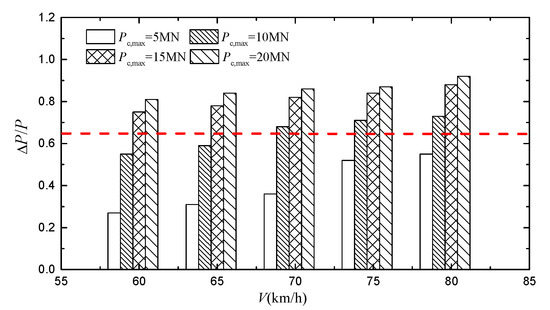
Figure 13.
ΔP/P changes with V and Pc, max.
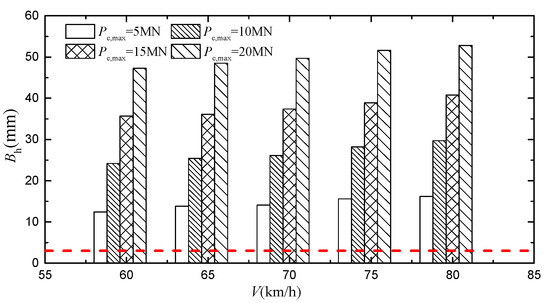
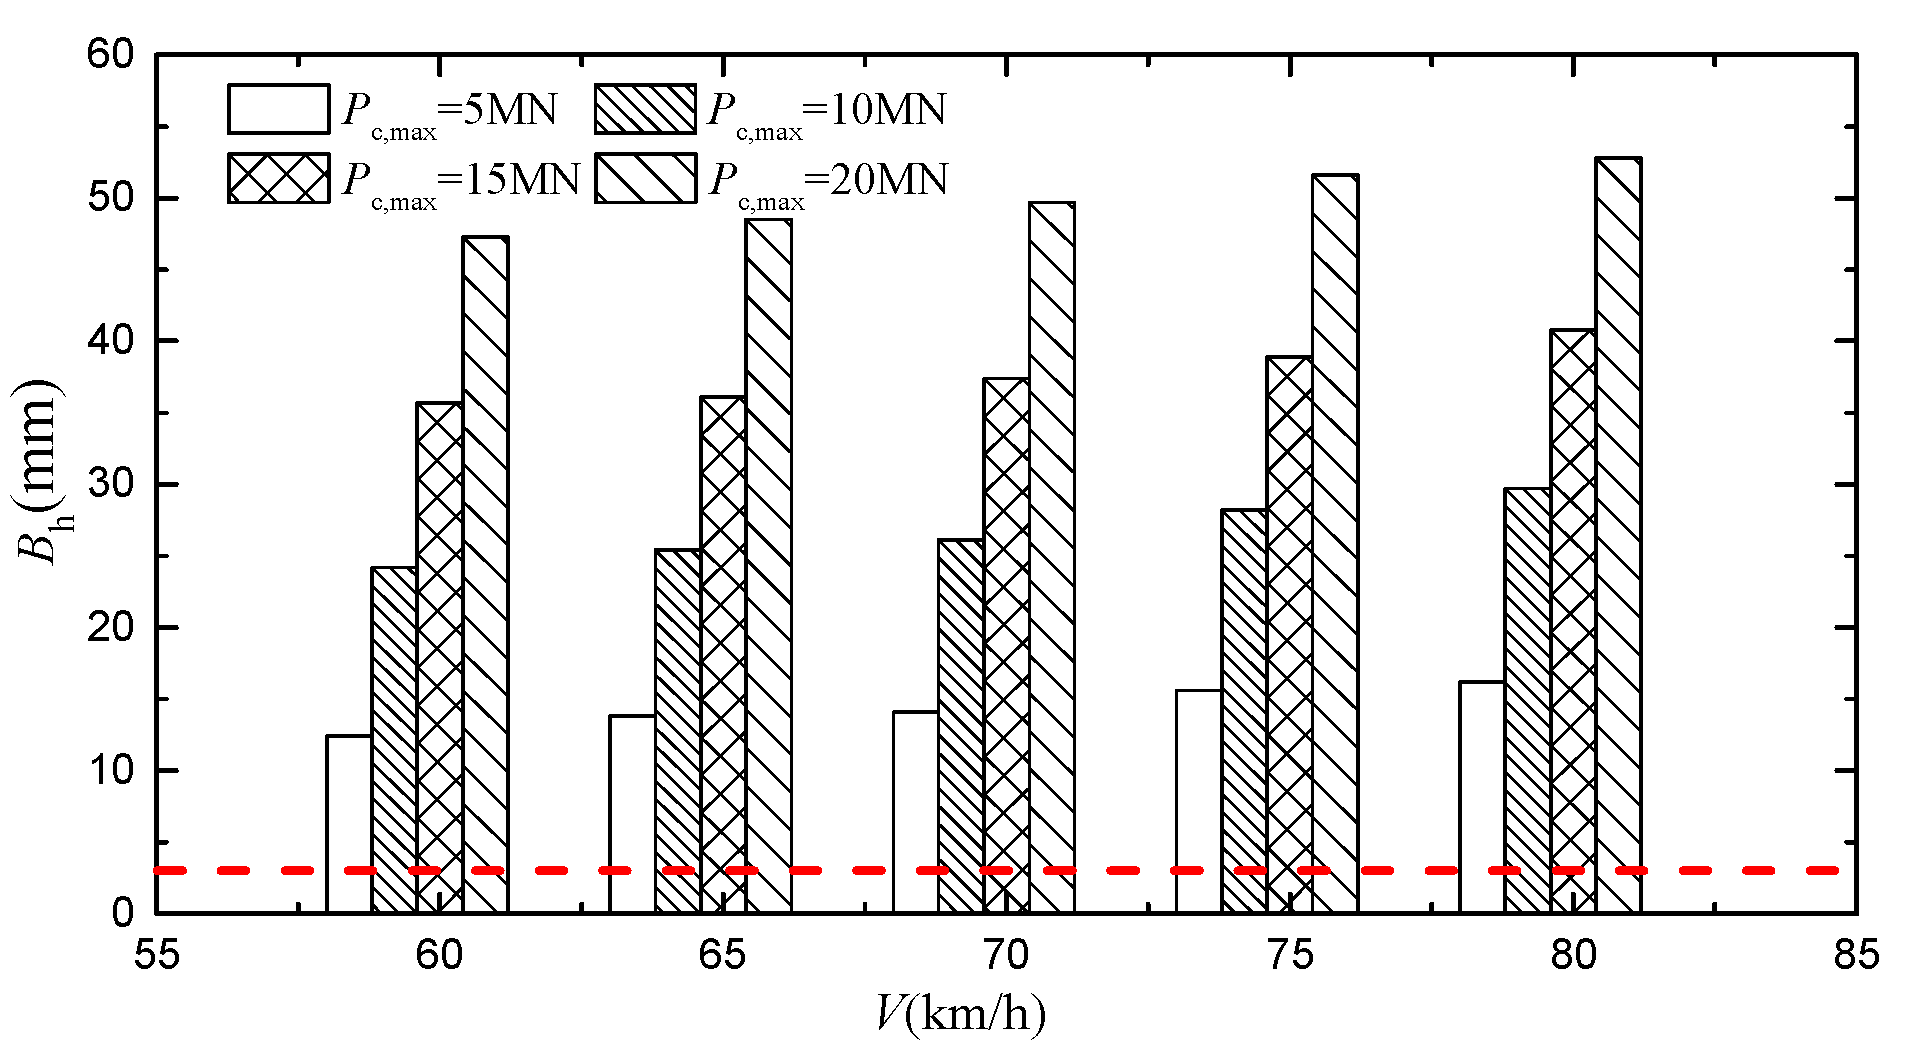
Figure 14.
Bh changes with V and Pc, max.

Figure 15.
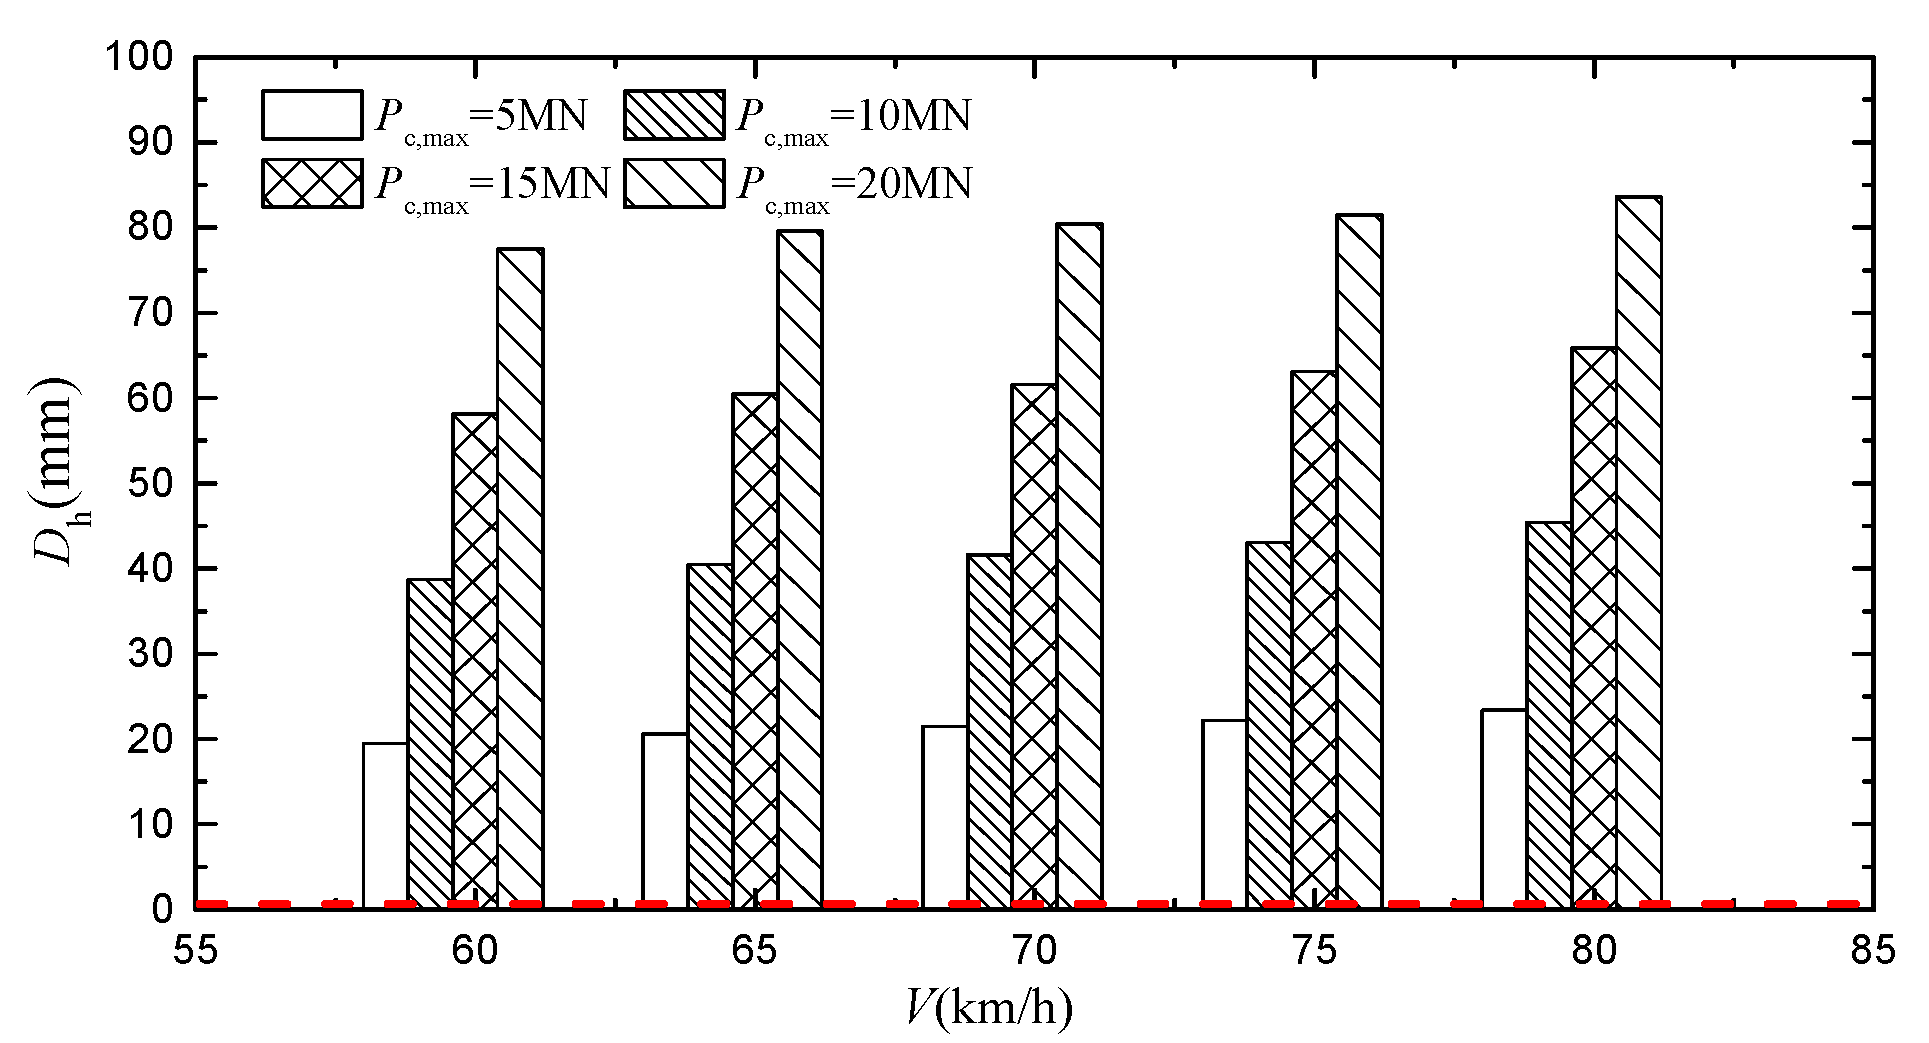
Dh changes with V and Pc, max.

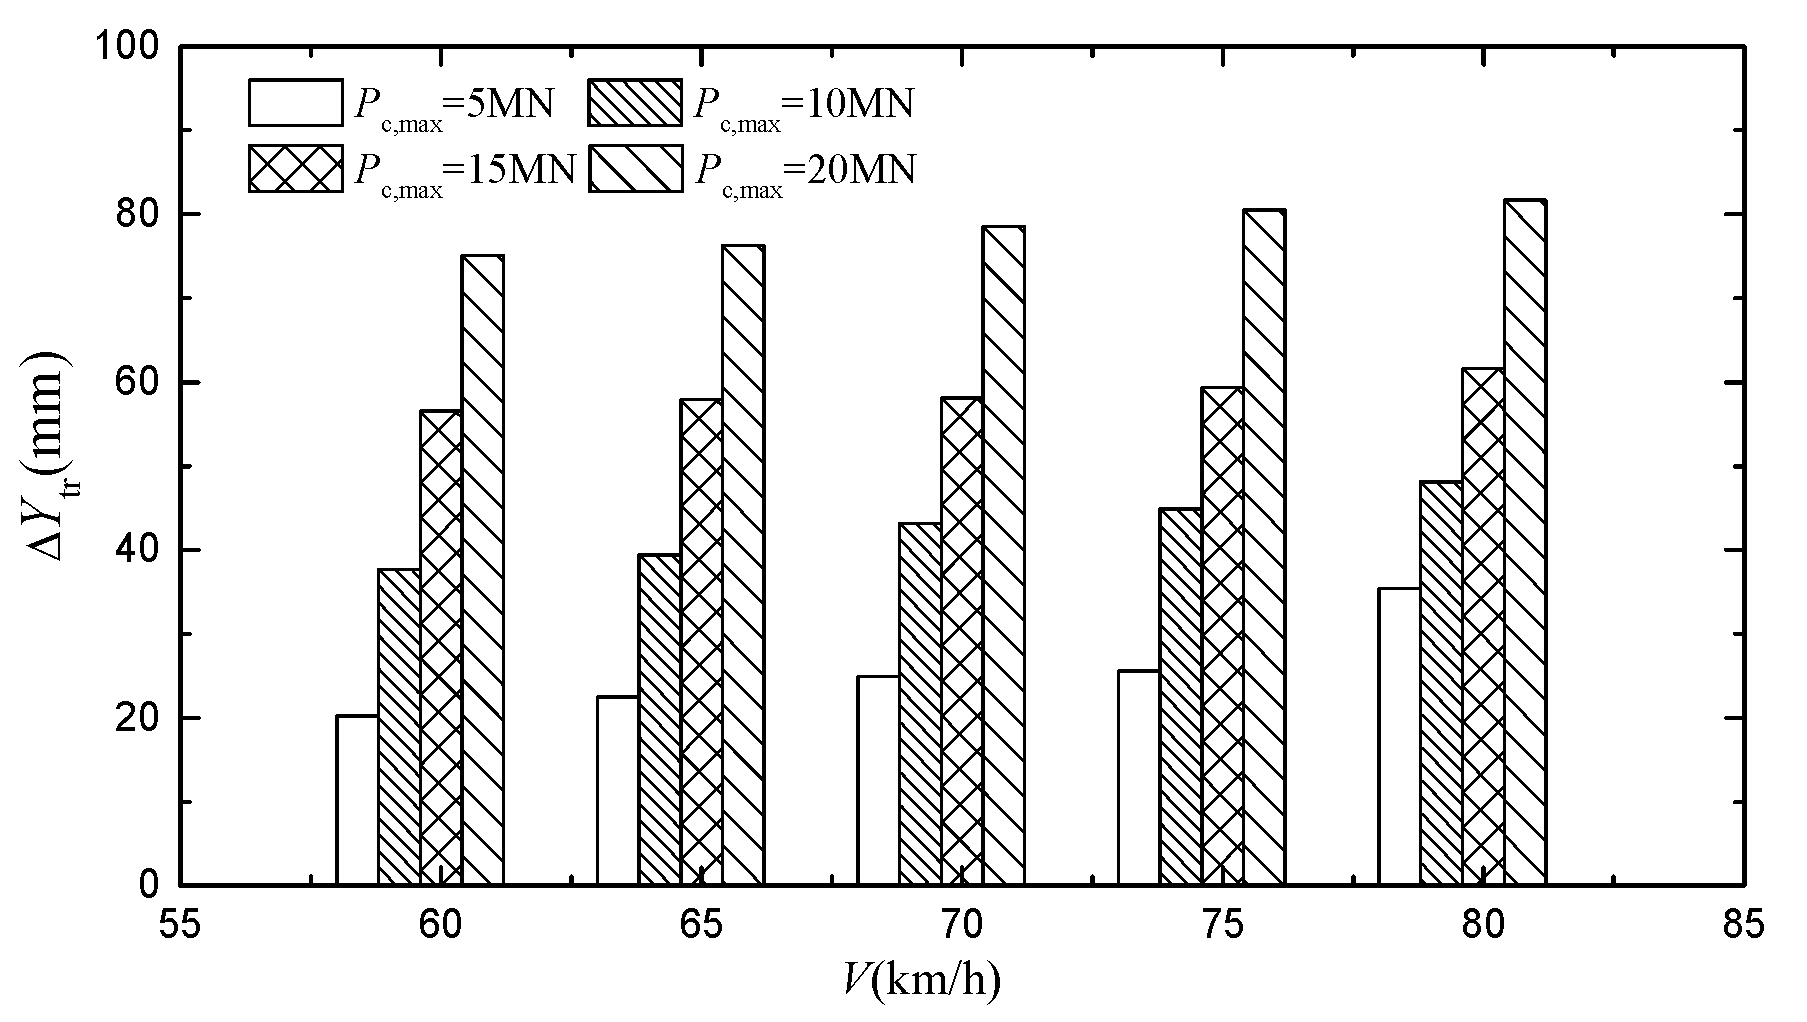
Figure 16.
ΔYtr changes with V and Pc, max.
Figure 11 reflects the ΔZ changes with V and Pc, max. In Figure 11, when the impact load is constant, with the increase of V, ΔZ increases gradually, but the increase is small. For example, the ΔZ at other speeds increased by 2.2%, 4.4%, 5.8%, and 9.3% compared with 60 km/h when Pc, max is 15 MN. Meanwhile, when V is constant and Pc, max is less than 15 MN, ΔZ increases with Pc, max, but the relative limit requirements still have a large margin. When Pc, max is great than or equal to 15 MN, ΔZ increases obviously which approaches or reaches 25 mm. Among them, when the V is from 60 to 80 km/h and Pc, max is 20 MN, train derailment occurs. Then, it can be seen that the impact load is the main factor causing the derailment of train wheels, and the speed has little effect.
Figure 12 reflects the Q/P changes with V and Pc, max. In Figure 12, when Pc, max is 5 and 10 MN and the V is from 70 to 80 km/h, all Q/P exceed the limit [30]. Besides, when Pc, max is 15 and 20 MN and the V is from 60 to 80 km/h, the corresponding of Q/P also exceed the limit [30]. However, the train wheel does not derail when the Pc, max is less than or equal to 15 MN, and the wheel derails when Pc, max is equal to 20 MN. So, this further shows that the limit value of derailment coefficient is difficult to determine whether the wheel is derail. However, it should be noted that with the increase of V and Pc, max, the greater the derailment coefficient is, the more unsafe the train is. For example, when V is 80 km/h and Pc, max is 20 MN, the Q/P is up to 2.63, which is 2.63 times of the specification limit 1.0.
Figure 13 reflects the ΔP/P changes with V and Pc, max. In Figure 13, when Pc, max are 0, 5, and 10 MN and the V is from 70 to 80 km/h, all ΔP/P exceed the limit [30]. Besides, when Pc,max is 15 and 20 MN and V is from 60 to 80 km/h, the corresponding ΔP/P exceed the limit [30]. However, the train wheel does not derail when the Pc, max is less than or equal to 15 MN, and the wheel derails when Pc, max is equal to 20 MN. This shows that the limit value of wheel load reduction rate makes it difficult to determine whether the wheel has derailed. However, it should be noted that the ΔP/P increases significantly when Pc, max is great than or equal to 15 MN, the maximum value of ΔP/P is 0.92. At this point, the train wheels are close to full load shedding. The impact load makes it easy to cause a significant reduction of wheel load, which affects safety.
Figure 14 and Figure 15 reflect the Bh and Dh changes with V and Pc, max, respectively. In Figure 14, when V is 80 km/h, Bh under other impact loads increased by 92%, 182%, and 257%, respectively, compared with Pc, max of 5 MN. When Pc, max is 20 MN, the Bh corresponding to other speeds increased by 2.5%, 5.1%, 9.1%, and 11.6% respectively, compared with the V of 60 km/h. Besides, in Figure 15, Dh increases with V and Pc, max. When the V is 80 km/h, Dh increases by 83%, 151%, and 226% under other impact loads, respectively, compared with Pc, max of 5 MN. When Pc, max is 20 MN, the Dh corresponding to other speeds increased by 2.7%, 3.7%, 5.2%, and 7.9% respectively, compared with the V of 60 km/h. Then, it can be seen that speed has little effect on the transverse displacement of beam span and pier top under impact load.
Figure 16 reflects the ΔYtr changes with V and Pc, max. When V is 80 km/h, ΔYtr are 35.4, 48.1, 60.6, and 81.7 respectively. Compared with Pc, max of 5 MN, ΔYtr increased by 35%, 71%, and 131% respectively under the other Pc, max. When Pc, max is 20 MN, ΔYtr increased by 1.5%, 4.5%, 7.2%, and 8.8%, respectively, under the other V, compared with V of 60 km/h. So, it can be seen that the impact load increases significantly, especially when the train wheel derails, when the Pc, max is 20 MN, and the corresponding of maximum ΔYtr is 81.7 mm. Therefore, it is necessary to predict the derailment information of train wheels in advance to control the derailment of train wheels under impact load. Considering safety 1.25, the early warning threshold ΔYtr/1.25 with derailment information is obtained, and the specific values are shown in Table 1.
4. Conclusions
In this paper, the model of a FTTB system under ship impact is established, and the whole calculation method of train derailment on a heavy haul railway bridge under ship impact is proposed. The variation law of the FTTB system response in the whole process of train derailment is analyzed. The main conclusions are as follows.
(1) Ship impact has a great influence on wheel lift value, and the peak impact load occurs synchronously with the maximum wheel lift. When the impact load peak is greater than or equal to 15 MN, the train wheel is more prone to derailment. It is necessary to take early warning measures in time.
(2) With the increase of ship impact load, derailment coefficient and wheel load reduction rate increase significantly, but its limit cannot determine whether the train wheel has derailed.
(3) The lateral displacement of the mid-span of beam and the top of pier increase significantly under ship impact, respectively. Since the pier is directly impacted, the lateral displacement of the pier top is greater than that of the beam span. When the peak value of impact load is less than 15 MN, although the above indexes exceed the specification limit, the train does not derail. Therefore, it is suggested to further refine the mapping relationship between specification limits and train safety.
(4) The increase of vehicle speed under ship impact has little effect on the response of the FTTB system.
(5) The lateral relative displacement of bogie and rail increases significantly under ship impact, and the lateral relative displacement of bogie and rail is obtained when the wheel is derailed. The lateral relative displacement of bogie and rail is divided by the safety factor as the warning threshold reflecting the train wheel derailment information. In addition, a scaled model test will be carried out in subsequent articles based on this threshold.
Author Contributions
Conceptualization, K.G. and L.L.; methodology, K.G.; software, K.G. and C.Y.; validation, K.G. and C.Y.; formal analysis, K.G. and C.W.; writing, K.G. and C.Y. All authors have read and agreed to the published version of the manuscript.
Funding
This research was funded by [the National Natural Science Foundation of China] grant number [51578238, 52068028], [National Natural Science Foundation Committed of China and Shen-hua Group Corporation Limited] grant number [U1261113], [Jiangxi Province’s Key Research and Development Plan] grant number [20181BBE50013], [Science and Technology of Jiangxi Provincial Education Department] grant number [GJJ170392].
Institutional Review Board Statement
Not applicable.
Informed Consent Statement
Not applicable.
Data Availability Statement
The data used to support the findings of this study are available from the corresponding author request.
Conflicts of Interest
The authors declare that they have no conflicts of interest.
References
- Larry, D.; Olson, P.E. Dynamic Bridge Substructure Evaluation and Monitoring; US Federal Highway Administration: Washington, DC, USA, 2005. [Google Scholar]
- Wardhana, K.; Hadipriono, F.C. Analysis of recent bridge failures in the united states. J. Perform. Constr. Facil. 2003, 17, 144–150. [Google Scholar] [CrossRef] [Green Version]
- Wuttrich, R.; Wekezer, J.; Yazdani, N.; Wilson, C. Performance evaluation of existing bridge fenders for ship impact. J. Perform. Constr. Facil. 2001, 15, 17–23. [Google Scholar] [CrossRef]
- Chaoyi, X.; Nan, Z.; He, X. Dynamic analysis of a train-bridge system under vessel collision and running safety evaluation of its high-speed train. J. Vib. Shock. 2015, 34, 155–161. [Google Scholar]
- Hai, F.; Huiming, S.; Weiqing, L. Analysis of train derailment after hitting the pier of Tongling Yangtze River bridge combined road with railway. J. Railw. Eng. Soc. 2014, 9, 65–70. [Google Scholar]
- Wilson, C.M.D.; Yazdani, N.; Wekezer, J. Static finite-element analysis of bridge fenders for barge impact. J. Perform. Constr. Facil. 2001, 15, 90–95. [Google Scholar] [CrossRef]
- Consolazio, G.R.; Hendrix, J.; Mc Vay, M. Prediction of pier response to barge impacts with design-oriented dynamic finite element analysis. Transp. Res. Rec. 2004, 1868, 177–189. [Google Scholar] [CrossRef]
- Consolazio, G.R.; Cowan, D.R. Numerically efficient dynamic analysis of barge collisions with bridge piers. J. Struct. Eng. 2005, 131, 1256–1266. [Google Scholar] [CrossRef]
- Consolazio, G.R.; Davidson, M.T.; Cowan, D.R. Barge bow force-deformation relationships for barge-bridge collision analysis. Transp. Res. Rec. 2009, 2131, 3–14. [Google Scholar] [CrossRef]
- Davidson, M.T.; Consolazio, G.R.; Getter, D.J. Dynamic Amplification of Pier Column Internal Forces Due to Barge-Bridge Collision. Transp. Res. Rec. 2010, 2172, 11–22. [Google Scholar] [CrossRef]
- Yuan, P.; Harik, I.E. One-Dimensional Model for Multi-Barge Flotillas Impacting Bridge Piers. Comput.-Aided Civ. Infrastruct. Eng. 2008, 23, 437–447. [Google Scholar] [CrossRef]
- AASHTO. Guide Specification and Commentary for Vessel Collision Design of Highway Bridges; AASHTO: Washington, DC, USA, 1991. [Google Scholar]
- Sha, Y.; Hao, H. Laboratory tests and numerical simulation of barge impact on circular reinforced concrete piers. Eng. Struct. 2013, 46, 593–605. [Google Scholar] [CrossRef]
- Sha, Y.; Hao, H. Nonlinear finite element analysis of barge collision with a single bridge pier. Eng. Struct. 2012, 41, 63–76. [Google Scholar] [CrossRef]
- Fan, W.; Yuan, W.C. Shock spectrum analysis method for dynamic demand of bridge structures subjected to barge collisions. Comput. Struct. 2012, 90, 1–12. [Google Scholar] [CrossRef]
- Fan, W.; Yuan, W.C. Numerical simulation and analytical modeling of pile-supported structures subjected to ship collisions including soil-structure interaction. Ocean. Eng. 2014, 91, 11–27. [Google Scholar] [CrossRef]
- Gholipour, G.; Zhang, C.; Li, M. Effects of soil-pile interaction on the response of bridge pier to barge collision using energy distribution method. Struct. Infrastruct. Eng. 2018, 14, 1520–1534. [Google Scholar] [CrossRef]
- Gholipour, G.; Zhang, C.; Mousavi, A. Analysis of girder bridge pier subjected to barge collision considering the superstructure interactions: The case study of a multiple-pier bridge system. Struct. Infrastruct. Eng. 2019, 15, 392. [Google Scholar] [CrossRef]
- Yan, X.; Dun, Z. Train derailment on railway bridge caused by ship hitting pier. Foreign Bridges 2001, 4, 60–64. [Google Scholar]
- Chen, C. Study on Design Collision Force and Simulation of Damage for Bridge Subjected to Ship Impact; Tongji University Press: Shanghai, China, 2006. [Google Scholar]
- Junjie, W.; Cheng, C. Simulation of damage for bridge pier subjected to ship impact. Eng. Mech. 2007, 24, 156–160. [Google Scholar]
- Xia, C.Y.; Ma, Q.; Song, F.D.; Wu, X. Dynamic analysis of high-speed railway train-bridge system after barge collision. Struct. Eng. Mech. 2018, 67, 9–20. [Google Scholar]
- Gong, K.; Xiang, J.; Mao, J. Derailment precautions of freight train on bridge in heavy haul railway. J. Cent. South Univ. 2017, 48, 3406–3414. [Google Scholar]
- Xiang, J. Study on Mechanism and Analysis Theory of Train Derailment. Ph.D. Thesis, Central South University, Changsha, China, 2006. [Google Scholar]
- Zeng, Q.; Lou, P.; Xiang, J. The principle of total potential energy with stationary value in elastic system dynamics and its application to the analysis of vibration and dynamic stability. J. Huangzhong Univ. Sci. Technol. 2002, 19, 7–14. [Google Scholar]
- Zeng, Q.; Yang, P. The “Set-in-Right-Position” rule for forming structural matrices and the finite truss element method for space analysis of truss bridge. J. China Railw. Soc. 1986, 8, 48–59. [Google Scholar]
- National Railway Administration of the People’s Republic of China. Code for Design on Railway Bridge and Culvert; China Railway Publishing House: Beijing, China, 2017. [Google Scholar]
- British Standard BS EN1991-1-7, Eurocode 1-Actions on Structures General Action: Accidental Actions; The European Union: Brussels, Belgium, 2006.
- Xiang, J.; Zeng, Q. Analysis method of stability and critical speed for train-track(bridge) time-variable system under lateral vibration condition. J. Traffic Transp. Eng. 2011, 11, 19–24. [Google Scholar]
- National Bureau of Standards. Railway Vehicle-Specification for Evaluation the Dynamic Performance and Accreditation Test; Standards Press of China: Beijing, China, 2019.
- Xiao, X.-B. Study on High-Speed Train Derailment Mechanism in Severe Environment. Ph.D. Thesis, School of Transportation Engineering, Southwest Jiaotong University, Chengdu, China, 2013. [Google Scholar]
- Han, T.Y. No 120. Code for Rating Existing Railway Bridges; China Railway Publishing House: Beijing, China, 2016. [Google Scholar]


Publisher’s Note: MDPI stays neutral with regard to jurisdictional claims in published maps and institutional affiliations. |
© 2021 by the authors. Licensee MDPI, Basel, Switzerland. This article is an open access article distributed under the terms and conditions of the Creative Commons Attribution (CC BY) license (https://creativecommons.org/licenses/by/4.0/).