Article

Informational Measure of Symmetry vs. Voronoi Entropy and Continuous Measure of Entropy of the Penrose Tiling. Part II of the “Voronoi Entropy vs. Continuous Measure of Symmetry of the Penrose Tiling”

1
Chemical Engineering Department, Engineering Faculty, Ariel University, P.O. Box 3, Ariel 407000, Israel
2
Department of Mechanical Engineering & Mechatronics, Faculty of Engineering, Ariel University, P.O. Box 3, Ariel 407000, Israel
3
Department of Industrial Engineering and Management, Faculty of Engineering, Ariel University, P.O. Box 3, Ariel 407000, Israel
*
Author to whom correspondence should be addressed.
Symmetry 2021, 13(11), 2146; https://doi.org/10.3390/sym13112146
Submission received: 2 September 2021 / Revised: 4 October 2021 / Accepted: 6 November 2021 / Published: 10 November 2021
(This article belongs to the Special Issue Symmetry, Topology and Phases of Condensed Matter)

Abstract

:
The notion of the informational measure of symmetry is introduced according to: H s y m ( G ) = i = 1 k P ( G i ) l n P ( G i ) , where P ( G i ) is the probability of appearance of the symmetry operation G i within the given 2D pattern. H s y m ( G ) is interpreted as an averaged uncertainty in the presence of symmetry elements from the group G in the given pattern. The informational measure of symmetry of the “ideal” pattern built of identical equilateral triangles is established as H s y m ( D 3 ) = 1.792. The informational measure of symmetry of the random, completely disordered pattern is zero, H s y m = 0 . The informational measure of symmetry is calculated for the patterns generated by the P3 Penrose tessellation. The informational measure of symmetry does not correlate with either the Voronoi entropy of the studied patterns nor with the continuous measure of symmetry of the patterns. Quantification of the “ordering” in 2D patterns performed solely with the Voronoi entropy is misleading and erroneous.

1. Introduction

The paper introduces the connection between two fundamental physical notions, namely the notion of symmetry and the Shannon measure of information [1,2], abbreviated in the text as SMI. For any random discrete variable X , characterized by a probability distribution: P ( X 1 ) , P ( X 2 ) P ( X N ) the SMI, denoted H ( X ) , has been defined as:
H ( X ) = i = 1 N P i ( X i ) l o g 2 ( X i )
The value H ( X ) has the same mathematical form as the entropy in statistical mechanics [3,4]. Thus, Claude Shannon called this value, “entropy”, which gave rise to numerous and widespread misinterpretations, discussed in detail in refserences [5,6,7,8,9], in which the distinction between SMI and a “true” thermodynamic entropy (in other words the “Boltzmann entropy”) was discussed in detail. We apply SMI, defined by Equation (1) to the analysis of the 2D patterns, possessing given elements of symmetry. Thus, the information measure of symmetry (IMS) is introduced. A connection between two fundamental concepts of information and symmetry breaking was addressed in reference [10]. Information content of spontaneous symmetry breaking was studied in reference [11].
Our paper continues the series of papers in which the fundamental problem of the connection between ordering and symmetry in physical systems and spatial patterns is addressed [12,13]. The fundamental question is formulated as follows: what is the quantitative measure of ordering? In physics, ordering is quantified by the entropy of the physical system [3,4,12,13]. We already suggested that ordering in physical systems may be sometimes identified with symmetrizing of the system: in other words, introducing the elements of symmetry into an initially disordered physical system will necessarily order the system and consequently decrease its entropy [12,13]. A the same time, various measures have been suggested for quantification of symmetry of physical systems, one of which is the continuous measure of symmetry (abbreviated CSM and denoted S ˜ ( G ) for the G-symmetry shape), defined as the sum of the minimum squared distances required to move the points of the original shape in order to obtain a symmetrical shape [14,15,16,17,18,19,20,21,22]. In our recent paper we applied CSM for the analysis of the Penrose tessellations, explaining the rotational symmetry of quasicrystals [23]. In the present paper we introduce the alternative measure of the symmetry of 2D patterns, namely the informational measure of symmetry (ISM) and apply the suggested measure for the analysis of the patterns generated by the P3 Penrose tiling. We compare the informational measure of symmetry with the Voronoi entropy (denoted S v o r ) [23,24,25,26,27,28,29,30,31,32,33,34,35] and the continuous measure of symmetry [14,15,16,17,18,19,20,21,22] calculated for the patterns generated by the Penrose tessellation P3, presented in Figure 1.
The Voronoi entropy of a given set of points located in a plane is given by:
S v o r = i P i l n P i ,
where P i is the probability of finding n-sided Voronoi polygon within a given Voronoi tessellation and i is the total number of polygon types with different numbers of edges [24,25,26]. The summation in Equation (2) is performed from i = 3 (the smallest possible polygon—a triangle) to the largest coordination number of the polygon, e.g., for an octagon, the largest value of i is 8. A Voronoi diagram, in turn, is a partition of a plane into regions close to each of points, also known as seeds or generators. For each seed there is a corresponding area, referred to as a Voronoi cell, consisting of all points of the plane closer to that seed than to any other [24,25,26]. It is usually adopted that the Voronoi entropy grows with increasing disorder up to the natural logarithms of the total number of polygons comprising the given pattern [36]. Thus, the Voronoi entropy is usually, as will be shown, mistakenly considered as a measure of “order” for a given set of points [23,24,25,26,27,28,29,30,31,32,33,34,35,36].
A Penrose tiling, presented in Figure 1, is an aperiodic tiling that has a five-fold rotational and reflectional symmetry [37,38]. Penrose tiling supplies the explanation for the physical structure of quasicrystals, demonstrating the five-fold symmetry [37,38]. The translational symmetry is absent in the Penrose tiling. We analyzed symmetry of the Penrose tiling in parallel with the informational measure of symmetry (introduced below), the Voronoi Entropy [23,24,25,26,27,28,29,30,31,32,33] and the continuous measure of symmetry [14,15,16,17,18,19,20,21,22,23].

2. Materials and Methods

The MATLAB software was used for calculation of the continuous measure of symmetry of the studied patterns. To create the Voronoi diagrams, we used moduli of the program developed at the Department of Physics and Astronomy at the University of California (Department of Physics and Astronomy University of California, Irvine, CA, USA) (https://www.physics.uci.edu/~foams/do_all.html) (accessed on 31 August 2021).

3. Results and Discussion

3.1. Definition of the Informational Measure of Symmetry

We have demonstrated in our recent research that the Voronoi entropy and the continuous measure of symmetry do not exhaust the quantification of ordering in 2D patterns [23]. We propose now the alternative approach to the problem and introduce the “informational measure of symmetry”. Consider the 2D pattern, containing N polygons demonstrating certain elements of symmetry (rotational symmetry; centers of symmetry, axes of symmetry, etc.), denoted G i , i = 1 , 2 k , where k is a number of nonidentical symmetry operations. Thus, the informational measure of symmetry will be defined similarly to Equation (1), as:
H s y m ( G ) = i = 1 k P ( G i ) l n P ( G i ) ,
where P ( G i ) is the probability of appearance of the symmetry operation G i within the polygons constituting the pattern, defined as:
P ( G i ) = m ( G i ) N G 1 ,
where N G = i = 1 k m ( G i ) is the total number of symmetry elements (operations) appearing in the polygons recognized in a given pattern and m ( G i ) is a number of the same symmetry elements (operations) G i calculated for a given pattern. The normalization condition given by Equation (5) takes place:
i = 1 k P ( G i ) = 1
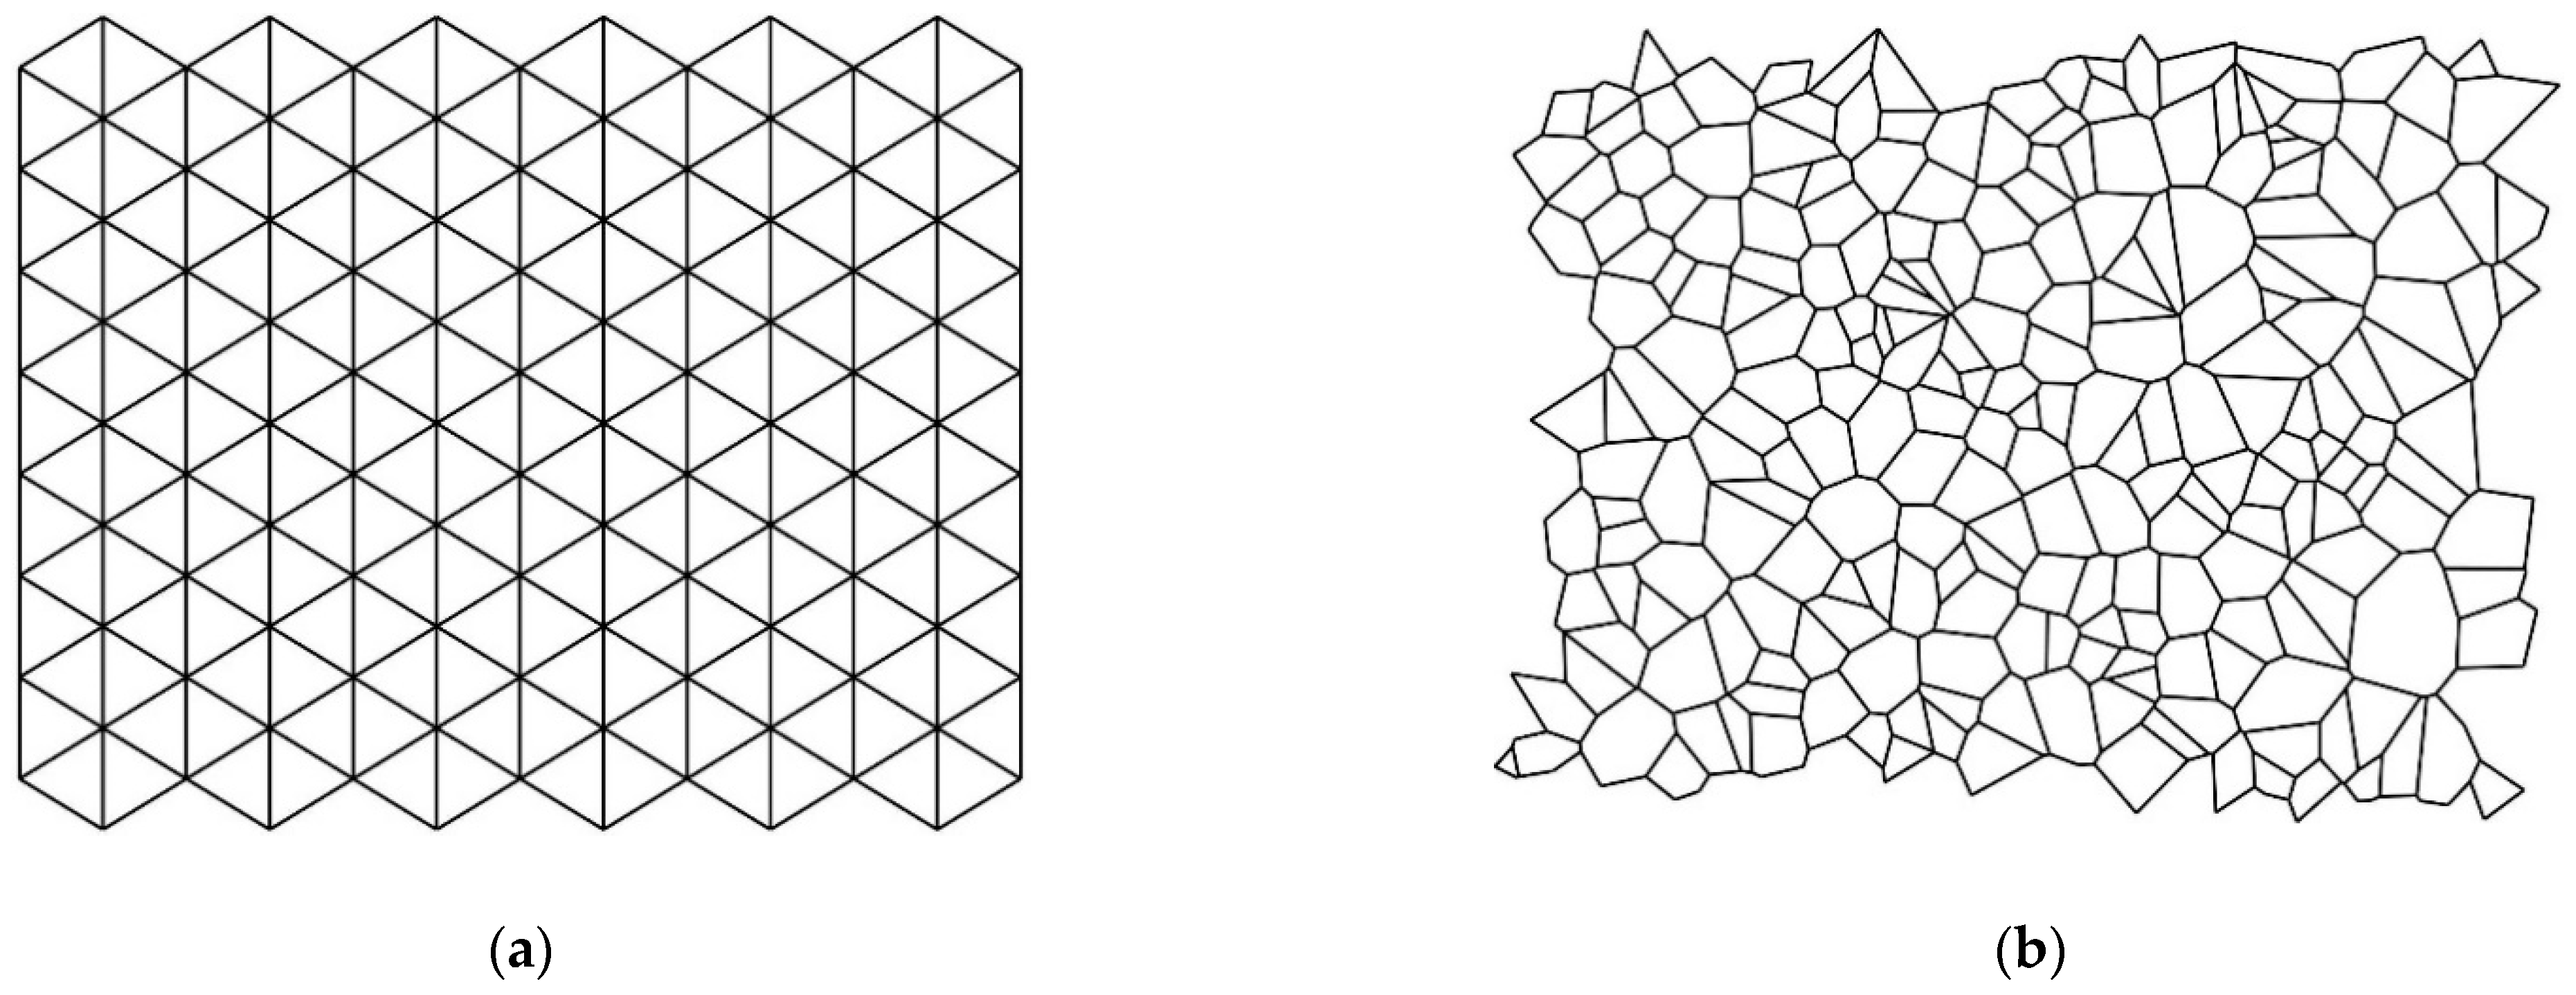
It is noteworthy that the entire 2D pattern may be symmetrical or nonsymmetrical; the definition of the informational measure of symmetry is not sensitive to the symmetry of the entire pattern and it is not influenced by the long-range order inherent for the pattern. Consider first, as an example, an “ideal pattern” built of identical equilateral triangles, depicted in Figure 2a.
The symmetry group of the equilateral triangle is the dihedral symmetry group D 3 . The symmetry group D n generally comprises n symmetry axes and n rotations, given by the angles φ n = k 2 π n ; k = 0 , 1 , 2 n 1 . Thus, in the case of equilateral triangles, shown in Figure 2a we have N g = 2 n p = 6 p elements of symmetry, where p is the total number of triangles in the pattern. The number of each of the elements of symmetry in the addressed pattern equals m ( G i ) = 1 × p . Thus, probabilities P ( G i ) are immediately calculated as ( G i ) = 1   ×   p ( 3   +   3 )   ×   p = 1 6 . Hence, for this pattern the informational measure of symmetry is calculated with Equation (6):
H s y m ( D 3 ) = i = 1 6 P ( G i ) l n P ( G i ) = 6 × 1 6 l n 1 6 = 1.792
Obviously, for the same pattern, S v o r ( G ) = 0 ; S ^ ( G ) = 0 take place. Now consider the opposite case of the completely disordered pattern, depicted in Figure 2b. In this case, we recognize for all of the polygons constituting the pattern the single element of symmetry, namely the rotation φ 1 = k 2 π 1 = 2 π ; thus, N G = p ; thus, P ( G 1 ) = 1 and consequently H s y m = i = 1 1 P ( G i ) l n P ( G i ) = i = 1 6 1 l n ( 1 ) = 0.
The Voronoi entropy and the continuous measure of symmetry for the same random, disordered pattern, as shown in Figure 2b, equals: S v o r = 1.6103 ; S ^ ( G ) = 46.91 % , which is close to the Voronoi entropy S v o r = 1.71 calculated for disordered patterns in references [39,40,41].

3.2. Informational Measure of Symmetry of the Patterns Generated by the Penrose Tiling

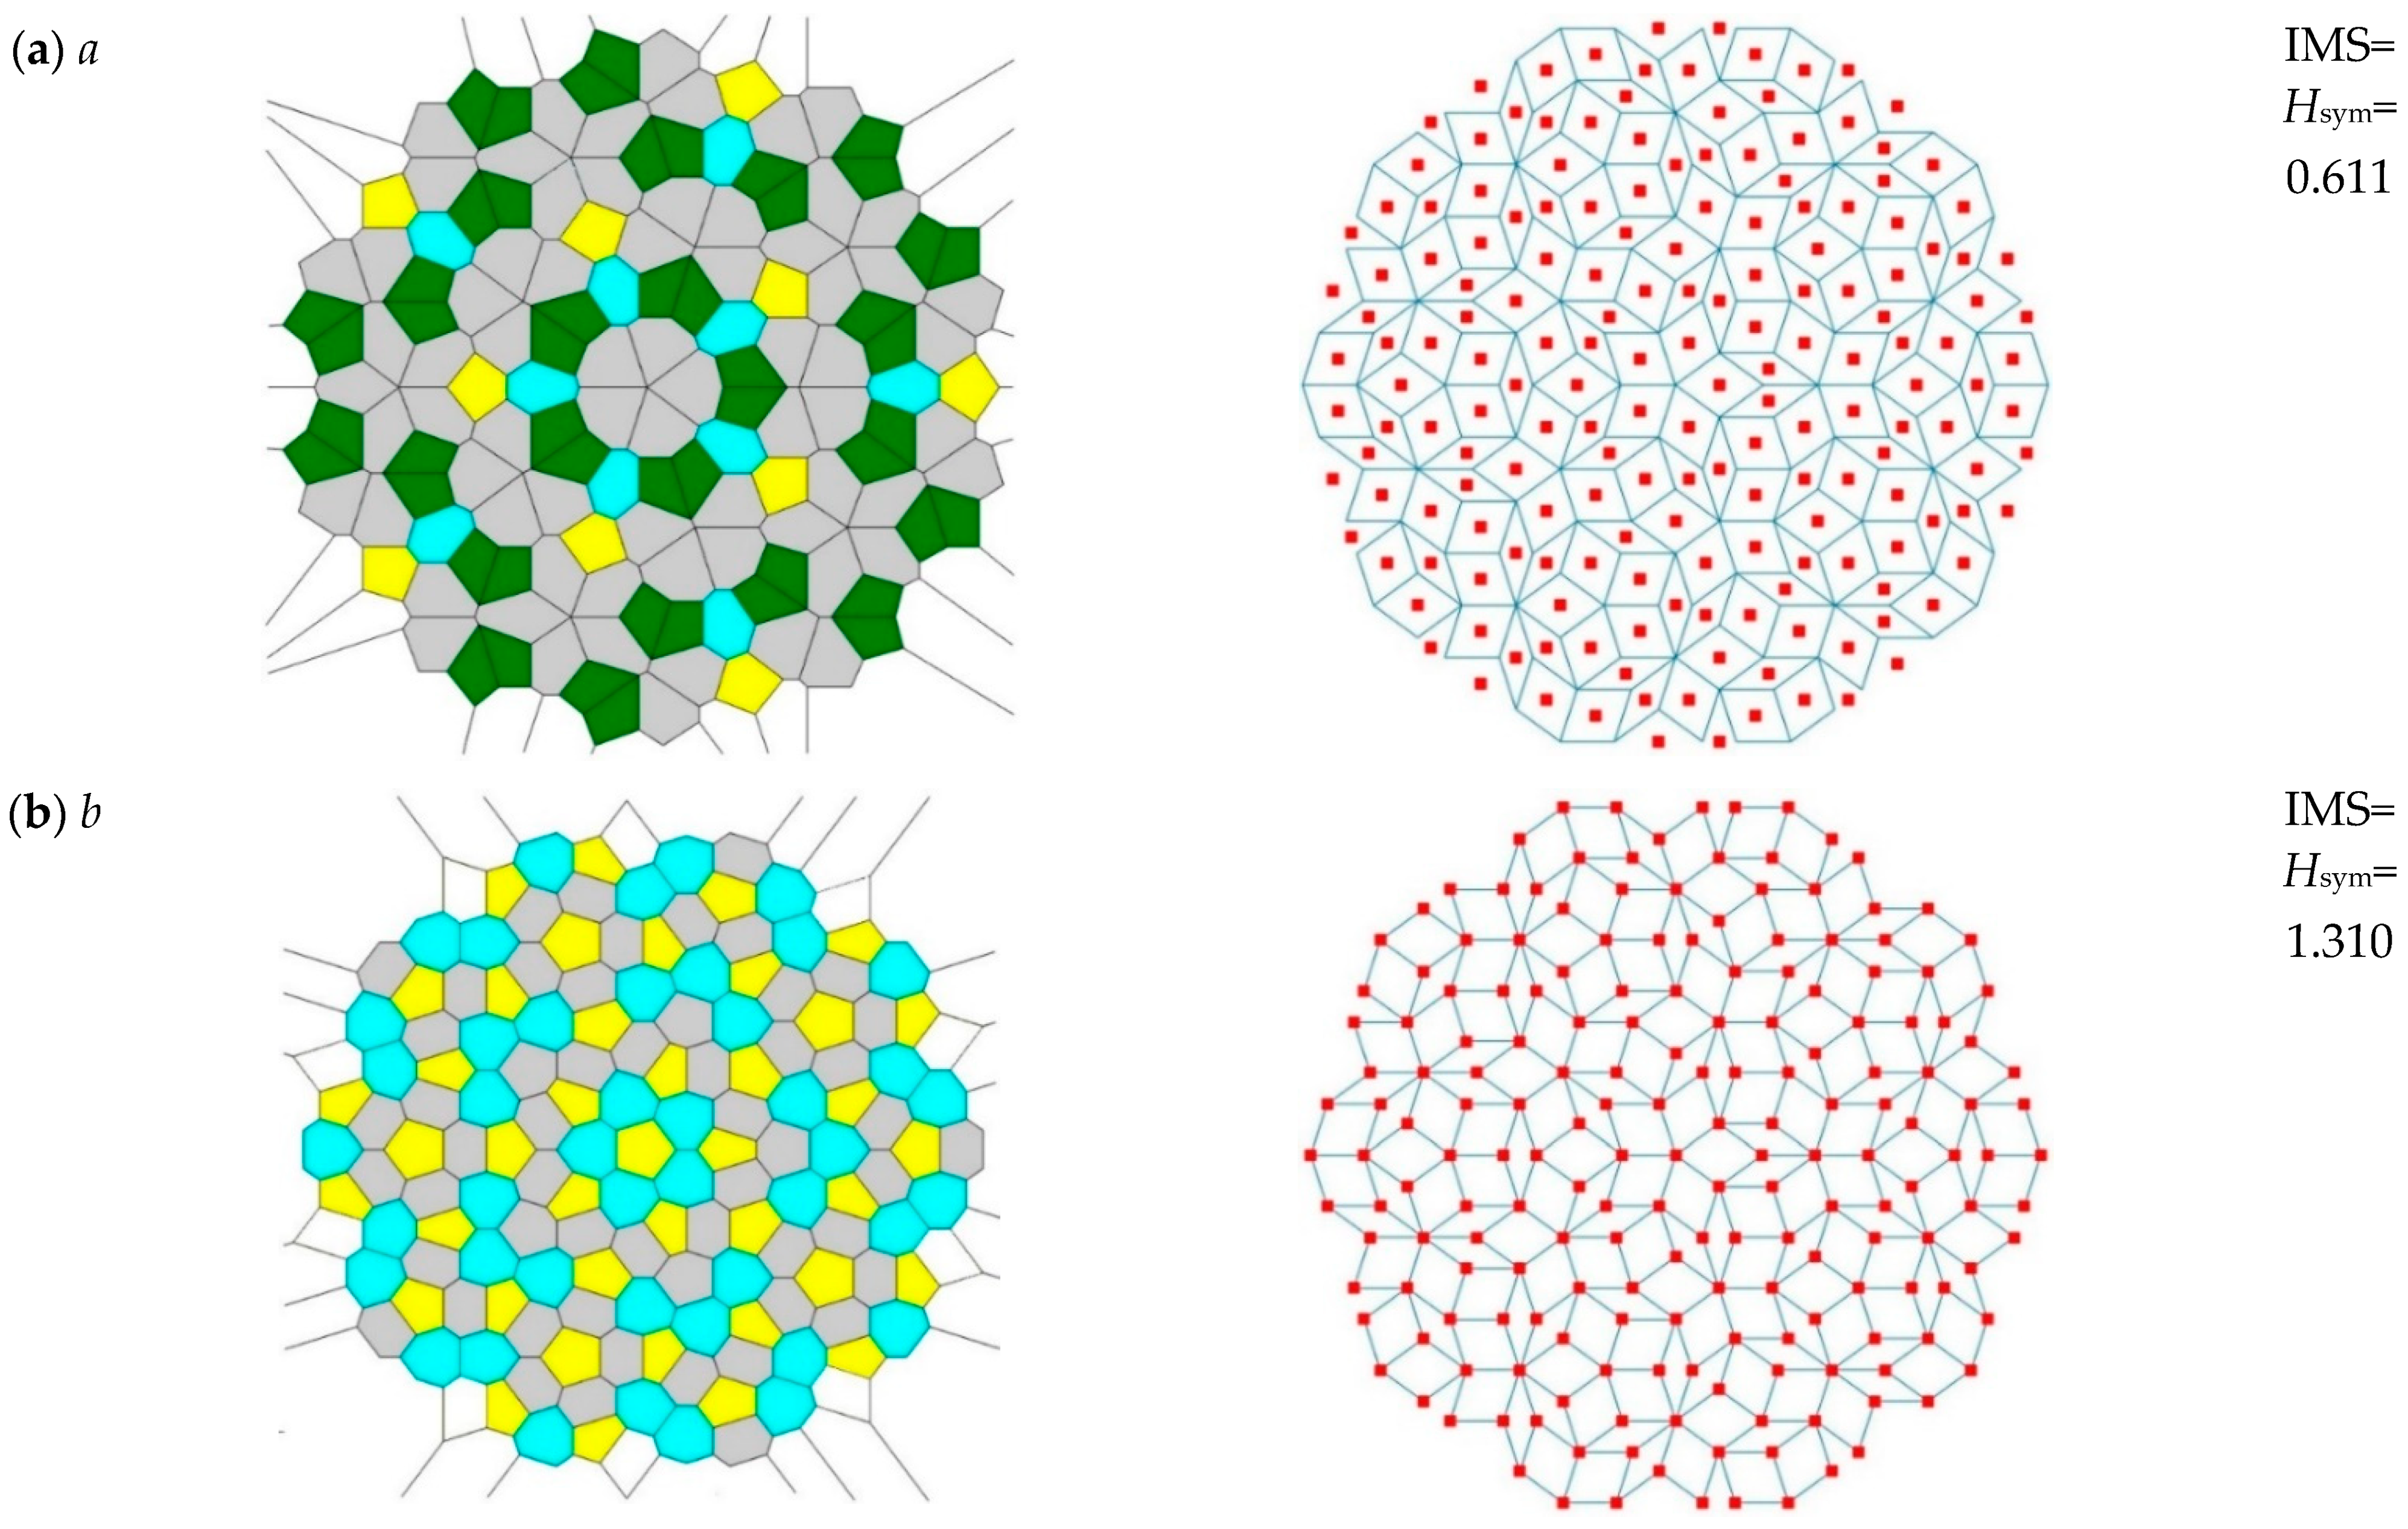
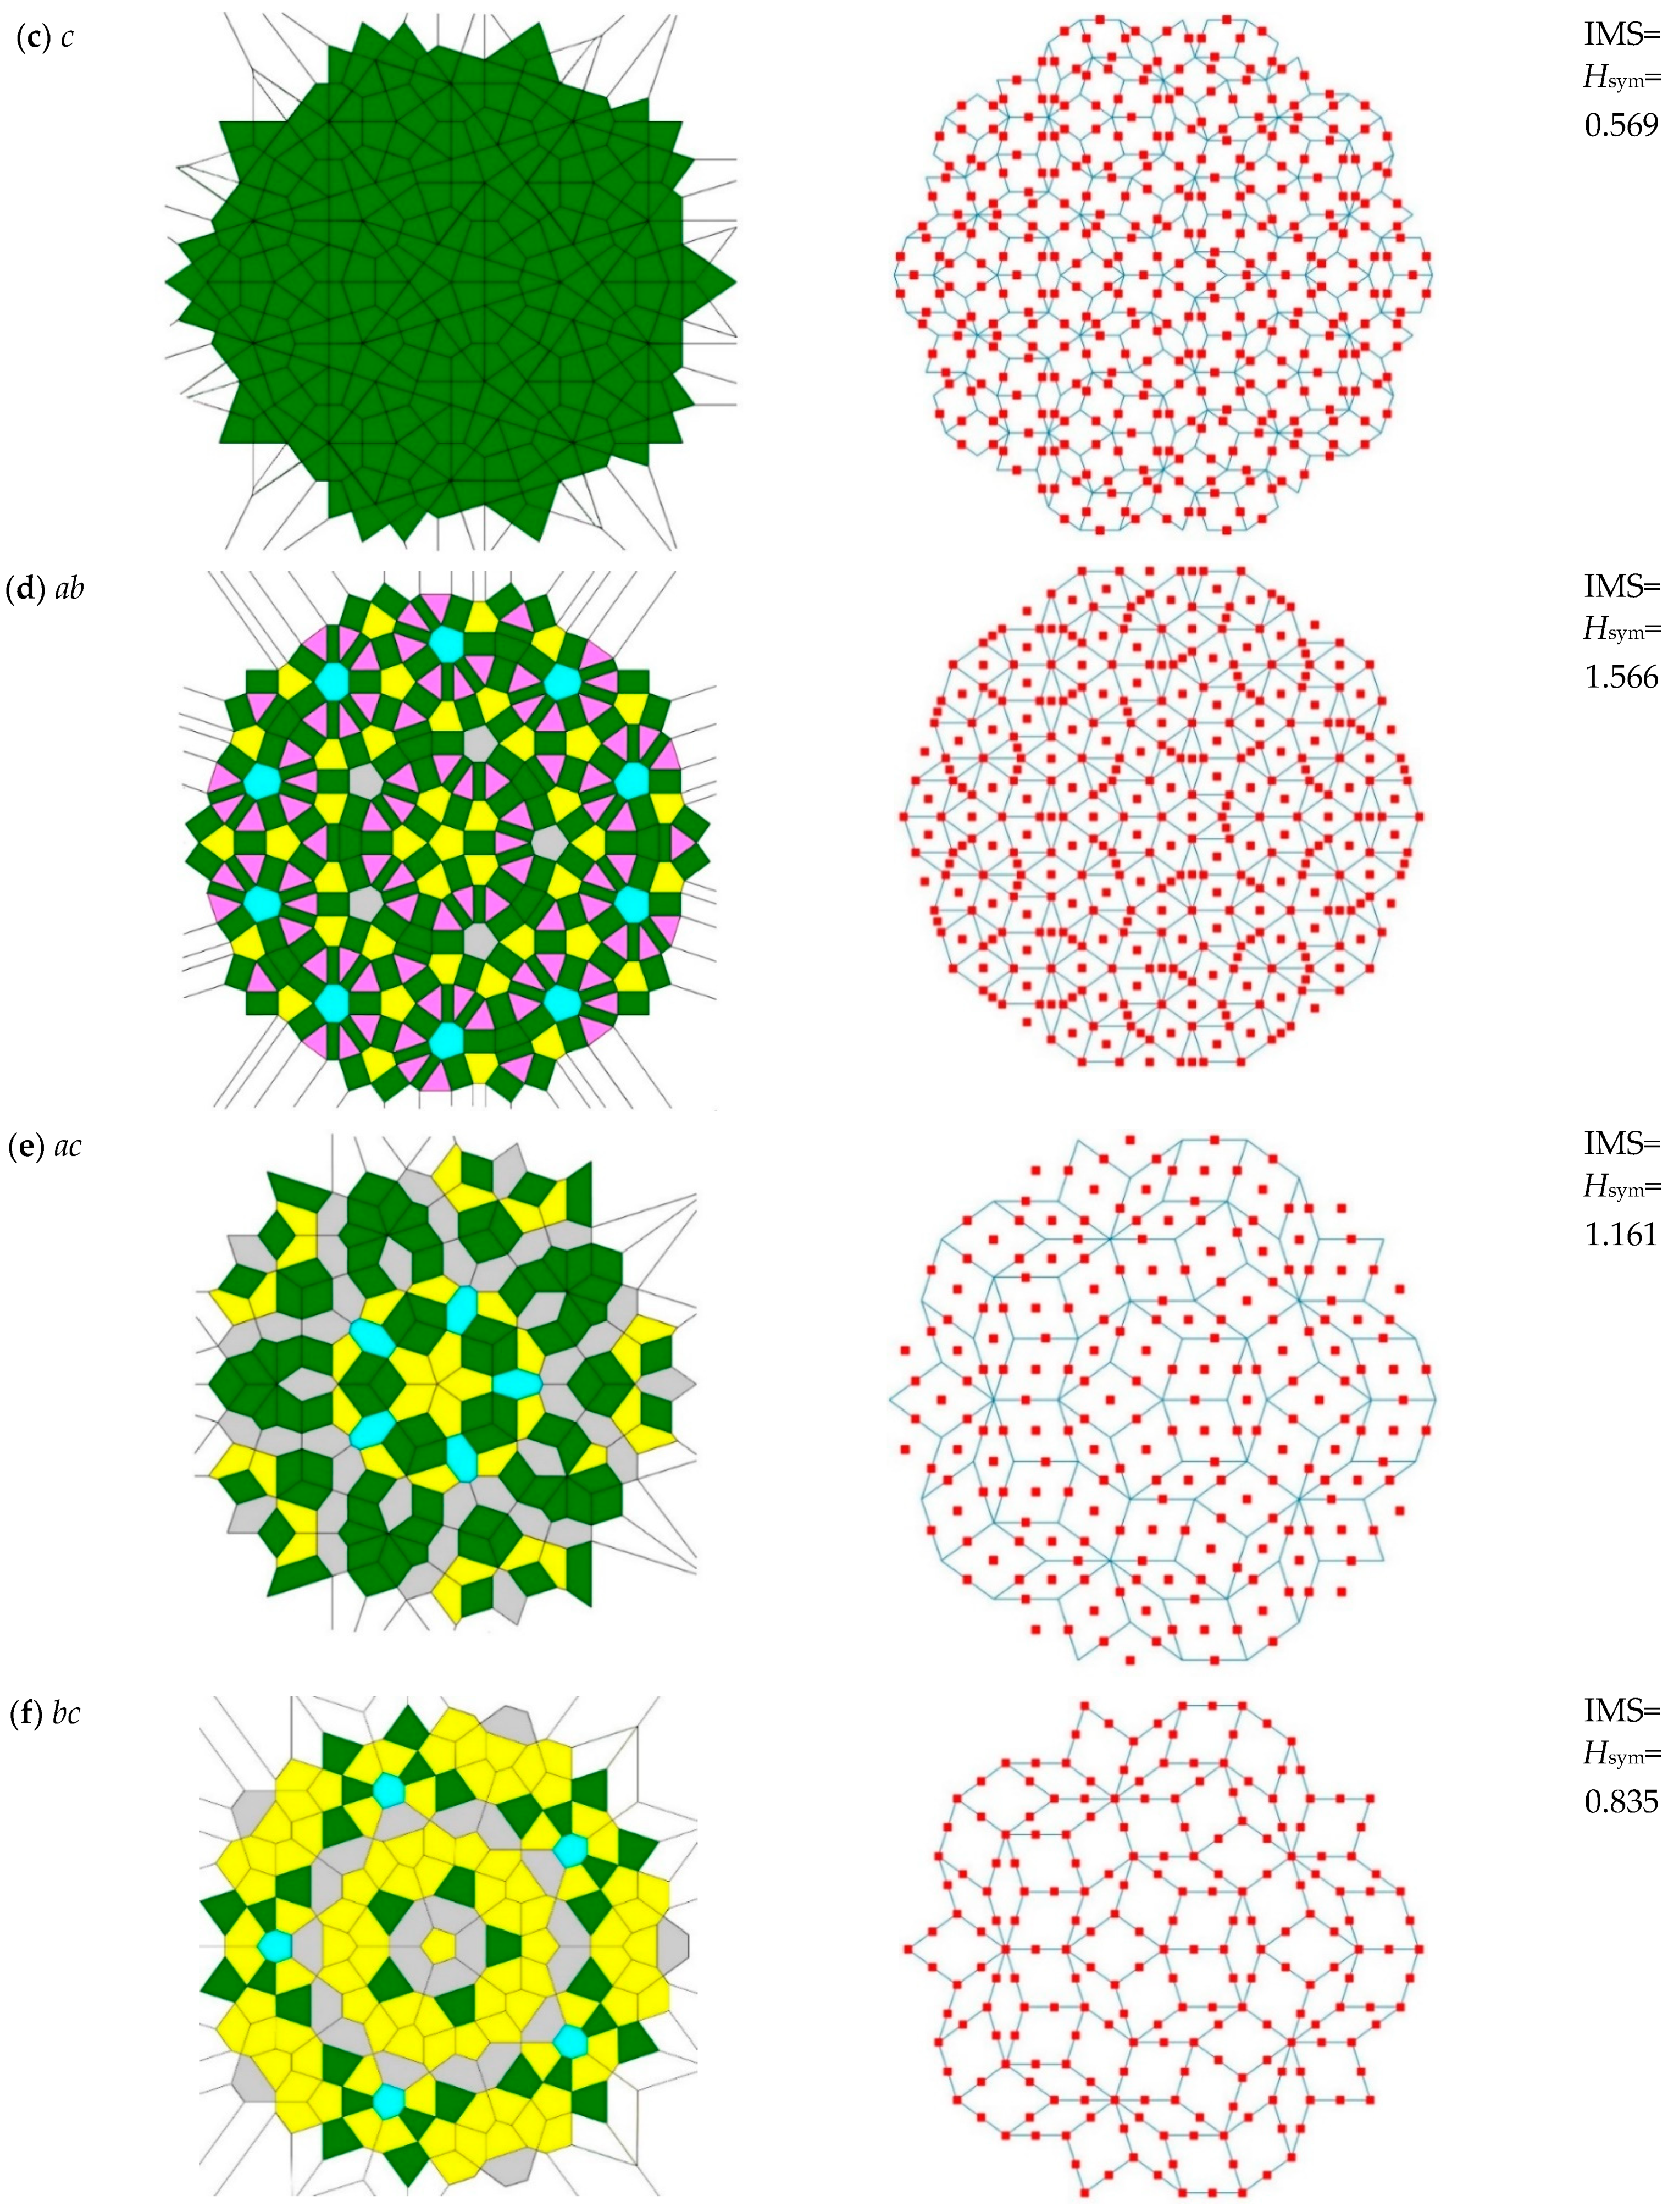
A given Penrose tiling generates a number of Voronoi diagrams, shown in Figure 3a–g (depicted in the left column of Figure 3). We already introduced in reference [23] three main types of Voronoi diagrams arising from the Penrose tiling P3, namely:
a-type Voronoi diagrams (abbreviated a-diagrams), where the centers of the Penrose rhombs are taken as the seeds, shown in Figure 3a;
b-type Voronoi diagrams (abbreviated b-diagrams) where the vertices of the rhombs constituting the Penrose tiling are taken as the seeds, depicted in Figure 3b;
c-type Voronoi diagrams (abbreviated c-diagrams) where the centers of the edges of Penrose rhombs are taken as the seeds, shown in Figure 3c.
In addition, the combinations of the a, b and c diagrams were addressed, denoted a b , a c , b c and a b c correspondingly. These Voronoi diagrams are shown in Figure 3d–g. For example, a b -diagram (depicted in Figure 3d) is the Voronoi diagram arising from merging of the seed points appearing in a- and b-diagrams. Note, that a, b, c, ab, ac, bc and abc-type Voronoi diagrams possess the same groups of symmetry, reflecting the groups of symmetry of the seed points. In particular, all of the diagrams are characterized by the five-fold rotational symmetry as well as the mirror plane symmetry, which can be recognized from Figure 3. The elements of symmetry appearing in the patterns are cataloged in Table 1. It should be emphasized that in spite of the fact that the entire patterns are characterized by the five-fold rotational symmetry, patterns a, c, and ac are built from the polygons, which do not demonstrate this kind of the rotational symmetry.
Now we address the quantification of symmetry of the patterns depicted in Figure 3. Which of the patterns are more and which are less symmetric? We will demonstrate that the answer to this question is far from trivial, and it is ambiguous. The values of the continuous symmetry measure ( S ˜ ( G ) and S ^ ( G ) ) and the Voronoi Entropy ( S v o r ) of the patterns were reported in reference [23]. The results of the calculation of the informational measure of symmetry H s y m ( G ) for seven investigated Penrose tilings are summarized in Figure 3 and Table 2.
What is the meaning of the introduced informational measure of symmetry H s y m ( G ) ? In our interpretation we follow the approach developed in references [5,38]. Following reference [5], three pathways of interpretation of H s y m ( G ) are possible, namely:
(i)
H s y m ( G ) is interpreted as an averaged uncertainty in the presence of symmetry elements from the group G in the given pattern.
(ii)
H s y m ( G ) may also be understood as a measure of the average unlikelihood, or unexpectedness of presence of symmetry elements constituting group G in the given 2D pattern.
(iii)
The most complicated is the information interpretation of the H s y m ( G ) . It turns out that the quantity H s y m ( G ) provides us with a measure of this information in terms of the minimum number of questions one needs to ask in order to find the presence of elements of symmetry G i in a given pattern, when P ( G i ) , i.e., the probabilities of appearance of the symmetry operation G i within the pattern are prescribed. It turns out that the quantity H s y m ( G ) provides a minimum measure of information needed to describe a given pattern as a composition of G i elements of symmetry [5].
Whatever the interpretation of the informational measure of symmetry H s y m ( G ) is, it provides averaged information about the entire pattern, and it is not related to the specific symmetry operations G i , as stressed in reference [5]. Let us start our analysis from the pattern “a”. As is recognized from Table 2, pattern “a” is characterized by the relatively low value of H s y m ( G ) ,   at   0.611 , and the highest of the studied patterns values of S v o r at 1.1364 and S ˜ ( G )   at   0.1138   ( S ^ ( G ) = 33.74 % ) . How should these data be interpreted? The low value of the informational measure of symmetry H s y m ( G ) = 0.611 emerges from the fact that the polygons constituting pattern “a” possess only two elements of symmetry, namely 2 π -rotations (which is an identity element of the symmetry group) and the mirror planes (see Table 1). Thus, the averaged uncertainty in the presence of symmetry elements, quantified by H s y m ( G ) , is low. On the other hand, pattern “a” is built from four types of different polygons, depicted in Figure 3a; this, contrastingly, results in the relatively high value of the Voronoi entropy. The effort necessary for symmetrization of the pattern “a” is also high; this explains the high value of S ^ ( G ) . Thus, we came to the following main conclusions:
(i)
The quantification of symmetry of the pattern has a “fine structure” and could not be expressed with a single numerical value.
(ii)
The information measure of symmetry, the Voronoi entropy and the continuous measure of symmetry are not necessarily correlated.
Now we address pattern “b”. This is characterized by the high value of the informational measure of symmetry H s y m ( G ) , the high value of the Voronoi entropy S v o r and the lowest possible value of the continuous measure of symmetry S ^ ( G ) (see Table 2). The high value of H s y m arises from the broad diversity of the symmetry elements appearing in this pattern (see Table 1); the relatively high value of the Voronoi entropy calculated for pattern “b” emerges from the three kinds of polygons constituting this pattern and the low continuous measure of symmetry evidences “the low effort” necessary for converting polygons into the perfectly symmetric shapes.
The high values of H s y m ( G ) and S v o r derived for the pattern “ab” are explained in the same way; however, the effort necessary for symmetrization of this pattern and quantified by S ˜ ( G ) is two-times higher that that established for pattern “b”.
Now we address the most paradoxical pattern “c”, which is characterized by the lowest possible Voronoi entropy S v o r = 0 and the lowest of the studied pattern values of the informational measure of symmetry H s y m = 0.569 . Pattern “c” is built from quadrangles only; thus, the Voronoi entropy of this pattern is zero. Only two elements of symmetry appear in this pattern, namely: the mirror plane and the 2 π -rotational symmetry (see Table 1), hence, the averaged uncertainty in the presence of symmetry elements is low. This implies the low value of the informational measure of symmetry H s y m . On the other hand, the continuous measure of symmetry, inherent for pattern “c”, quantifying the effort necessary for converting this pattern in a completely symmetrical manner is relatively high, namely at values S ˜ ( G ) = 0.1099   ( S ^ ( G ) = 33.15 % ) .
Thus, it turns out, that the least effort necessary for the transformation of the polygons in the pattern into perfectly symmetrical ones is inherent for pattern “b”, the lowest value of Voronoi entropy is established for the pattern “c”, and the same pattern demonstrates the smallest value of the informational measure of symmetry. It was instructive to define the ratio Ψ supplied by Equation (7):
Ψ = H s y m ( G ) S ˜ ( G ) ,
which is supplied in Table 2, where it is seen that for the studied Penrose-tiling-inspired patterns this ratio is confined within a broad range, namely: 5.18 < Ψ < 35.7 . This means that the values of the informational and continuous measures of symmetry are not correlated. At the same time, the value of the Voronoi entropy S v o r also does not correlate with the informational measure of symmetry H s y m ( G ) and the continuous measure of symmetry S ˜ ( G ) (see Table 2).
It should be emphasized that the entropy-like, mathematically shaped informational measure of symmetry H s y m ( G ) , defined by Equations (3) and (4), is the intensive value, describing the patterns generated by the Penrose tiling, in other words, it does not depend on the area of the pattern (when the edge effects are neglected); thus, it is very different from the extensive thermodynamic entropy, as is discussed in detail in references [5,6,7,8,9]. On the other hand, it is well-expected that IMS will undergo a jump under phase-transitions in quasicrystals; we plan to study this phase-transition-inspired change in IMS in the future. The extension of the IMS to the 3D lattices is straightforward.
Our paper clearly demonstrates that quantification of the “ordering” in 2D patterns performed solely with the Voronoi entropy is a widespread mistake. Consider the patterns presented in Figure 4. The pattern depicted in Figure 4a is built of k irregularly shaped quadrangles; whereas the pattern depicted in Figure 4b is built of k squares. Obviously the Voronoi entropy of both of these patterns equals zero; however, the pattern shown in Figure 4a is perceived as random (disordered), whereas the pattern built of squares and shown in Figure 4b is reasonably considered as an ordered one. The Voronoi entropy taken as a single measure of ordering fails to quantify order in this case. Now let us calculate IMS for these patterns. For the pattern built of irregular (nonsymmetric) quadrangles, shown in Figure 4a, we distinguish for all of the quadrangles constituting the pattern the single element of symmetry, namely the one-fold rotational symmetry reduced to the rotation by the angle φ 1 = k 2 π 1 = 2 π , denoted by G 1 . Thus, N G = k and P ( G 1 ) = 1 and consequently we calculate for this pattern H s y m ( G 1 ) = P ( G 1 ) l n P ( G 1 ) = 1 × l n 1 = 0 . Now we address the pattern built of identical squares, shown in Figure 4b. The symmetry group of a square is the dihedral group denoted usually as D 4 . It contains four rotations and four mirror axes; if we deal with the pattern comprising k squares we have N g = 8 p elements of symmetry. Thus, we easily calculate P ( G i ) = 8 8 k = 1 8 and, consequently, IMS calculated with Equation (3) equals H s y m ( D 4 ) = 2.08 .
This example explains why the Voronoi entropy does not correlate with the informational and continuous measures of symmetry. This is due to the fact that the Voronoi entropy is not directly related to the symmetry group inherent for the given pattern. So, what is the exact meaning of the Voronoi entropy? The Voronoi entropy should be accurately interpreted as an averaged uncertainty in the presence of n-polygons in the given 2D pattern.

4. Conclusions

We conclude that quantifying of ordering and quantifying of symmetry in the patterns is a multilayer, perplexed and challenging task. We introduced the informational measure of symmetry H s y m   ( G ) , defined as: H s y m ( G ) = i = 1 n P ( G i ) l n P ( G i ) , where P ( G i ) is the probability of appearance of the symmetry operation G i within the elements of the given pattern, which is mathematically shaped as the Shannon measure of information [1,2,5,6,7,8,9]. H s y m ( G ) is interpreted as an averaged uncertainty in the presence of symmetry elements from the group G in the given pattern. H s y m ( G ) may also be understood as a measure of the average unexpectedness of the presence of symmetry elements constituting group G in the given 2D pattern. Whatever is the interpretation of the informational measure of symmetry H s y m ( G ) , it supplies us with averaged information about the entire pattern, and it is not related to the specific symmetry operation G i . As an example, the informational measure of symmetry of the “ideal” pattern built of identical equilateral triangles is established as H s y m ( D 3 ) = 1.792. The informational measure of symmetry of the random, completely disordered pattern is zero. We studied the patterns arising from the Penrose P3 tiling and calculated the Voronoi entropy S v o r , the continuous measure of symmetry S ˜ ( G ) and the informational measure of symmetry inherent for these patterns. It is usually adopted that the Voronoi entropy quantifies ordering in 2D sets of points. It was also suggested that psychological perception of “order” is related to the Voronoi-like procedure; namely, neurophysiological and psychophysical data support the idea that that the human visual system generates a Voronoi-like representation at an early stage in visual processing, and human observers are aware of the relational structures revealed by the dual graph of Voronoi tessellation [42]. Our study of order inherent for the Penrose tiling shows that the notion of “order” splits, and could not be quantified with a single numerical value. We demonstrated that H s y m ( G ) , S ˜ ( G ) and S v o r are not correlated. In fact, the Voronoi entropy is not directly related to the symmetry group of the pattern. Our paper reveals the fine structure of quantification of symmetry of patterns: the informational measure of symmetry does not necessarily correlate with either the effort necessary for symmetrization of the pattern nor with its Voronoi entropy. Thus, quantification of symmetry of the pattern could not be exhausted with a single quantity. It should be emphasized that the introduced informational measure of symmetry is the intensive value, describing the patterns generated by the Penrose tiling, in other words, it does not depend on the area of the pattern (when the edge effects are neglected); thus, it is very different from the “true” extensive thermodynamic Boltzmann entropy [5,6,7,8,9]. It is plausible to suggest that the introduced “informational measure of symmetry” will enable an additional glance at the problem of phase transitions in condensed matter, accompanied by the change in the ordering/symmetry occurring under the transition. In our future investigations we plan to extend the use of the introduced informational measure of symmetry for the study of the patterns built of curvilinear shapes.

Author Contributions

Conceptualization, E.B., I.L. and M.F.; methodology, E.B., M.F., I.L., N.S. and S.S.; software, I.L., M.F. and N.S.; validation, E.B., M.F., I.L., N.S. and S.S.; formal analysis, E.B., M.F., I.L., N.S. and S.S.; investigation, I.L. and M.F.; N.S. and S.S.; data curation, E.B., M.F., I.L., N.S. and S.S.; writing—original draft preparation, E.B. and M.F.; supervision, E.B. and S.S.; project administration, S.S. All authors have read and agreed to the published version of the manuscript.

Funding

Edward Bormashenko and Mark Frenkel are thankful for funding to the Russian Science Foundation, Grant number 19-19-00076.

Institutional Review Board Statement

Not applicable.

Informed Consent Statement

Not applicable.

Data Availability Statement

The data that support the findings of this study are available on request from the corresponding author.

Acknowledgments

The authors are thankful to Yelena Bormashenko for her kind help in preparing this paper. The authors are thankful to anonymous reviewer for extremely fruitful remarks.

Conflicts of Interest

The authors declare no conflict of interest.

References

  1. Shannon, C.E. A Mathematical Theory of Communication. Bell Syst. Tech. J. 1948, 27, 379–423. [Google Scholar] [CrossRef] [Green Version]
  2. Shannon, C.E.; Weaver, W. The Mathematical Theory of Communication; The University of Illinois Press: Chicago, IL, USA, 1949. [Google Scholar]
  3. Landau, L.D.; Lifshitz, E.M. Statistical Physics, 3rd ed.; Course of Theoretical Physics; Elsevier: Oxford, UK, 2011; Volume 5. [Google Scholar]
  4. Kittel, C. Thermal Physics; J. Wiley & Sons: New York, NY, USA, 1969. [Google Scholar]
  5. Ben-Naim, A. Entropy, Shannon’s Measure of Information and Boltzmann’s H-Theorem. Entropy 2017, 19, 48. [Google Scholar] [CrossRef] [Green Version]
  6. Ben-Naim, A. Information Theory; World Scientific: Singapore, 2017. [Google Scholar]
  7. Ben-Naim, A. A Farewell to Entropy: Statistical Thermodynamics Based on Information; World Scientific: Singapore, 2008. [Google Scholar]
  8. Ben-Naim, A.; Casadei, D. Modern Thermodynamics; World Scientific: Singapore, 2016. [Google Scholar]
  9. Ben-Naim, A. Entropy and the Second Law. Interpretation and Misss-Interpretationsss; World Scientific: Singapore, 2012. [Google Scholar]
  10. Vstovsky, G.V. Transform information: A symmetry breaking measure. Found. Phys. 1997, 27, 1413–1444. [Google Scholar] [CrossRef]
  11. Gleiser, M.; Stamatopoulos, N. Information content of spontaneous symmetry breaking. Phys. Rev. D 2012, 86, 045004. [Google Scholar] [CrossRef] [Green Version]
  12. Bormashenko, E. Entropy, Information, and Symmetry: Ordered is Symmetrical. Entropy 2020, 22, 11. [Google Scholar] [CrossRef] [PubMed] [Green Version]
  13. Bormashenko, E. Entropy, Information, and Symmetry: Ordered Is Symmetrical, II: System of Spins in the Magnetic Field. Entropy 2020, 22, 235. [Google Scholar] [CrossRef] [Green Version]
  14. Zabrodsky, H.; Peleg, S.; Avnir, D. Continuous symmetry measures. J. Am. Chem. Soc. 1992, 114, 7843–7851. [Google Scholar] [CrossRef]
  15. Zabrodsky, H.; Peleg, S.; Avnir, D. Continuous symmetry measures. 2. Symmetry groups and the tetrahedron. J. Am. Chem. Soc. 1993, 115, 8278–8289. [Google Scholar] [CrossRef]
  16. Alemany, P.; Casanova, D.; Alvarez, S.; Dryzun, C.; Avnir, D. Continuous Symmetry Measures: A New Tool in Quantum Chemistry, Reviews in Computational Chemistry; Parrill, A.L., Lipkowitz, K.B., Eds.; Wliey, Interscience: Hoboken, NJ, USA, 2017; Volume 30, pp. 289–353. [Google Scholar]
  17. Zabrodsky, H.; Avnir, D. Continuous Symmetry Measures. 4. Chirality. J. Am. Chem. Soc. 1995, 117, 462–473. [Google Scholar] [CrossRef]
  18. Pinsky, M.; Avnir, D. Continuous Symmetry Measures. 5. The Classical Polyhedra. Inorg. Chem. 1998, 37, 5575–5582. [Google Scholar] [CrossRef]
  19. Zabrodsky, H.; Peleg, S.; Avnir, D. Symmetry as a continuous feature. IEEE Trans. Pattern Anal. Mach. Intel. 1995, 17, 1154–1166. [Google Scholar] [CrossRef] [Green Version]
  20. Pinsky, M.; Dryzun, C.; Casanova, D.; Alemany, P.; Avnir, D. Analytical methods for calculating Continuous Symmetry Measures and the Chirality Measure. Comput. Chem. 2008, 29, 2712–2721. [Google Scholar] [CrossRef] [PubMed]
  21. Bonjack, M.; Avnir, D. The near-symmetry of protein oligomers: NMR-derived structures. Sci. Rep. 2020, 10, 8367. [Google Scholar] [CrossRef]
  22. Sinai, H.E.; Avnir, D. Adsorption-induced Symmetry Distortions in W@Au12 Nanoclusters, Leading to Enhanced Hyperpo-larizabilities. Israel J. Chem. 2016, 56, 1076–1081. [Google Scholar] [CrossRef]
  23. Bormashenko, E.; Legchenkova, I.; Frenkel, M.; Shvalb, S. Voronoi Entropy vs Continuous Measure of Symmetry of the Penrose Tiling: Part I. Analysis of the Voronoi Diagrams. Symmetry 2021, 13, 1659. [Google Scholar] [CrossRef]
  24. Voronoi, G. Nouvelles applications des paramètres continus à la théorie des formes quadratiques. Deuxième mémoire. Recherches sur les paralléloèdres primitifs. Reine Angew. Math. 1908, 134, 198–287. [Google Scholar] [CrossRef]
  25. Barthélemy, M. Spatial networks. Phys. Rep. 2011, 499, 1–101. [Google Scholar] [CrossRef] [Green Version]
  26. Weaire, D.; Rivier, N. Soap, cells and statistics—Random patterns in two dimensions. Contemp. Phys. 1984, 25, 59–99. [Google Scholar] [CrossRef]
  27. Wang, S.; Tian, Z.; Dong, K.; Xie, Q. Inconsistency of neighborhood based on Voronoi tessellation and Euclidean distance. J. Alloys Compd. 2021, 854, 156983. [Google Scholar] [CrossRef]
  28. Fedorets, A.A.; Dombrovskyb, L.A. Self-assembled levitating clusters of water droplets: Pattern-formation and stability. Sci. Rep. 2017, 7, 1888. [Google Scholar] [CrossRef]
  29. Liu, Y.T.; Tao, C.L.; Zhang, X.; Xia, W.; Shi, D.Q.; Qi, L.; Xu, C.; Sun, R.; Li, X.; Bi, G.Q.; et al. Mesophasic organization of GABAA receptors in hippocampal inhibitory synapses. Nat. Neurosci. 2020, 23, 1589–1596. [Google Scholar] [PubMed]
  30. Fedorets, A.A.; Frenkel, M.; Bormashenko, E.; Nosonovsky, M. Small Levitating Ordered Droplet Clusters: Stability, Symmetry, and Voronoi Entropy. J. Phys. Chem. Lett. 2017, 8, 5599–5602. [Google Scholar] [CrossRef]
  31. Xu, K. Geometric formulas of Lewis’s law and Aboav-Weaire’s law in two dimensions based on ellipse packing. Philos. Mag. Lett. 2019, 99, 317–325. [Google Scholar] [CrossRef]
  32. Frenkel, M.; Arya, P.; Bormachenko, E.; Santer, S. Quantification of ordering in active light driven colloids. J. Colloid Interface Sci. 2021, 586, 866–875. [Google Scholar] [CrossRef]
  33. Bormashenko, E.; Frenkel, M.; Vilk, A.; Legchenkova, I.; Fedorets, A.A.; Aktaev, N.E.; Dombrovsky, L.A.; Nosonovsky, M. Characterization of self-assembled 2D patterns with Voronoi Entropy. Entropy 2018, 20, 956. [Google Scholar] [CrossRef] [PubMed] [Green Version]
  34. Frenkel, M.; Fedorets, A.A.; Dombrovsky, L.A.; Nosonovsky, M.; Legchenkova, I.; Bormashenko, E. Continuous Symmetry Measure vs Voronoi Entropy of Droplet Clusters. J. Phys. Chem. C 2021, 125, 2431–2436. [Google Scholar] [CrossRef]
  35. Bormashenko, E.; Legchenkova, I.; Frenkel, M. Symmetry and Shannon Measure of Ordering. Entropy 2019, 21, 452. [Google Scholar] [CrossRef] [Green Version]
  36. Mebatsion, H.K.; Verboven, P.; Verlinden, B.E.; Hoa, Q.T.; Nguyen, T.A.; Nicolaï, B.M. Microscale modelling of fruit tissue using Voronoi tessellations. Comput. Electron. Agric. 2006, 52, 36–48. [Google Scholar] [CrossRef]
  37. Steinhardt, P.; Jeong, H.C. A simpler approach to Penrose tiling with implications for quasicrystal formation. Nature 1996, 382, 431–433. [Google Scholar] [CrossRef]
  38. Shechtman, D.; Blech, I.; Gratias, D.; Cahn, J.W. Metallic phase with long-range orientational order and no translational symmetry. Phys. Rev. Lett. 1984, 53, 1951–1953. [Google Scholar] [CrossRef] [Green Version]
  39. Yaglom, A.M.; Yaglom, I.M. Probability and Information; Jain, V.K., Reidel, D., Eds.; Springer Science & Business Media: Berlin/Heidelberg, Germany, 1983. [Google Scholar]
  40. Limaye, A.V.; Narhe, R.D.; Dhote, A.M.; Ogale, S.B. Evidence for convective effects in breath figure formation on volatile fluid surfaces. Phys. Rev. Lett. 1996, 76, 3762–3765. [Google Scholar] [CrossRef] [PubMed] [Green Version]
  41. Martin, C.P.; Blunt, M.O.; Pauliac-Vaujour, E.; Stannard, A.; Moriarty, P.; Vancea, I.; Thiele, U. Controlling pattern formation in nanoparticle assemblies via directed solvent dewetting. Phys. Rev. Lett. 2007, 99, 116103. [Google Scholar] [CrossRef] [PubMed] [Green Version]
  42. Dry, M.J. Using relational structure to detect symmetry: A Voronoi tessellation based model of symmetry perception. Acta Psychol. 2008, 128, 75–90. [Google Scholar] [CrossRef] [PubMed]
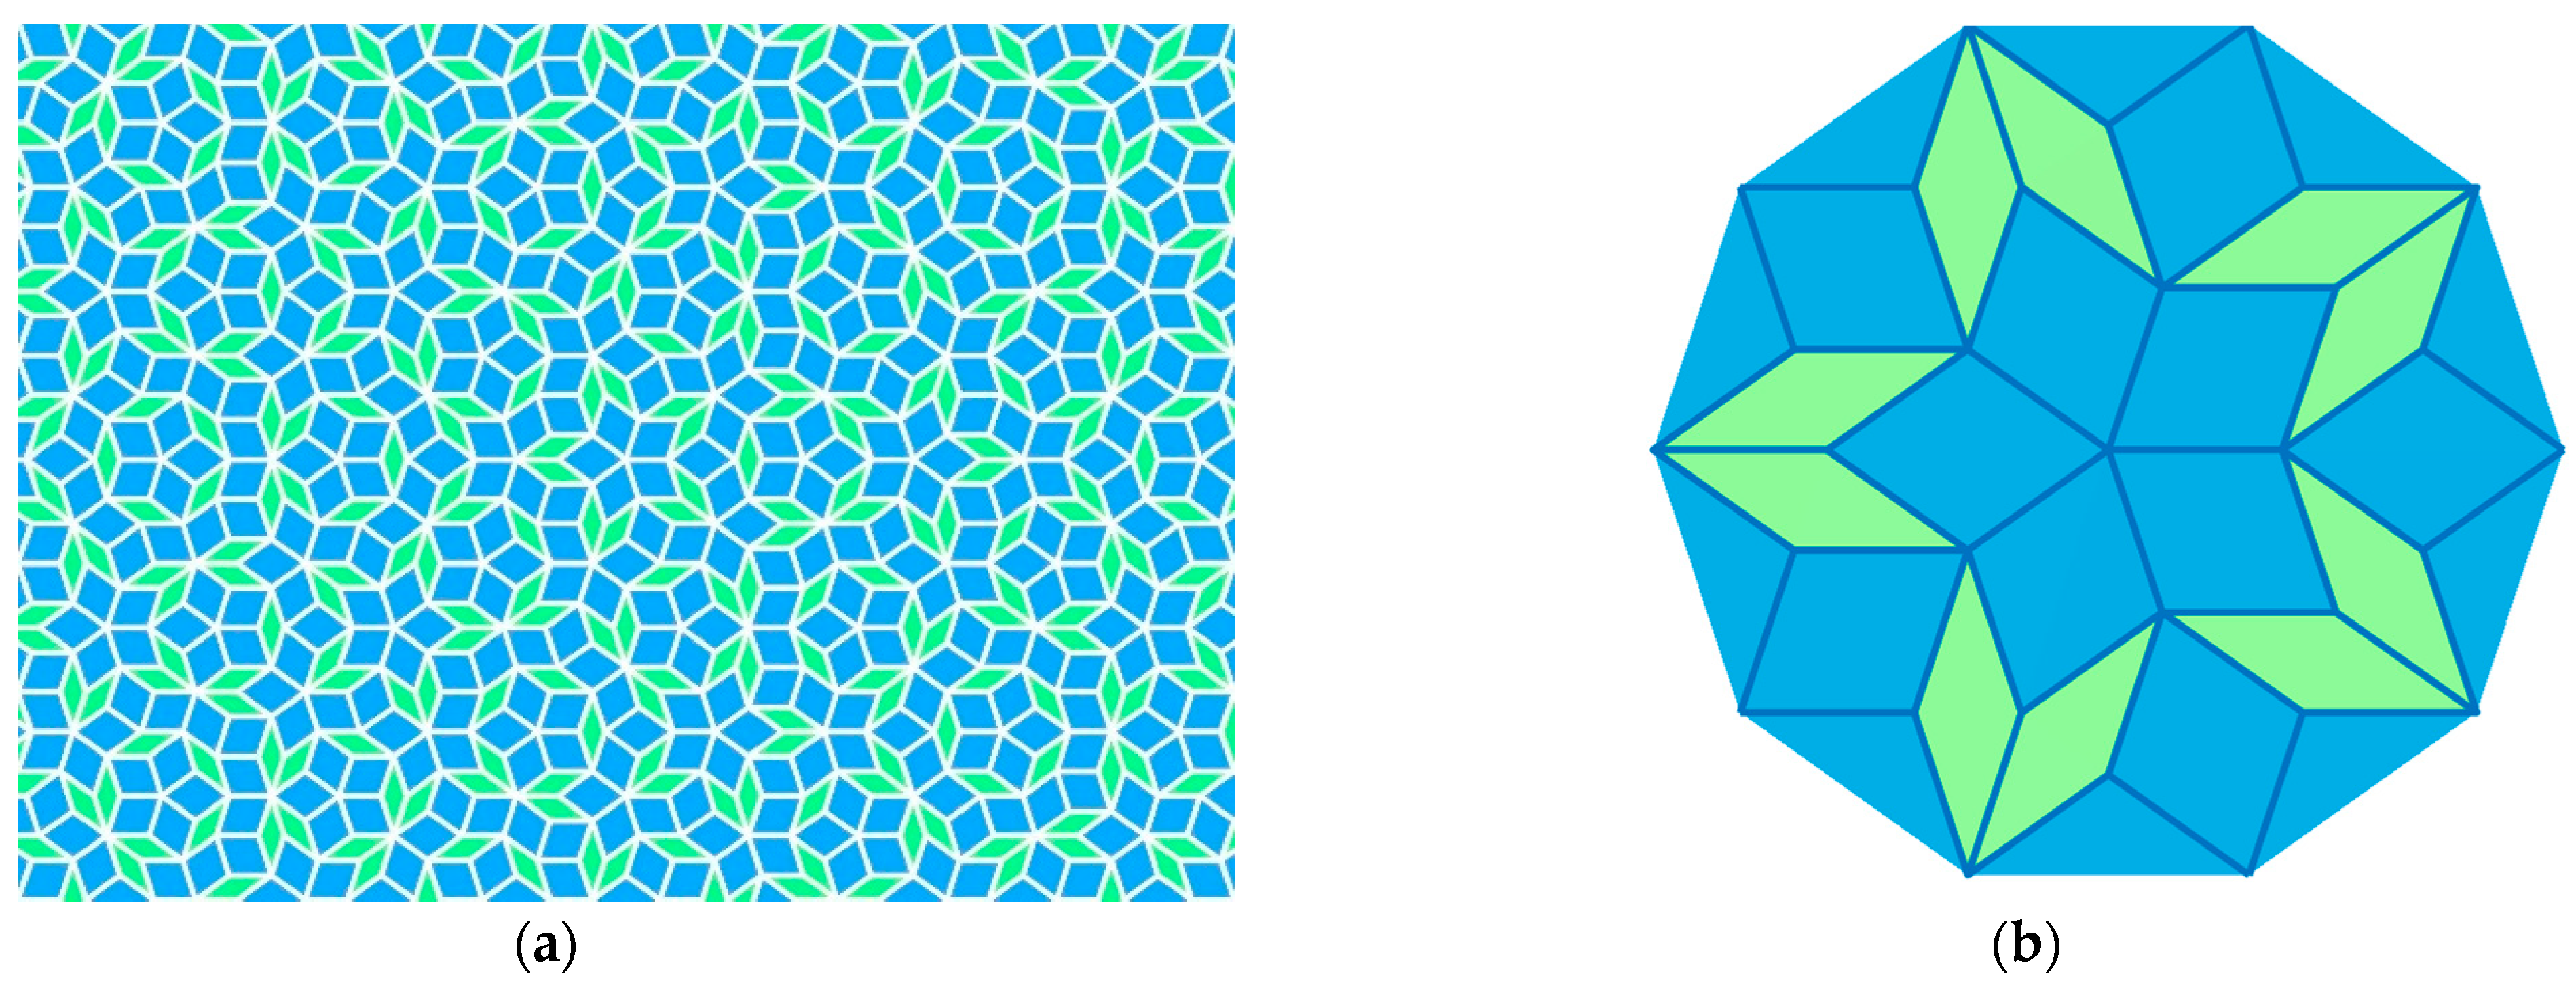
Figure 1. (a) The Penrose tiling P3 is depicted; (b) the structural unit of the Penrose tiling P3 is shown. The translation symmetry is absent in the pattern, however, the pattern demonstrates the five-fold rotational symmetry The Penrose tiling P3 demonstrates H s y m ( G ) = 1.386 for both of the patterns.
Symmetry 13 02146 g001
Figure 2. (a) Pattern (Voronoi tessellation) built of identical equilateral triangles, demonstrating: H s y m ( G ) = 1.792 ; S v o r = 0 ; S ^ ( G ) = 0 % is shown; (b) Pattern (Voronoi tessellation) built of different unsymmetrical polygons, demonstrating: H s y m ( G ) = 0 ; S v o r = 1.6103 ; S ^ ( G ) = 46.91 % is depicted.
Symmetry 13 02146 g002
Figure 3. Patterns emerging from the P3 Penrose tiling and their informational measure of symmetry (IMS) calculated with Equation (2). (a) a-type Voronoi tessellation; (b) b-type; (c) c-type; (d) ab-type (a and b-types combined); (e) ac-type; (f) bc-type; (g) abc-type (a, b, and c-types combined). Color mapping: magenta polygons are triangles, green are tetragons, yellow are pentagons, grey are hexagons, blue are heptagons.
Symmetry 13 02146 g003aSymmetry 13 02146 g003bSymmetry 13 02146 g003c
Figure 4. Two patterns built of quadrangles are presented. (a) pattern is perceived as random; (b) pattern built of squares is perceived as ordered; for both of the patterns S v o r = 0 takes place. The informational measures of symmetry H s y m calculated for these patterns are different.
Symmetry 13 02146 g004
Table 1. Symmetry elements presented in different types of Voronoi Diagrams generated by P3 Penrose tiling.
Diagram TypeMirror Planes Number ( m p )Number of Rotation Axes ( m r )
p 1 p 5.2 p 5.3 p 5.4 p 5.5 p 2.2 (2π)( 2 π 5 )( 4 π 5 )( 6 π 5 )( 8 π 5 )(π)
a60-----140-----
b1416 66-1416666-
c100-----290-----
ab30666661603116666160
ac65----35165----35
bc911111-1611111-
abc151111160221111160
m r is the total number of rotation axes corresponding to the rotation angle φ n = 2 π n . m p is the total number of corresponding mirror planes. p 1 denotes the single mirror plane. p n . k denotes k-type-mirror planes appearing in the polygon possessing n-fold symmetry. p 5.2 denotes the second-type mirror planes appearing in the 5-fold symmetric polygon.
Table 2. Informational measure of symmetry (IMS), Voronoi Entropy (VE) and Continuous Measure of Symmetry (CSM) Calculated for the Voronoi Diagrams generated by the Penrose tiling (see Figure 3).
Diagram TypePolygon Types NumberIMS,
H s y m
Voronoi Entropy, S v o r CSM
S ˜ ( G )
CSM
S ^ ( G ) %
Ψ
a40.6111.13640.113833.745.37
b31.3101.08470.036719.1535.70
c10.56900.109933.155.18
ab51.5661.1220.061924.8725.30
ac41.1611.10260.093130.5212.47
bc40.8351.03710.091230.29.16
abc31.3310.50260.051522.725.84
Publisher’s Note: MDPI stays neutral with regard to jurisdictional claims in published maps and institutional affiliations.