Article

Eigenvalue-Based Spectrum Sensing with Small Samples Using Circulant Matrix

1
School of Computer and Communication Engineering, University of Science and Technology Beijing, Beijing 100083, China
2
Shunde Graduate School, University of Science and Technology Beijing, Foshan 528000, China
3
State Radio Monitoring Center, Beijing 102609, China
*
Author to whom correspondence should be addressed.
Symmetry 2021, 13(12), 2330; https://doi.org/10.3390/sym13122330
Submission received: 11 October 2021 / Revised: 8 November 2021 / Accepted: 19 November 2021 / Published: 5 December 2021
(This article belongs to the Special Issue Symmetry/Asymmetry in Wireless Communication and Sensor Networks)

Abstract

:
In cognitive radio (CR) networks, eigenvalue-based detectors (EBDs) have attracted much attention due to their good performance of detecting secondary users (SUs). In order to further improve the detection performance of EBDs with short samples, we propose two new detectors: average circulant matrix-based Roy’s largest root test (ACM-RLRT) and average circulant matrix-based generalized likelihood ratio test (ACM-GLRT). In the proposed method, the circulant matrix of samples at each time instant from SUs is calculated, and then, the covariance matrix of the circulant matrix is averaged over a short period of time. The eigenvalues of the achieved average circulant matrix (ACM) are used to build our proposed detectors. Using a circulant matrix can improve the dominant eigenvalue of covariance matrix of signals and also the detection performance of EBDs even with short samples. The probability distribution functions of the detectors undernull hypothesis are analyzed, and the asymptotic expressions for the false-alarm and thresholds of two proposed detectors are derived, respectively. The simulation results verify the effectiveness of the proposed detectors.

1. Introduction

Cognitive radio (CR) can effectively improve spectrum resource utilization by allowing unlicensed users or secondary users (SUs) to use unoccupied spectrum holes. To avoid interference with the signals of licensed users or primary users (PUs), SUs are required to detect the presence of primary users utilizing the channel accurately and quickly. Therefore, spectrum sensing technology is most important in the implementation of cognitive radio systems.
The purpose of spectrum sensing is to quickly and accurately detect whether the frequency band is occupied by primary users. It enables cognitive users to opportunistically access idle frequency bands without interfering with the work of primary users according to the corresponding rules in the network. At the same time, in order to avoid harmful interference to primary users, it is still necessary to continuously perceive the surrounding spectrum environment during the use of the idle spectrum by secondary users. Once the primary user signal appears, SUs need to perform fast spectrum switching or exit the current frequency band to minimize interference to primary users.
The existing spectrum sensing algorithms can be divided into single-user spectrum sensing algorithms and cooperative spectrum sensing algorithms according to the number of cognitive users participating in sensing. Classic single-user spectrum sensing algorithms include: energy detection (ED), matched filter detection (MFD) and cyclostationary feature detection (CFD). Among them, the ED algorithm does not require any prior knowledge of primary users, and its implementation is simple and low in complexity, but it is susceptible to noise uncertainty [1]. The criterion of the matched filter detection algorithm is to maximize the output signal-to-noise ratio; therefore, it is the optimal detection method under the condition of known signal waveforms [2]. However, designing a matched filter requires a prior knowledge of primary user signals, the complexity of the device increases, and the synchronization requirements are high. The CFD algorithm is mainly a signal detection method designed for the modulated signal to have characteristics similar to periodicity. It can distinguish the noise energy from the energy of the modulated signal and has a strong ability to resist the uncertainty of noise power, but it needs to do periodic processing on the signal, resulting in a low efficiency in practical applications [3]. Cooperative spectrum sensing is used to enhance the sensing performance by exploiting the spatial diversity in the observations of SUs. By cooperation, SUs can share their sensing information in fusion center (FC), which makes a final decision more accurate than the local decisions at each SUs. There are many strategies to fuse the information from SUs. Among them, the cooperative sensing methods based on the eigenvalues of the covariance matrix of received signals by SUs have attracted widespread attention of researchers.
Eigenvalue-based detection (EBD) techniques has good application prospects because they do not require prior knowledge of the primary user signal and have a good detection performance [4,5,6,7,8]. The EBD can be further divided into semiblind detection under known noise variance and blind detection with noise uncertainty [5]. The Roy’s largest root test (RLRT) is considered as a nearly optimal detector in the case of known noise variance [9]. There are some blind sensing methods for unknown noise variance, such as the maximum–minimum eigenvalue (MME) [10,11,12,13,14], energy with minimum eigenvalue (EME) [15] detection, and the generalized likelihood ratio test (GLRT)-based methods [16,17,18,19]. The GLRT detector in [9,19] is considered as optimal under the generalized likelihood ratio (GLR) criterion, when noise variance is unknown. In addition, there are some other detectors based on EBD that have been proposed. For example, GLRT-based arithmetic to geometric mean (AGM) detection can achieve relatively outstanding performance without any prior information [18,20]. In [17], mean-to-square extreme eigenvalue (MSEE) is proposed to avoid the heavy computational costs of AGM detection method. We found that the detectors mentioned above often select the maximum or minimum eigenvalues of the sampling covariance matrix to form their test statistics. In order to characterize the performance of the detectors, the theoretical thresholds are analyzed under the assumption that the sample number of received signal by SUs is large and even goes to infinity [21,22]. This assumption is relevant in many applications in cognitive radio networks.
In this paper, we proposed two detectors to improve the detection performance of EBDs with small samples based on the average circulant matrix. Classical EBDs use the eigenvalues of the sampling covariance matrix of the received signals from SUs. Here, in our proposed detectors, each sample of received signals from SUs is collected by one fusion center which performs the detection decision. The circulant matrix of samples at each time instant from SUs is calculated, and then, the covariance matrix of the circulant matrix at each time instant is averaged for a period of time. The eigenvalues of the achieved average circulant matrix (ACM) are used to build our detectors based on RLRT and GLRT. From the numerical simulation results, using a circulant matrix can improve the dominant eigenvalue of covariance matrix of signals and obtain a better detection performance of EBDs even with small samples. Our contribution is as follows: (1) two new detector are proposed based on the eigenvalues of the ACM of received signals with small samples; (2) their probability distribution functions of proposed detectors under the null hypothesis are analyzed; (3) the asymptotic expressions for the false alarm and thresholds of two proposed detectors are derived. Simulation results show that the detection performance of the proposed method is better than some other EBDs. The asymptotic analyses match the simulation results well.
The rest of the paper is organized as follows: After introducing a system model in Section 2, we introduce the proposed detectors in Section 3. The performance analysis of two detectors is discussed in Section 4, and the simulation results are presented in Section 5. In Section 6, some conclusions are given.

2. System Model

In this paper, we consider centralized cooperative spectrum sensing scenarios in a cognitive radio network. Assume that there is a single primary user (PU), K secondary users (SUs), and a data fusion center (FC) in the cognitive radio system. K secondary users quickly detect the occupation of authorized channels by primary user in a cooperative manner. FC is used to collect the observed signals made by the SUs to make a final decision. The system model is shown in Figure 1.
The binary hypothesis is used here to model the detection problem: (1) H 0 , indicating that the primary user signal does not exist, and the signal received by the secondary user at this time is only noise; and (2) H 1 , indicating that the primary user signal exists. At this time, the signal received by the secondary user is the superposition of the primary user signal and the noise after the effects of channel multipath and attenuation. The hypothesis test can be expressed as
y ( n ) = v ( n ) H 0 y ( n ) = h · s ( n ) + v ( n ) H 1 ,
where s ( n ) is the transmit signal at sample n and the received data vector y ( n )   =   { y k ( n ) } T at sample n by SU and k = 0 , 1 , 2     K 1 . In addition, K × 1 vector h represents the channels coefficients between the primary users and K sensors. The K × 1 vector v ( n )   =   { v k ( n ) } T is assumed to be additive white Gaussian noise (AWGN) with mean zero and variance σ n 2 . The noise is independent identically distributed and uncorrelated with s ( n ) .
The received signal matrix of K secondary users of N samples in FC is:
Y = [ y ( 1 ) y ( 2 ) y ( N ) ] = y 1 ( 1 ) y 1 ( 2 ) · · · y 1 ( N ) y 2 ( 1 ) y 2 ( 2 ) · · · y 2 ( N ) · · · y K ( 1 ) y k ( 2 ) · · · y K ( N ) .
Let T be the detection statistic that distinguishes Hypothesis H 0 and Hypothesis H 1 . When the detection statistic is higher than the detection threshold τ , the primary user signal is considered to exist, otherwise, the primary user is considered not to exist, and the decision rule is defined as follows:
T τ H 0 T > τ H 1 ,
where τ is the detection threshold for spectrum sensing.
The detection performance of the spectrum detection algorithm is usually measured by the false-alarm probability P f and the detection probability P d , which are defined as follows:
P f = P r ( T > τ | H 0 ) P d = P r ( T > τ | H 1 ) .
In the practical analysis, constant false-alarm probability is used, and then the corresponding detection threshold is determined by the value of the target false-alarm probability. The detection performance of the spectrum sensing algorithm is measured by the detection probability P d .

3. Proposed Detectors

3.1. The Average of Circulant Matrix

For a single primary user and multiple secondary users, the data fusion center makes the final decision based on the data from multiple secondary users. The sampling signal received by the data fusion center at sampling time n ( n = 1 , 2 , , N ) is Y , which is a received data matrix and its sampling covariance matrix is expressed as: R = 1 N Y · Y H
Define the circulant matrix for a received vector of K SUs at n-th sample as Z n .
Z n = y 0 ( n ) y K 1 ( n ) · · · y 1 ( n ) y 1 ( n ) y 0 ( n ) · · · y 2 ( n ) · · · y K 1 ( n ) y K 2 ( n ) · · · y 0 ( n ) .
Define R n as
R n = { r k , j } n = Z n · Z n H ,
where r k , j are the ( k , j ) element of R n and j = 0 , 1 , , K 1 . · H represents the conjugate transpose. Then, the average of R n over N samples is
R ¯ = { r ¯ k , j } = 1 N n = 1 N R n ,
where r ¯ k , j is the ( k , j ) element of R ¯ . Since Z n is a circulant matrix, R n and R ¯ are circulant matrices, too. Suppose r n = { r k , 1 } n is the first column element of matrix R n .
r ¯ = { r ¯ k , 1 } = 1 N n = 1 N r n .
Then we have [23]
F T ( r n ) = F T ( y ( n ) ) 2 ,
where F T ( · ) denotes discrete Fourier transform.
Suppose λ m to be the eigenvalues of R ¯ , where m = 0 , 1 , , K 1 , then we obtain [24]
λ m = Φ ( m ) = k = 0 K 1 r ¯ · e j ω m k ,
where ω m = 2 π m K . By substituting (6), (8), and (9) into (10), we have
λ ω = Φ ( m ) = k = 0 K 1 ( 1 N n = 1 N r n e j ω m k ) = n = 1 N ( 1 N k = 0 K 1 r n e j ω m k ) = n = 1 N ( 1 N k = 0 K 1 y k ( n ) e j ω m k 2 ) = n = 1 N A n ( m ) ,
where A n ( m ) = 1 N k = 0 K 1 y k ( n ) e j ω m k 2 . Due to the conjugate symmetry property of DFT, eigenvalues λ 0 ,   λ 1 ,   λ 2 , , λ k 1 are symmetrical, and only eigenvalues λ 0 ,   λ 1 ,   λ 2 , , λ K 2 are considered in the following sections, where K 2 is K 2 when K is even or K 1 2 when K is odd.
Traditional RLRT and GLRT methods use random matrix to construct signals. Because of randomness, the result is uncertain, which leads to low efficiency of signal reconstruction. Due to the large amount of measurement data, the coefficients are random, and the calculation speed of dense matrix is slow. The circulant matrix is efficient and fast and needs less measurement in signal acquisition. The circulant matrix is a kind of structural matrix which is determined by circulant permutation with predefined vectors. Because of the reduction of random coefficients in the circulant matrix, the multiplication is fast.

3.2. The Distribution of Eigenvalues of R ¯ under the H 0

According to Theorem 6.1.1 of [25], under H 0 , y k is a Gaussian purely random process with zero mean and variance σ n 2 , then the A n ( m ) , where m = 0 ,   1 , , K 2 , are independently distributed, and Φ ( m ) , m = 0 ,   1 , , K 2 are mutually independent random variables.
If X k is a pure Gaussian random process with mean 0 and variance σ x 2 , and I m = 2 N k = 0 K 1 X k ( n ) e j ω m k 2 , w m = 2 π m K , m = 0 , 1 , , K 2 , then I m distributes independently. For each m, the following relationship is satisfied [25]:
I m σ x 2 · χ 2 2 m 0 , [ K 2 ] 2 σ x 2 · χ 1 2 m = 0 , [ K 2 ] ,
where χ 1 2 represents the chi-square distribution with 1 degree of freedom, χ 2 2 represents the chi-square distribution with 2 degrees of freedom, and χ 2 2 can also be expressed as an exponential distribution with a parameter of 1/2.
Comparing I m and A n ( m ) , we have I m = 2 A n ( m ) . Thus for A n ( m ) , the following relationship is satisfied:
A n ( m ) 1 2 σ n 2 · χ 2 2 m 0 , [ K 2 ] σ n 2 · χ 1 2 m = 0 , [ K 2 ] .
If X χ ν 2 , χ ν 2 represents the chi-square distribution with υ degree of freedom. For any c > 0 , c X Γ ( k = ν 2 , θ = 2 c ) , Γ ( k = ν 2 , θ = 2 c ) represents the gamma distribution with shape parameter ν 2 and scale parameter 2 c [26]. So σ n 2 χ 1 2 is a gamma distribution with shape parameter 1/2 and scale parameter σ n 2 . Then, σ n 2 χ 1 2 Γ ( 1 2 , 2 σ n 2 ) . In the same way, 1 2 σ n 2 χ 2 2 Γ ( 1 , σ n 2 ) .
Let A n ( m ) = K N · A n ( m ) , and then,
A n ( m ) exp ( K N σ n 2 ) m 0 , [ K 2 ] Γ ( 1 2 , 2 K N σ n 2 ) m = 0 , [ K 2 ] .
From (11), Φ ( m ) = n = 1 N A n ( m ) . According to Section 2.2 of [27], we have
λ m = Φ ( m ) Γ ( N , K N σ n 2 ) m 0 , [ K 2 ] Γ ( N 2 , 2 K N σ n 2 ) m = 0 , [ K 2 ] .

3.3. The Detector ACM-RLRT under Unknown Noise Variance

In the case of known noise variance, according to the expression of RLRT [9], we express the proposed detector ACM-RLRT as
T = λ max σ n 2 = max ( T m ) ,
where λ m is the maximum eigenvalue of R ¯ and T = λ max σ n 2 , m = 0 , 1 , , K 2 .

3.4. The Detector ACM-GLRT under Unknown Noise Variance

According to GLRT-based EBD [20], the proposed detector of ACM-GLRT can be defined as,
T = K · λ max tr ( R ¯ ) ,
where tr ( R ¯ ) = m = 0 K 1 λ m is the trace of R ¯ . From Theorem 6.1.1 of [25] and (15), the eigenvalues λ m = Φ ( m ) are independent only for m = 0 , 1 , , K 2 . In addition, the numerator and the denominator of T are not independent. It is difficult to deduce the theoretical expression of PDF of T . Therefore, we modified the expression of the ACM-GLRT detector as,
T = max ( T m ) ,
where
T m = λ m m = 1 K / 2 1 λ m λ m ( K 2 2 ) m 0 , [ K 2 ] λ m m = 1 K / 2 1 λ m ( K 2 1 ) m = 0 , [ K 2 ] .
In the modified statistic, the numerator of (19) is independent of the denominator. The modification makes it possible to give the asymptotic expression of PDF for T .

4. Performance Analysis

4.1. Performance Analysis of ACM-RLRT with Known Noise Variance

Suppose the noise variance to be σ n 2 . According to Gamma distribution theory [25], if X Γ ( β , γ ) , and c > 0 , Y = cX, then X Γ ( β , c γ ) . From (15), we have
T m = λ m σ n 2 Γ ( N , K N ) m 0 , [ K 2 ] Γ ( N 2 , 2 K N ) m = 0 , [ K 2 ] .
In addition, the false-alarm probability is
P f = P r ( T > τ | H 0 ) = P r ( max ( T m ) > τ | H 0 ) = 1 m = 0 K 2 P r ( T m τ | H 0 ) = 1 - Γ ( τ ; N , K N ) K 2 1 · Γ ( τ ; N 2 , 2 K N ) 2 ,
where Γ ( τ ; ζ , φ ) indicates the Γ ( ζ ; φ ) distribution with the argument τ . The threshold τ can be determined by (21), given P f = α , 0 < α 1 .

4.2. Performance Analysis of ACM-GLRT with Unknown Noise Variance

Since λ m have a gamma distribution and express the denominator of (19) as
D = m = 1 K / 2 1 λ m λ m m 0 , [ K 2 ] m = 1 K / 2 1 λ m m = 0 , [ K 2 ] .
From the gamma distribution theory [28], if X 1 X n are independent random variables and obey Γ ( α i , β ) , i = 1 , , n , then Y = i = 1 n X i , Y Γ ( i = 1 n α i , β ) . According to (15) and (22), then
D Γ ( ( K 2 2 ) N , K N σ n 2 ) m 0 , [ K 2 ] Γ ( ( K 2 1 ) N , K N σ n 2 ) m = 0 , [ K 2 ] .
From the distribution theory of gamma function ratio [29,30], if X 1 Γ α 1 , θ 1 and X 2 Γ α 2 , θ 2 are independent of each other, then α 2 θ 2 X 1 α 1 θ 1 X 2 follows the F distribution with parameters 2 α 1 and 2 α 2 , that is expressed as α 2 θ 2 X 1 α 1 θ 1 X 2 F ( 2 α 1 , 2 α 2 ) .
According to (15), (19), and (23),
T m F ( 2 N , 2 ( K 2 2 ) N ) m 0 , [ K 2 ] F ( N , ( K 2 1 ) N ) m = 0 , [ K 2 ] ,
where F α , γ denotes F distribution with parameters α and γ .
From (24), we have the false-alarm probability of ACM-GLRT
P f = P r ( T > τ | H 0 ) = P r ( max ( T m ) > τ | H 0 ) = 1 m = 0 K 2 P r ( T m τ | H 0 ) = 1 - F ( τ ; 2 N , 2 N ( K 2 2 ) ) K 2 1 · F ( τ ; N , ( K 2 1 ) N ) 2 ,
where F ( τ ; ζ , φ ) indicates F ( ζ ; φ ) distribution with the argument τ . The threshold τ can be found given P f .

4.3. Computational Complexity

In spectrum sensing, the computational cost mainly focuses on the computation of test statistic and the decision threshold. The threshold can be calculated ahead and used as a table during the detection. Thus, the main cost lies in the test statistic.
As for the computation of test statistic, the difference between our proposed schemes and existing schemes is how to obtain the eigenvalues used in the detectors. Our proposed schemes first use the eigenvalues of expending the received vector of K SUs at n-th sample into its K × K circulant matrix and then averaging the circulant matrix over samples. The eigenvalues are achieved by using fast Fourier transform (FFT) to the covariance matrix of an average circulant matrix. Our proposed schemes have two additional steps: obtaining the circulant matrix of receiving vectors and averaging. These steps are proposed by just shifting and the summation of O ( K + N ) , where N is the sample size. The computational complexity of FFT is O ( K log K ) ; therefore, the total complexity is O ( K + N + K log K ) where K < N . Existing schemes use the eigenvalues of the K × K covariance matrix of the received vector of K SUs. In [14], the iterative power method is applied for computing these eigenvalues from an implementation perspective. This has the time complexity of O ( K 2 ) . For short samples (such as, N = 20 and K = 8 ), our proposed schemes have a smaller cost than the existing schemes.

5. Simulation Results

In this section, we first show the influence of a circulant matrix on the eigenvalues of the covariance matrix as well as the histogram of proposed methods under binary hypothesis. Then, the performance of the two proposed detectors is verified with ROC curves. In addition, we provide a performance comparison between the proposed methods and several typical previous works.
We assume there are one PU and eight SUs in the CR networks. In addition, each SU is equipped with an antenna. Both PU signal and noise follow Gaussian distribution with mean zero but different variance.

5.1. The Effect of Circulant Matrix on Eigenvalues of Covariance Matrix

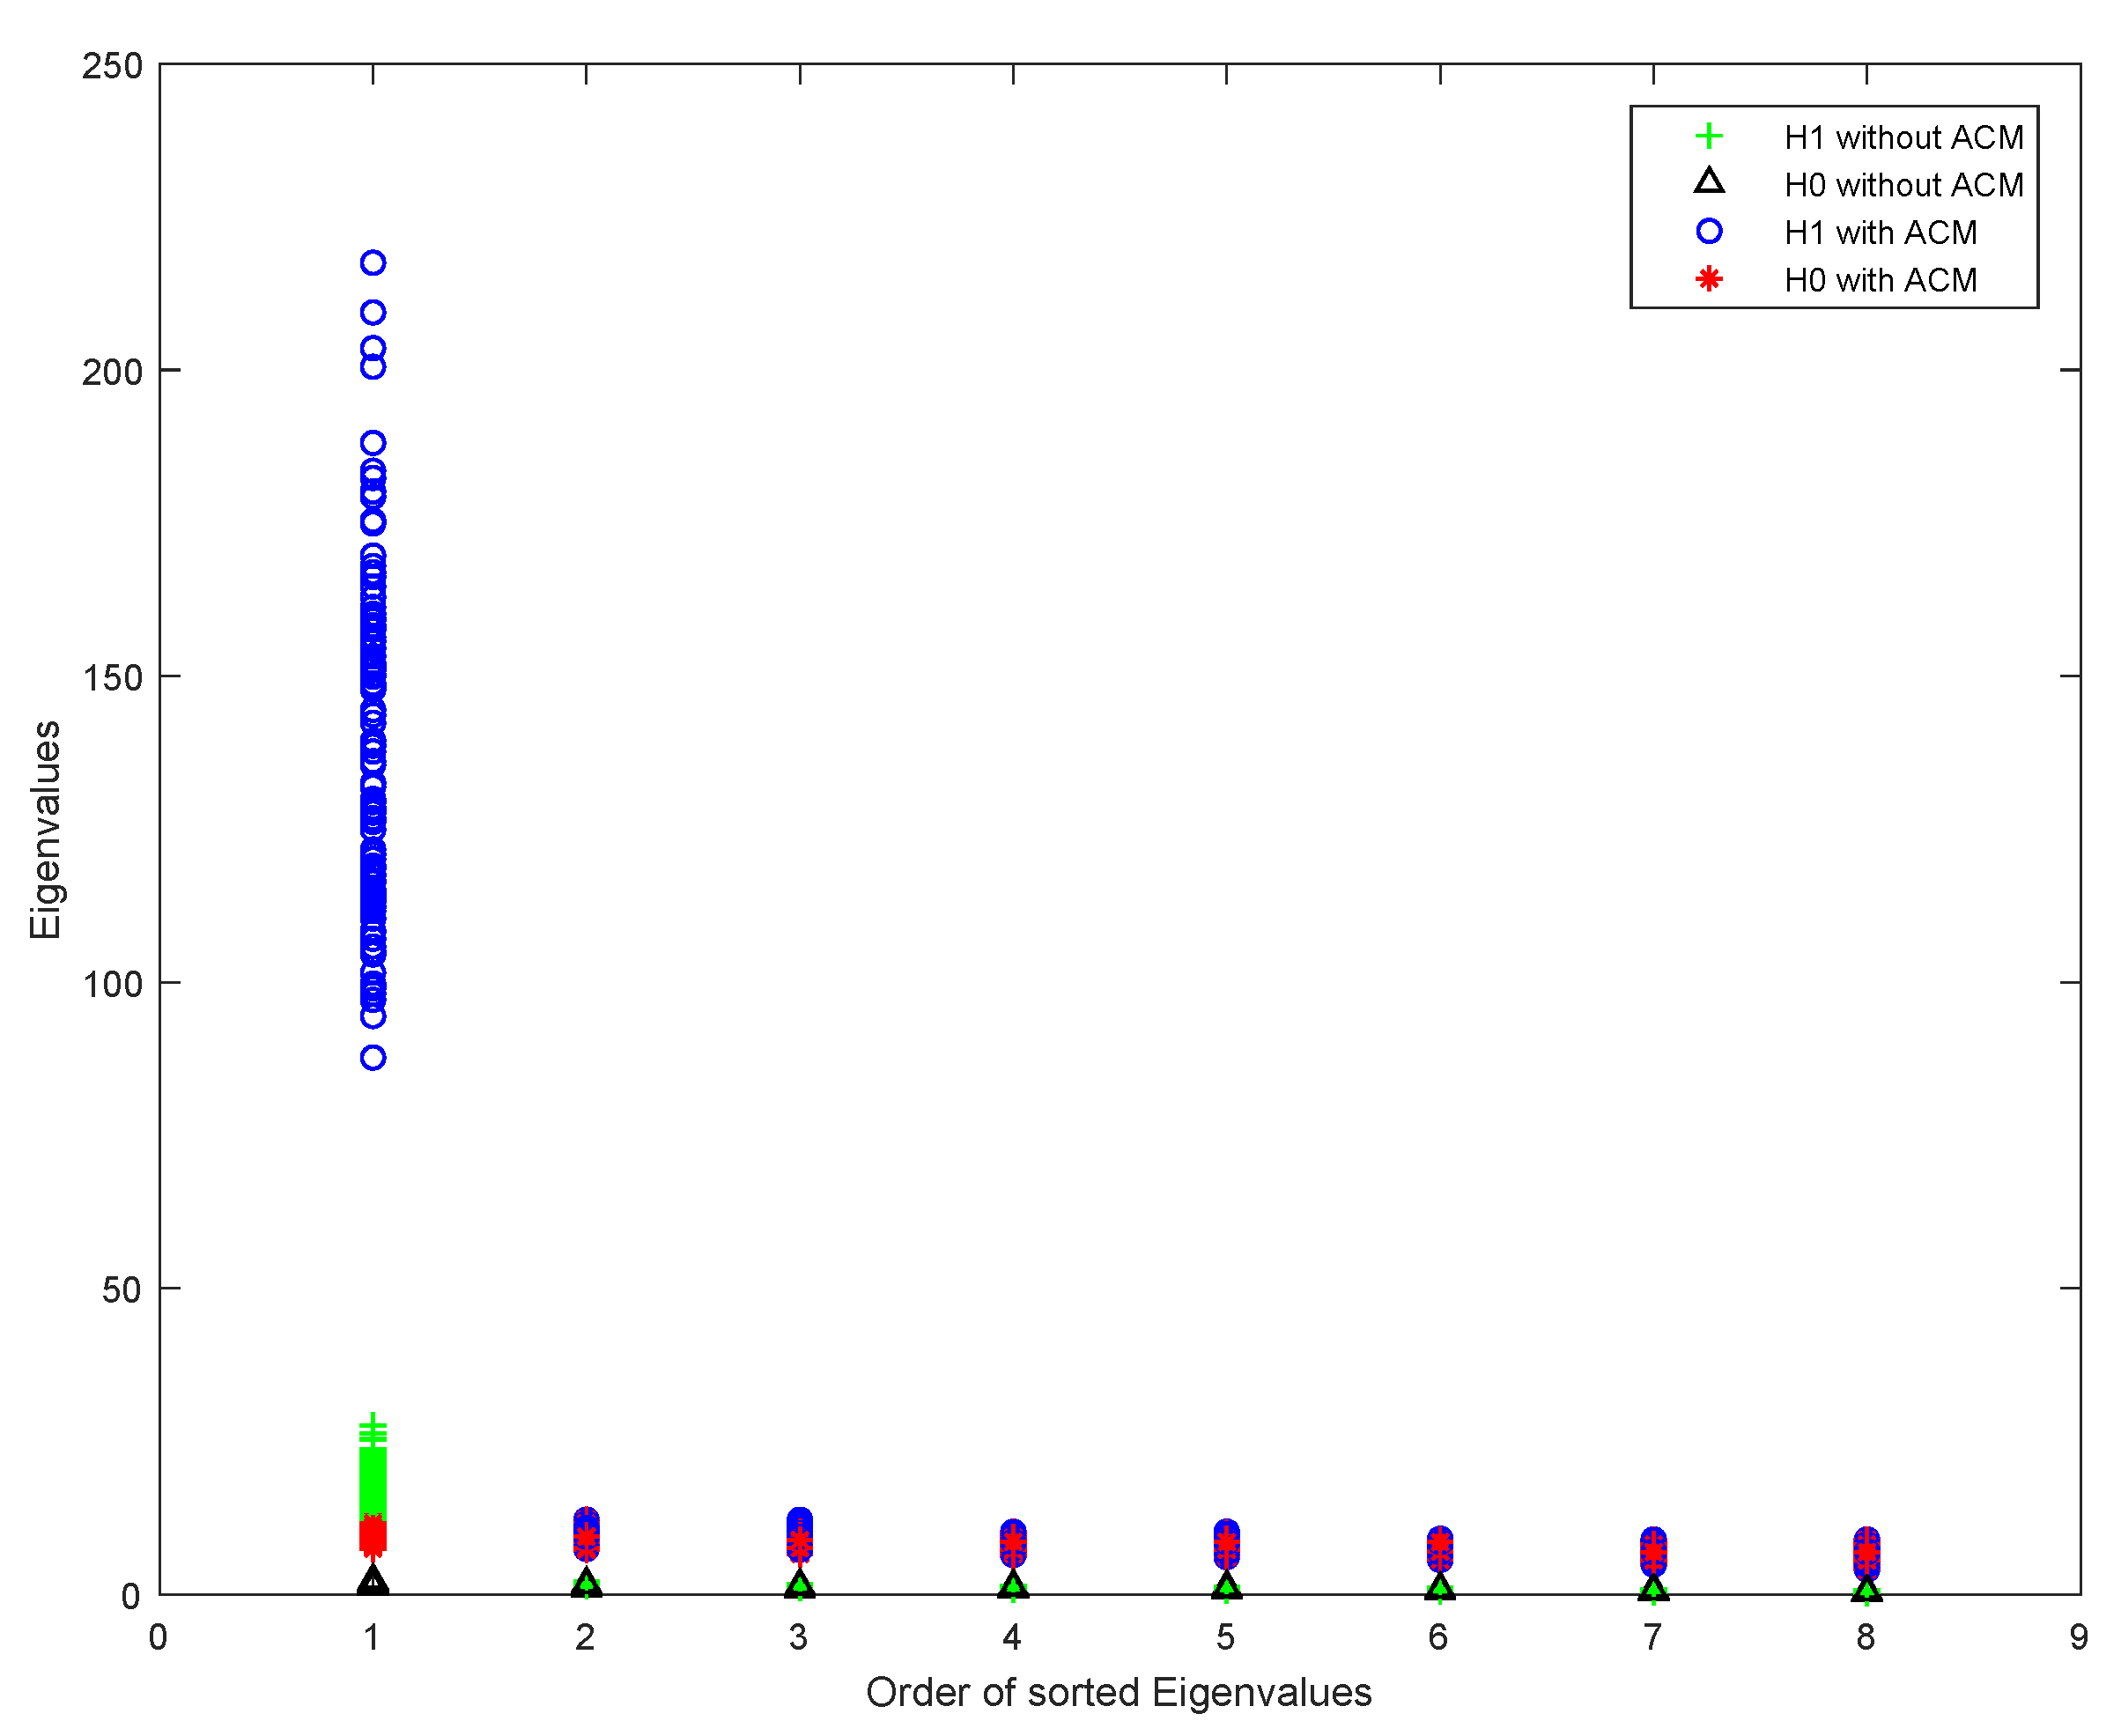
In our proposed detectors, the circulant matrix technique is used to improve the dominant eigenvalue of the covariance matrix. Figure 2 gives an example of the sorted eigenvalues of two different covariance matrix: R ¯ (with the circulant matrix technique) and R (without the circulant matrix technique) under the hypothesis H 1 and H 0 at SNR = 3 dB with 100 repeats. Since we consider a single primary user signal in this paper, there is only one dominant eigenvalue under H 1 . It can be seen from Figure 2 that the dominant eigenvalues of R ¯ with ACM have an extended range. However, the gap with ACM between H 1 and H 0 is wider than that without ACM, which helps to improve the detection performance.
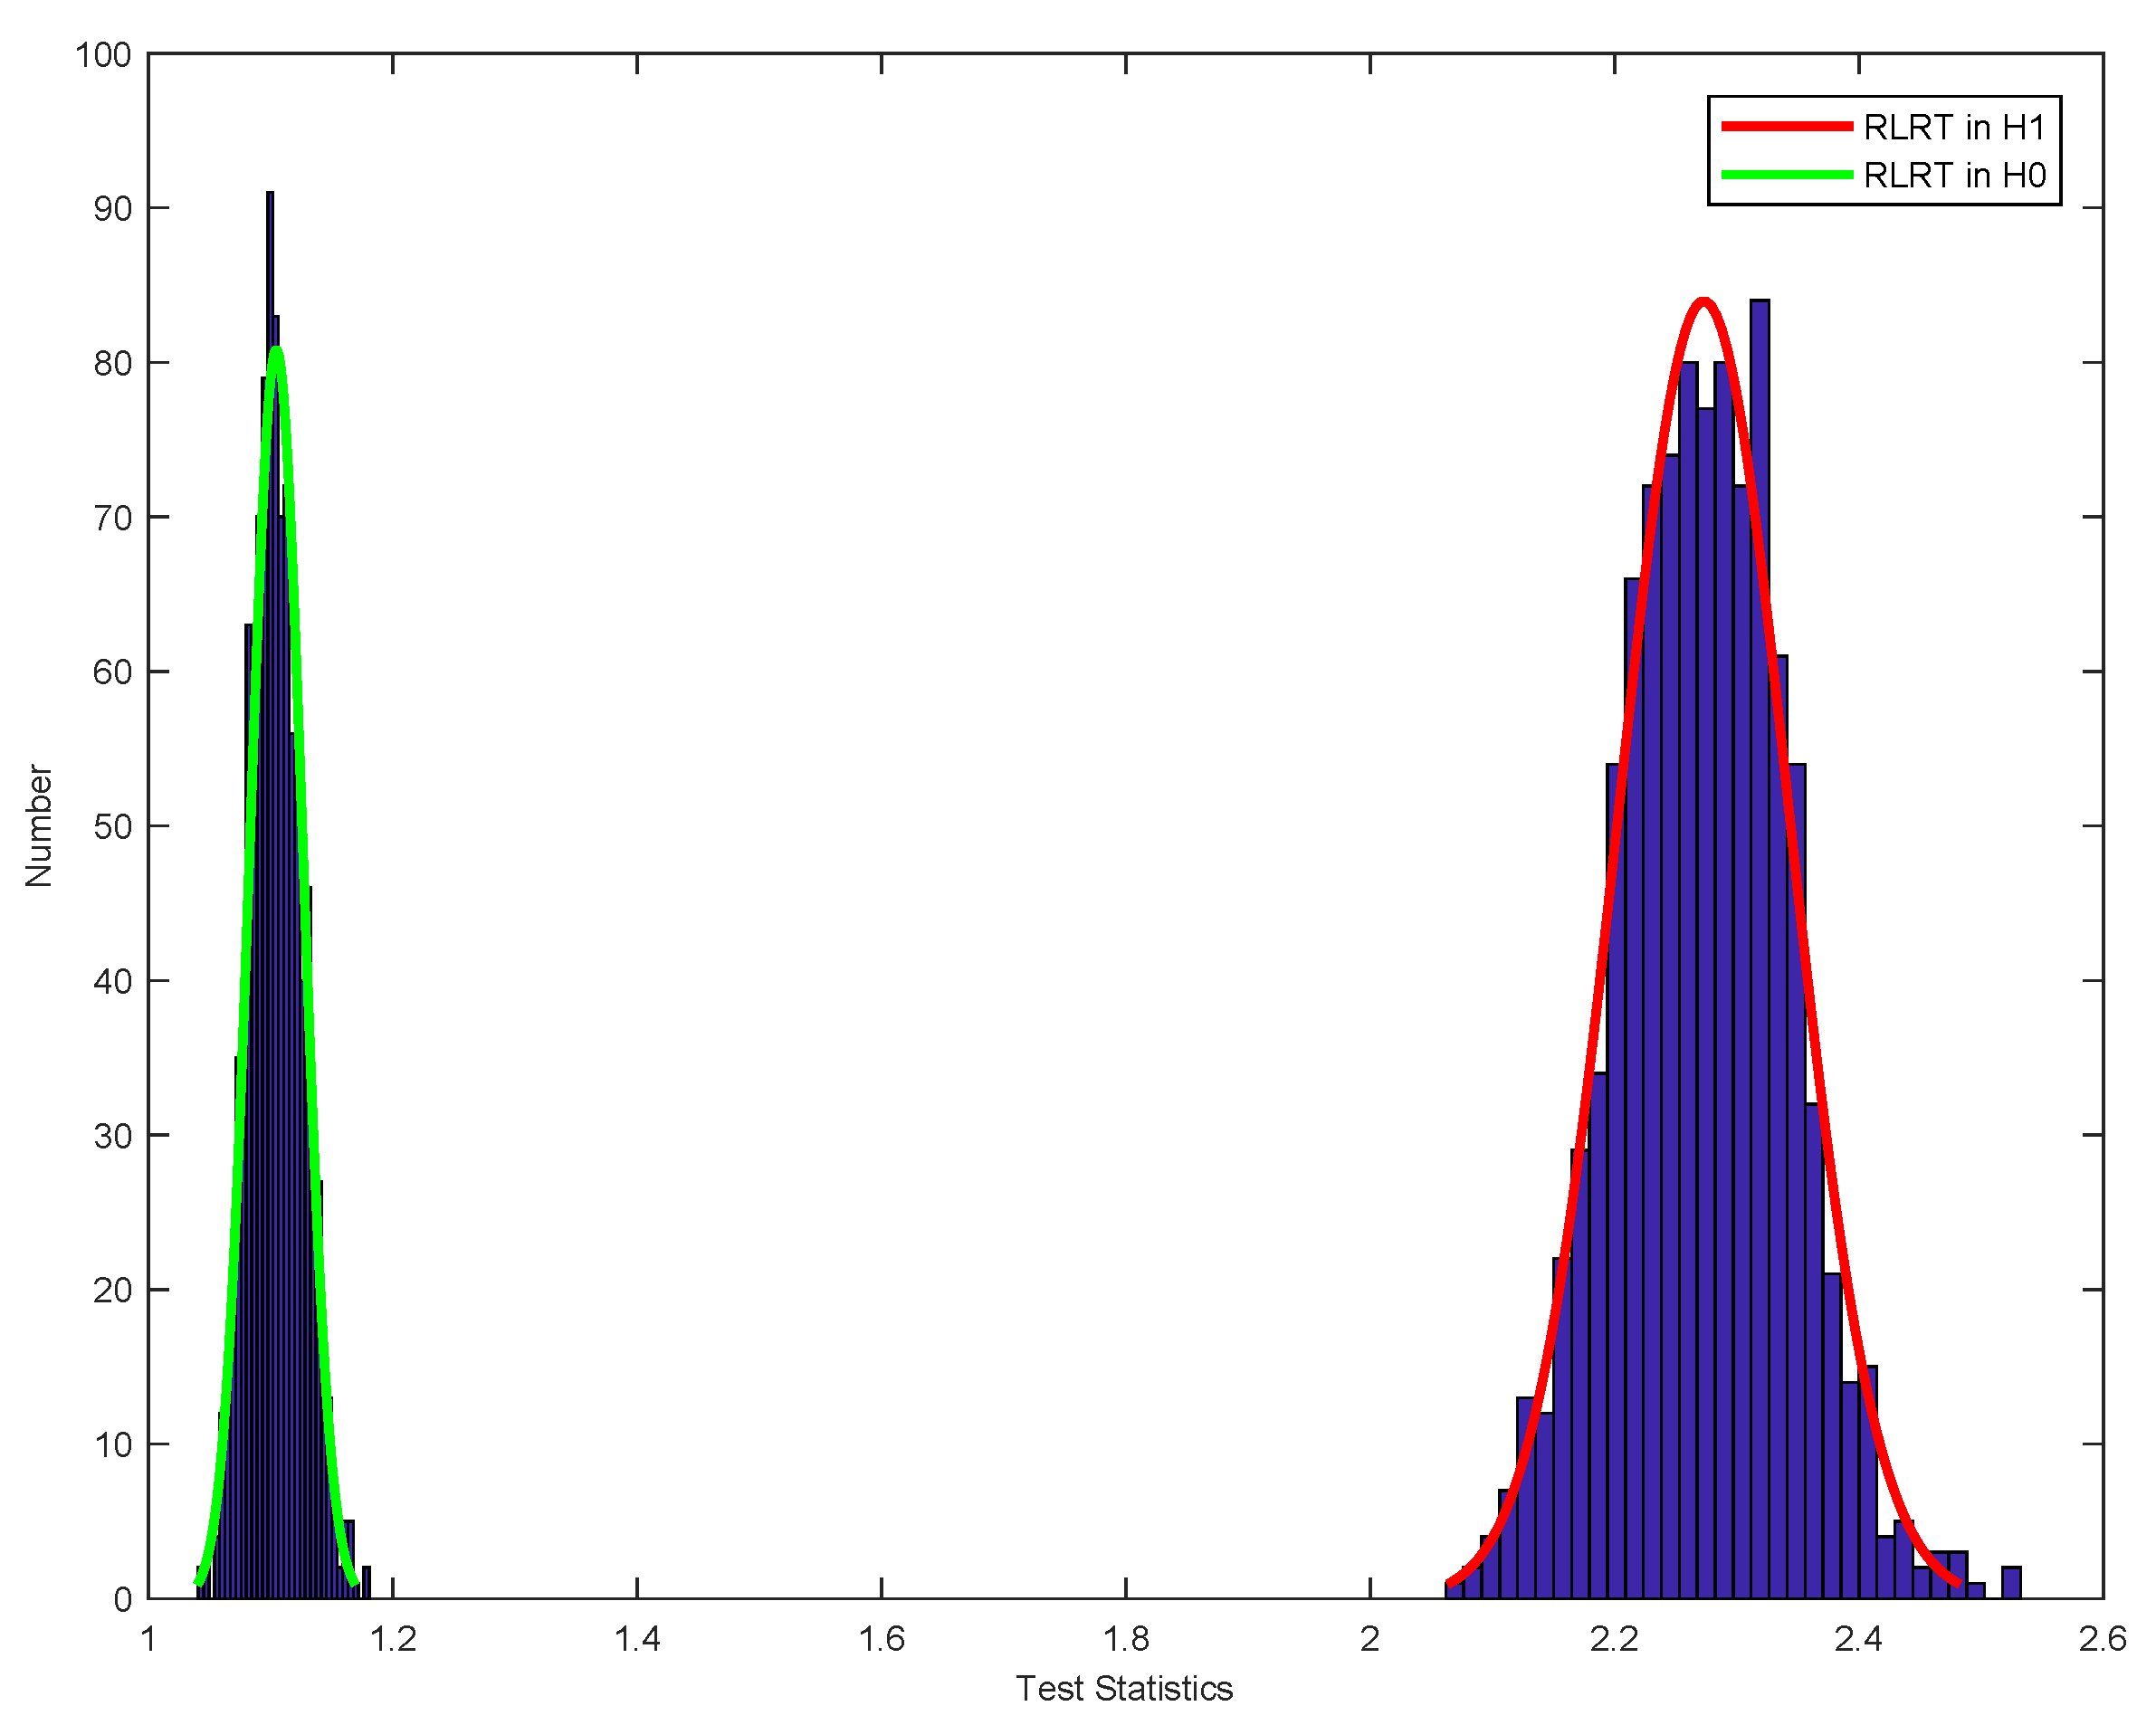
To show the effect of the circulant matrix on the test statistic of EBDs, Figure 3, Figure 4, Figure 5 and Figure 6 give the histogram of the test statistics of the four different detectors. In Figure 3 and Figure 4, we can see the comparison of the probability distribution function of test statistic of RLRT with ACM-RLRT under hypothesis H 0 and H 1 . With the circulant matrix technique, the test statistic of ACM-RLRT has the wider gap between H 0 and H 1 than RLRT. We also notice that the ACM-RLRT has an extended PDF. These two effects on the test statistic match the simulation results of eigenvalues.
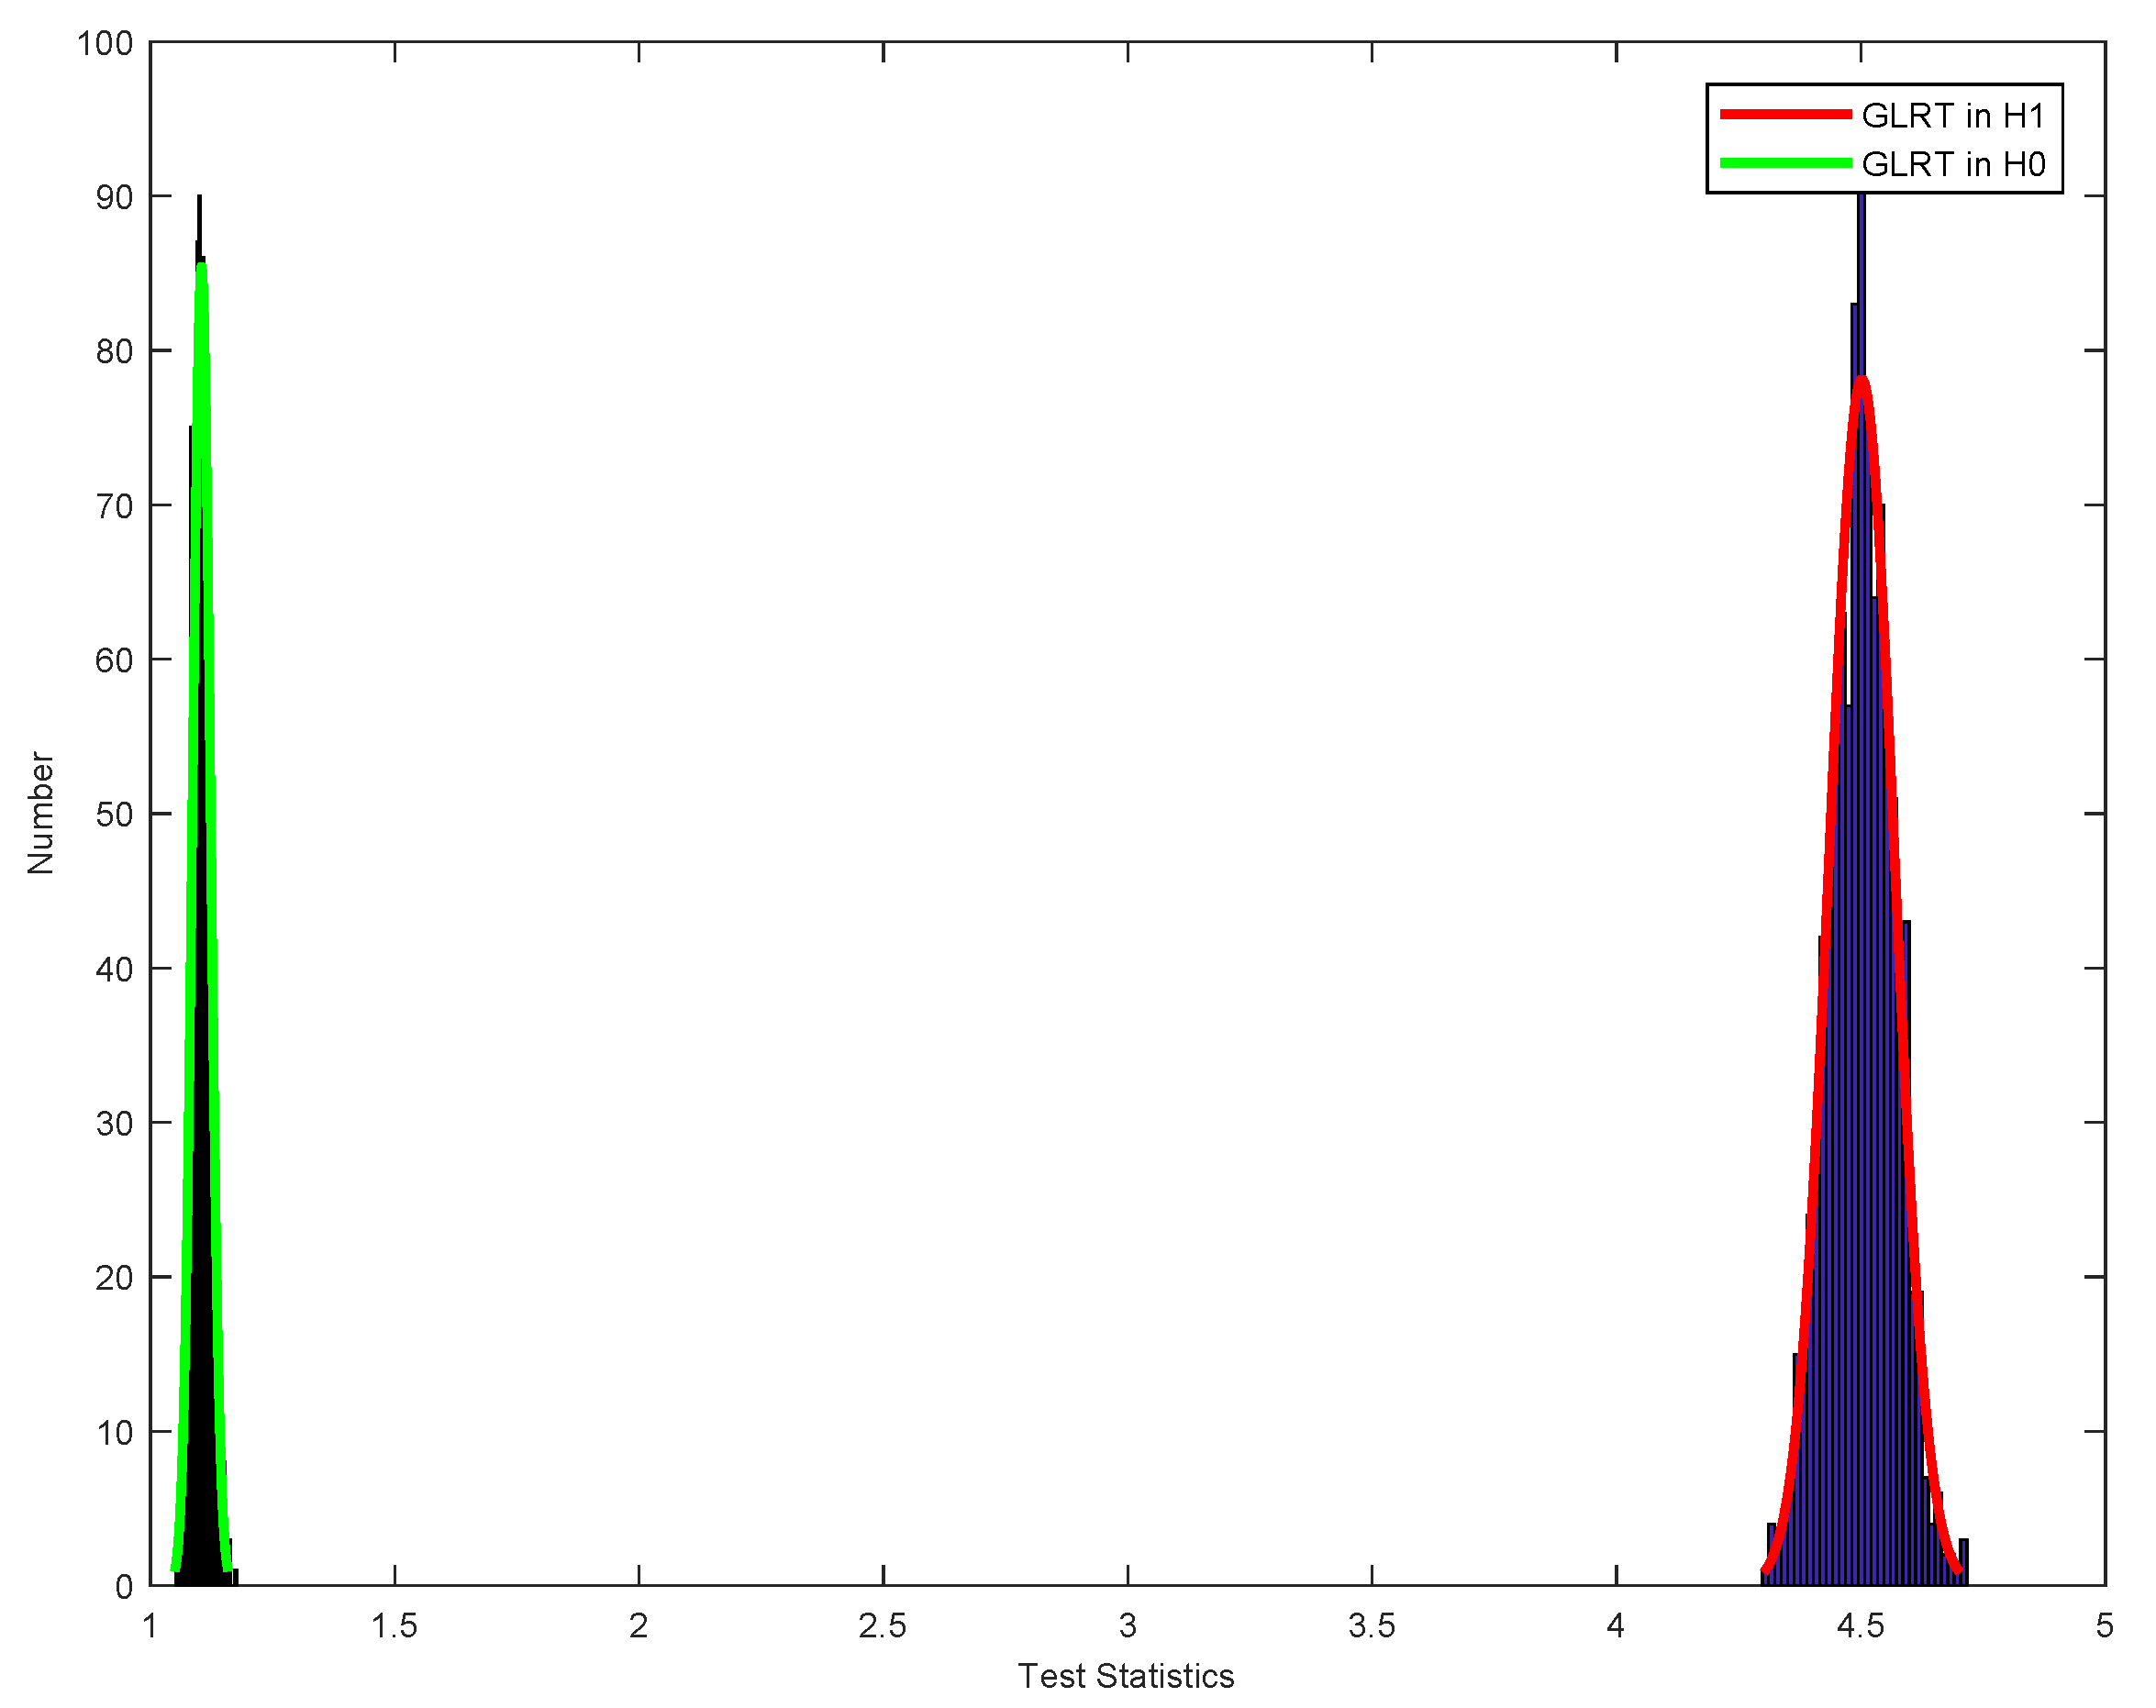
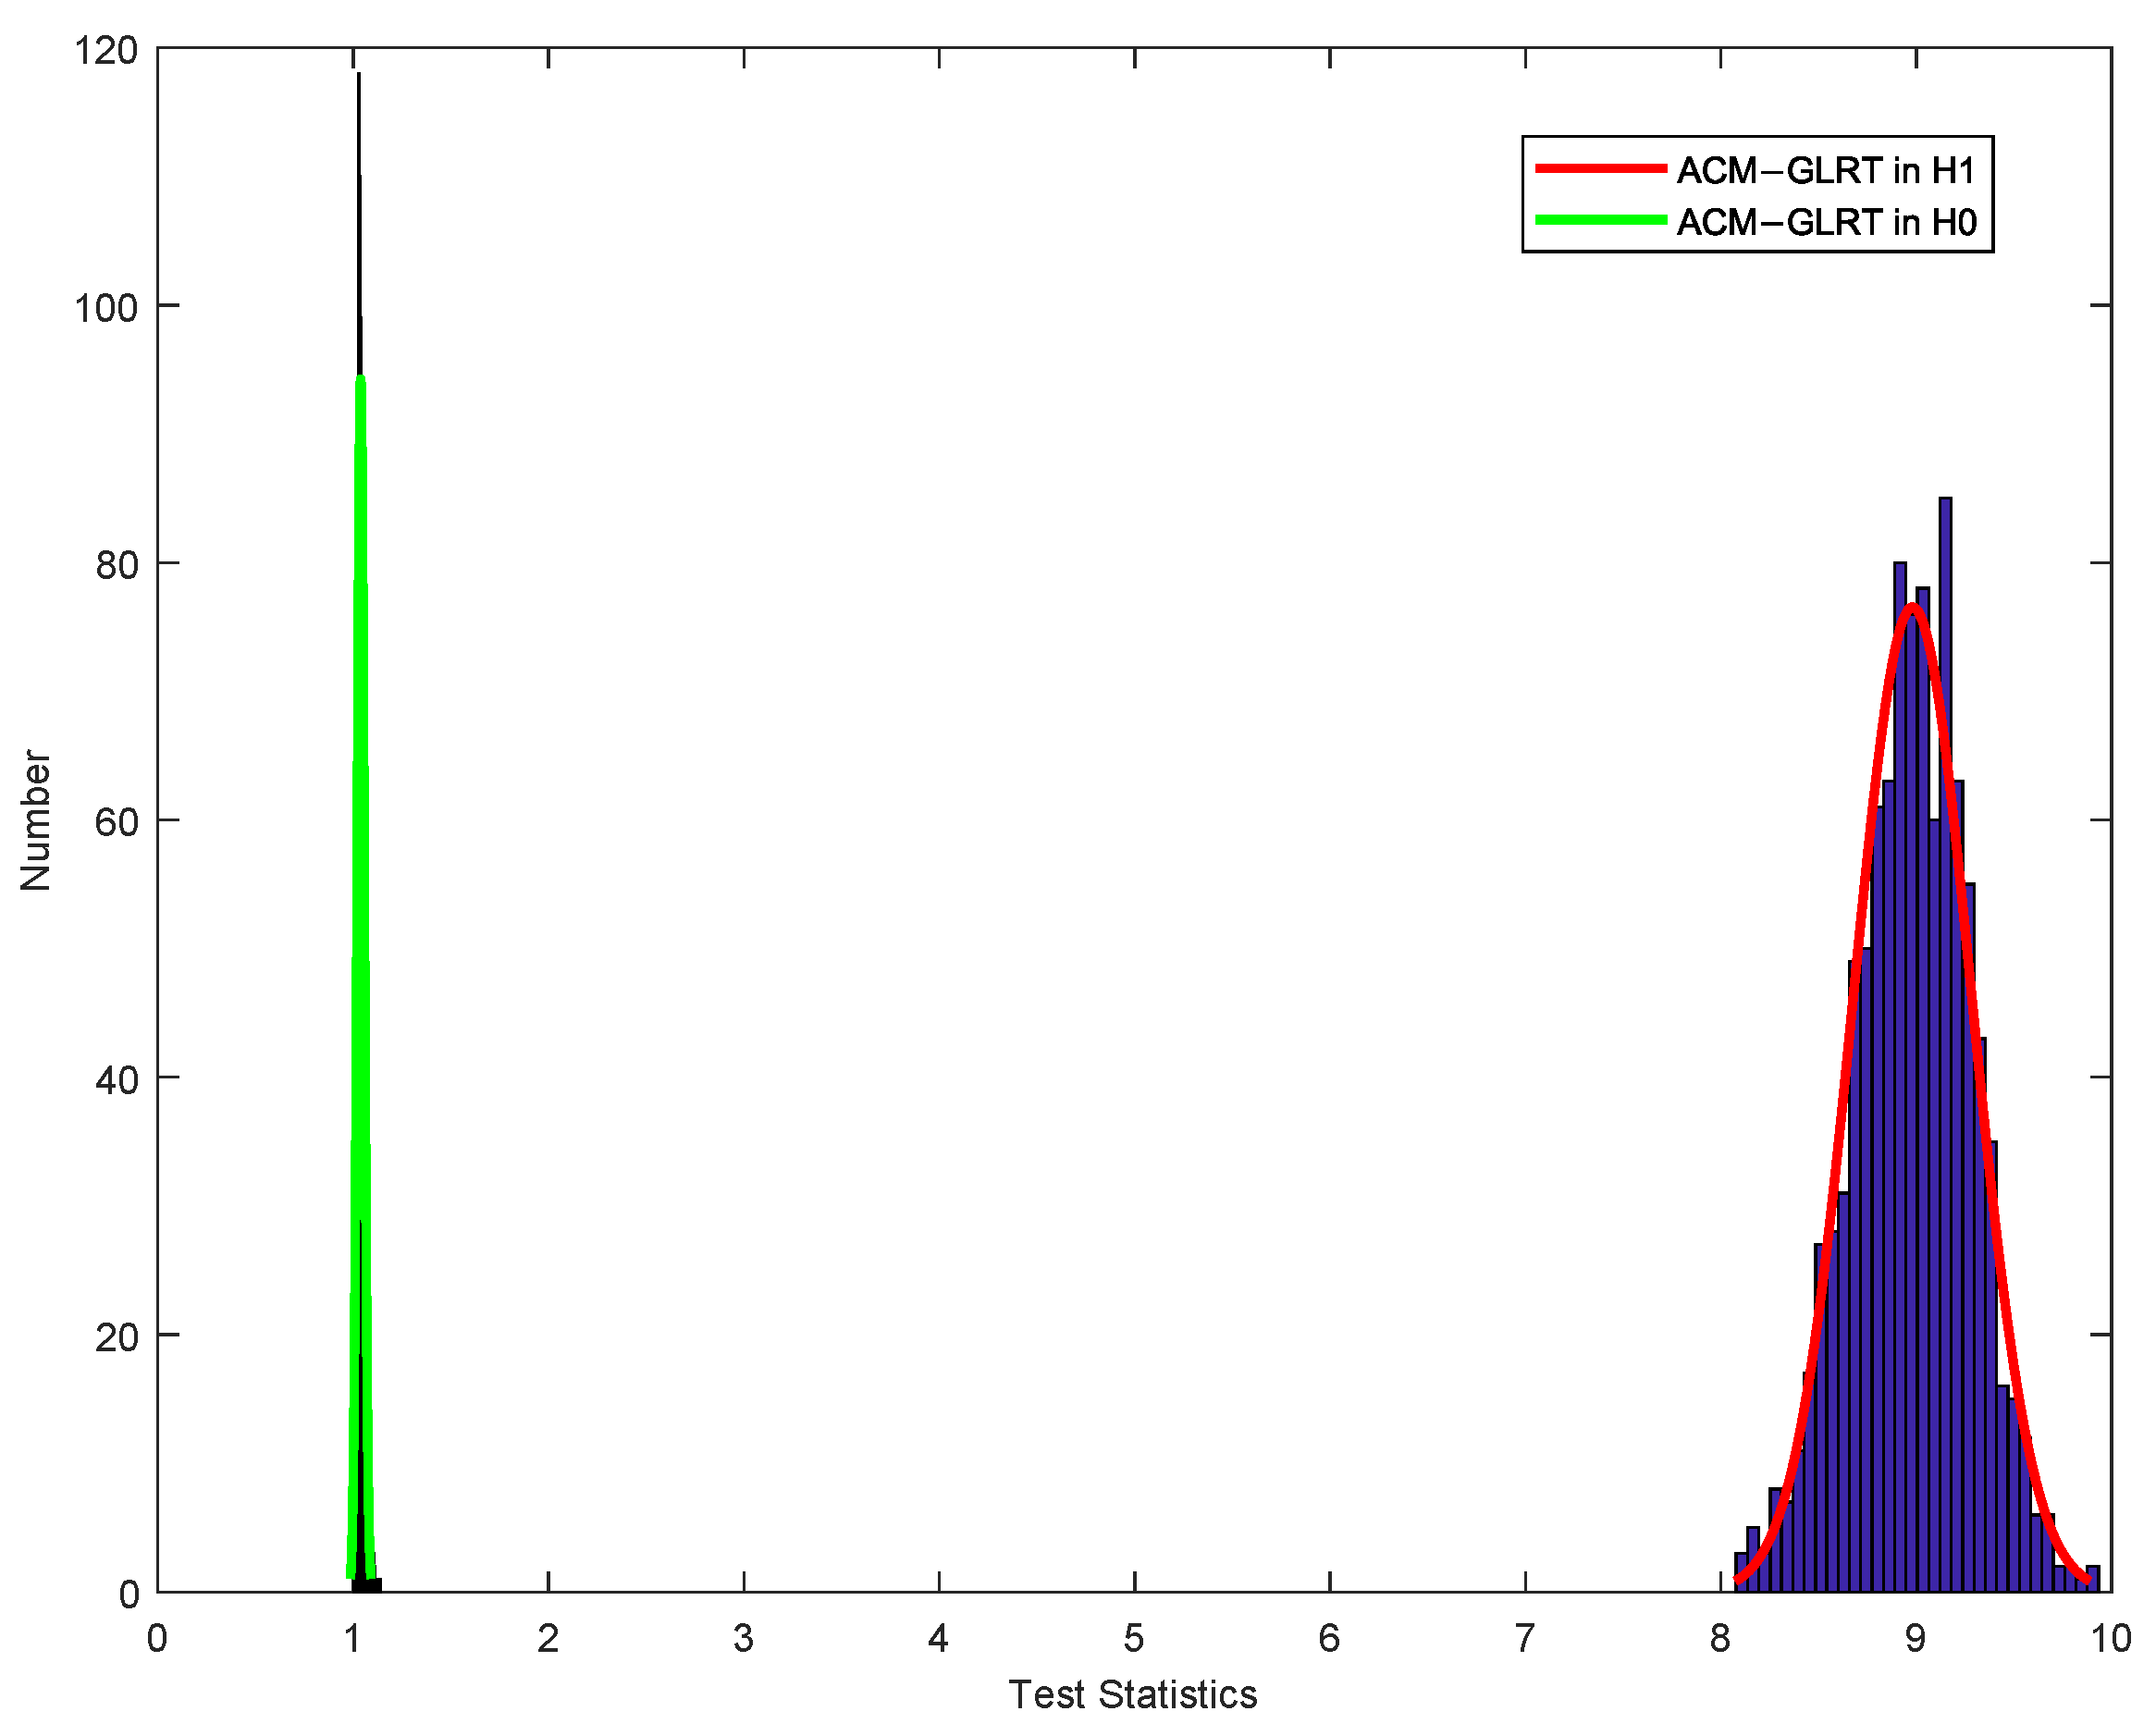
The comparison of GLRT with ACM-GLRT is shown in Figure 5 and Figure 6. The PDF of test statistic of ACM-GLRT also has a wider gap between H 0 and H 1 than GLRT, which is consistent with ACM-RLRT.

5.2. Receiver Operating Characteristic (ROC) Curve

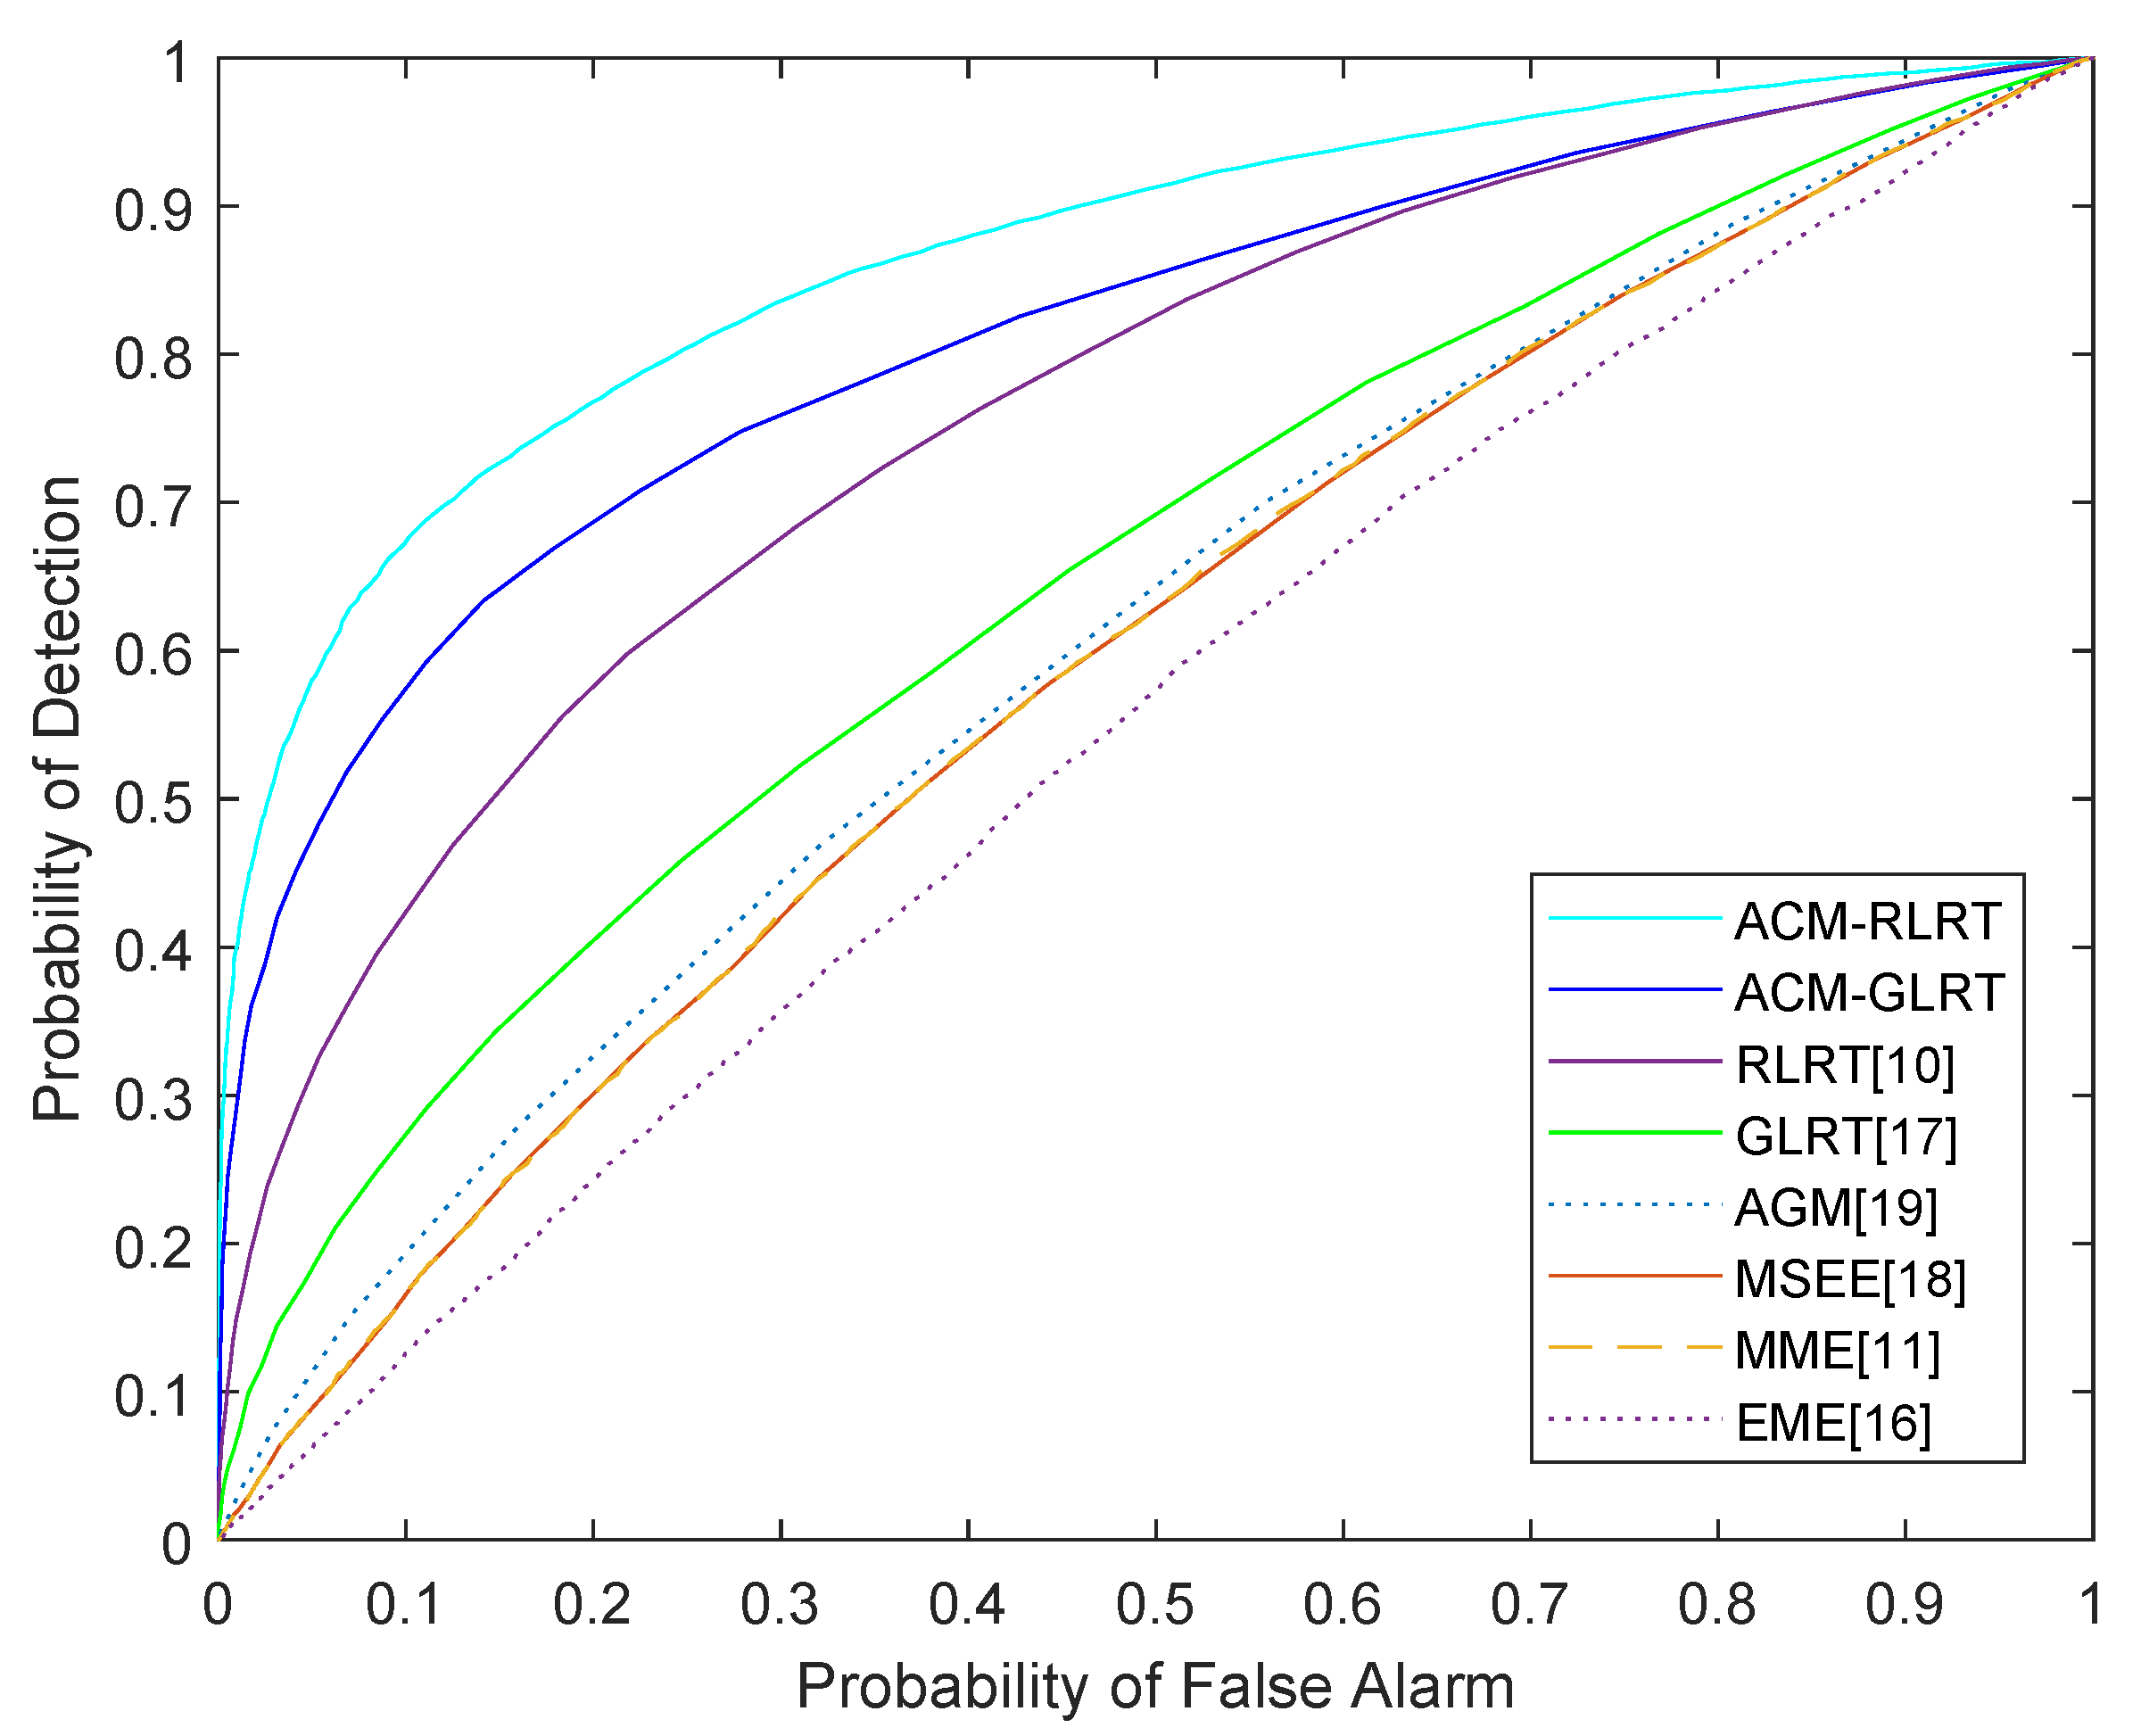
Based on the fact that the circulant matrix technique can broaden the gap between the PDF of H 0 and H 1 , we choose small samples (N = 20) to process the received signals form PU. Figure 7 shows the comparison of ROC curve of our proposed detectors with some other detectors. Our proposed detectors, ACM-RLRT and ACM-GLRT, have a better detection performance than other detectors. ACM-RLRT has the best performance. The reason may lie in that we change the classical GLRT detector while using a circulant matrix. GLRT and RLRT do worse than ACM-RLRT and ACM-GLRT but better than others. Some other methods, such as MSEE, AGM, and MME show very similar results under the limited samples, which are lower than GLRT and RLRT. In addition, EME has the worst performance among them. From the results, we can see that our proposed methods can still have a better performance even under the small sample.
In Figure 8 and Figure 9, the theoretical and simulation results of ROC curve are presented to evaluate the performance metric of the proposed ACM-RLRT and ACM-GLRT detectors, respectively. We can see that the ROC curve using theoretical thresholds of proposed detectors coincides with the simulation results of ACM-RLRT. However, ACM-GLRT has a difference between the results of theoretical threshold and simulation. With larger K, the difference becomes smaller. This is because the F function in (24) is more concentrated when K is larger, which helps to reduce the difference between theoretical and simulated results. With the increase in the SU number K, the detection performance becomes better. We see that cooperation between sensors can contribute additional sample data to the sensing process, which would help to improve the detection performance.
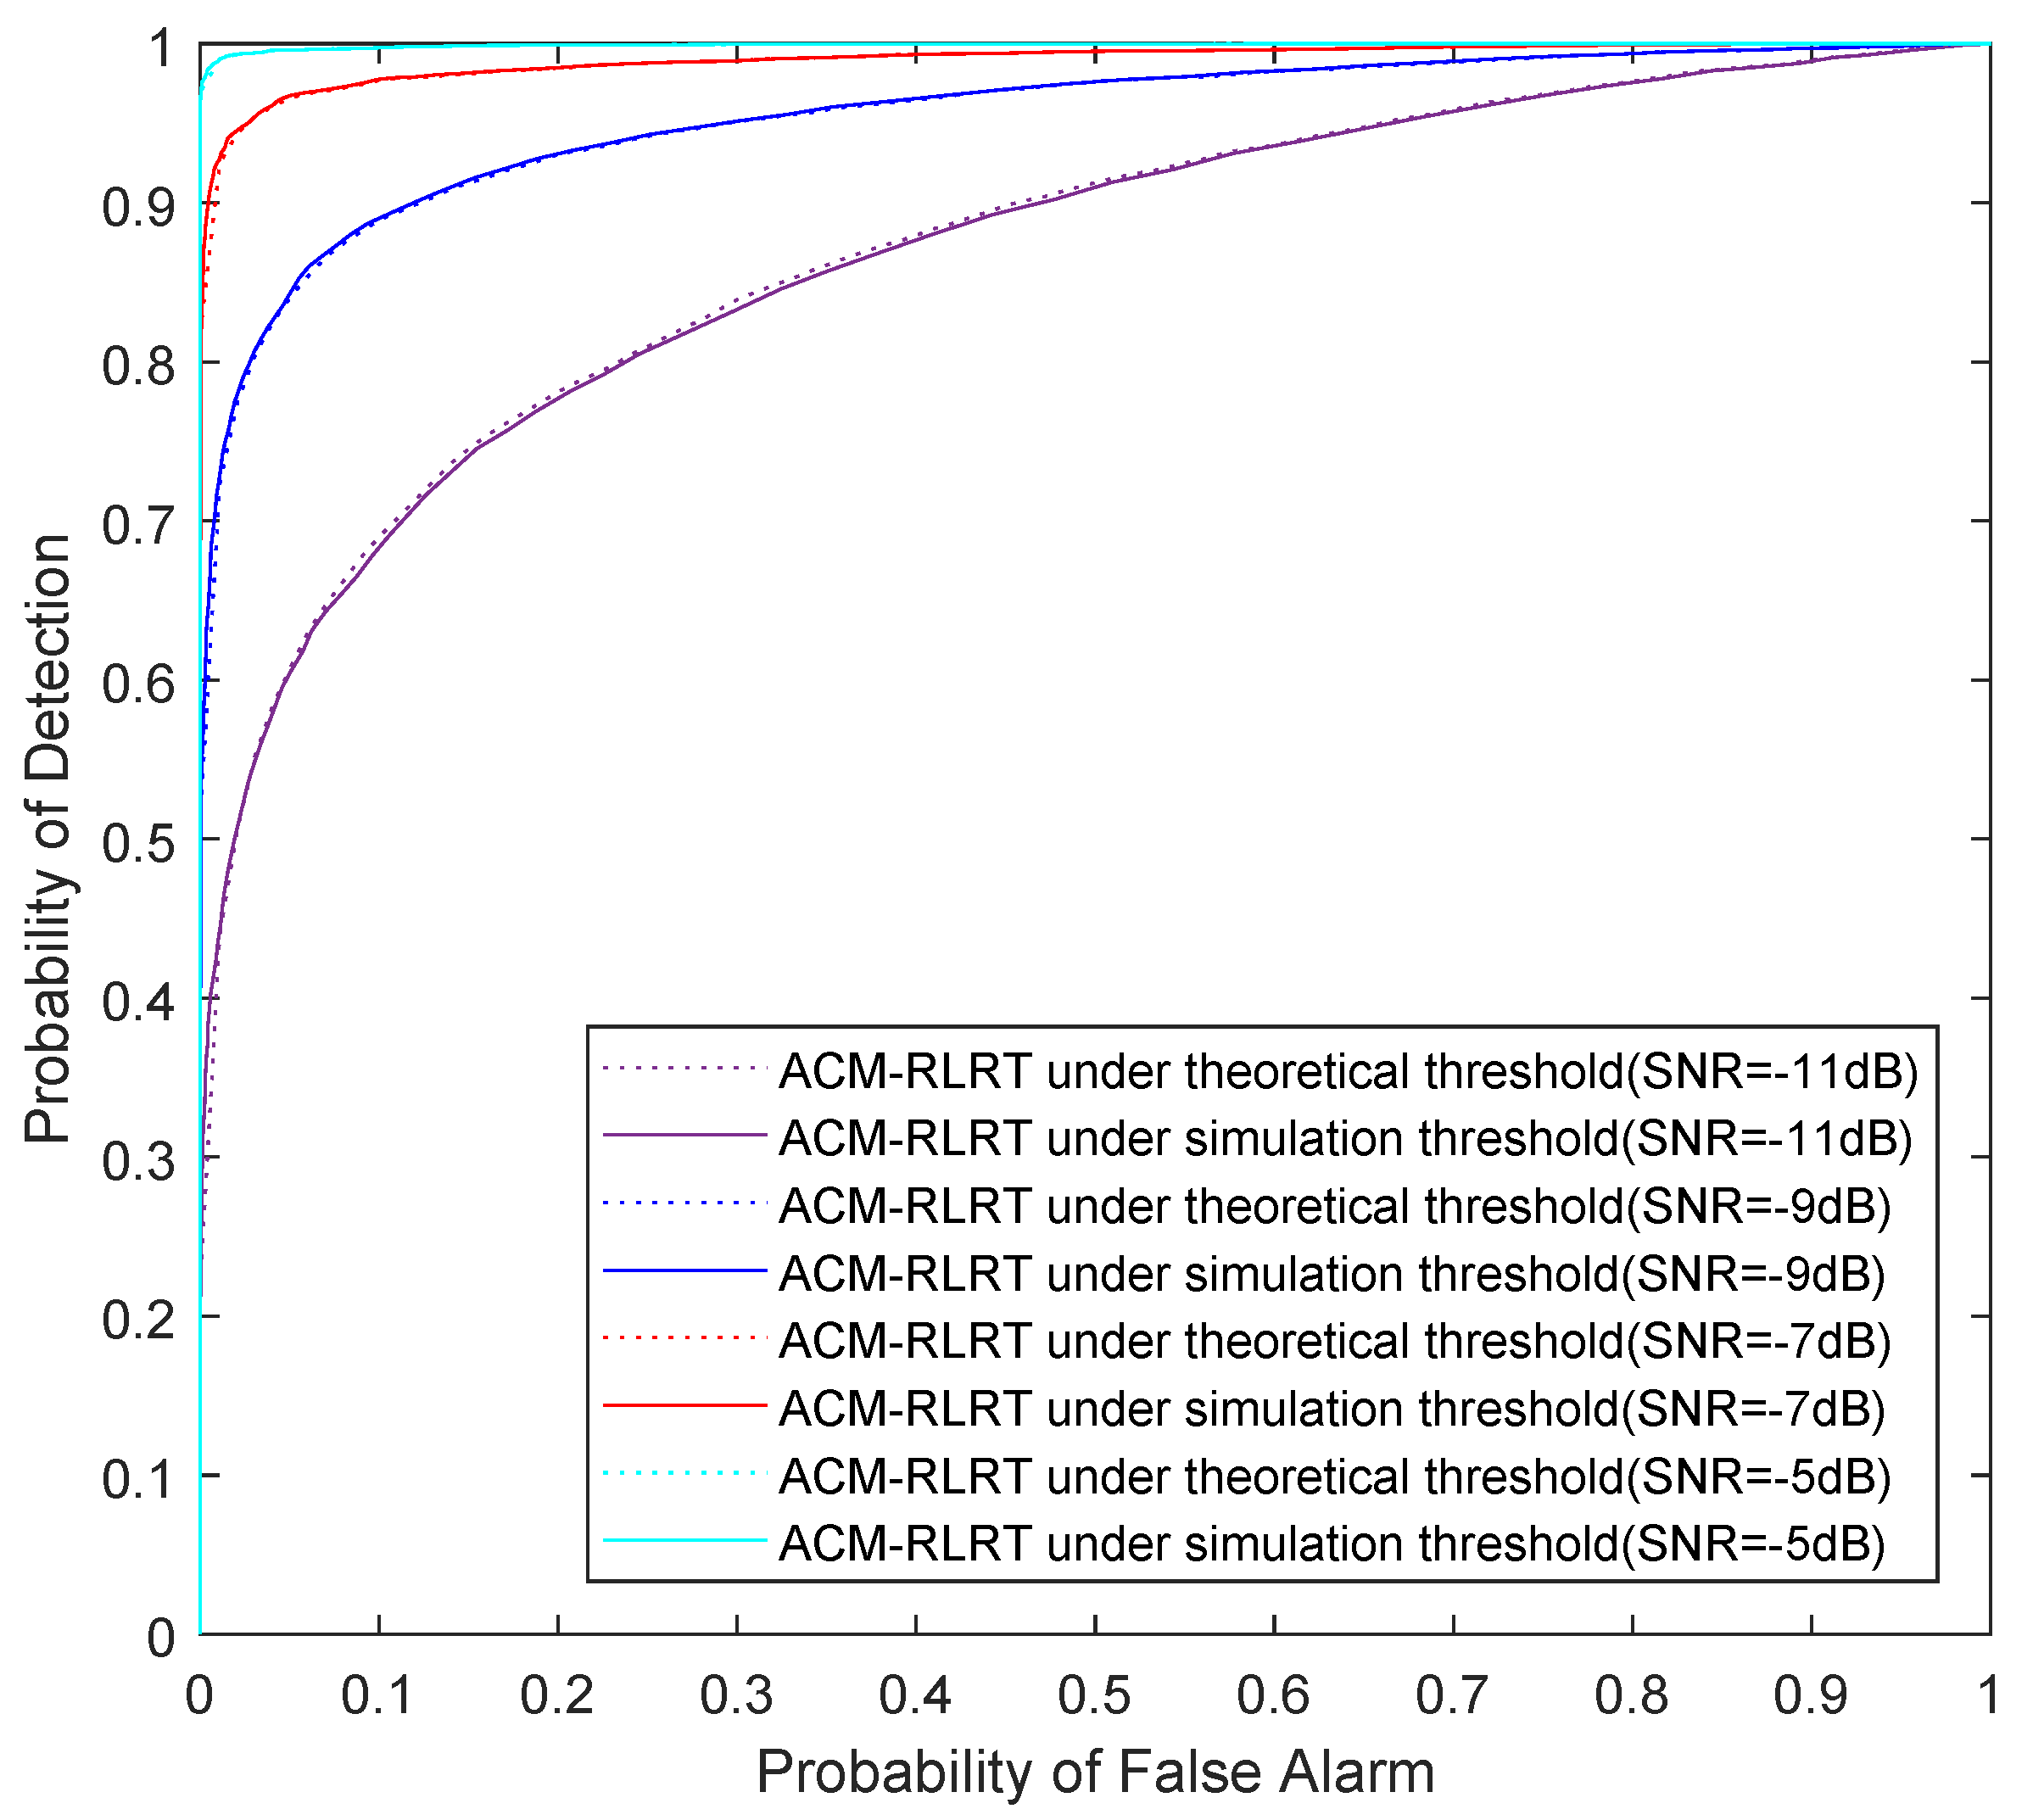
Figure 10 and Figure 11 shows the theoretical and simulation results of ROC curve of the proposed ACM-RLRT and ACM-GLRT detectors, respectively. As for ACM-RLRT, the results of simulated thresholds match well with the theoretical threshold under a different SNR. However, for ACM-GLRT, there is a difference between the theory and simulation results both for different SNR. The reason maybe lies in the calculation of the theoretical threshold which is performed by searching the threshold-Pf table. When SNR is higher, the test statistic concentrates further, which helps to reduce the difference between theoretical curves and simulated ones. With the increase in SNR, the detection performance becomes better.

5.3. SNR

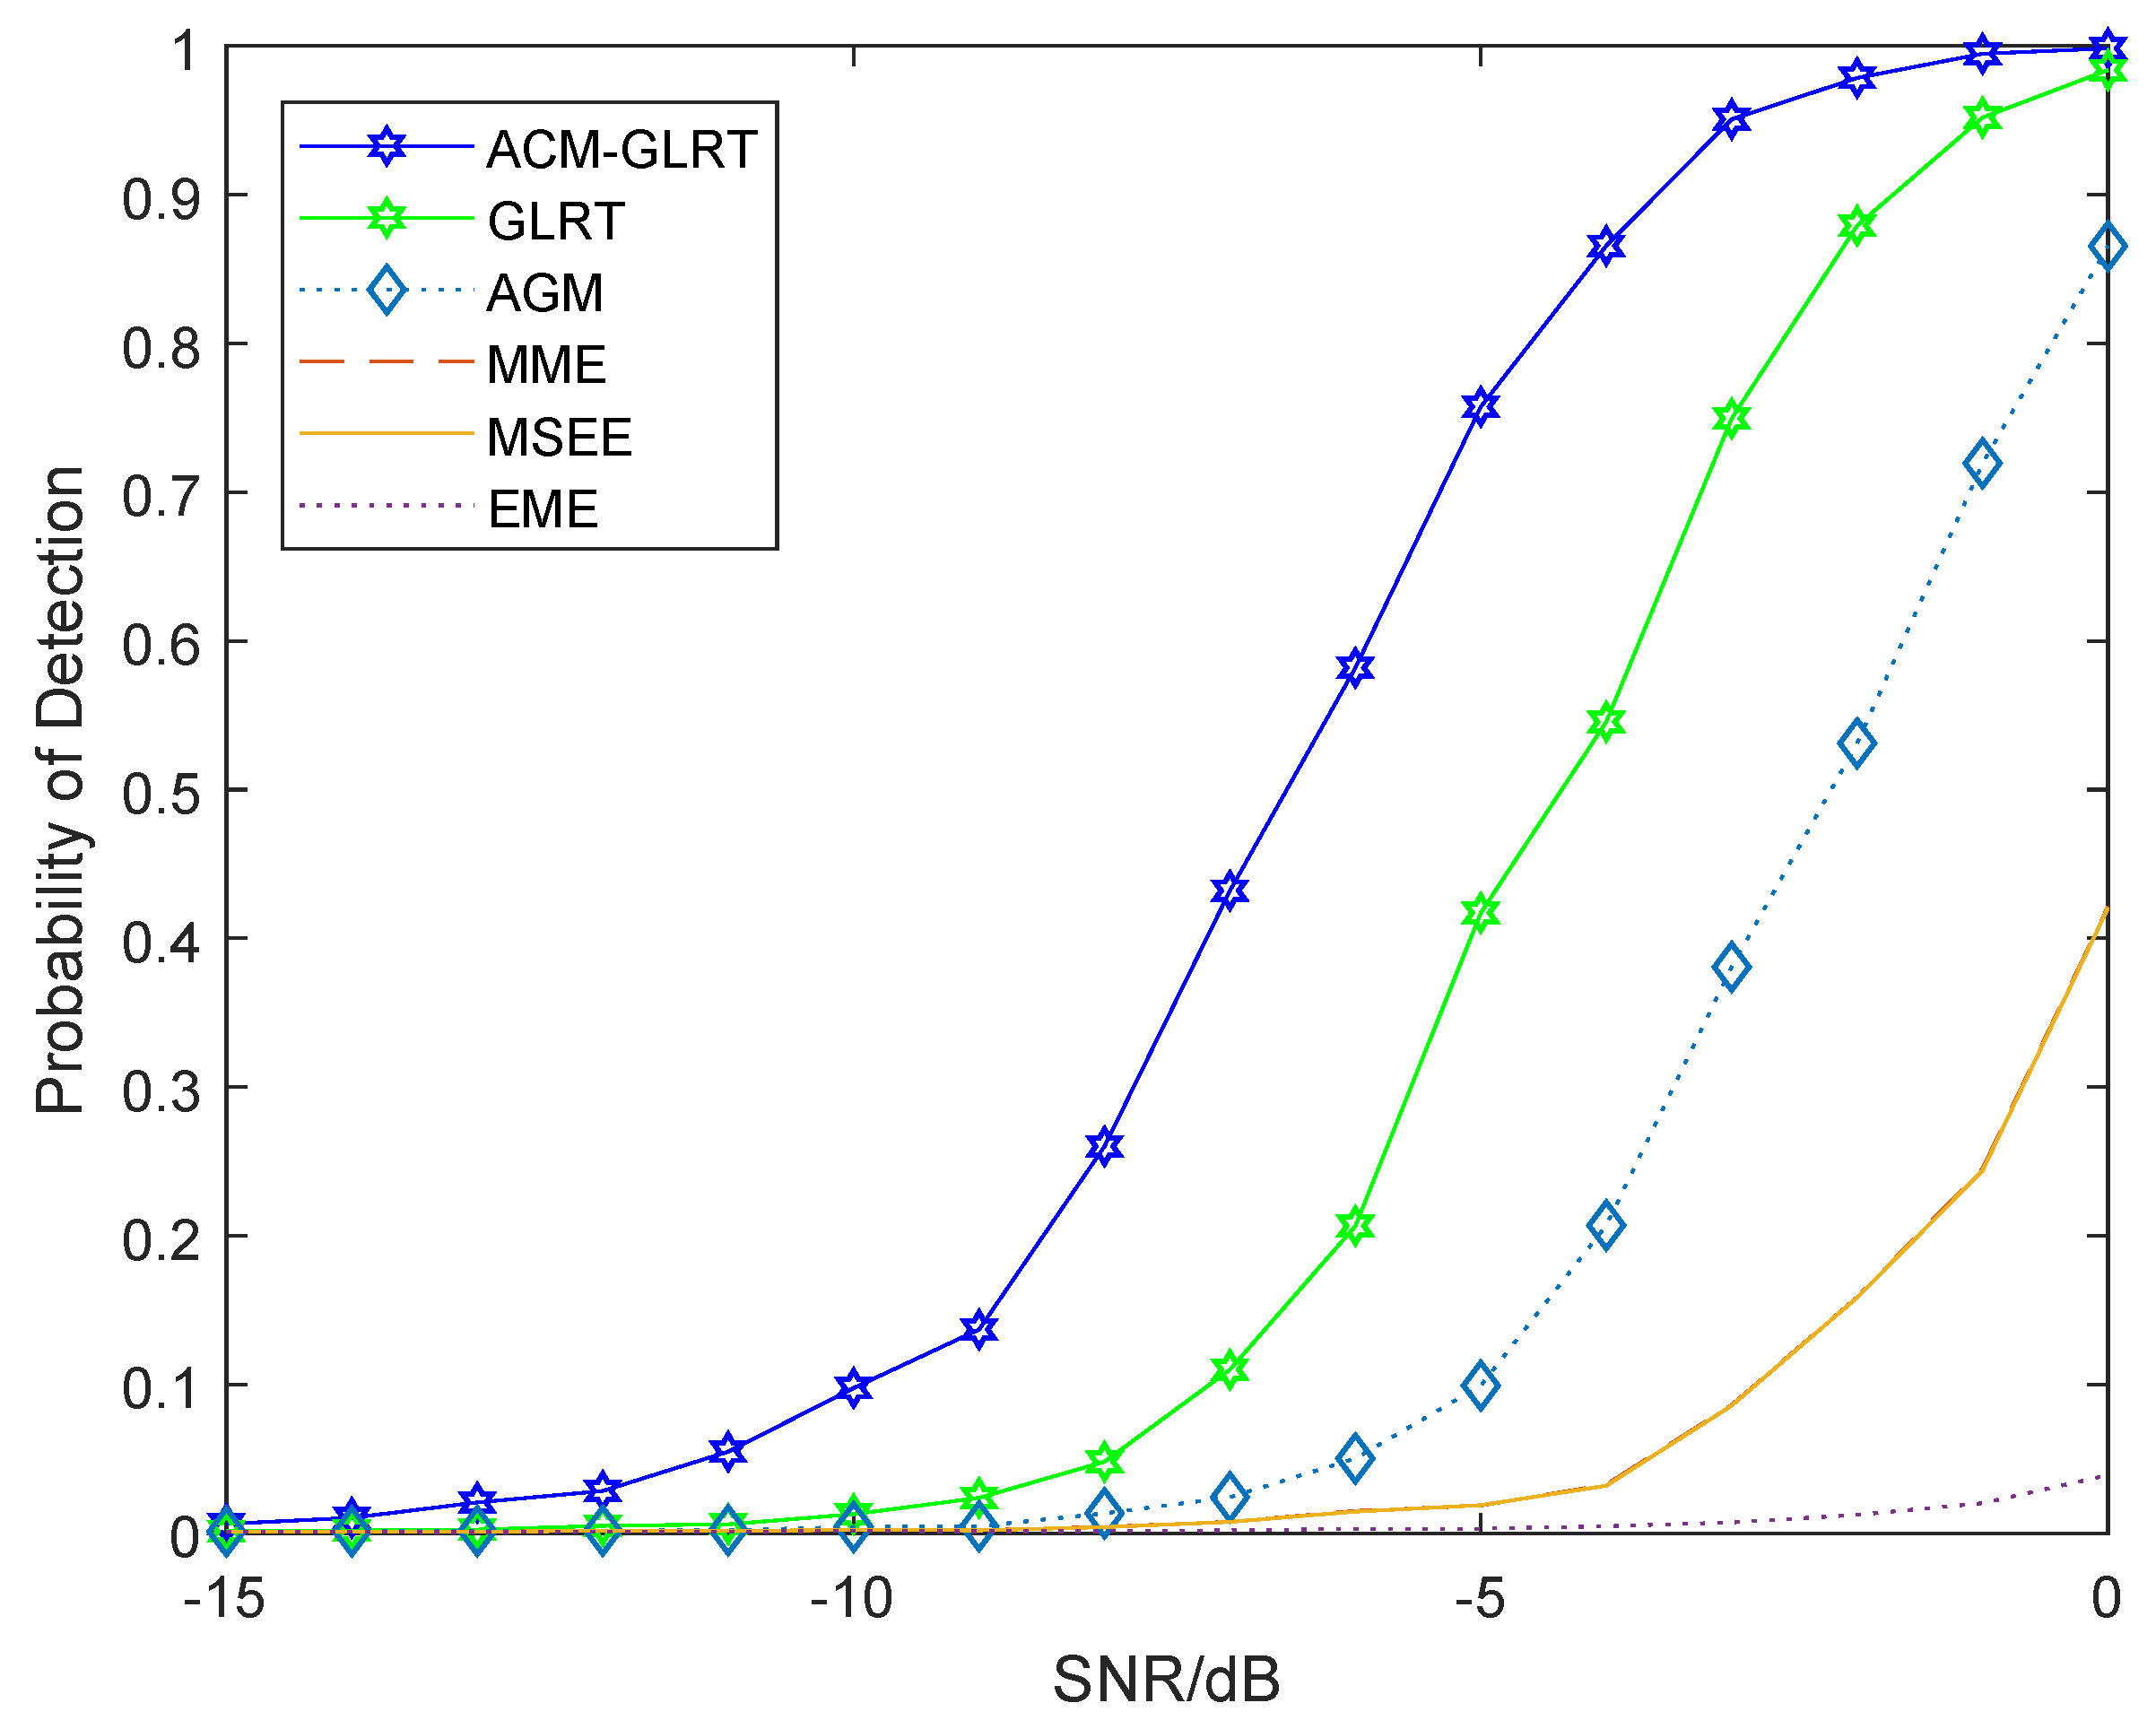
We then examine the effect of SNR on the detection performance under the fixed P f . Figure 12 and Figure 13 illustrates the curves of SNR versus detection probability using our proposed methods and some other eigenvalue-based detectors (GLRT, RLRT, MME, EME, MSEE, and AGM) with P f = 0.001 . The detection probability increases with the improvement of the SNR. From Figure 10 and Figure 11, the performance of ACM-GLRT and ACM-RLRT are significantly better than others at the same SNR, which matches with the results of the ROC curve. We also notice that AGM performs better than MME and MSEE with the increase in SNR (SNR > −10dB), which is different than the ROC curve. In addition, EME also shows the worst result under low SNR and short samples.
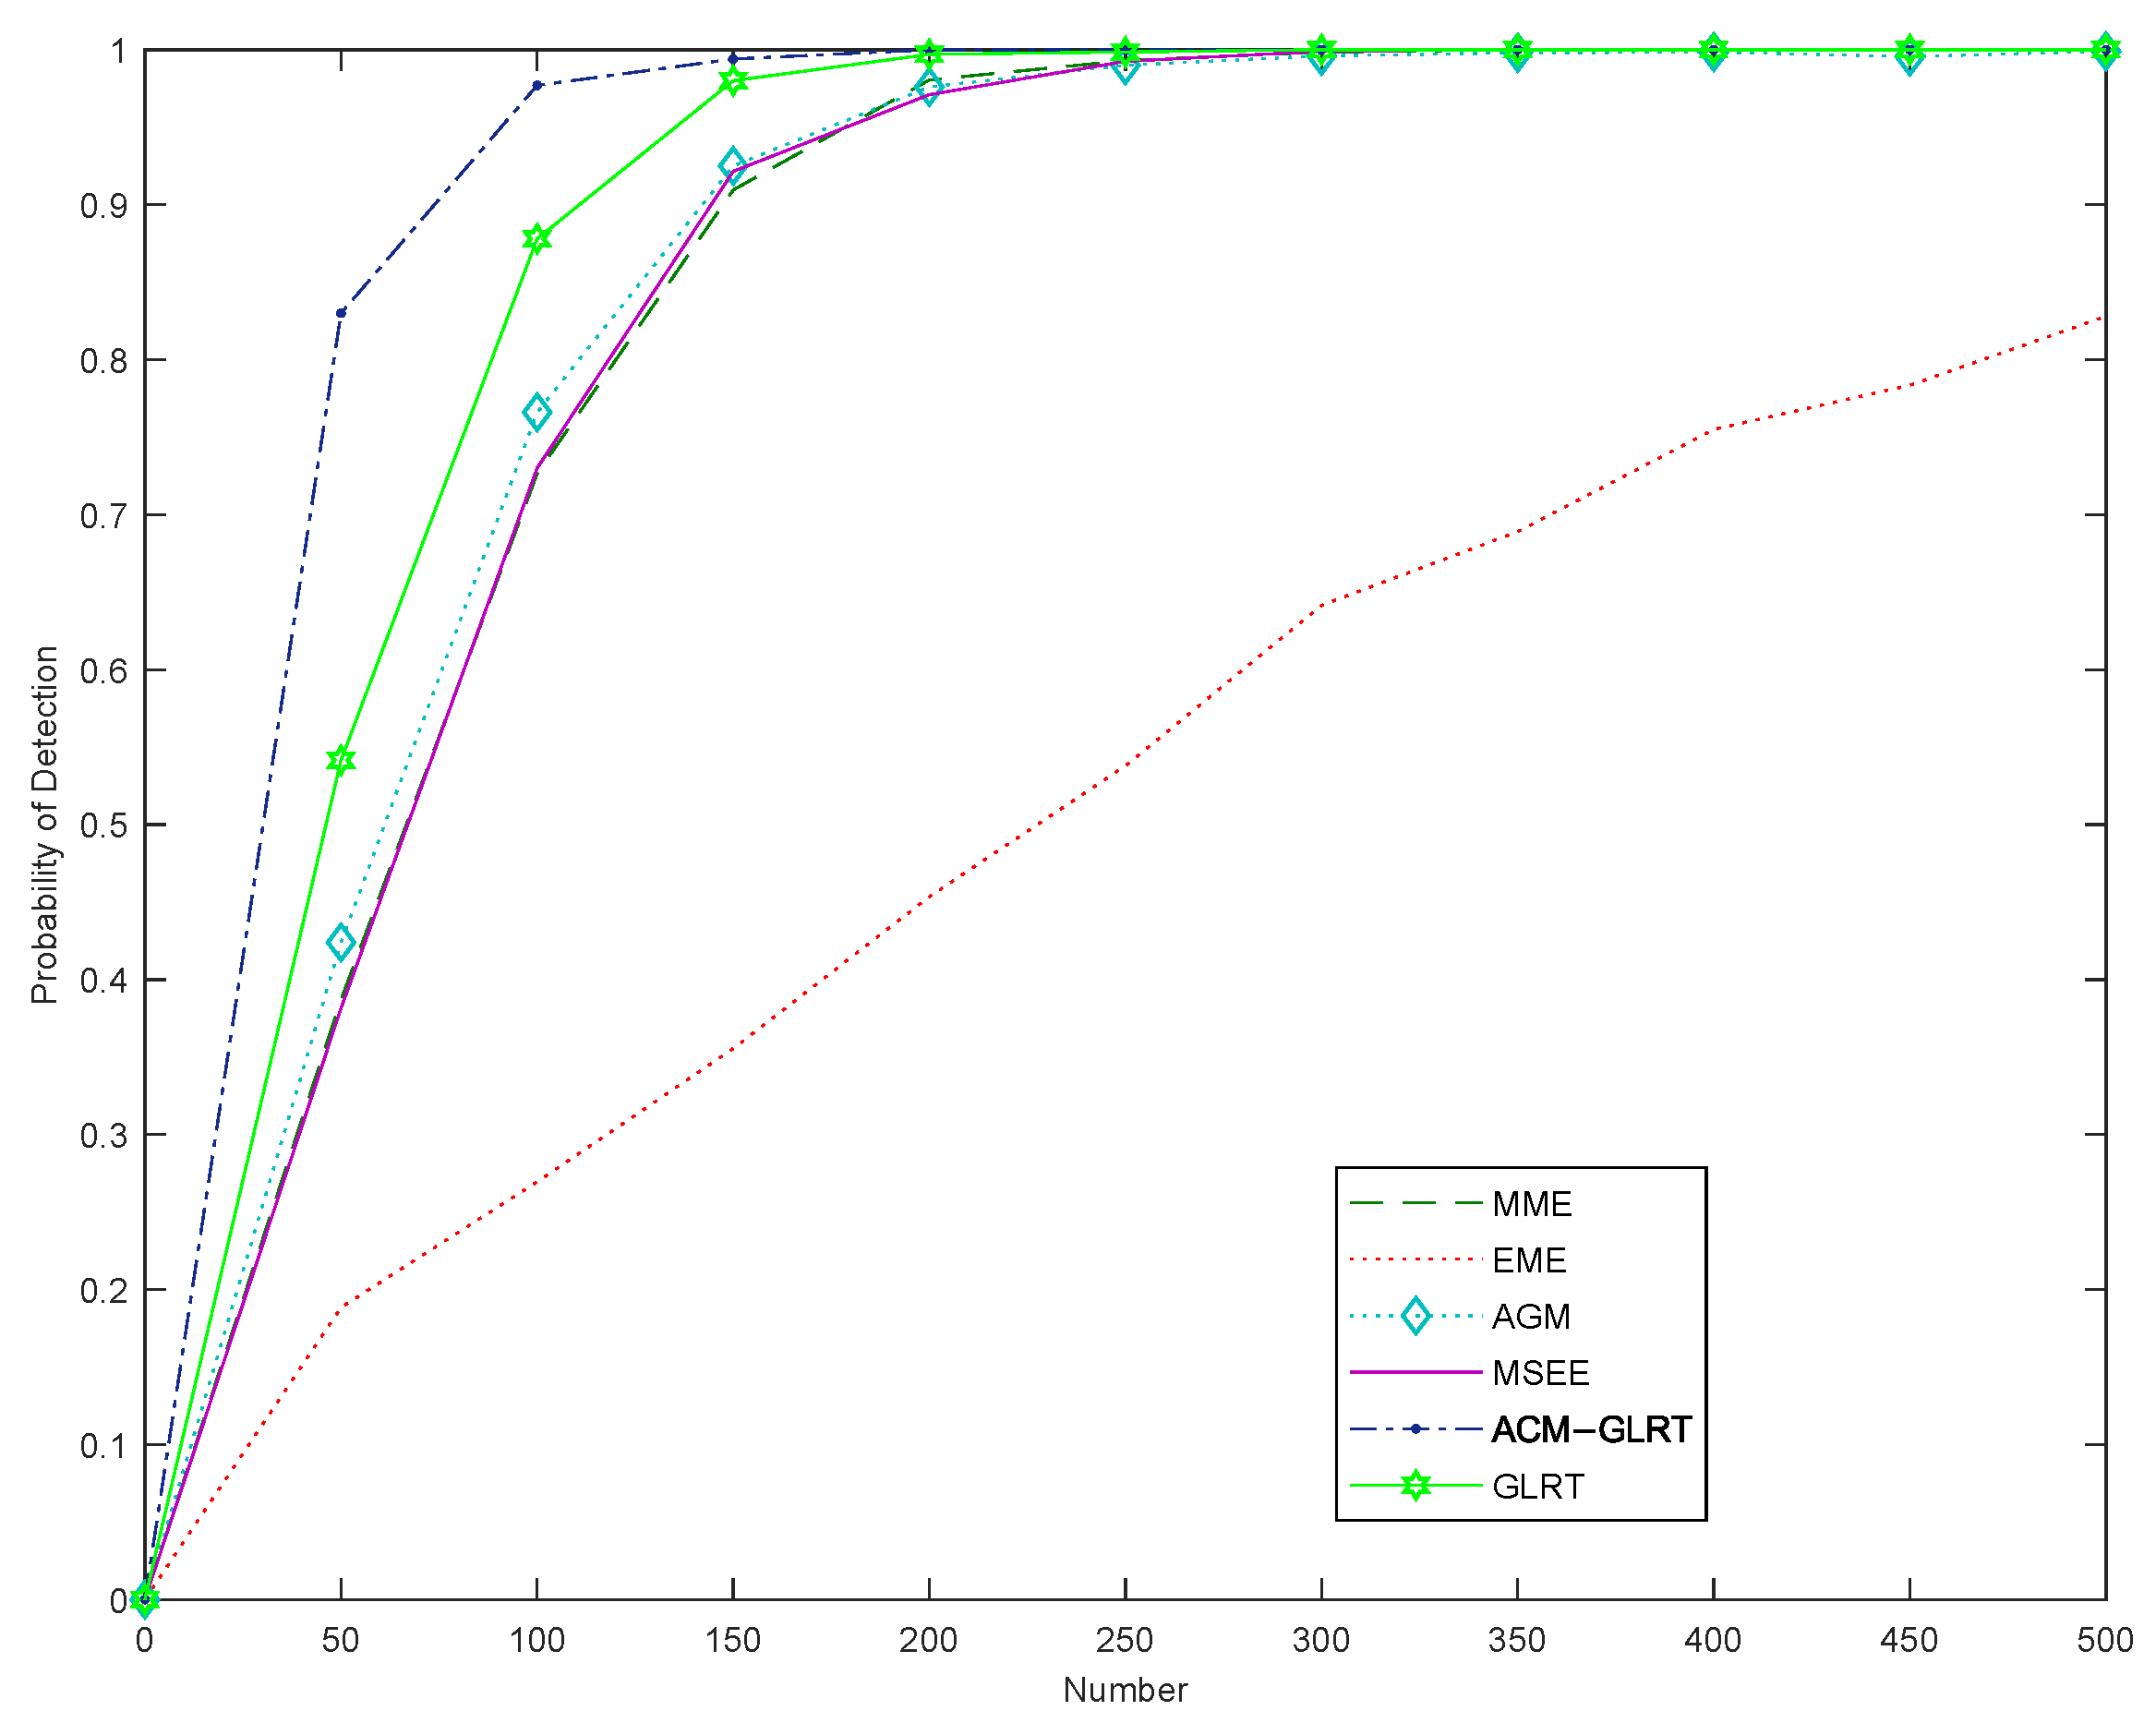
Figure 14 and Figure 15 show the comparison of the Pd-N curve of proposed detectors and those other detectors. The trend is that the detection probability increases with sample number N. From Figure 14 and Figure 15, we can see that both ACM-RLRT and ACM-GLRT have better performance than other detectors. In addition, only the curves of our two proposed detectors tend to be constant with the increase in sample number N. The other detectors cannot show the trend. It indicates that our proposed detectors can be close to the highest performance under the relatively small samples.

6. Conclusions

In the cognitive radio networks, the eigenvalue-based spectrum sensing method has attracted wide attention because it can obtain high detection performance without prior knowledge about the signals of both primary users and noise. Although some methods have been proposed to further improve the performance of eigenvalue-based detectors (EBDs), there is still one problem seldom to be confronted with. That is how the EBDs can quickly detect and perform good results with small samples. In this paper, we proposed two detectors, the ACM-RLRT and ACM-GLRT, based on the circulant matrix technique for the known and unknown noise variances. The simulation results show that the circulant matrix technique can enhance the dominant eigenvalue of the covariance matrix, which would broaden the range between the probability density function (PDF) of the detectors’ statistic under a null hypothesis and alternative hypothesis. We also derived the theoretical expression of the PDFs of two proposed detectors under a null hypothesis. The expression of the false-alarm probability is given at last. The results show that the performance of theoretical analyses is consistent with the simulated ones. From the simulation results, it can be seen that the proposed detectors have a better detection performance even under the small samples, compared with some other methods.

Author Contributions

Conceptualization and methodology, L.D.; software and validation, Y.F. and X.W.; formal analysis, L.D.; investigation, X.W.; resources, L.D.; writing—original draft preparation, X.W.; writing—review and editing, Y.F.; visualization, L.D.; supervision and project administration, Y.C.; funding acquisition, X.Z. All authors have read and agreed to the published version of the manuscript.

Funding

This research was funded by the Scientific and Technological Innovation Foundation of Shunde Graduate School, USTB (BK19CF002) and the National Key R and D Program of China (2020YFB1807900).

Institutional Review Board Statement

Not applicable.

Informed Consent Statement

Not applicable.

Data Availability Statement

All data generated or used during the study appear in the submitted article.

Acknowledgments

The authors would like to thank the reviewers for their thoughtful remarks and recommendations, which considerably enhanced the paper’s presentation.

Conflicts of Interest

The authors declare no conflict of interest.

References

  1. Kale, R.S.; Wadhai, V.M.; Helonde, J.B.; Novel, T. Threshold Formulation for Energy Detection Method to Efficient Spectrum Sensing in Cognitive Radio. Sens. Image Process. 2018, 10, 25–35. [Google Scholar]
  2. Varalakshmi, L.M.; Sugumaran, K.; Tamilselvan, M. Matched Filter Based Spectrum Sensing on Cognitive Radio for OFDM WLANs. Int. Res. J. Eng. Technol. 2016, 3, 935–938. [Google Scholar]
  3. Sutton, P.D. Cyclostationary signatures in practical cognitive radio applications. IEEE J. Sel. Areas Commun. 2008, 26, 13–24. [Google Scholar] [CrossRef]
  4. Liu, C.; Wang, J.; Liu, X.; Liang, Y.-C. Maximum Eigenvalue-Based Goodness-of-Fit Detection for Spectrum Sensing in Cognitive Radio. IEEE Trans. Veh. Technol. 2019, 68, 7747–7760. [Google Scholar] [CrossRef]
  5. Kortun, A.; Ratnarajah, T.; Sellathurai, M.; Liang, Y.-C.; Zeng, Y. On the Eigenvalue-Based Spectrum Sensing and Secondary User Throughput. IEEE Trans. Veh. Technol. 2014, 63, 1480–1486. [Google Scholar] [CrossRef]
  6. Tsinos, C.G.; Berberidis, K. Decentralized Adaptive Eigenvalue Based Spectrum Sensing for Multiantenna Cognitive Radio Systems. IEEE Trans. Wirel. Commun. 2015, 14, 1703–1715. [Google Scholar] [CrossRef]
  7. Jain, S.A.; Deshmukh, M.M. Performance analysis of energy and eigenvalue based detection for spectrum sensing in Cognitive Radio network. In Proceedings of the International Conference on Pervasive Computing (ICPC), St. Louis, MO, USA, 23–27 March 2015. [Google Scholar]
  8. Ayeh, E.; Namuduri, K.; Li, X. Performance evaluation of eigenvalue based detection strategies in a sensor network. In Proceedings of the IEEE International Conference on Communications (ICC), Sydney, Australia, 10–14 June 2014. [Google Scholar]
  9. Nadler, B.; Penna, F.; Garello, R. Performance of Eigenvalue-Based Signal Detectors with Known and Unknown Noise Level. In Proceedings of the IEEE International Conference on Communications (ICC), Kyoto, Japan, 5–9 June 2011. [Google Scholar]
  10. Zeng, Y.; Liang, Y.-C. Maximum minimum eigenvalue detection for cognitive radio. In Proceedings of the IEEE International Symposium on Personal, Indoor and Mobile Radio Communications(PIMRC), Athens, Greece, 3–7 September 2007. [Google Scholar]
  11. Hamid, M.; Bjorsell, N.; Ben Slimane, S. Signal Bandwidth Impact on Maximum-Minimum Eigenvalue Detection. IEEE Commun. Lett. 2015, 19, 395–398. [Google Scholar] [CrossRef]
  12. Wael, C.; Armi, N.; Rohman, B.P. Spectrum sensing for low SNR environment using maximum-minimum eigenvalue (MME) detection. In Proceedings of the International Seminar on Intelligent Technology and Its Applications (ISITIA), Lombok, Indonesia, 28–30 July 2016. [Google Scholar]
  13. Ali, S.S.; Zhao, W.; Jin, M.; Yoo, S.-J. Enhanced Maximum-Minimum Eigenvalue Based Spectrum Sensing. In Proceedings of the International Conference on Information and Communication Technology Convergence (ICTC), Jeju Island, Korea, 16–18 October 2019. [Google Scholar]
  14. Chaurasiya, R.B.; Shrestha, R. Hardware-Efficient and Fast Sensing Time Maximum-Minimum-Eigenvalue-Based Spectrum Sensor for Cognitive Radio Network. IEEE Trans. Circuits Syst. 2019, 66, 142–149. [Google Scholar] [CrossRef]
  15. Ratnarajah, T.; Zhong, C.; Kortun, A.; Sellathurai, M.; Papadias, C.B. Complex random matrices and multiple-antenna spectrum sensing. In Proceedings of the International Conference on Acoustics, Speech, and Signal Processing (ICASSP), Prague, Czech Republic, 22–27 May 2011. [Google Scholar]
  16. Wang, P.; Fang, J.; Han, N.; Li, H. Multiantenna-Assisted Spectrum Sensing for Cognitive Radio. IEEE Trans. Veh. Technol. 2010, 59, 1791–1800. [Google Scholar] [CrossRef] [Green Version]
  17. Bouallegue, K.; Dayoub, I.; Gharbi, M.; Hassan, K. Blind Spectrum Sensing Using Extreme Eigenvalues for Cognitive Radio Networks. IEEE Commun. Lett. 2018, 22, 1386–1389. [Google Scholar] [CrossRef]
  18. Zhang, R.; Lim, T.J.; Liang, Y.-C.; Zeng, Y. Multi-antenna based spectrum sensing for cognitive radios: A GLRT approach. IEEE Trans. Commun. 2010, 58, 84–88. [Google Scholar] [CrossRef]
  19. Bianchi, P.; Debbah, M.; Maïda, M.; Najim, J. Performance of Statistical Tests for Single-Source Detection Using Random Matrix Theory. IEEE Trans. Inf. Theory 2011, 57, 2400–2419. [Google Scholar] [CrossRef] [Green Version]
  20. Lim, T.J.; Zhang, R.; Liang, Y.C.; Zeng, Y. GLRT-Based Spectrum Sensing for Cognitive Radio. In Proceedings of the IEEE Global Telecommunications Conference, New Orleans, LA, USA, 30 November–4 December 2008. [Google Scholar]
  21. Bai, Z.D. Methodologies in spectral analysis of large dimensional random matrices, a review. Stat. Sin. 1999, 9, 611–677. [Google Scholar]
  22. Tracy, C.A.; Widom, H. On orthogonal and symplectic matrix ensembles. Commun. Math. Phys. 1996, 177, 727–754. [Google Scholar] [CrossRef] [Green Version]
  23. Pollock, D.S.G. Circulant matrices and time-series analysis. Int. J. Math. Educ. 2002, 33, 213–230. [Google Scholar] [CrossRef]
  24. Rojo, O.; Rojo, H. Some results on symmetric circulant matrices and on symmetric centrosymmetric matrices. Linear Algebra Appl. 2004, 392, 211–233. [Google Scholar] [CrossRef] [Green Version]
  25. Priestley, M.B. Spectral Analysis and Time Series; CRC Press: Boca Raton, FL, USA, 1996; pp. 397–398. [Google Scholar]
  26. Lancaster, H.O. The chi-Squared Distribution. J. Oper. Res. Soc. 1970, 21, 383–384. [Google Scholar] [CrossRef]
  27. Balakrishnan, N.; Basu, B. Exponential Distribution: Theory, Methods and Applications, 1st ed.; Academic Press: London, UK, 1996; pp. 17–29. [Google Scholar]
  28. Stacy, E.W. A Generalization of the Gamma Distribution. Ann. Math. Stat. 1962, 33, 1187–1192. [Google Scholar] [CrossRef]
  29. Phillips, P.C.B. The True Characteristic Function of the F Distribution. Biometrika 1982, 69, 261–264. [Google Scholar] [CrossRef]
  30. Bowman, K.O.; Shenton, L.R.; Gailey, P.C. Distribution of the ratio of gamma variates. Commun. Stat. Simul. Comput. 1996, 27, 1–19. [Google Scholar] [CrossRef]
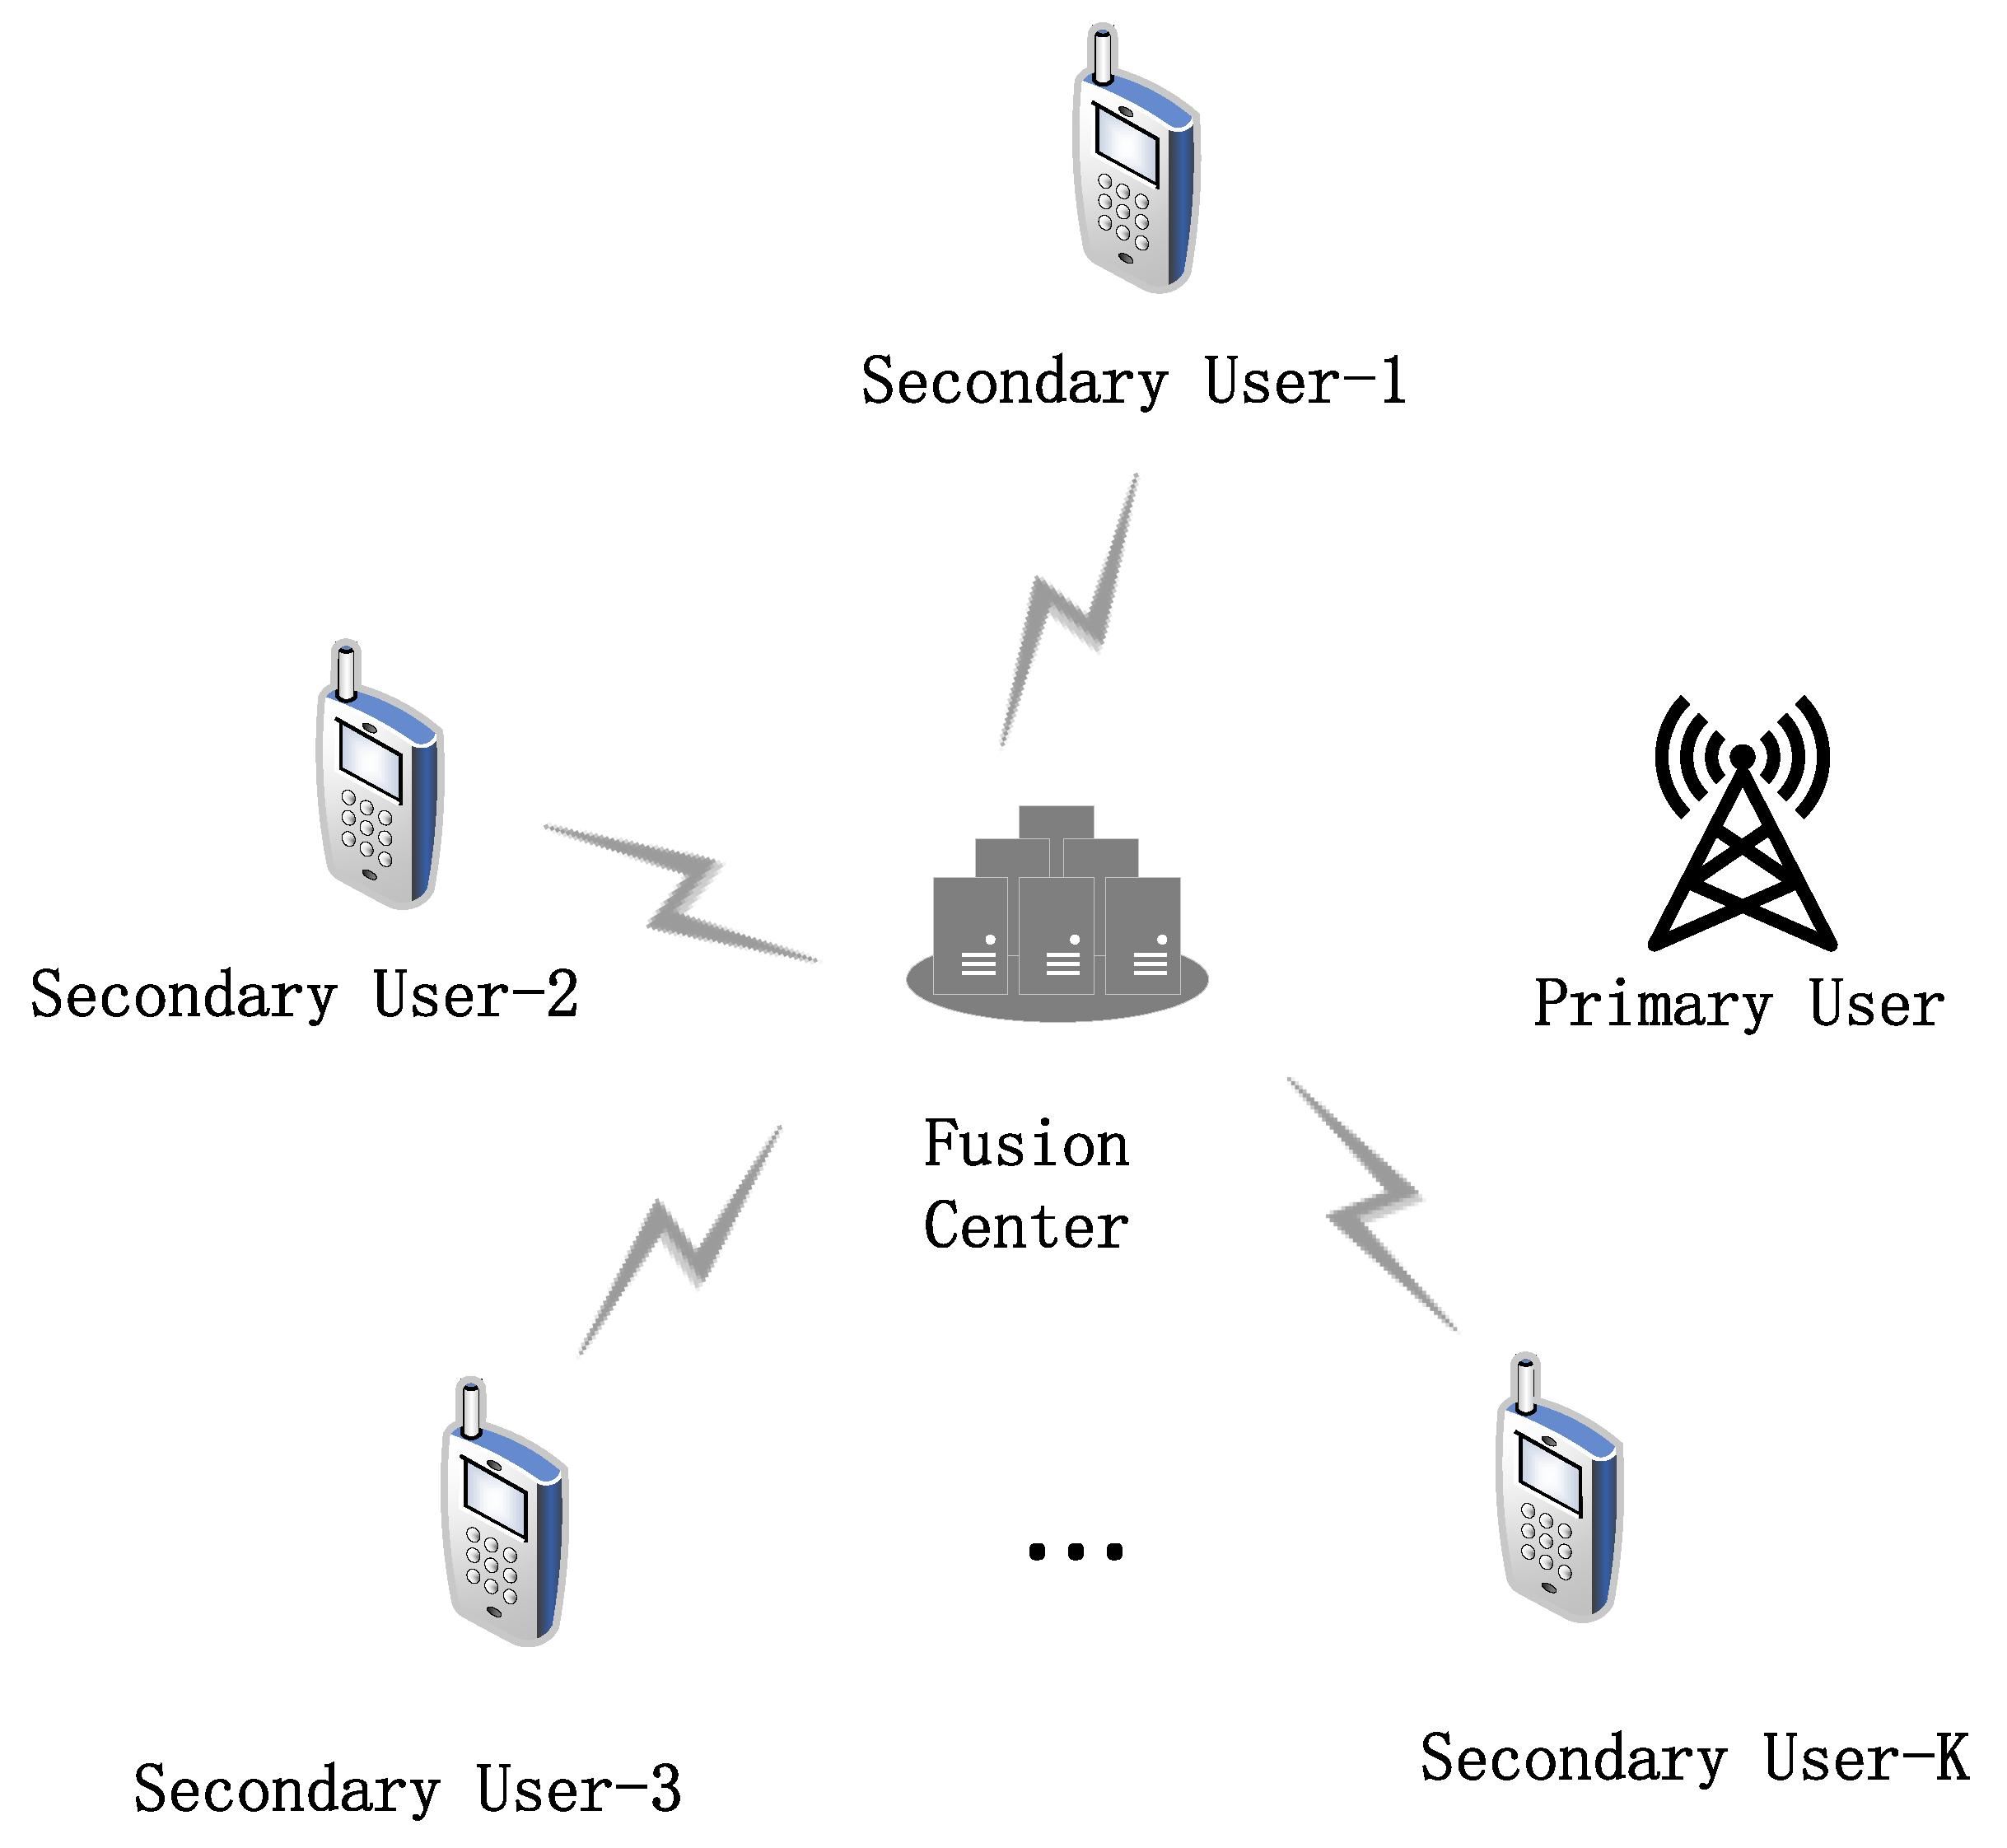
Figure 1. Cooperative spectrum sensing system model.
Symmetry 13 02330 g001
Figure 2. The sorted eigenvalues of two different covariance matrices under H 1 and H 0 .
Symmetry 13 02330 g002
Figure 3. Histogram of RLRT test statistics under H 1 and H 0 .
Symmetry 13 02330 g003
Figure 4. Histogram of ACM-RLRT test statistics under H 1 and H 0 .
Symmetry 13 02330 g004
Figure 5. Histogram of GLRT test statistics under H 1 and H 0 .
Symmetry 13 02330 g005
Figure 6. Histogram of ACM-GLRT test statistics under H 1 and H 0 .
Symmetry 13 02330 g006
Figure 7. ROC curves for different detection methods (SNR = −9 dB, K = 8). The proposed methods are compared with MSEE, EME, MME, RLRT, GLRT, and AGM.
Symmetry 13 02330 g007
Figure 8. ROC curve of ACM-RLRT detector. SNR = −9 dB, N = 20, K = 8, 10, 12.
Symmetry 13 02330 g008
Figure 9. ROC curve of ACM-GLRT detector. SNR = −9 dB, N = 20, K = 8, 10, 12.
Symmetry 13 02330 g009
Figure 10. ROC curve of ACM-RLRT detector. N = 20, K = 12, SNR = −5 dB, −7 dB, −9 dB, −11 dB.
Symmetry 13 02330 g010
Figure 11. ROC curve of ACM-GLRT detector. N = 20, K = 12, SNR = −5 dB, −7 dB, −9 dB, −11 dB.
Symmetry 13 02330 g011
Figure 12. Pd-SNR curve of ACM-RLRT and other detectors. K = 8, N = 20, and Pf = 0.001.
Symmetry 13 02330 g012
Figure 13. Pd-SNR curve of ACM-GLRT and other detectors. K = 8, N = 20, and Pf = 0.001.
Symmetry 13 02330 g013
Figure 14. Pd-N curve of ACM-RLRT and another detector. SNR = −9 dB, K = 8.
Symmetry 13 02330 g014
Figure 15. Pd-N curve of ACM-GLRT and another detector. SNR = −9 dB, K = 8.
Symmetry 13 02330 g015
Publisher’s Note: MDPI stays neutral with regard to jurisdictional claims in published maps and institutional affiliations.