Article

Adaptive versus Conventional Positive Position Feedback Controller to Suppress a Nonlinear System Vibrations

by
N. A. Saeed
1,*,
Emad Mahrous Awwad
2,3,*,
Talaat Abdelhamid
1,4,
Mohammed A. El-Meligy
5 and
Mohamed Sharaf
5
1
Department of Physics and Engineering Mathematics, Faculty of Electronic Engineering, Menoufia University, Menouf 32952, Egypt
2
Electrical Engineering Department, College of Engineering, King Saud University, P.O. Box 800, Riyadh 11421, Saudi Arabia
3
Industrial Electronics and Control Engineering Department, Faculty of Electronic Engineering, Menoufia University, Menouf 32952, Egypt
4
Shenzhen Institutes of Advanced Technology, Chinese Academy of Science, Shenzhen 518055, China
5
Industrial Engineering Department, College of Engineering, King Saud University, P.O. Box 800, Riyadh 11421, Saudi Arabia
*
Authors to whom correspondence should be addressed.
Symmetry 2021, 13(2), 255; https://doi.org/10.3390/sym13020255
Submission received: 17 December 2020 / Revised: 10 January 2021 / Accepted: 29 January 2021 / Published: 3 February 2021
(This article belongs to the Section Mathematics)

Abstract

:
The nonlinear vibration control of a nonlinear dynamical system modeled as the well-known Duffing oscillators is investigated within this article. The conventional Positive Position Feedback (PPF) controller is proposed to mitigate the considered system nonlinear vibrations. The whole system mathematical model is analyzed by applying the multiple time scales perturbation method. The slow-flow modulation equations that govern the oscillation amplitudes of both the main system and controller are derived. The stability analysis is investigated based on Lyapunov’s first method. The effects of the different control parameters on both the main system and controller are explored. The obtained analytical and numerical results illustrated that the PPF controller can eliminate the main system nonlinear vibrations once the controller natural frequency is tuned to be the same value as the external excitation frequency, otherwise, the controller adds excessive vibrational energy to the main system rather than suppressing it. In addition, the PPF controller can destabilize the main system motion when excited by strong excitation force. Therefore, a modified version of the PPF controller named the Adaptive Positive Position Feedback (APPF) controller is proposed to overcome the main drawbacks of the conventional PPF controller. The idea is to track the external excitation frequency using an adaptive frequency measurement technique to update continuously the PPF controller natural frequency to become the same value of the excitation frequency. Based on this strategy, the system mathematical model is analyzed again by making the controller’s natural frequency equal to the external excitation frequency. The obtained analytical and numerical simulations showed that the adaptive positive position feedback controller can suppress the main system nonlinear vibration close to zero regardless of the excitation force amplitude and excitation frequency.

1. Introduction

The occurrence of nonlinear vibration in different engineering systems such as aircraft wings, bridges, satellites, tall structures, robotic arms, rotating machinery, micro-electro-mechanical systems … etc. is an undesirable phenomenon. Accordingly, nonlinear vibration control became important in many engineering applications, where integrating networks of both the sensors and actuators are becoming an increasingly common feature of many engineering structures (smart structures). These sensors and actuators carry different tasks such as detecting damage, controlling unwanted vibrations, and in some cases reshaping the dynamical behaviors of the targeted system. The sensors and actuators are considered the eyes and hands of the smart structure and have a brain called a controller. Over the last few years, a large number of control algorithms have been applied to suppress or eliminate the nonlinear vibrations in different engineering systems. The positive position feedback (PPF) controller is one of the feasible control techniques that has been applied extensively to suppress the nonlinear vibration of a wide range of dynamical systems. Baz and Poh [1] and Baz and Hong [2] utilized a first-order filter with positive position feedback gain to control the nonlinear vibrations of the cantilever beam system. Friswell and Inman [3] utilized the high performance of the PPF controller in modal vibration control without spillover occurrence. The authors showed the possibility of designing the PPF controller as an output feedback controller using optimal control methods. Rew et al. [4] applied the adaptive positive position feedback controller to mitigate the nonlinear vibrations of a frequency varying the structure. Song et al. [5] investigated the robust positive position feedback controller for modal vibration control of a cantilever beam system. The authors confirmed experimentally that the PPF controller is a robust control algorithm either in single-mode or multi-mode vibration control. Song et al. [6] applied both the positive position feedback and the strain-rate feedback controllers to suppress the nonlinear vibrations of a cantilever beam system. Shan et al. [7] utilized the PPF controller to mitigate the multi-mode vibrations of a single-link flexible manipulator during the slewing process. The authors have designed two PPF controllers. One of them is proposed to control the first mode vibration, while the second PPF controller is dedicated to controlling the second mode oscillation. The obtained experimental results approved the capability of the applied control strategy in suppressing the system vibrations without spillover occurrences. Moon et al. [8] applied a multi-input multi-output PPF controller to control the nonlinear vibration of a smart grid structure. Kumar [9] utilized the PPF controller to mitigate the nonlinear vibration of a single-link flexible manipulator, where the hit and trial technique has been utilized to design the controller parameters. Shin et al. [10] applied multi-mode PPF controllers with single-input single-output to control the vibrations of the first three modes of a clamped beam system. Jun [11] applied the PPF controller as a linear vibration absorber to control the transversal vibrations of a cantilever beam system when subjected to the primary resonance case. The multiple time scales perturbation method has been utilized to investigate the whole system dynamics. The author confirmed that the applied controller has high efficiency in suppressing the system vibrations once the controller’s natural frequency is properly tuned to the main system’s natural frequency. According to Refs. [3,4,5,6,7,8,9,10], the best operational condition of the PPF controller can be achieved when tunning its natural frequency to become the same value as the main system’s natural frequency. Eissa et al. [12] presented an analytical investigation for a nonlinear PPF controller that has been coupled to a periodically excited nonlinear system. The authors reported that the best control efficiency of the PPF controller occurs when tunning its natural frequency to have the same value as the external excitation frequency. Ferrari and Amabili [13] applied the PPF controller to control the first four vibration modes of a rectangular sandwich plate system. Omidi et al. [14,15] introduced a nonlinear PPF controller in two modified versions in order to improve its vibration suppression efficiency. Syed [16] introduced a comparison between the positive position feedback controller and negative velocity feedback controller to control the nonlinear oscillation of a flexible link manipulator. Saeed et al. [17,18,19] applied the PPF controller to suppress the lateral vibrations and the corresponding whirling motion of the rotating machinery. The authors reported that the PPF controller can mitigate the rotating shafts lateral vibration close to zero when the controller’s natural frequency is tuned to have the same value as the shaft spinning speed. Zhao et al. [20] applied the nonlinear positive position feedback (NPPF) controller to suppress the nonlinear vibration of the Duffing oscillator. The controller is designed to be nonlinear according to symmetric theory, which states that the controller should be governed by the same equations like those of the main structure. Eissa et al. [21] investigated the performance of a control algorithm consisting of both the negative velocity and positive position feedback controllers. The time-delays of the control loop are included in the studied model. The authors showed that the integration of the velocity feedback controller to the PPF one enhances the control efficiency and widens the stable limits for the loop-delays.
Recently, the fraction-order PPF controller was introduced as a new strategy to suppress the nonlinear vibrations of the nonlinear dynamical systems [22,23,24]. Marinangeli et al. [22] applied both the conventional and the fractional-order PPF controllers to suppress the modal vibrations of a composite plate system with free-edges. The numerical and experimental results confirmed that the fractional-order PPF controller is the best control algorithm for suppressing the modal vibrations without spillover occurrence. Niu et al. [23] studied the vibration control of a vertical tail system utilizing both the PPF controller and fractional-order PPF controller. The authors showed that the fractional-order controller is more efficient in suppressing both the periodic and random vibration responses. Also, the optimal design of the positive position feedback controller parameters is introduced using the H2 and H optimization techniques [25,26].
Within this article, the adaptive positive position feedback (APPF) controller is introduced as a new control strategy to overcome the main problem of the conventional PPF controller when the resonance condition between the controller and the main system is lost. The main idea of the APPF controller is to track the external excitation frequency using an adaptive frequency measurement technique. Accordingly, the APPF controller is a conventional PPF controller that uses a real-time frequency tracking method to update its natural frequency to be the same value as the excitation frequency of the main system. Assuming the PPF controller’s natural frequency equal to the excitation frequency, a nonlinear analysis for the whole system mathematical model is presented applying perturbation methods. The steady-state vibration amplitudes of both the main system and APPF controller are explored. The obtained analytical and numerical investigations illustrated that the APPF controller can eliminate the main system nonlinear vibration regardless of the excitation force amplitude and excitation frequency.

2. Positive Position Feedback (PPF) Controller

The dimensionless dynamical equations that govern the oscillatory behaviors of a one-degree-of-freedom nonlinear system coupled with the conventional positive position feedback (PPF) controller as shown in Figure 1 are given as follows [12]:
x ¨ ( t ) + μ 1 x ˙ ( t ) + ω 1 2 x ( t ) + α x 3 ( t ) = f cos ( Ω t ) + γ   y ( t )
y ¨ ( t ) + μ 2 y ˙ ( t ) + ω 2 2 y ( t ) = λ x ( t )
where γ y ( t ) denotes the control signal, while λ x ( t ) represents the feedback signal.

2.1. Mathematical Analysis

As the system model given by Equation (1) is a nonlinear system, the asymptotic analysis is sought to obtain a second-order approximate solution of Equation (1) as follows [27]:
x ( t , ε ) = x 1 ( T 0 , T 1 , T 2 ) + ε x 2 ( T 0 , T 1 , T 2 ) + ε 2 x 3 ( T 0 , T 1 , T 2 ) + O ( ε 3 )
y ( t , ε ) = y 1 ( T 0 , T 1 , T 2 ) + ε y 2 ( T 0 , T 1 , T 2 ) + ε 2 y 3 ( T 0 , T 1 , T 2 ) + O ( ε 3 )
where ε is a small perturbation parameter used as a book-keeping only, T 0 = t ,   T 1 = ε t and T 2 = ε 2 t are three time scales used to capture the fast and slow dynamics of the considered system. In terms of the fast and slow time scales T 0 ,   T 1 and T 2 , the time derivatives d d t and d 2 d t 2 can be expressed as follows:
d d t = D 0 + ε D 1 + ε 2 D 2 ,       d 2 d t 2 = D 0 2 + 2 ε D 0 D 1 + ε 2 ( D 1 2 + 2 D 2 D 0 ) , D j = T j ,         j = 0 ,   1 ,   2 .
According to the order of nonlinearity, the system parameters are scaled as follows:
γ = ε γ ^ ,       λ = ε λ ^ ,               μ 1 = ε 2 μ ^ 1 ,             μ 2 = ε 2 μ ^ 2 ,                   α = ε 2 α ^ ,               f = ε 2 f ^
Substituting Equations (2)–(4) into Equation (1), and then equating the coefficient of the same power of ε , we obtain the following set of linear ordinary differential equations:
O ( ε 0 ):
( D 0 2 + ω 1 2 ) x 1 = 0
( D 0 2 + ω 2 2 ) y 1 = 0
O ( ε 1 ):
( D 0 2 + ω 1 2 ) x 2 = 2 D 0 D 1 x 1 + γ ^   y 1
( D 0 2 + ω 2 2 ) y 2 = 2 D 0 D 1 y 1 + λ ^   x 1
O ( ε 2 ):
( D 0 2 + ω 1 2 ) x 3 = 2 D 0 D 1 x 2 D 1 2 x 1 2 D 2 D 0 x 1 μ ^ 1 D 0 x 1 α ^   x 1 3 + γ ^   y 2 + f ^ cos ( Ω t )
( D 0 2 + ω 2 2 ) y 3 = 2 D 0 D 1 y 2 D 1 2 y 1 2 D 2 D 0 y 1 μ ^ 2 D 0 y 1 + λ ^   x 2
Accordingly, the solutions of the homogenous differential Equation (5) can be expressed as follows:
x 1 ( T 0 , T 1 , T 2 ) = A ( T 1 , T 2 ) e i ω 1 T 0 + c c
y 1 ( T 0 , T 1 , T 2 ) = B ( T 1 , T 2 ) e i ω 2 T 0 + c c
where c c denotes the complex conjugate of the preceding terms. Inserting Equation (8) into Equation (6), we get
( D 0 2 + ω 1 2 ) x 2 = 2 i ω 1 e i ω 1 T 0 D 1 A + γ ^   B e i ω 2 T 0 + c c
( D 0 2 + ω 2 2 ) y 2 = 2 i ω 2 e i ω 2 T 0 D 1 B + λ ^   A e i ω 1 T 0 + c c
Before we proceed to the next approximation, we must know all the possible resonance cases which are the primary resonance ( Ω = ω 1 ), internal resonance ( ω 2 = ω 1 ), and simultaneous resonance ( Ω = ω 1 = ω 2 ). The simultaneous resonance case is considered within this work. Accordingly, the closeness of Ω and ω 2 to ω 1 can be expressed using the detuning parameters   σ 1   and   σ 2 as follows:
Ω = ω 1 + σ 1 =   ω 1 + ε σ ^ 1   and     ω 2 = ω 1 + σ 2 = ω 1 + ε σ ^ 2
Substituting Equation (10) into the secular and small-divisor terms of Equation (9), we get
( D 0 2 + ω 1 2 ) x 2 = ( 2 i ω 1 D 1 A + γ ^ B e i σ ^ 2 T 1 ) e i ω 1 T 0 + c c  
( D 0 2 + ω 1 2 ) y 2 = ( 2 i ω 2 D 1 B + λ ^ A e i σ ^ 2 T 1 ) e i ω 2 T 0 + c c  
The solvability conditions of Equation (11) are:
2 i ω 1 D 1 A γ ^   B e i σ ^ 2 T 1 = 0 ,   and   2 i ω 2 D 1 B λ ^   A e i σ ^ 2 T 1 = 0
Accordingly, the solutions of Equation (11) are:
x 2 ( T 0 , T 1 , T 1 ) = δ ( T 1 , T 2 ) e i ω 1 T 0 + δ ¯ ( T 1 , T 2 ) e i ω 1 T 0
y 2 ( T 0 , T 1 , T 1 ) = ρ ( T 1 , T 2 ) e i ω 2 T 0 + ρ ¯ ( T 1 , T 2 ) e i ω 2 T 0
Substituting Equations (8) and (13) into Equation (7), we get
( D 0 2 + ω 1 2 ) x 3 = [ 2 i ω 1 D 1 δ D 1 2 A 2 i ω 1 D 2 A i μ ^ 1 ω 1 A 3 α ^ A 2 A ¯
+ γ ^ ρ e i σ ^ 2 T 1 + f ^ 2 e i σ ^ 1 T 1 ] e i ω 1 T 0 α ^ A 3 e 3 i ω 1 T 0 + c c
( D 0 2 + ω 2 2 ) y 3 = [ 2 i ω 2 D 1 ρ D 1 2 B 2 i ω 2 D 2 B i μ ^ 2 ω 2 B + λ ^ δ e i σ ^ 2 T 1 ] e i ω 2 T 0 + c c
By choosing 2 i ω 1 D 1 δ D 1 2 A + γ ^ ρ e i σ ^ 2 T 1 = 0 and 2 i ω 2 D 1 ρ D 1 2 B + λ ^ δ e i σ ^ 2 T 1 = 0 , one finds the solvability conditions of Equation (14) as follows:
2 i ω 1 D 2 A i μ ^ 1 ω 1 A 3 α ^ A 2 A ¯ e i ω 1 T 0 + f ^ 2 e i σ ^ 1 T 1 = 0
2 i ω 2 D 2 B i ω 2 μ ^ 2 B = 0
Inserting Equations (12) and (15) into Equation (3), we get
2 i ω 1 A ˙ = 2 i ω 1 d d t A = ε γ ^   B e i σ ^ 2 T 1 ε 2 [ i μ ^ 1 ω 1 A + 3 α ^   A 2 A ¯ e i ω 1 T 0 f ^ 2 e i σ ^ 1 T 1 ]
2 i ω 2 B ˙ = 2 i ω 2 d d t B = ε λ ^   A e i σ ^ 2 T 1 ε 2 i ω 2 μ ^ 2 B
To analyze the solutions of Equation (16), one can express A and B in the polar for as follows:
A = 1 2 a 1 e i β 1 A ˙ = d A d t = 1 2 a ˙ 1 e i β 1 + 1 2 i a 1 β ˙ 1 e i β 1
B = 1 2 a 2 e i β 2 B ˙ = d B d t = 1 2 a ˙ 2 e i β 2 + 1 2 i a 2 β ˙ 2 e i β 2
where a 1 and a 2 are the steady-state vibration amplitudes of the system and PPF controller, respectively, while β 1 and β 2 are the phases of the motion. Substituting Equation (17) into Equation (16), and applying the reconstitution method [28], we get
i ω 1 a ˙ 1 ω 1 a 1 β ˙ 1 = 1 2 γ   a 2 e i ( β 2 β 1 + σ 2 t ) 1 2 i μ 1 ω 1 a 1 3 8 α   a 1 3 + f 2 e i ( σ 1 t β 1 )
i ω 2 a ˙ 2 ω 2 a 2 β ˙ 2 = 1 2 λ   a 1 e i ( β 2 β 1 + σ 2 t ) 1 2 i ω 2 μ 2 a 2
Separating the real and imaginary parts of Equation (18), one can get the following autonomous amplitude-phase modulating equations
a ˙ 1 = 1 2 μ 1 a 1 + 1 2 ω 1 γ a 2 sin ( φ 2 ) + f 2 ω 1 sin ( φ 1 )
a ˙ 2 = 1 2 μ 2 a 2 1 2 ω 2 λ a 1 sin ( φ 2 )
φ ˙ 1 = σ 1 3 8 ω 1 α a 1 2 + 1 2 ω 1 a 1 γ a 2 cos ( φ 2 ) + f 2 ω 1 a 1 cos ( φ 1 )
φ ˙ 2 = σ 2 3 8 ω 1 α a 1 2 + ( γ a 2 2 ω 1 a 1 λ a 1 2 ω 2 a 2 ) cos ( φ 2 ) + f 2 ω 1 a 1 cos ( φ 1 )
where φ 1 = β 1 + σ 1 t and φ 2 = β 2 β 1 + σ 2 t .

2.2. Steady-State Vibration and Stability Investigations

At steady-state, we have a ˙ 1 =   a ˙ 2 =   φ ˙ 1 = φ ˙ 2 = 0.0 . Substituting this condition into Equation (19), we get the following nonlinear algebraic equations:
1 2 μ 1 a 1 = 1 2 ω 1 γ a 2 sin ( φ 2 ) + f 2 ω 1 sin ( φ 1 )
μ 2 ω 2 a 2 = λ a 1 sin ( φ 2 )
σ 1 = 1 2 ω 1 a 1 γ a 2 cos ( φ 2 ) + 3 8 ω 1 α a 1 2 f 2 ω 1 a 1 cos ( φ 1 )
2 ( σ 1 σ 2 ) ω 2 a 2 = λ a 1 cos ( φ 2 )
Eliminating φ 1 and φ 2 from Equation (20), we get the following frequency-response equations that govern the steady-state vibration amplitudes of the system and controller.
[ μ 2 2 + 4 ( σ 1 σ 2 ) 2 ] ω 2 2 a 2 2 = λ 2 a 1 2
[ 2 σ 1 ω 1 a 1 3 4 α a 1 3 2 ( σ 1 σ 2 ) ω 2 γ a 2 2 λ a 1 ] 2 + [ μ 1 ω 1 a 1 + μ 2 ω 2 γ a 2 2 λ a 1 ] 2 = f 2
By solving the obtained nonlinear algebraic equations (i.e., Equation (21)) in terms of different system parameters utilizing σ 1 or f as a bifurcation control parameter, one can obtain different response curves given Section 2.3. Moreover, the stability of the obtained solution can be explored by examining the eigenvalues of the Jacobian matrix of the right-hand side of Equation (19). To derive the stability criteria, let a 10 ,   a 20 ,   φ 10 and φ 20 is the steady-state solution of Equation (20), while a 11 ,   a 21 ,   φ 11 and φ 21 is a small perturbation about that steady-state solution. Accordingly, we can assume that [27]:
a 1 = a 11 + a 10 ,       a 2 = a 21 + a 20 ,     φ 1 = φ 11 + φ 10 ,     φ 2 = φ 21 + φ 20 a ˙ 1 = a ˙ 11 ,   a ˙ 2 = a ˙ 21 ,     φ ˙ 1 = φ ˙ 11 ,     φ ˙ 2 = φ ˙ 21
Substituting Equation (22) into Equation (19), we get the following linear dynamical system:
[ a ˙ 11 φ ˙ 11 a ˙ 21 φ ˙ 21 ] = [ R 11 R 12 R 13 R 14 R 21 R 22 R 23 R 24 R 31 R 32 R 33 R 34 R 41 R 42 R 43 R 44 ] [ a 11 φ 11 a 21 φ 21 ]
The above square matrix is the Jacobian matrix. The linear system is given by Equation (23) is topologically equivalent to the nonlinear system given by Equation (19) as long as the eigenvalues are hyperbolic. Thus, the stability of the nonlinear system given by Equation (19) depends on the eigenvalues of the obtained Jacobian matrix in Equation (23). Accordingly, the eigenvalues of the linear system given by Equation (23) can obtain as follows:
|                 R 11 Δ R 12 R 13 R 14 R 21                   R 22 Δ R 23 R 24 R 31 R 32                 R 33 Δ R 34 R 41 R 42 R 43                 R 44 Δ | = 0
Expanding the above determinate, one can obtain the following characteristic equation:
Δ 4 + β 1 Δ 3 + β 2 Δ 2 + β 3 Δ + β 4 = 0
where Δ is the eigenvalue of the Jacobian matrix, and β 1 ,   β 2 ,   β 3 , and β 4 are the coefficients of Equation (25). The Routh–Hurwitz criterion is used to establish the stability of the equilibrium solutions. According to Routh–Hurwitz criterion, the necessary and sufficient conditions for the system stability are:
β 1 > 0 ,               β 1 β 2 β 3 > 0 ,       β 3   ( β 1 β 2 β 3 ) β 1 2 β 4 > 0 ,           β 4 > 0

2.3. Response Curves and Numerical Validations

According to the obtained frequency-response equation (i.e., Equation (21)), the different response curves of both the main system and PPF controller are obtained as in Figure 2, Figure 3, Figure 4, Figure 5, Figure 6, Figure 7, Figure 8 and Figure 9. The results are presented in graphical forms as steady-state vibration amplitudes ( a 1   &   a 2 ) against the detuning parameter σ 1 or the excitation amplitude f . In addition, the stability of the obtained solution is investigated according to the condition given by Equation (26). In all obtained response curves, the solid line refers to the stable solution, while the dotted line represents the unstable one. Moreover, numerical validations for some obtained response curves are performed via solving the system temporal equations (i.e., Equation (1)) numerically using ODE45 MATLAB solver. The numerical results are marked as small circles when sweeping the bifurcation parameter forward and as big-dots when sweeping the bifurcation parameter backward. The obtained figures were plotted by adopting the values of the system parameters given in Table 1 unless otherwise specified.
Figure 2a shows the uncontrolled system frequency-response curve for three different values of the external excitation force f , while Figure 2b illustrates the uncontrolled system force-response curve at two different values of the detuning parameter σ 1 . It is clear from Figure 2 that the system oscillation amplitude is a monotonic increasing function of the excitation force, where increasing the excitation force amplitude bent the frequency-response curve to the right leading to a hardening effect and the appearance of the jump phenomenon. Besides, the figure illustrates the dominance of nonlinearities on the system response curves at large values of the excitation force, where the system may have bistable solutions depending on both the excitation force f and excitation frequency Ω .
The system frequency-response curve after the connection of the PPF controller is showed in Figure 3, where Figure 3a shows the main system frequency-response curve, while Figure 3b illustrates the PPF controller frequency-response curve. It is clear from Figure 3a that the main system vibration amplitude is approximately suppressed to zero, while the excess energy is transferred to the connected controller when σ 1 = 0 (i.e., when Ω = ω 1 from Equation (10)). However, the controlled system may suffer from high oscillation amplitudes and jump phenomenon occurrence at two frequency bands on both sides of σ 1 = 0 (i.e., when σ 1 ± 0.1 ). This means that the PPF controller can suppress the primary resonance vibration of the considered system effectively when excitation frequency ( Ω ) is very close to the system natural frequency ( ω 1 ). But, when the excitation frequency becomes higher or lower than the system’s natural frequency, the PPF controller increases the vibration amplitudes rather than suppressing them.
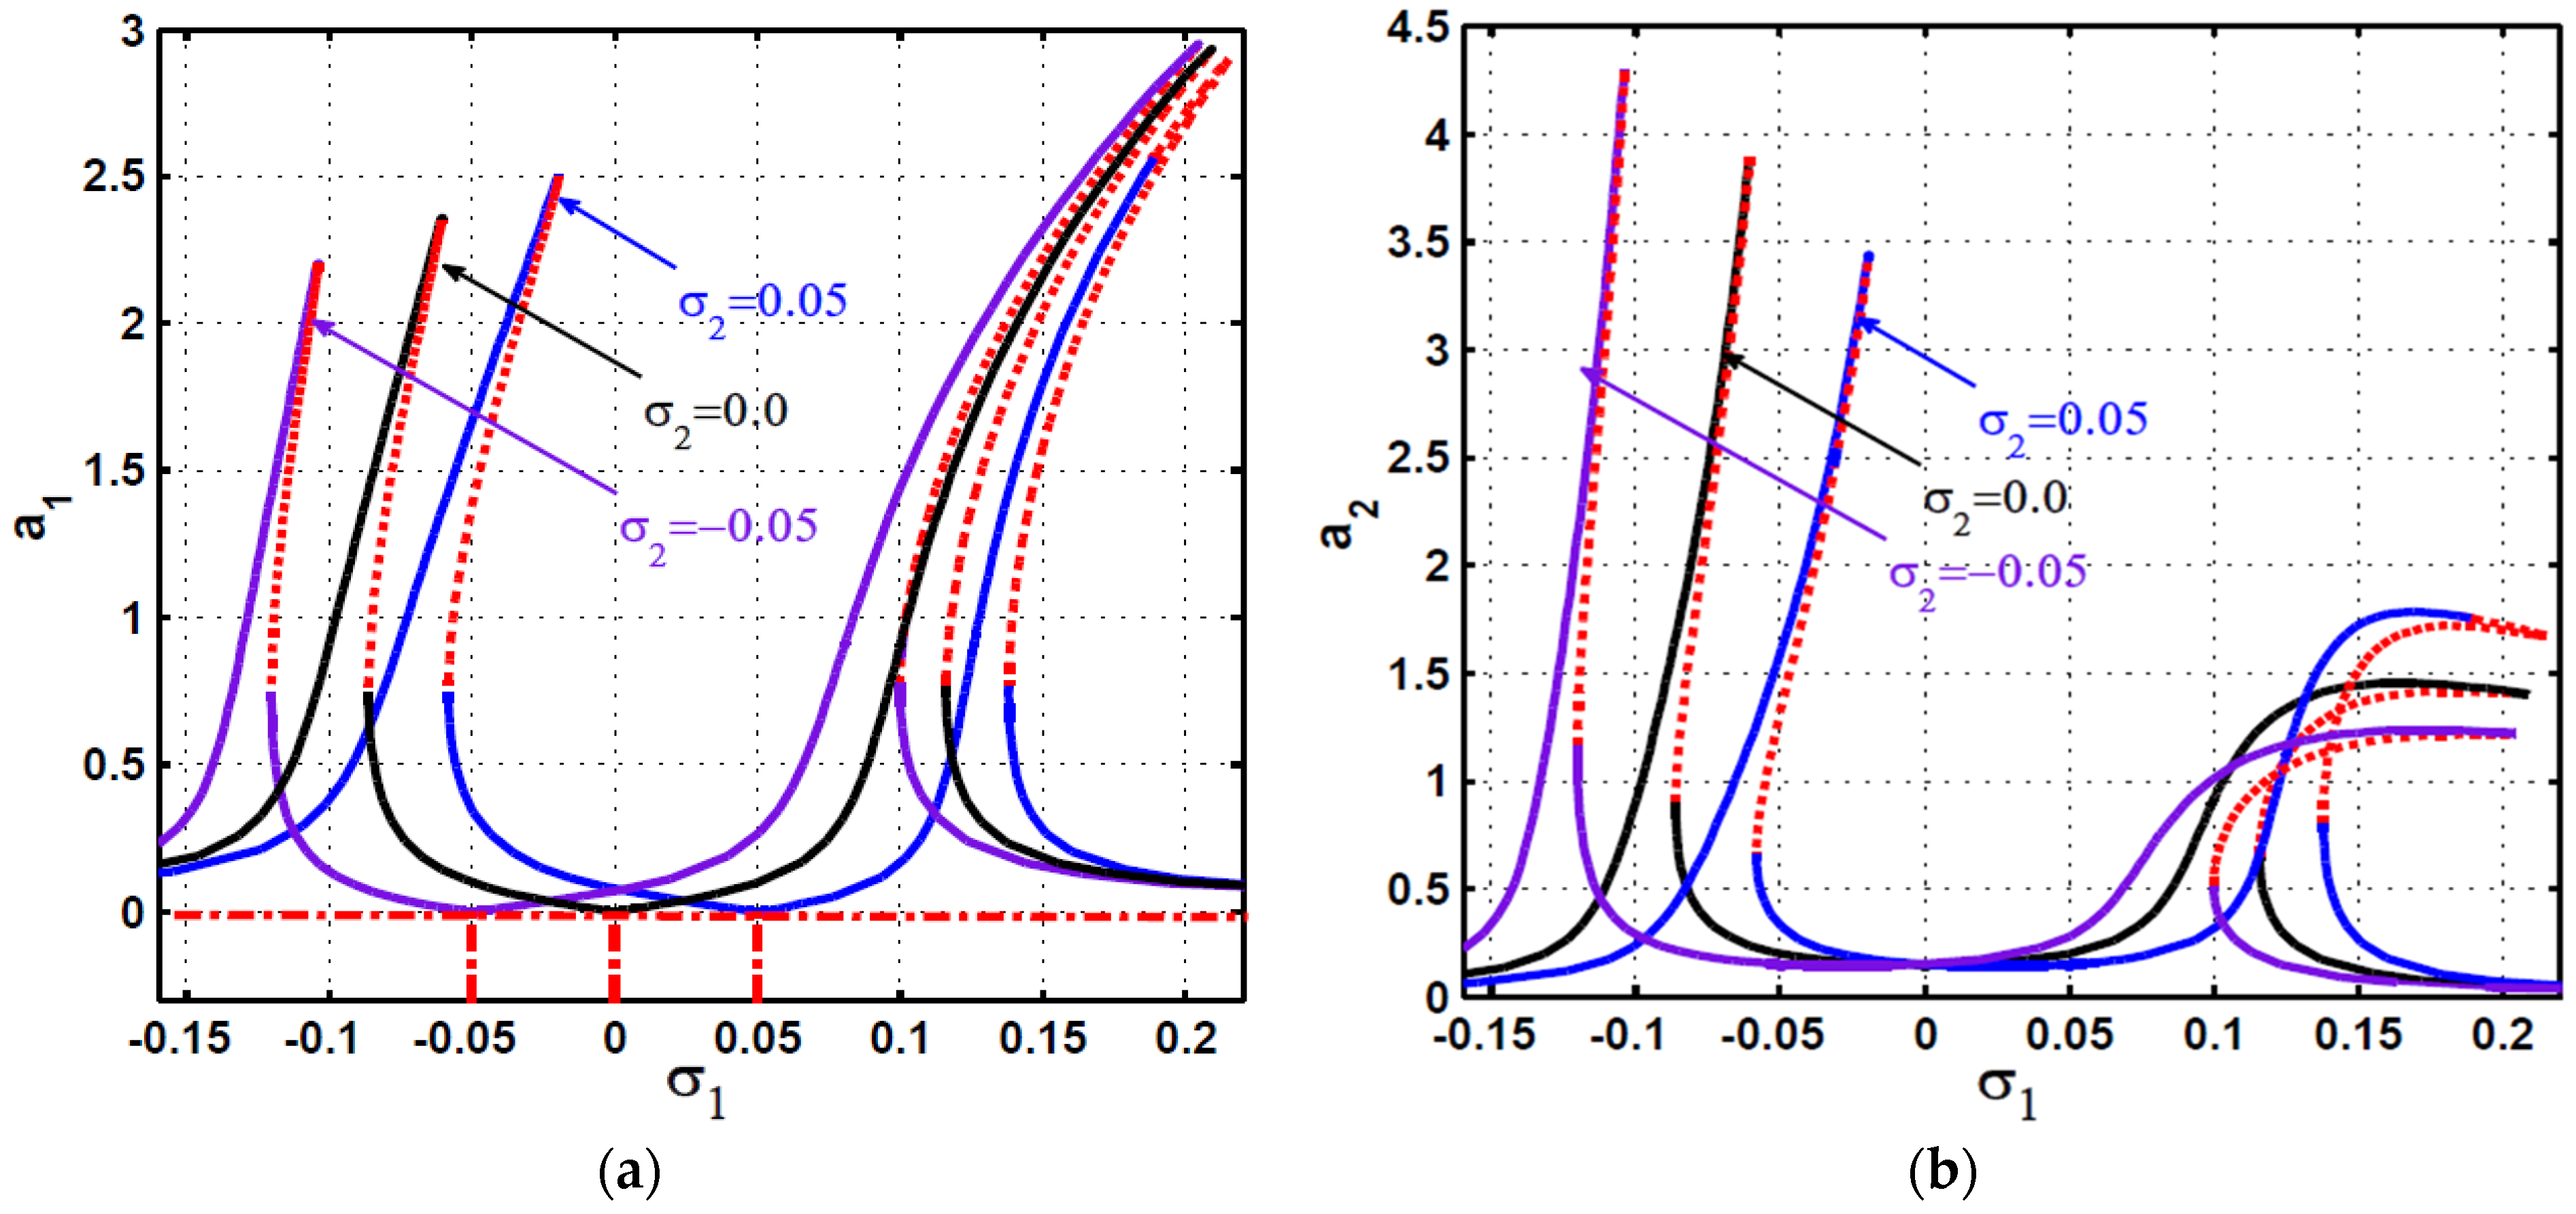
The controlled system frequency-response curves at three different values of the internal detuning parameter σ 2 are illustrated in Figure 4. By examining Figure 4a, we can conclude that the minimum steady-state vibration amplitude of the main system ( a 1 ) occurs when σ 1 = σ 2 (i.e., when Ω = ω 2 from Equation (10)), where for σ 2 = 0.05 the minimum oscillation amplitude ( a 1 ) occurred at σ 1 = 0.05 , for σ 2 = 0.0 the minimum oscillation amplitude ( a 1 ) occurred at σ 1 = 0.0 , and for σ 2 = 0.05 the minimum oscillation amplitude ( a 1 ) occurred at   σ 1 = 0.05 . By substituting this condition (i.e.,   σ 1 = σ 2 ) into Equation (10), we can get Ω = ω 2 . Accordingly, the optimum vibration suppression efficiency of the PPF controller occurs when tuning its natural frequency ( ω 2 ) to be the same value as the external excitation frequency ( Ω ).
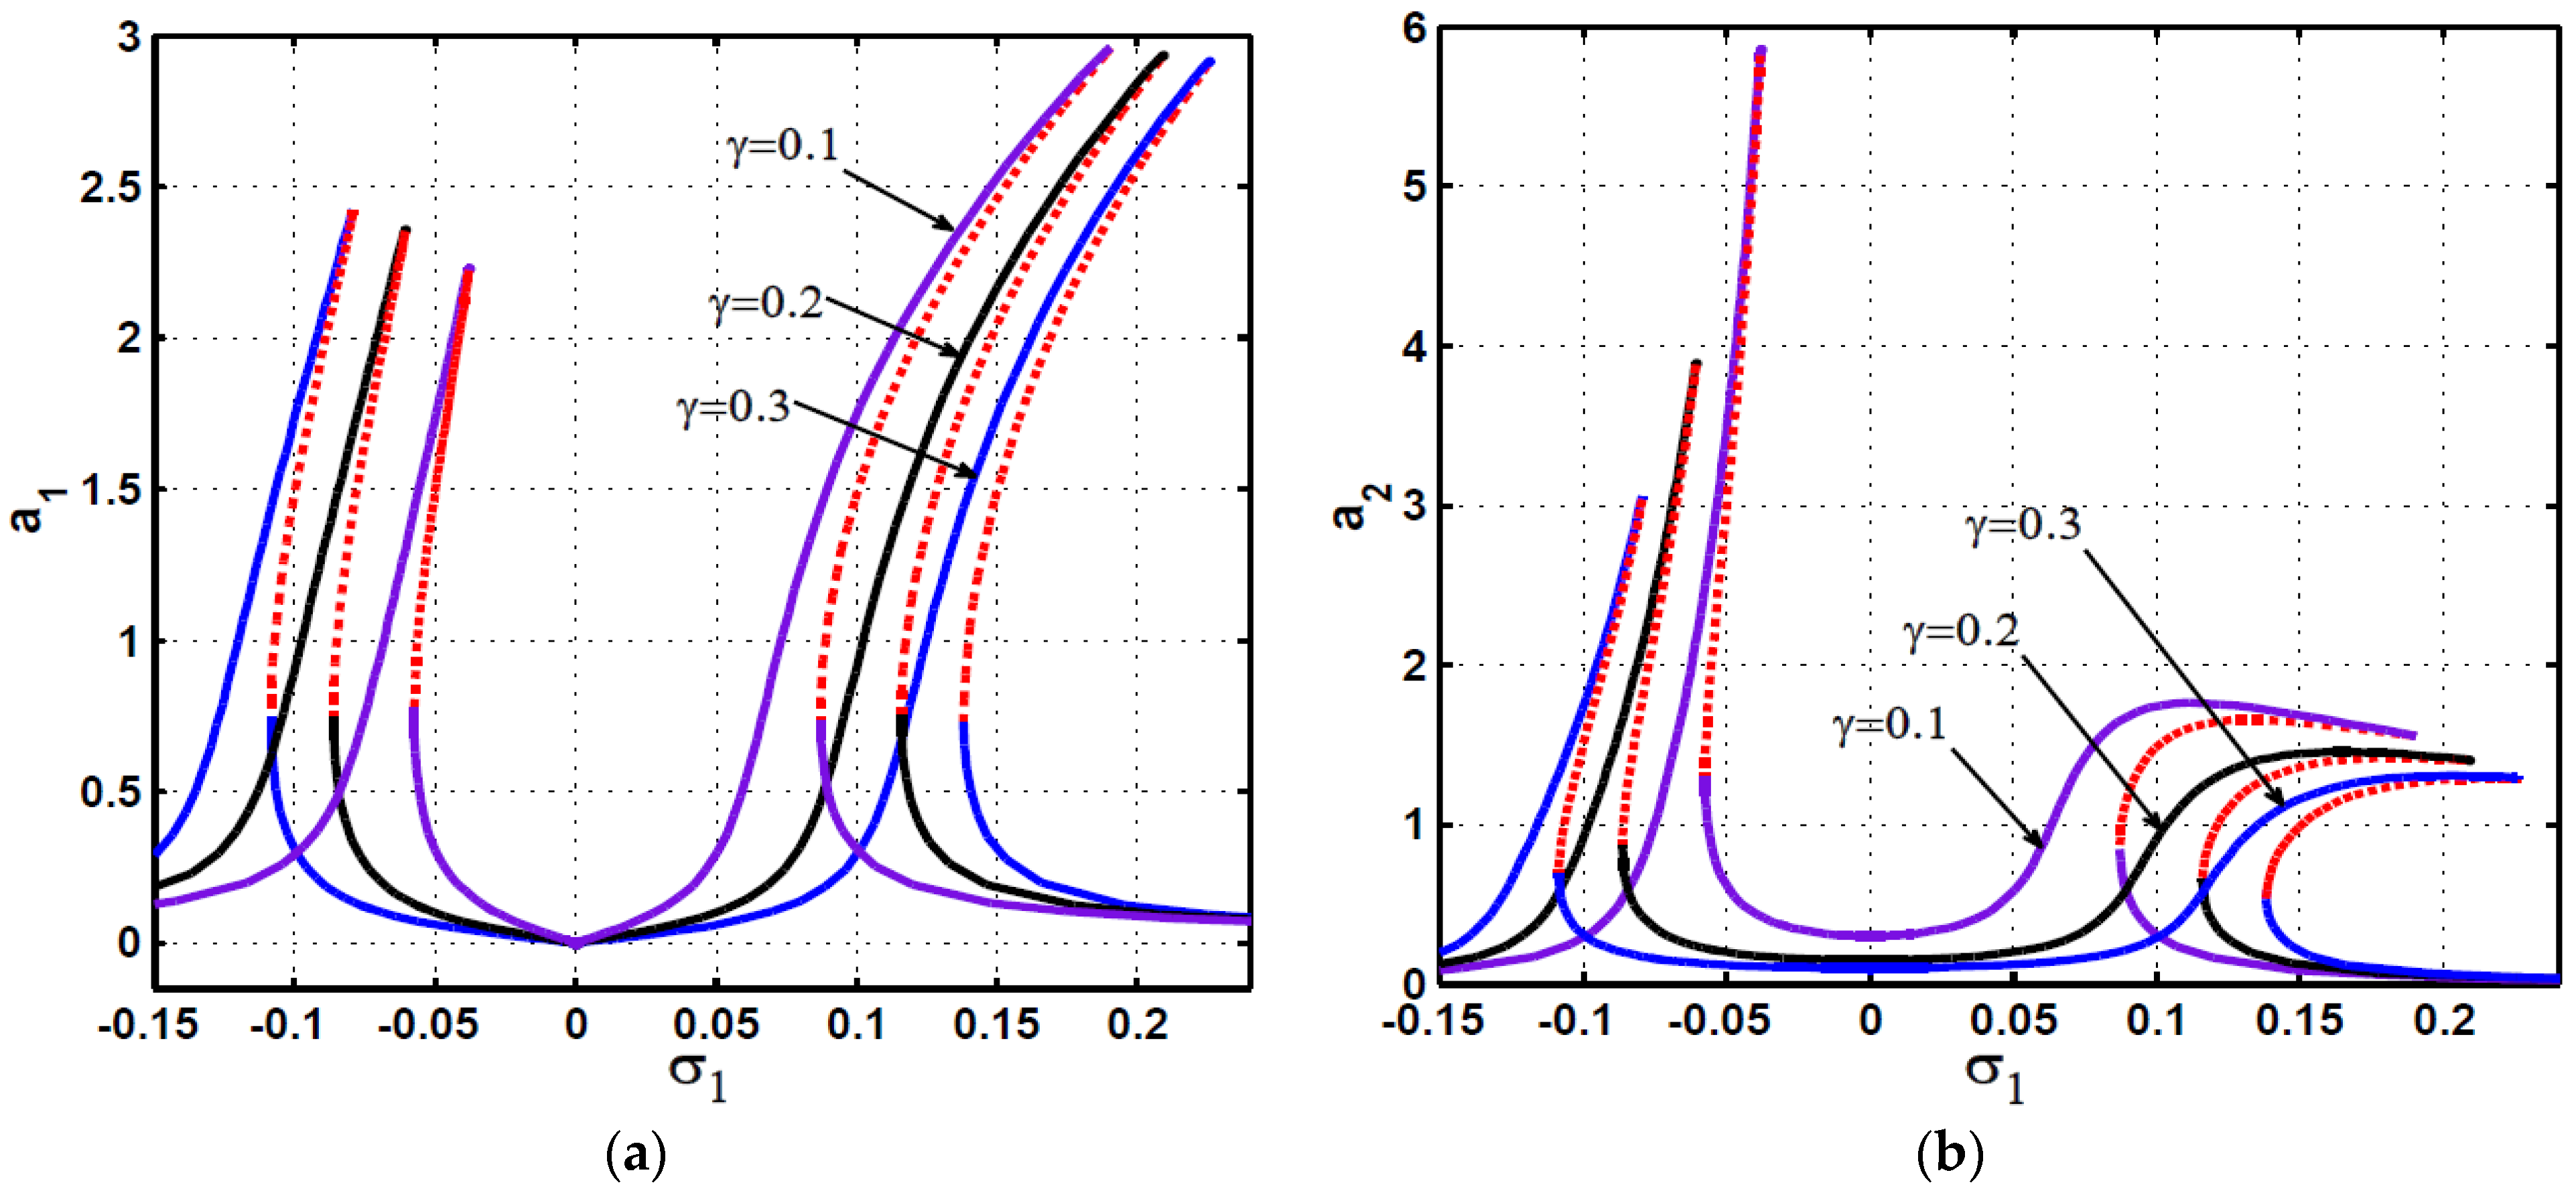
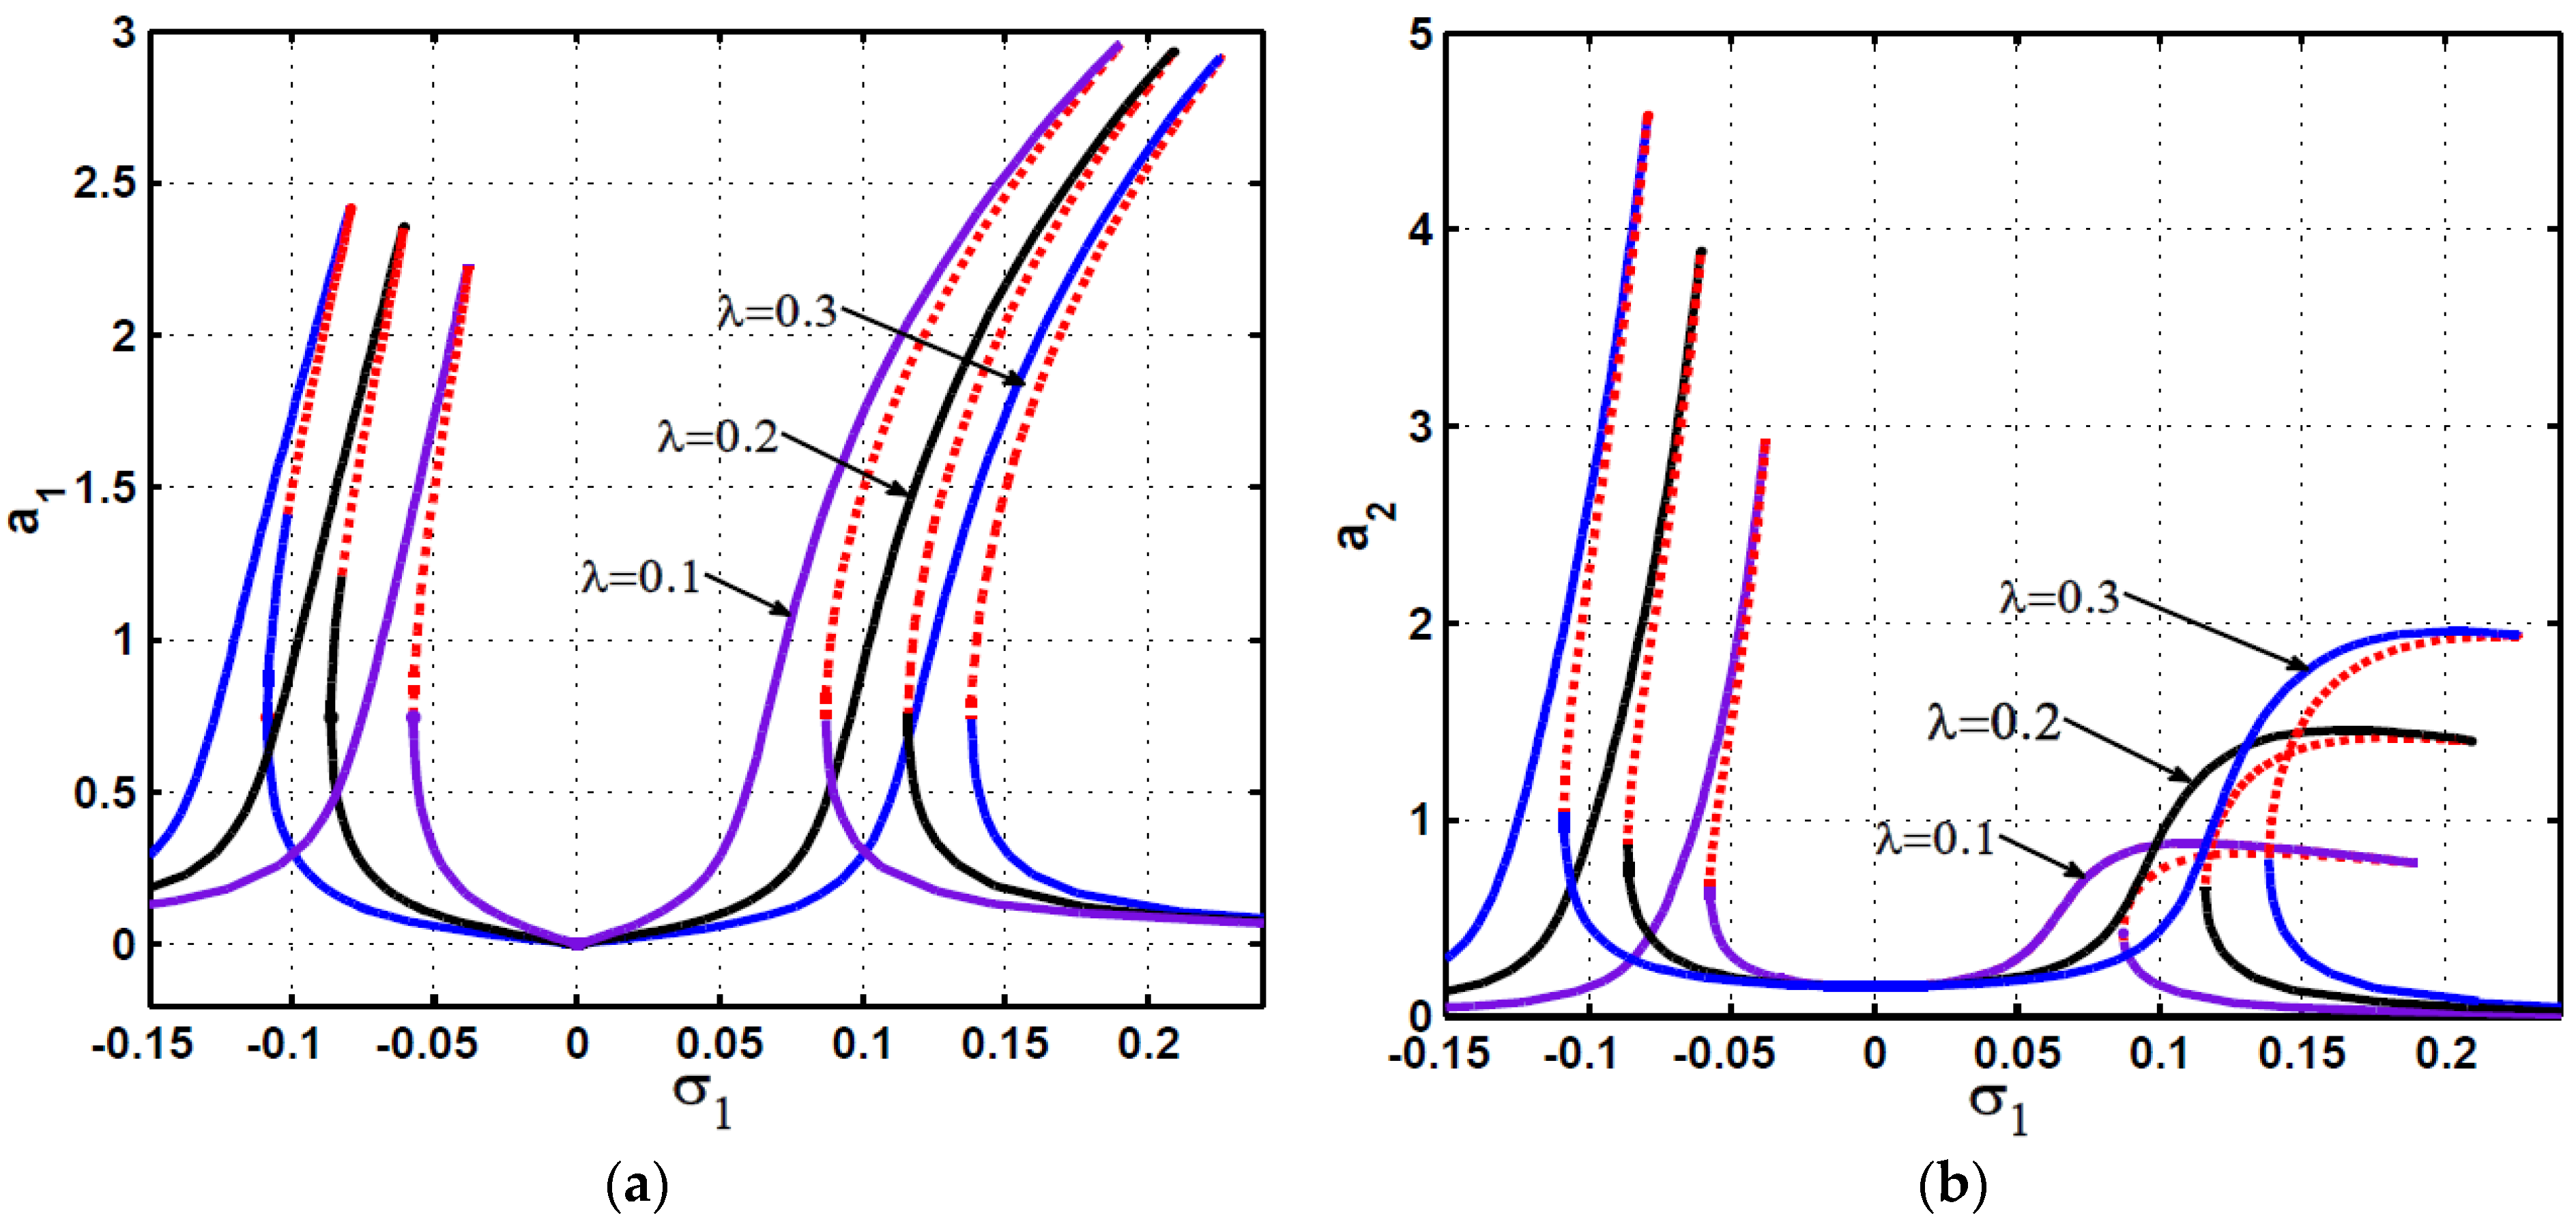
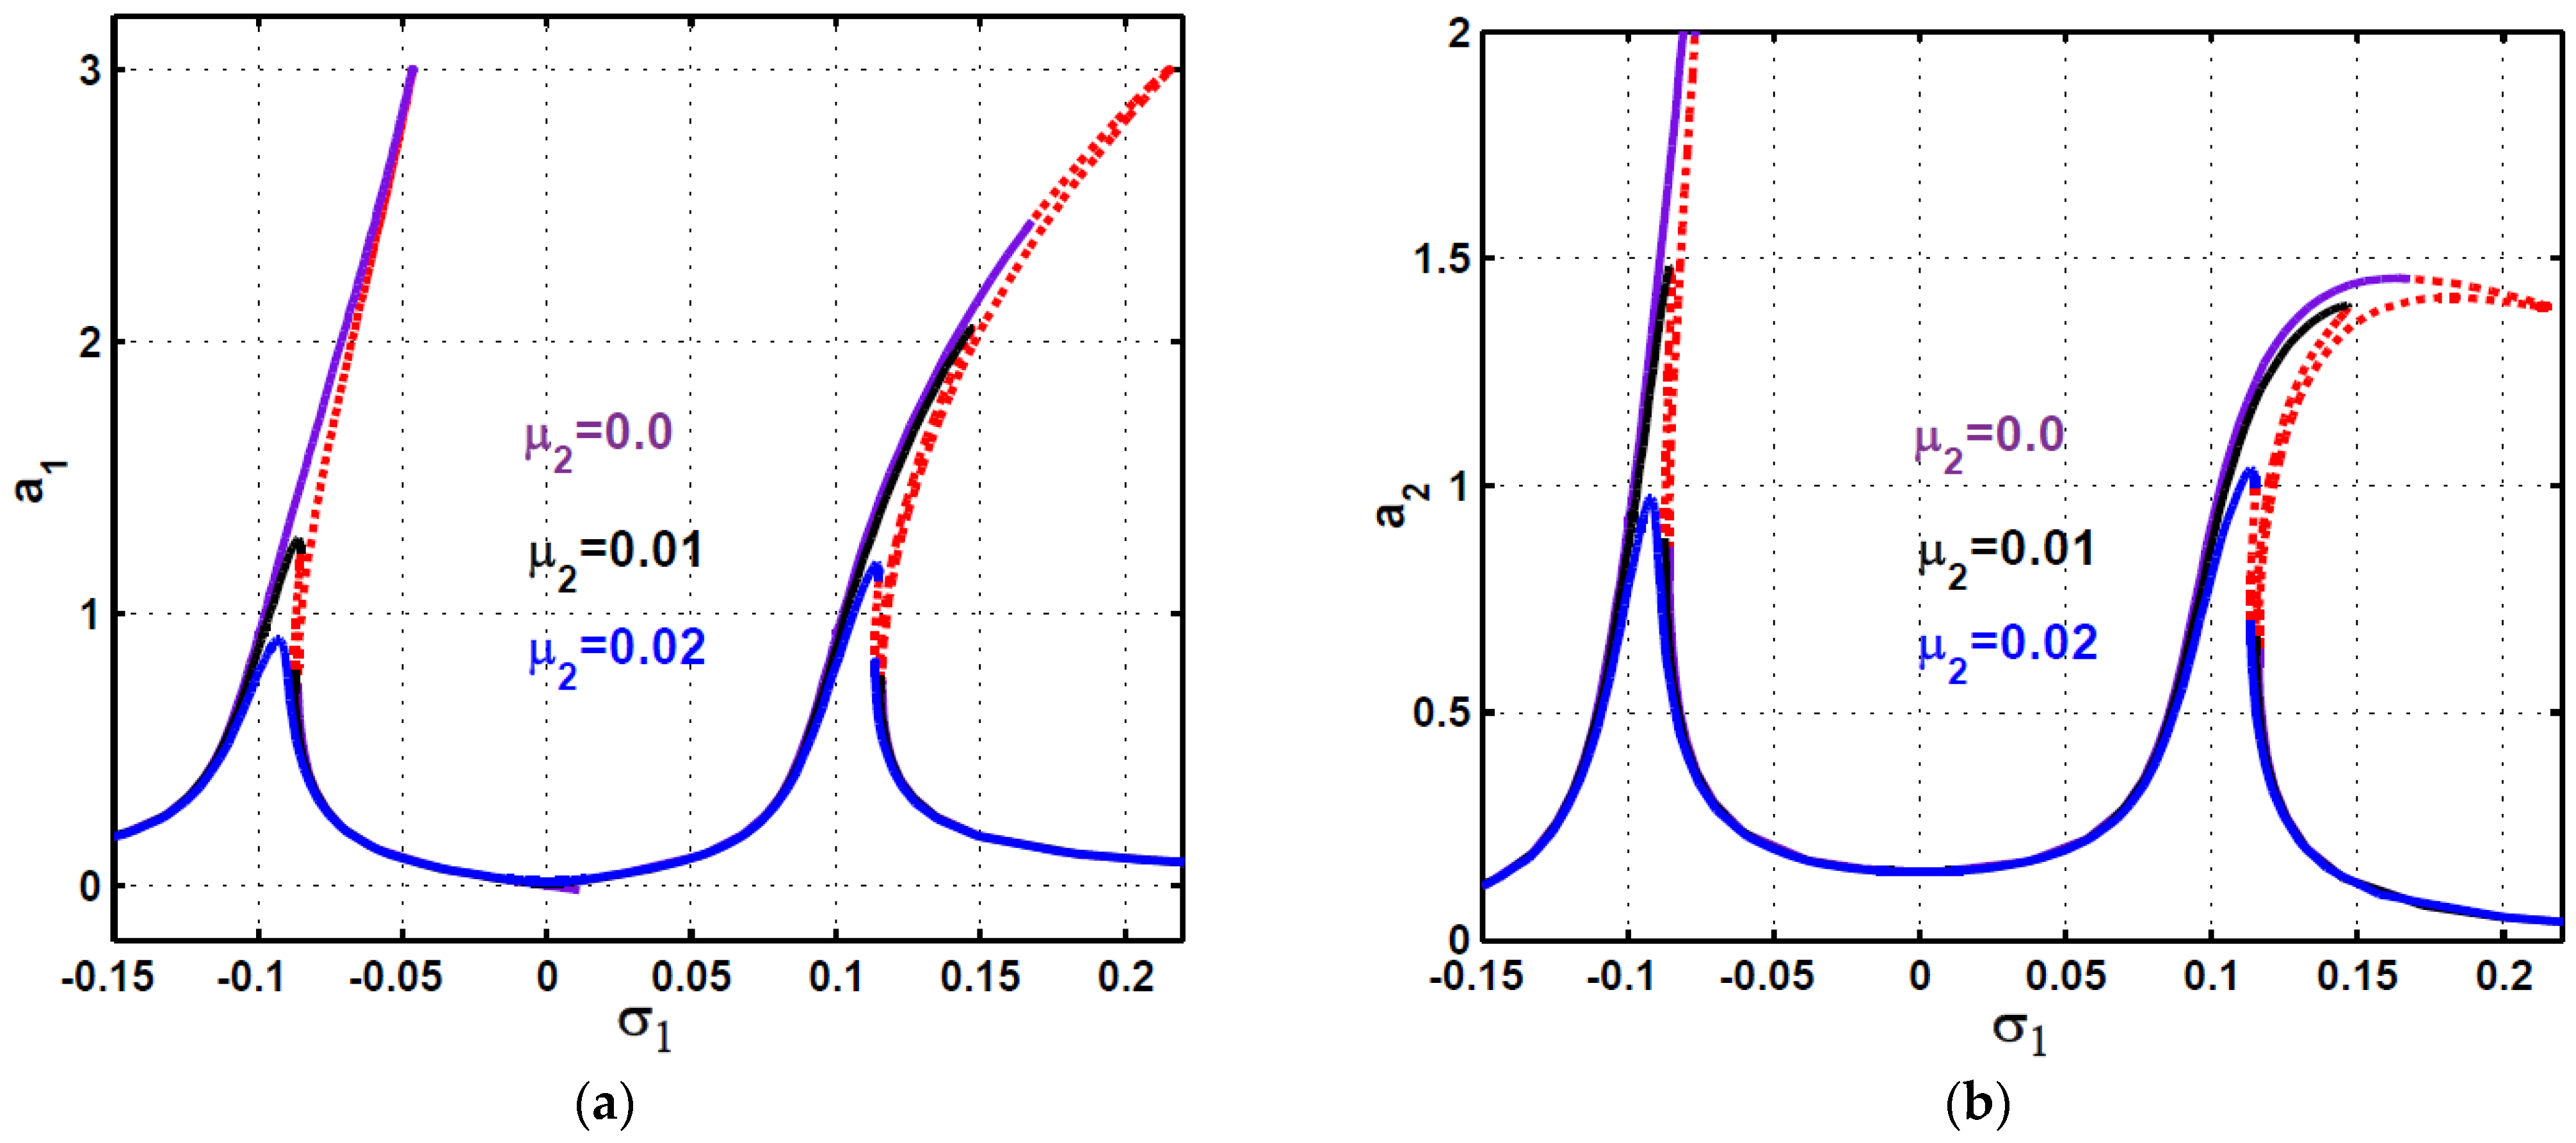
The effect of the control gain γ and feedback gain λ on the frequency-response curves of both the main system and PPF controller is illustrated in Figure 5 and Figure 6, respectively. It is clear from Figure 5a and Figure 6a that the increasing of the control gain and/or feedback gain widen the frequency bandwidth in which the PPF controller can suppress the system nonlinear vibrations. However, increasing γ or/and λ increases the peak amplitudes on both sides of σ 1 = 0.0 . Also, Figure 5b and Figure 6b show that the increasing of γ decreases the controller steady-state oscillation amplitude while the increasing of λ increases the controller vibration amplitude. Figure 7 illustrates the influence of the controller linear damping coefficient μ 2 on frequency-response curves of the main system and controller. It is noted that the existence of multiple-solution and jump phenomenon occurrence depends on the value of μ 2 , where for small values of the damping coefficient (i.e., μ 2 = 0.0 ,   0.01 ), the multiple-solution and jumping phenomenon appear on both sides of σ 1 = 0.0 . But, for large values of the damping coefficient (i.e., μ 2   0.02 ), both the main system and the PPF controller respond as a linear system with two vibration peaks on both side of σ 1 = 0.0 . However, it is worth mentioning that the increase in μ 2 decreases the PPF controller efficiency in eliminating the primary resonance excitations.
The frequency-response curve of the controlled system for three different values of the excitation force amplitude is shown in Figure 8. It is clear from Figure 8a that the main system vibration amplitude on both side of σ 1 = 0.0 is a monotonic increasing function of the excitation force, but the controller can keep the system vibration very small at σ 1 = 0.0 . This means that the PPF controller has excellent efficiency in suppressing the main system vibrations as long as Ω = ω 2 regardless of the excitation force amplitude.
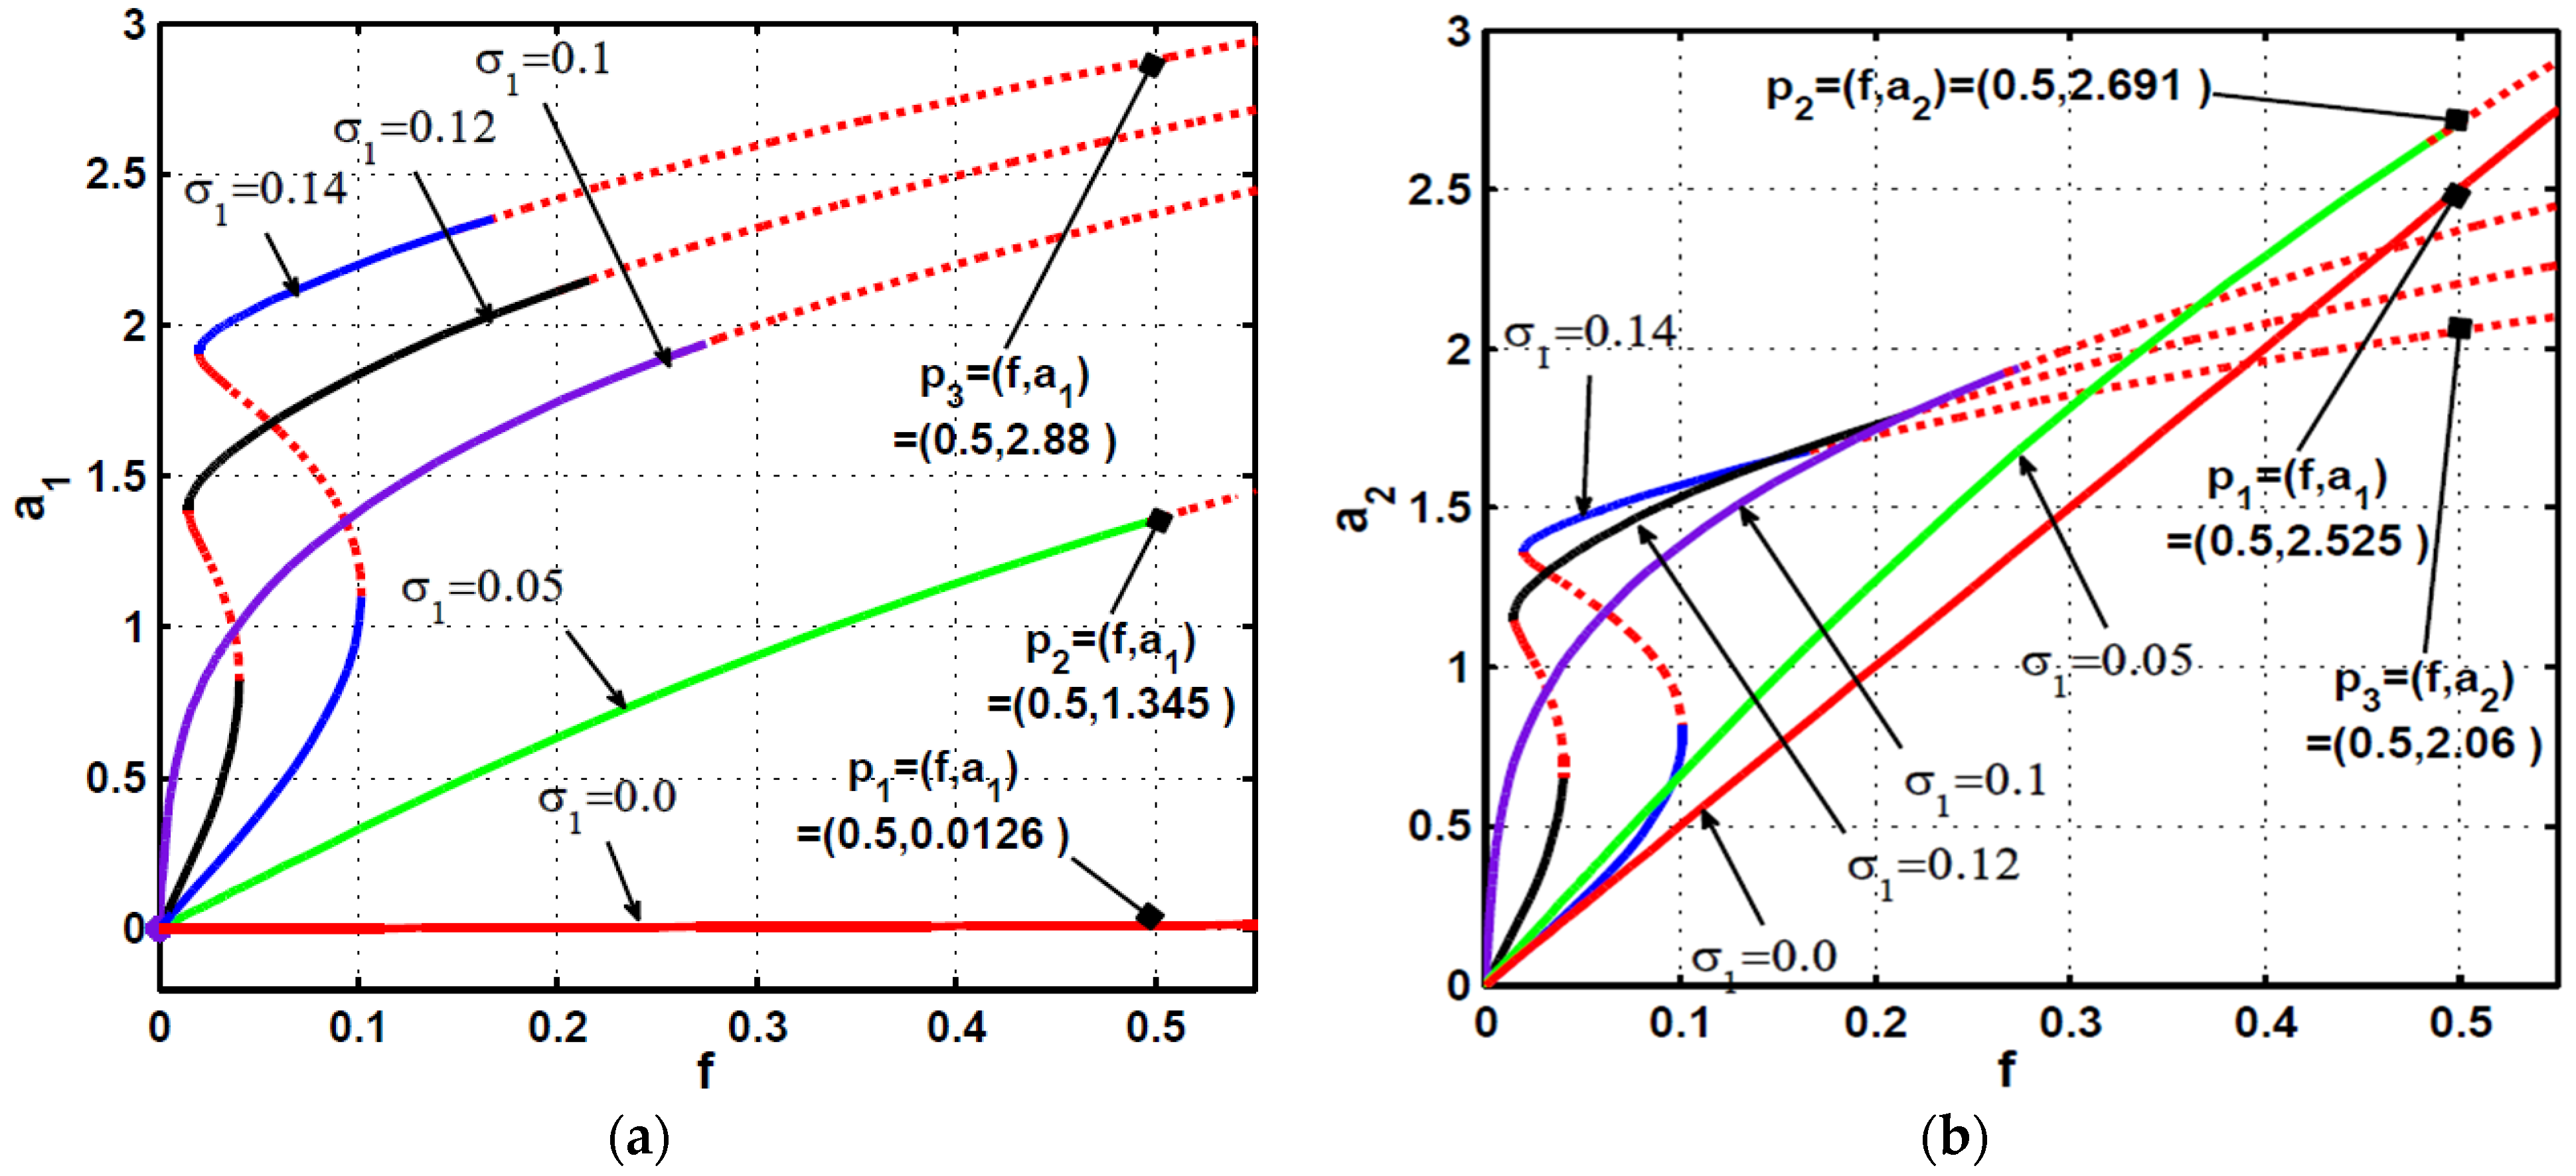
Figure 9 shows a typical force-response curve of both the main system and the controller for five different values of the external detuning parameter σ 1 in the presence of 1:1 internal resonance (i.e., σ 2 = 0 ). The trace of the vibration amplitudes a 1 and a 2 depends on the external detuning σ 1 . Initially, a 1 and a 2 are zeros, and they follow the curve according to the value of   σ 1 . It is clear from Figure 9a that the main system vibration amplitude ( a 1 ) is a nearly constant (with a value close to zero), while the controller vibration amplitude ( a 2 ) increases in a linear form as the excitation amplitude increases when   σ 1 = 0.0 , but both the main system and the controller steady-state amplitude increase in nonlinear form as the excitation amplitude increase when   σ 1 0 . Besides, at   σ 1 0 , the main system may suffer from jump phenomena and unstable behaviors at large external excitation depending on the value of   σ 1 . This confirms the failure of the conventional PPF controller to suppress the primary resonant vibrations if a small mistuning between the controller natural frequency and the external excitation frequency occurred.
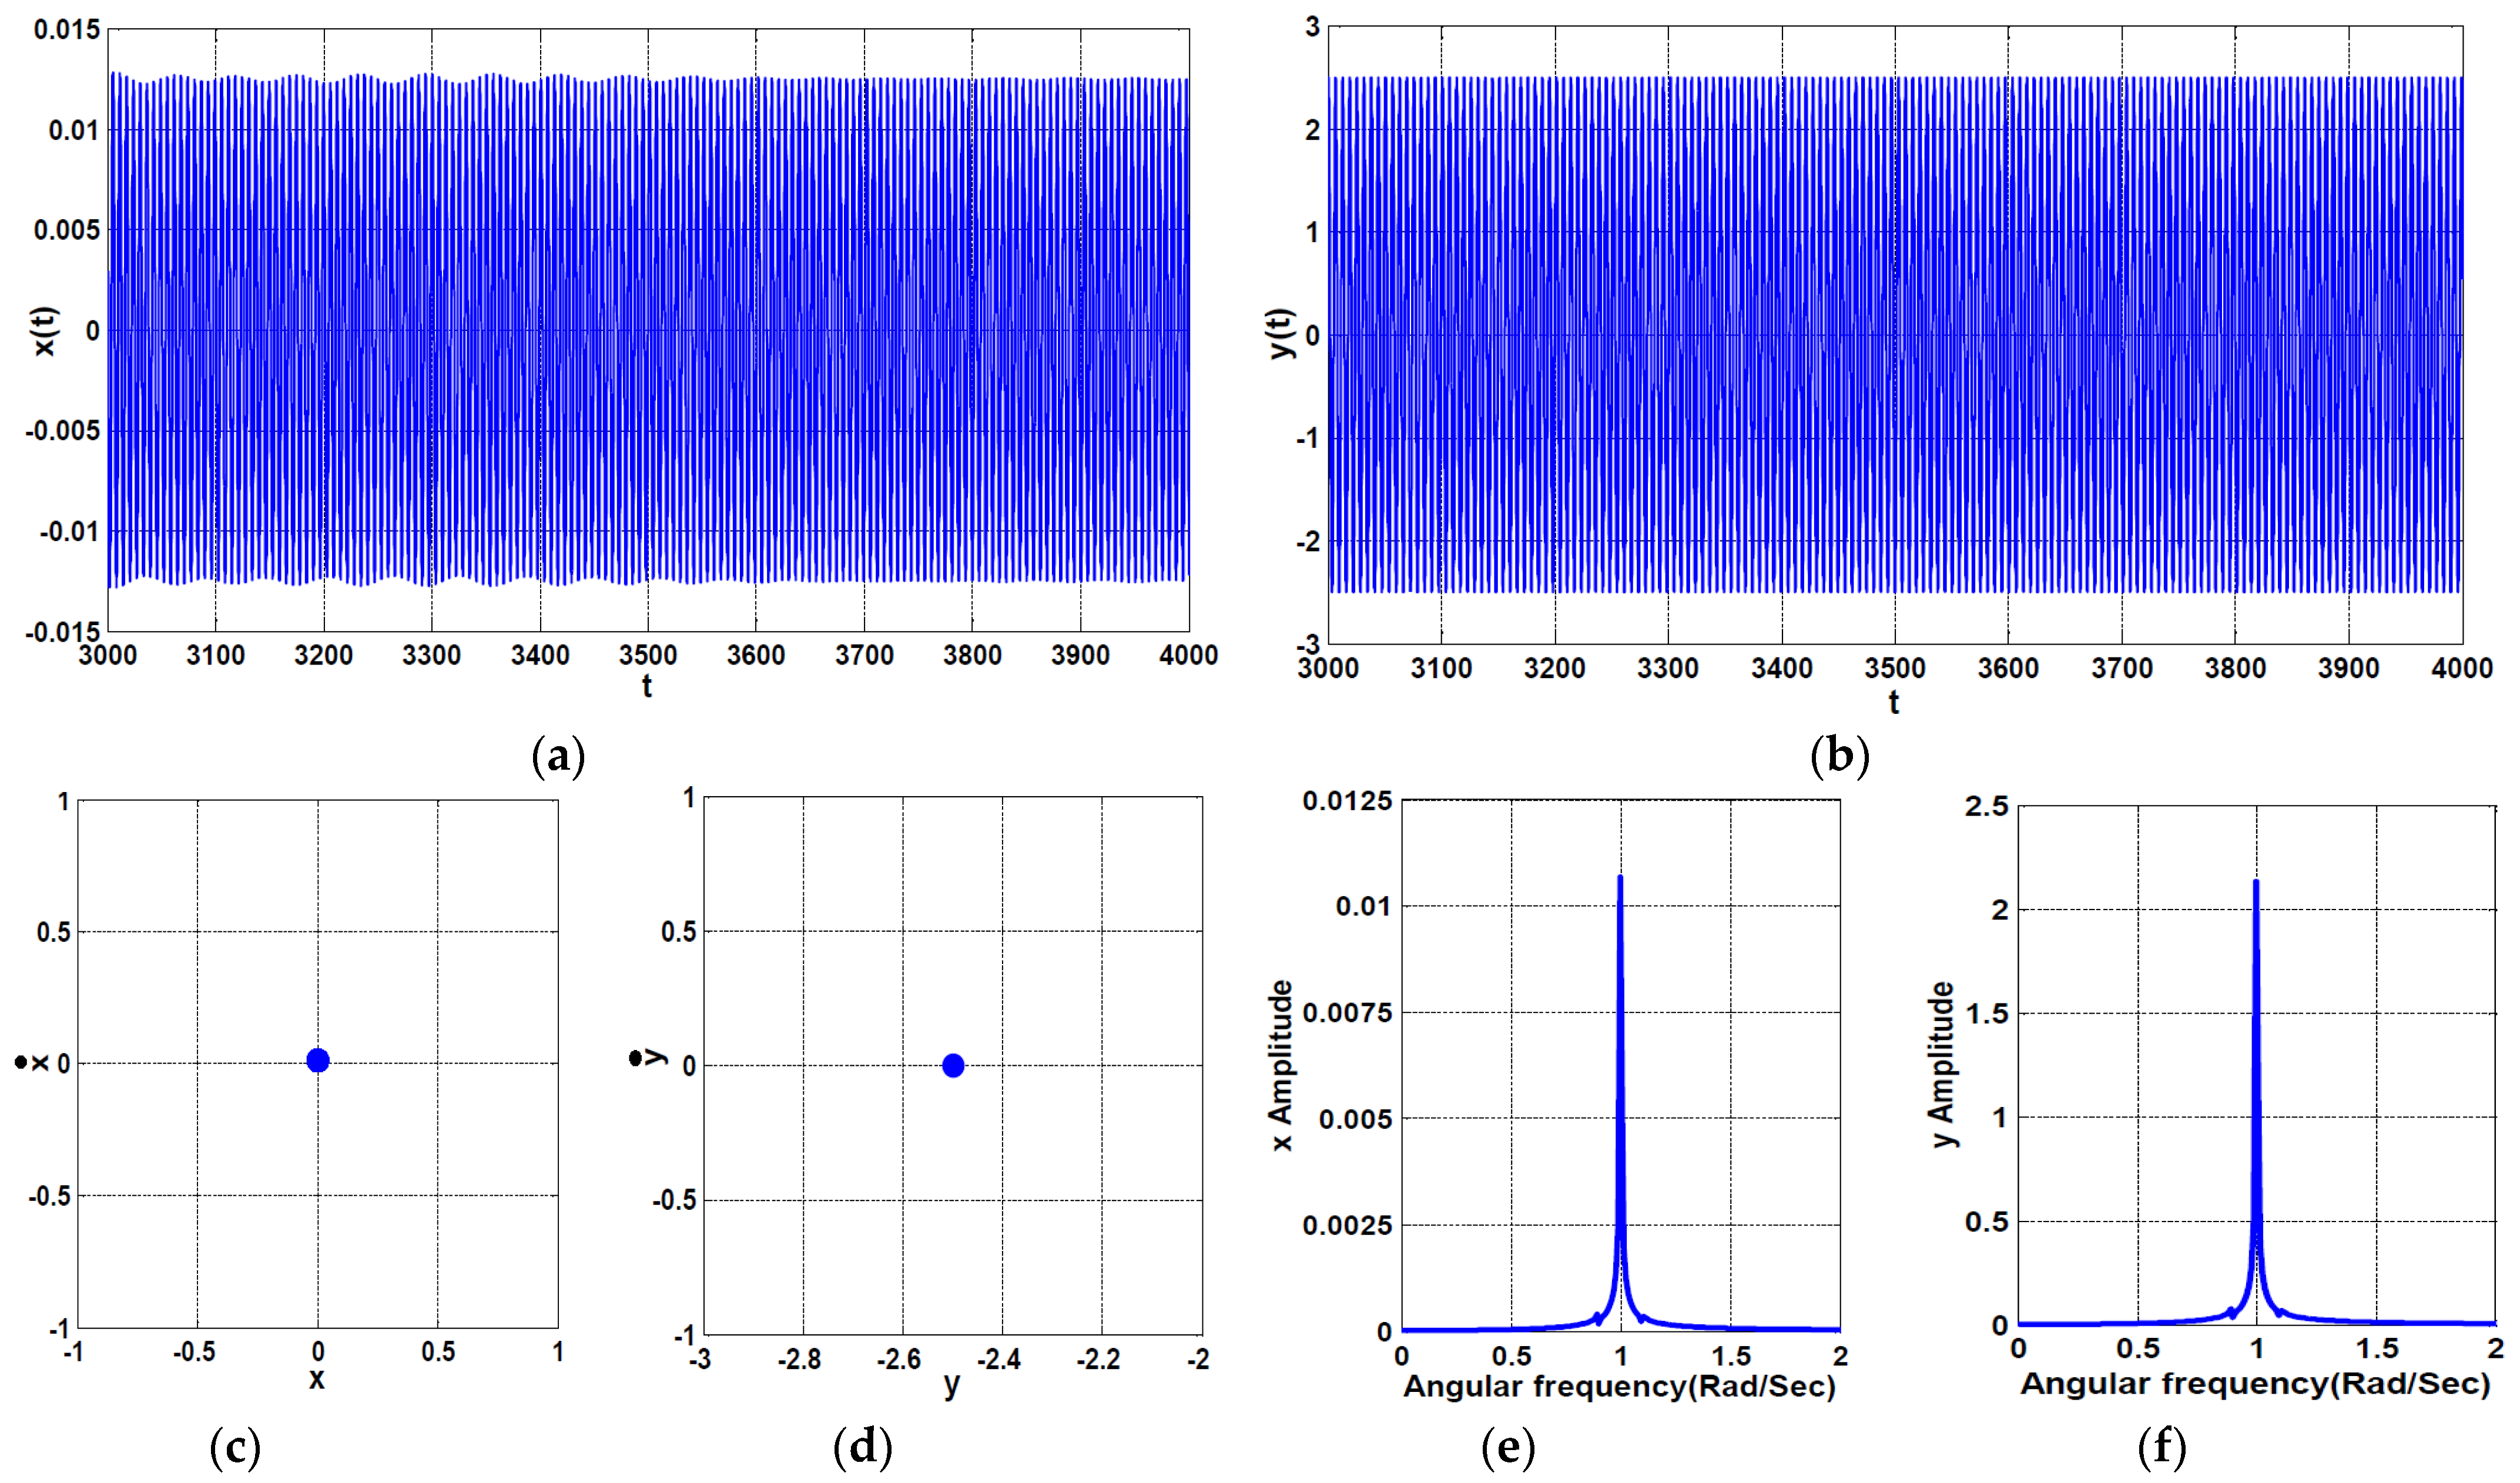
Numerical simulation for temporal oscillations of both the main system and PPF controller according to the three points P 1 ,   P 2 , and P 3 marked in Figure 9 are presented in Figure 10, Figure 11 and Figure 12, respectively. The given figures are obtained by solving the original system equations (Equation (1)) numerically using ODE45 MATLAB solver. Figure 10 shows the system time histories (Figure 10a,b), Poincaré map (Figure 10c,d), and frequency spectrum (Figure 10e,f) according to the stable operating point P 1 (i.e., when σ 1 = σ 2 = 0 ,   f = 0.5 ). It is clear from Figure 10 that the PPF controller has high efficiency in suppressing the main system vibration close to zero (i.e., a 1 0.0126 ) even at the large excitation force amplitude (i.e., f = 0.5 ) when σ 1 = σ 2 = 0.0 (i.e., ω 2 = Ω ), where the excessive vibrational energy of the main system due to the large excitation force has been channeled to the connected controller.
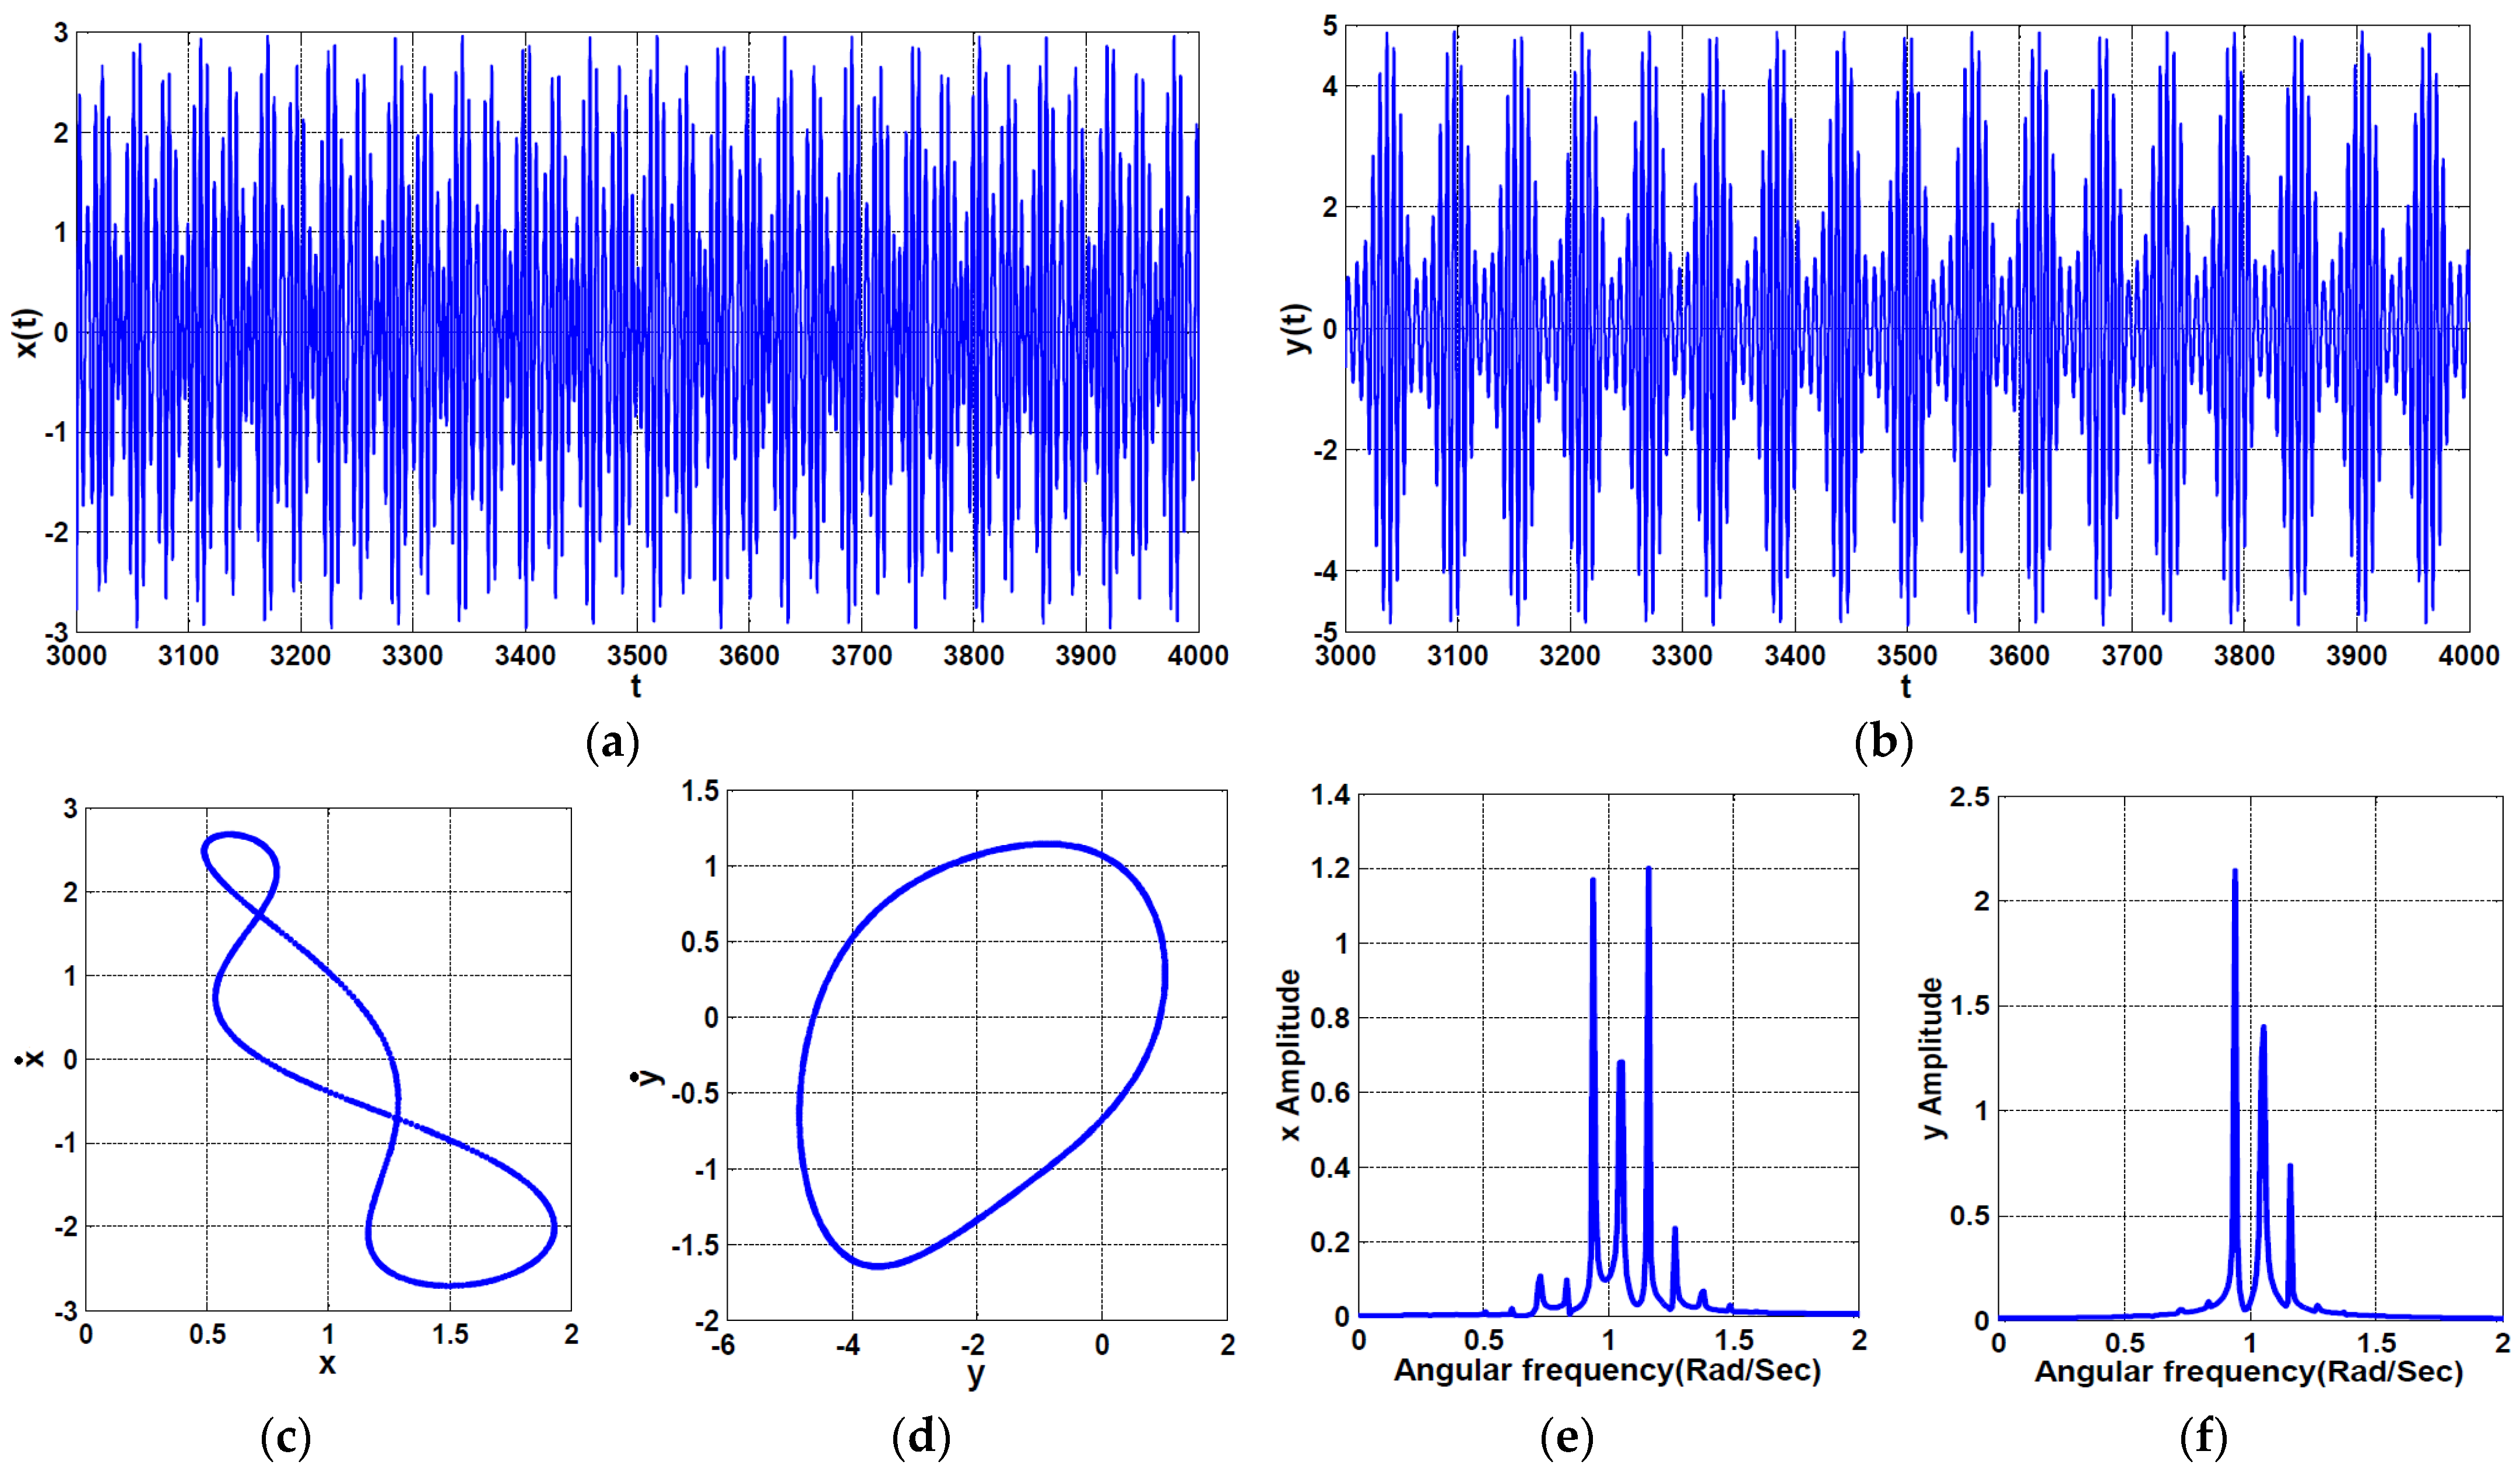
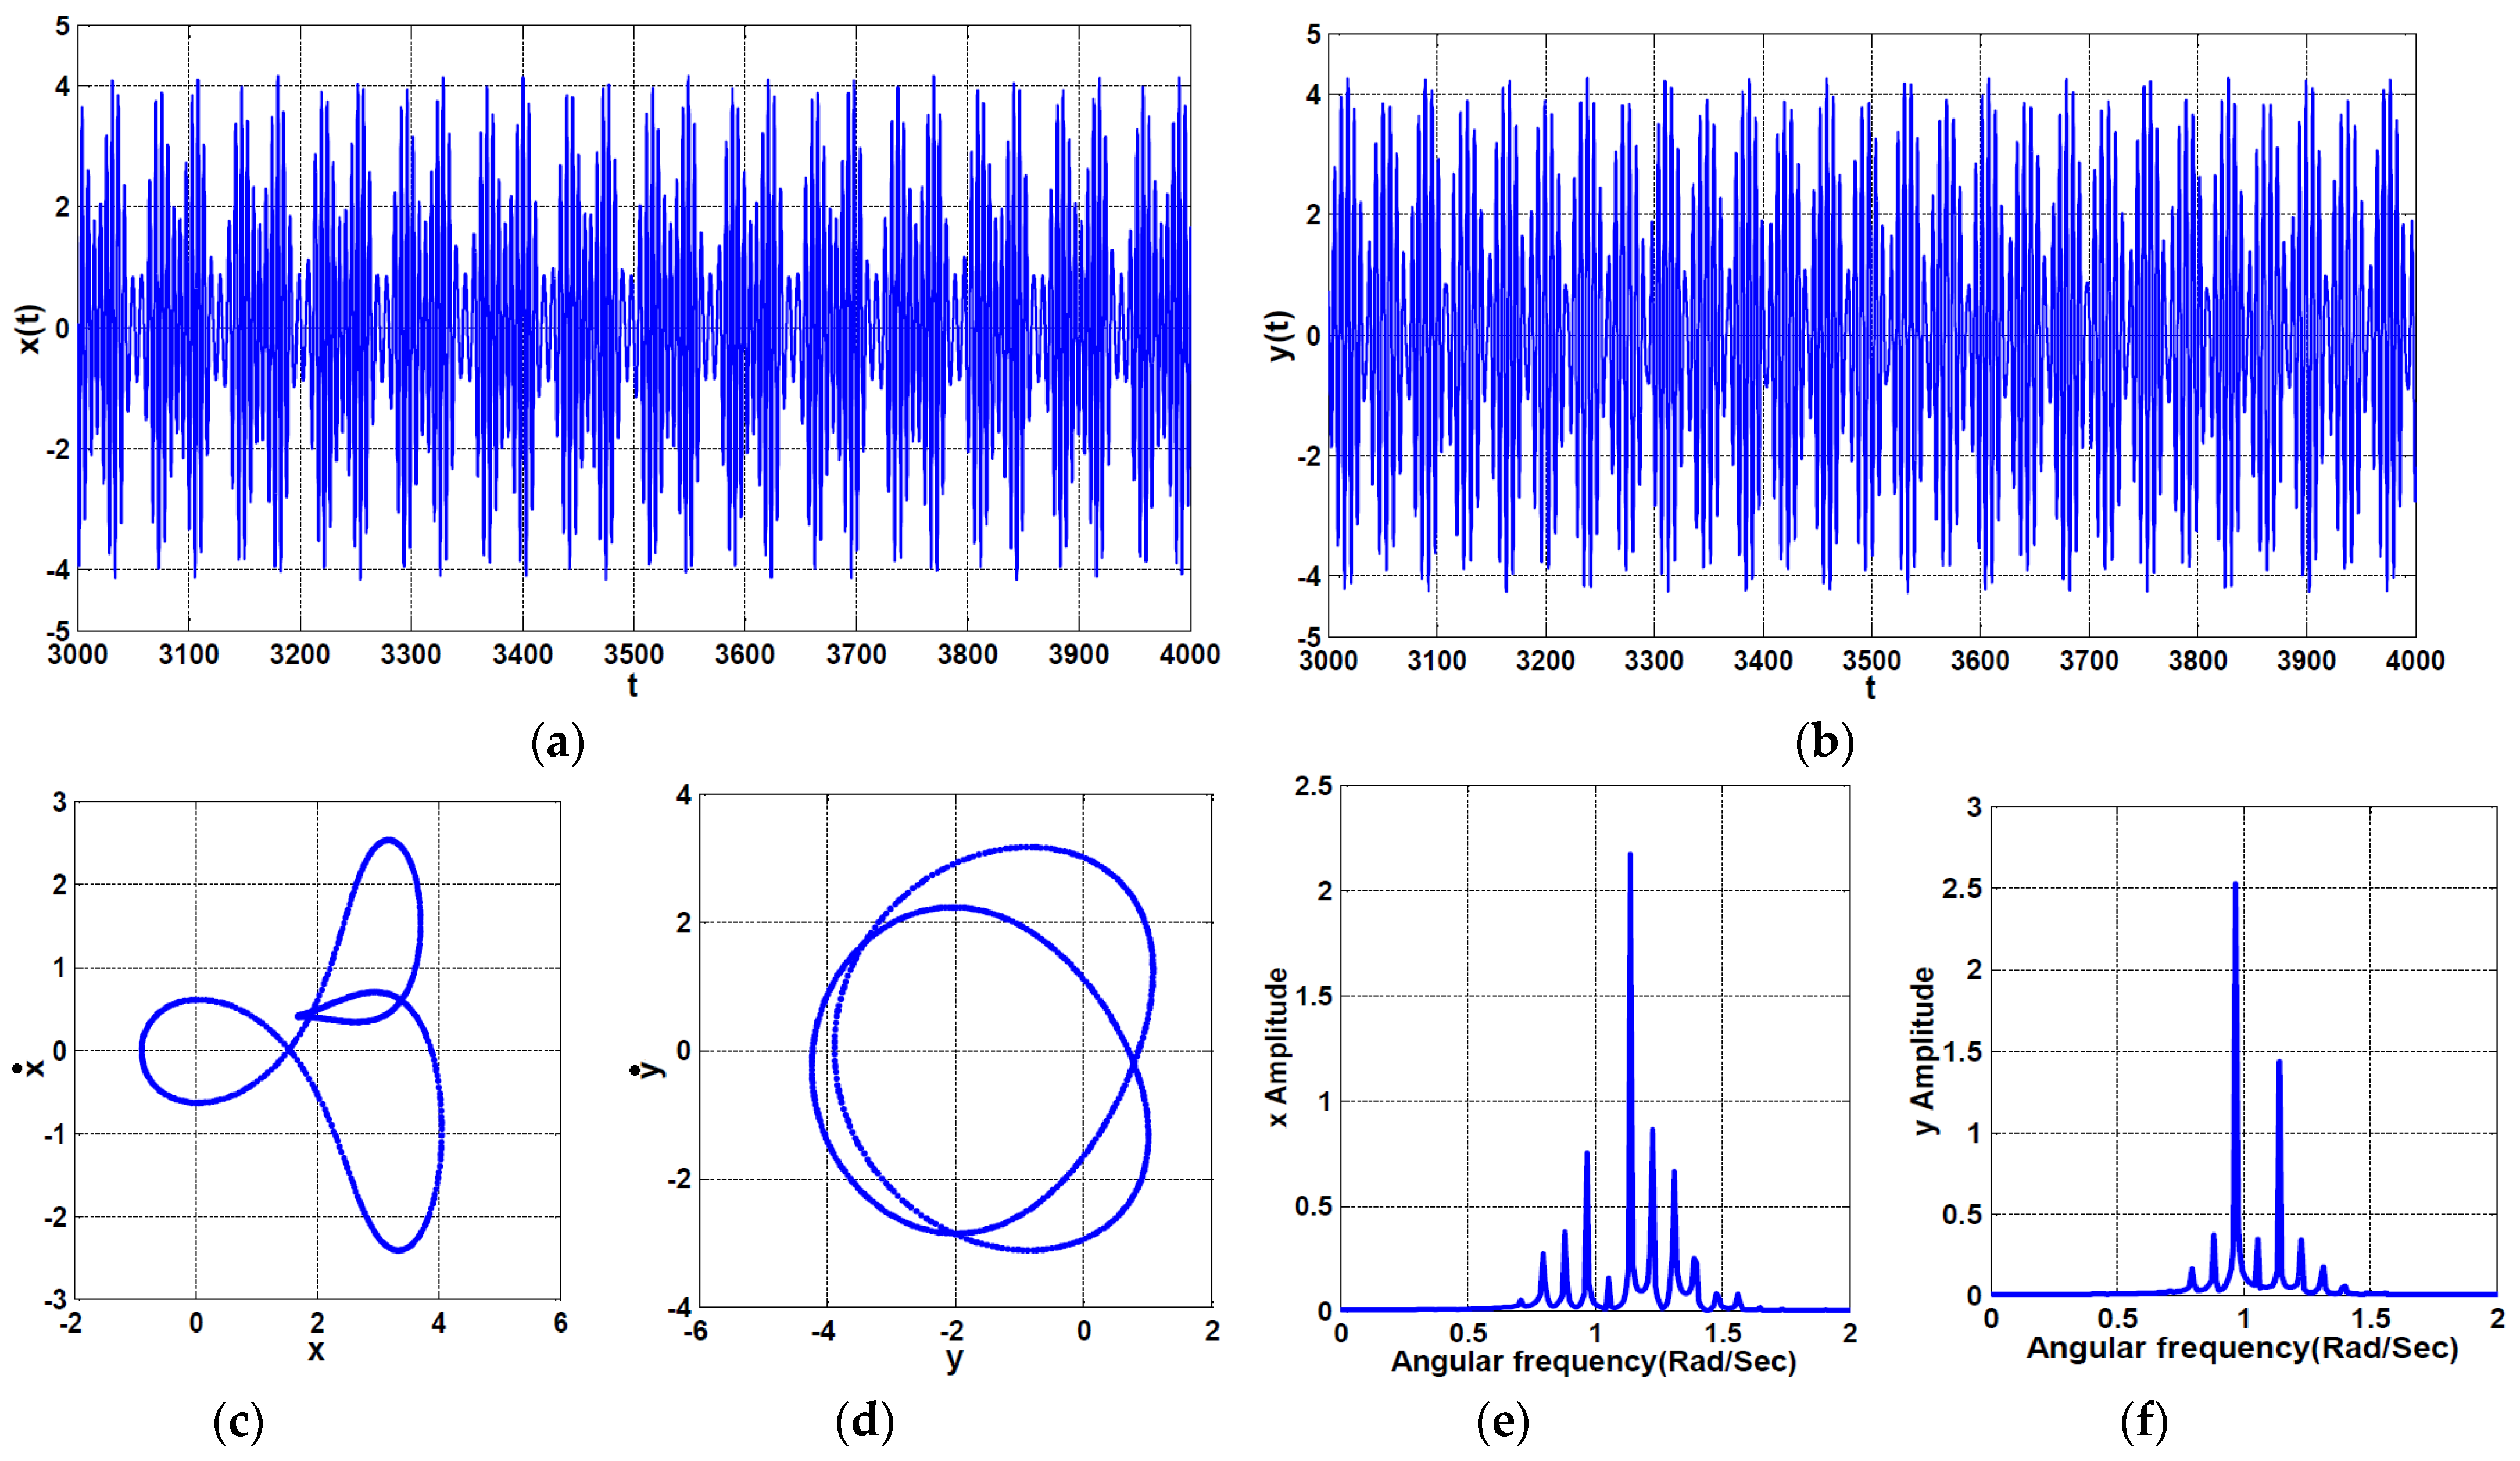
The time histories, Poincaré map, and frequency spectrum of the controlled system according to the point P 2 (i.e.,   σ 1 = 0.05 ,   σ 2 = 0.0 , f = 0.5 ) that is marked on Figure 9 are illustrated in Figure 11. It is clear from Figure 11a,b that there is a failure of the PPF controller in suppressing the main system nonlinear vibrations when σ 1 σ 2 . Moreover, both the main system and the PPF controller lose their periodical motions to respond with a quasi-periodic oscillation as is clear from the Poincaré map (i.e., Figure 11c,d) and the frequency spectrum (i.e., Figure 11e,f). The time histories, Poincaré map, and frequency spectrum of the controlled system according to the point P 3 (i.e., σ 1 = 0.14 ,   σ 2 = 0.0 , f = 0.5 ) that is marked in Figure 9 are illustrated in Figure 12. It is clear from Figure 12a,b that there is a failure of the PPF controller in suppressing the main system nonlinear vibrations. In addition, both the main system and PPF controller lose their periodical motions and respond with a quasi-periodic oscillation, as is clear from the Poincaré map (i.e., Figure 12c,d) and the frequency spectrum (i.e., Figure 12e,f).
According to the above discussion, we can conclude that the PPF controller can suppress the main system nonlinear vibration as long as the controller natural frequency ( ω 2 ) is tuned to be the same value of the excitation frequency ( Ω ) even at the large external excitation force ( f ). However, the PPF controller can destabilize the main system vibration at large external excitation forces if a mistuning between the controller natural frequency and the excitation frequency has occurred.

3. Adaptive Positive Position Feedback (APPF) Controller

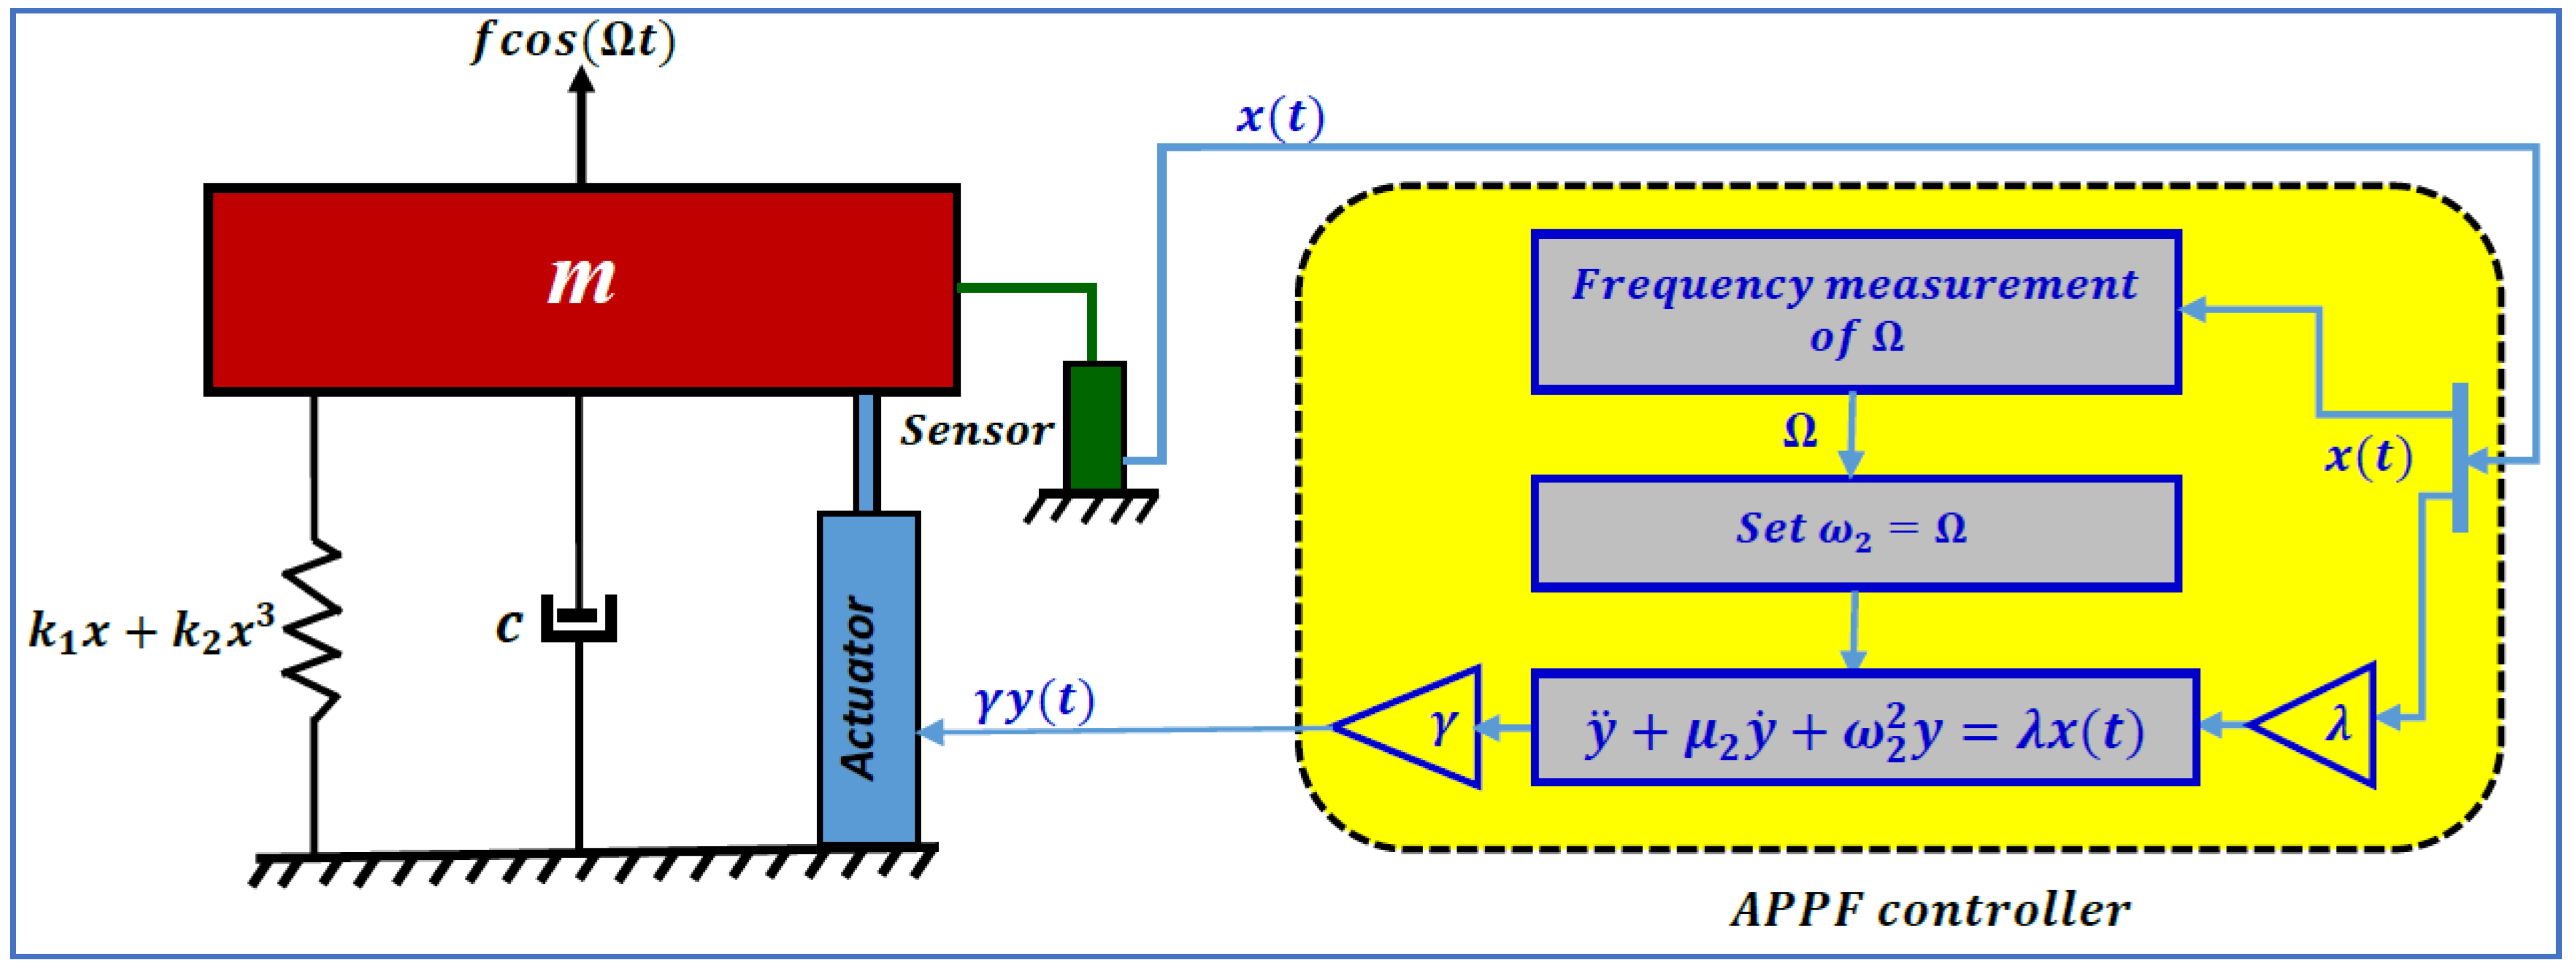
To enhance the system response and eliminate the two undesired peaks that appeared on both sides of σ 1 = 0.0 as in Figure 3, a new modification of the conventional PPF controller is proposed. Based on the obtained results from Figure 4 and Figure 9, one can conclude that the maximum vibration suppression efficiency of the conventional PPF controller occurs when the controller natural frequency ( ω 2 ) is tuned to be the same value of the external excitation frequency ( Ω ). However, most dynamical systems in practice are subject to varying excitation frequencies. The idea here is to track the external excitation frequency ( Ω ) using an adaptive frequency measurement technique and then updating the PPF controller natural frequency ( ω 2 ) continuously in real-time according to the measured Ω . This can grant the PPF controller a unique feature by making it an adaptive controller that is able to suppress the main system vibrations regardless of the excitation frequency or the excitation force amplitude. It is worth mentioning that the frequency tracking method has been applied for vibration control before as in Refs. [29,30]; the authors utilized different frequency measurement methods. The best frequency measurement technique was introduced in Ref. [29], where the authors implemented a technique that uses the Adaptive Line Enhancer (ALE). The experimental results showed that this method works very well and fast enough to be used in the real-time control system. Accordingly, the steady-state dynamical behaviors of both the main system and the adaptive positive position feedback (APPF) controller are investigated considering that ω 2 = Ω within this section. Figure 13 shows a schematic diagram that describes the connection of the APPF controller to the main system, where the oscillation amplitude is measured via a displacement sensor. The measured signal x ( t ) is fed to a digital computer via an A/D converter. The digital computer on which the PPF controller is installed manipulates the acquired signal according to the PPF control law to generate the control signal γ y ( t ) . At the same time, the digital computer measures the excitation frequency using a frequency measurement algorithm like ALE to update the controller natural frequency ω 2 to the same value of the measured Ω .

Frequency-Response Equation of APPF Controller

The equations of motions and the corresponding frequency-response equation of the main system and APPF controller can be obtained via setting ω 2 = Ω and then σ 1 = σ 2 into Equations (1) and (21), respectively. Accordingly, the new equations of motion are:
x ¨ ( t ) + μ 1 x ˙ ( t ) + ω 1 2 x ( t ) + α x 3 ( t ) = f cos ( Ω t ) + γ   y ( t )
y ¨ ( t ) + μ 2 y ˙ ( t ) + Ω 2 y ( t ) = λ x ( t )
and the corresponding frequency-response equations of the main system and APPF controller are given as:
[ 2 σ 1 ω 1 3 4 α a 1 2 ] 2 a 1 2 + [ μ 1 ω 1 + λ γ μ 2 Ω ] 2 a 1 2 = f 2 ,                 a 2 = λ μ 2 Ω a 1
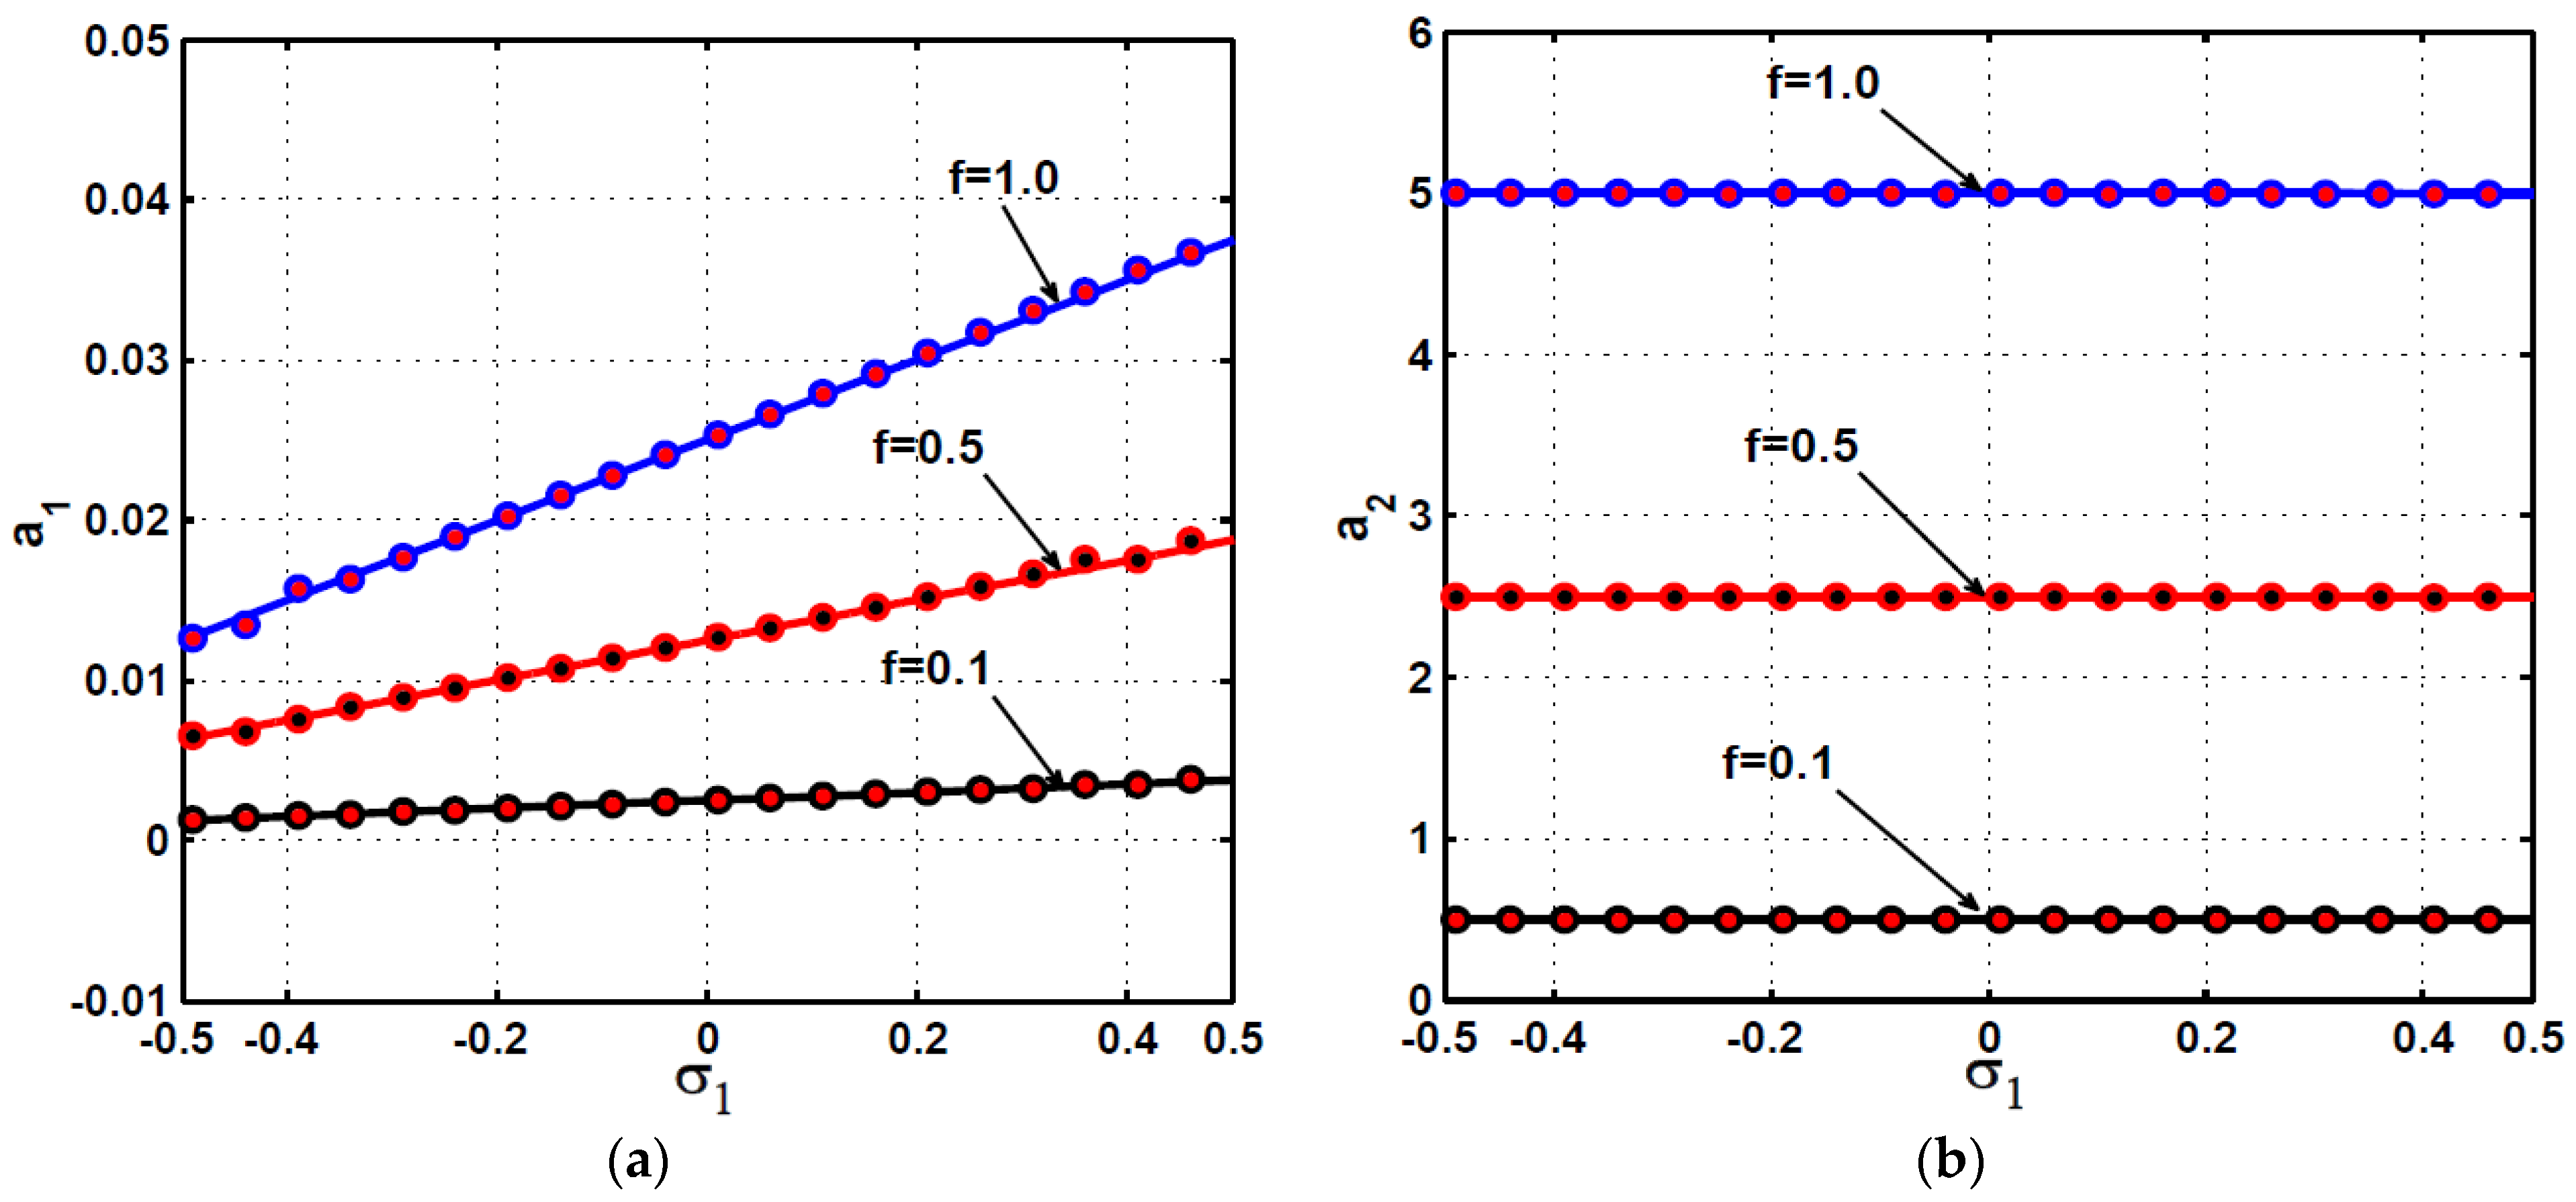
Based on Equation (28), the steady-state oscillation amplitudes of both the main system and APPF controller are explored in Figure 14 and Figure 15 utilizing σ 1 and f as bifurcation control parameters. Figure 14 shows the frequency-response curves of the main system and APPF controller for different values of the excitation force amplitude f . By comparing Figure 14 (i.e., in case of APPF) with Figure 8 (i.e., in case of the conventional PPF), one can find that the two undesired peaks and the jump phenomenon reported in Figure 8 have been eliminated when the APPF controller has been connected to the main system, as shown in Figure 14. Also, Figure 14 confirms that the main system can exhibit a very small vibration amplitude in the case of the APPF controller at a wide band of the excitation frequency even if the excitation force amplitude is strong (i.e., f = 0.1 ,   0.5 ,   1 ).
The force-response curves of the main system and APPF controller at five different values of the detuning parameter σ 1 are shown in Figure 15. It is clear from the figure that the oscillation amplitudes of both the main system and APPF controller are monotonic increasing linear functions of the excitation force f , where the increasing rate of a 1 is very small compared to the increasing rate of a 2 , which confirms that the energy added to the main system due to the excitation force is channeled to the connected controller effectively. By comparing Figure 15 (i.e., in case of the APPF) with Figure 9 (i.e., in case of the conventional PPF), we can find that the nonlinearity dominance and unstable motions that the system can perform in the case of the PPF controller as illustrated in Figure 9 have been eliminated in the case of the APPF controller as shown in Figure 15. In addition, the main system can exhibit very small vibration amplitudes for the different values of the detuning parameter σ 1 when the APFF controller is connected to the main system. To promote confidence in the obtained response curves, Equation (27) has been integrated numerically using MATLAB ODE45 solver, where the obtained steady-state vibration amplitudes have been plotted as small circles when sweeping the bifurcation parameter ( σ 1 or f ) forward, and as big dots when sweeping the bifurcation parameter backward as shown in Figure 14 and Figure 15. According to Figure 14 and Figure 15, we can confirm that the APPF controller is an excellent replacement for the conventional PPF controllers that can work effectively even if the main system is subjected to a strong external excitation force with varying excitation frequency.

4. Comparison between the PPF and APPF Controllers

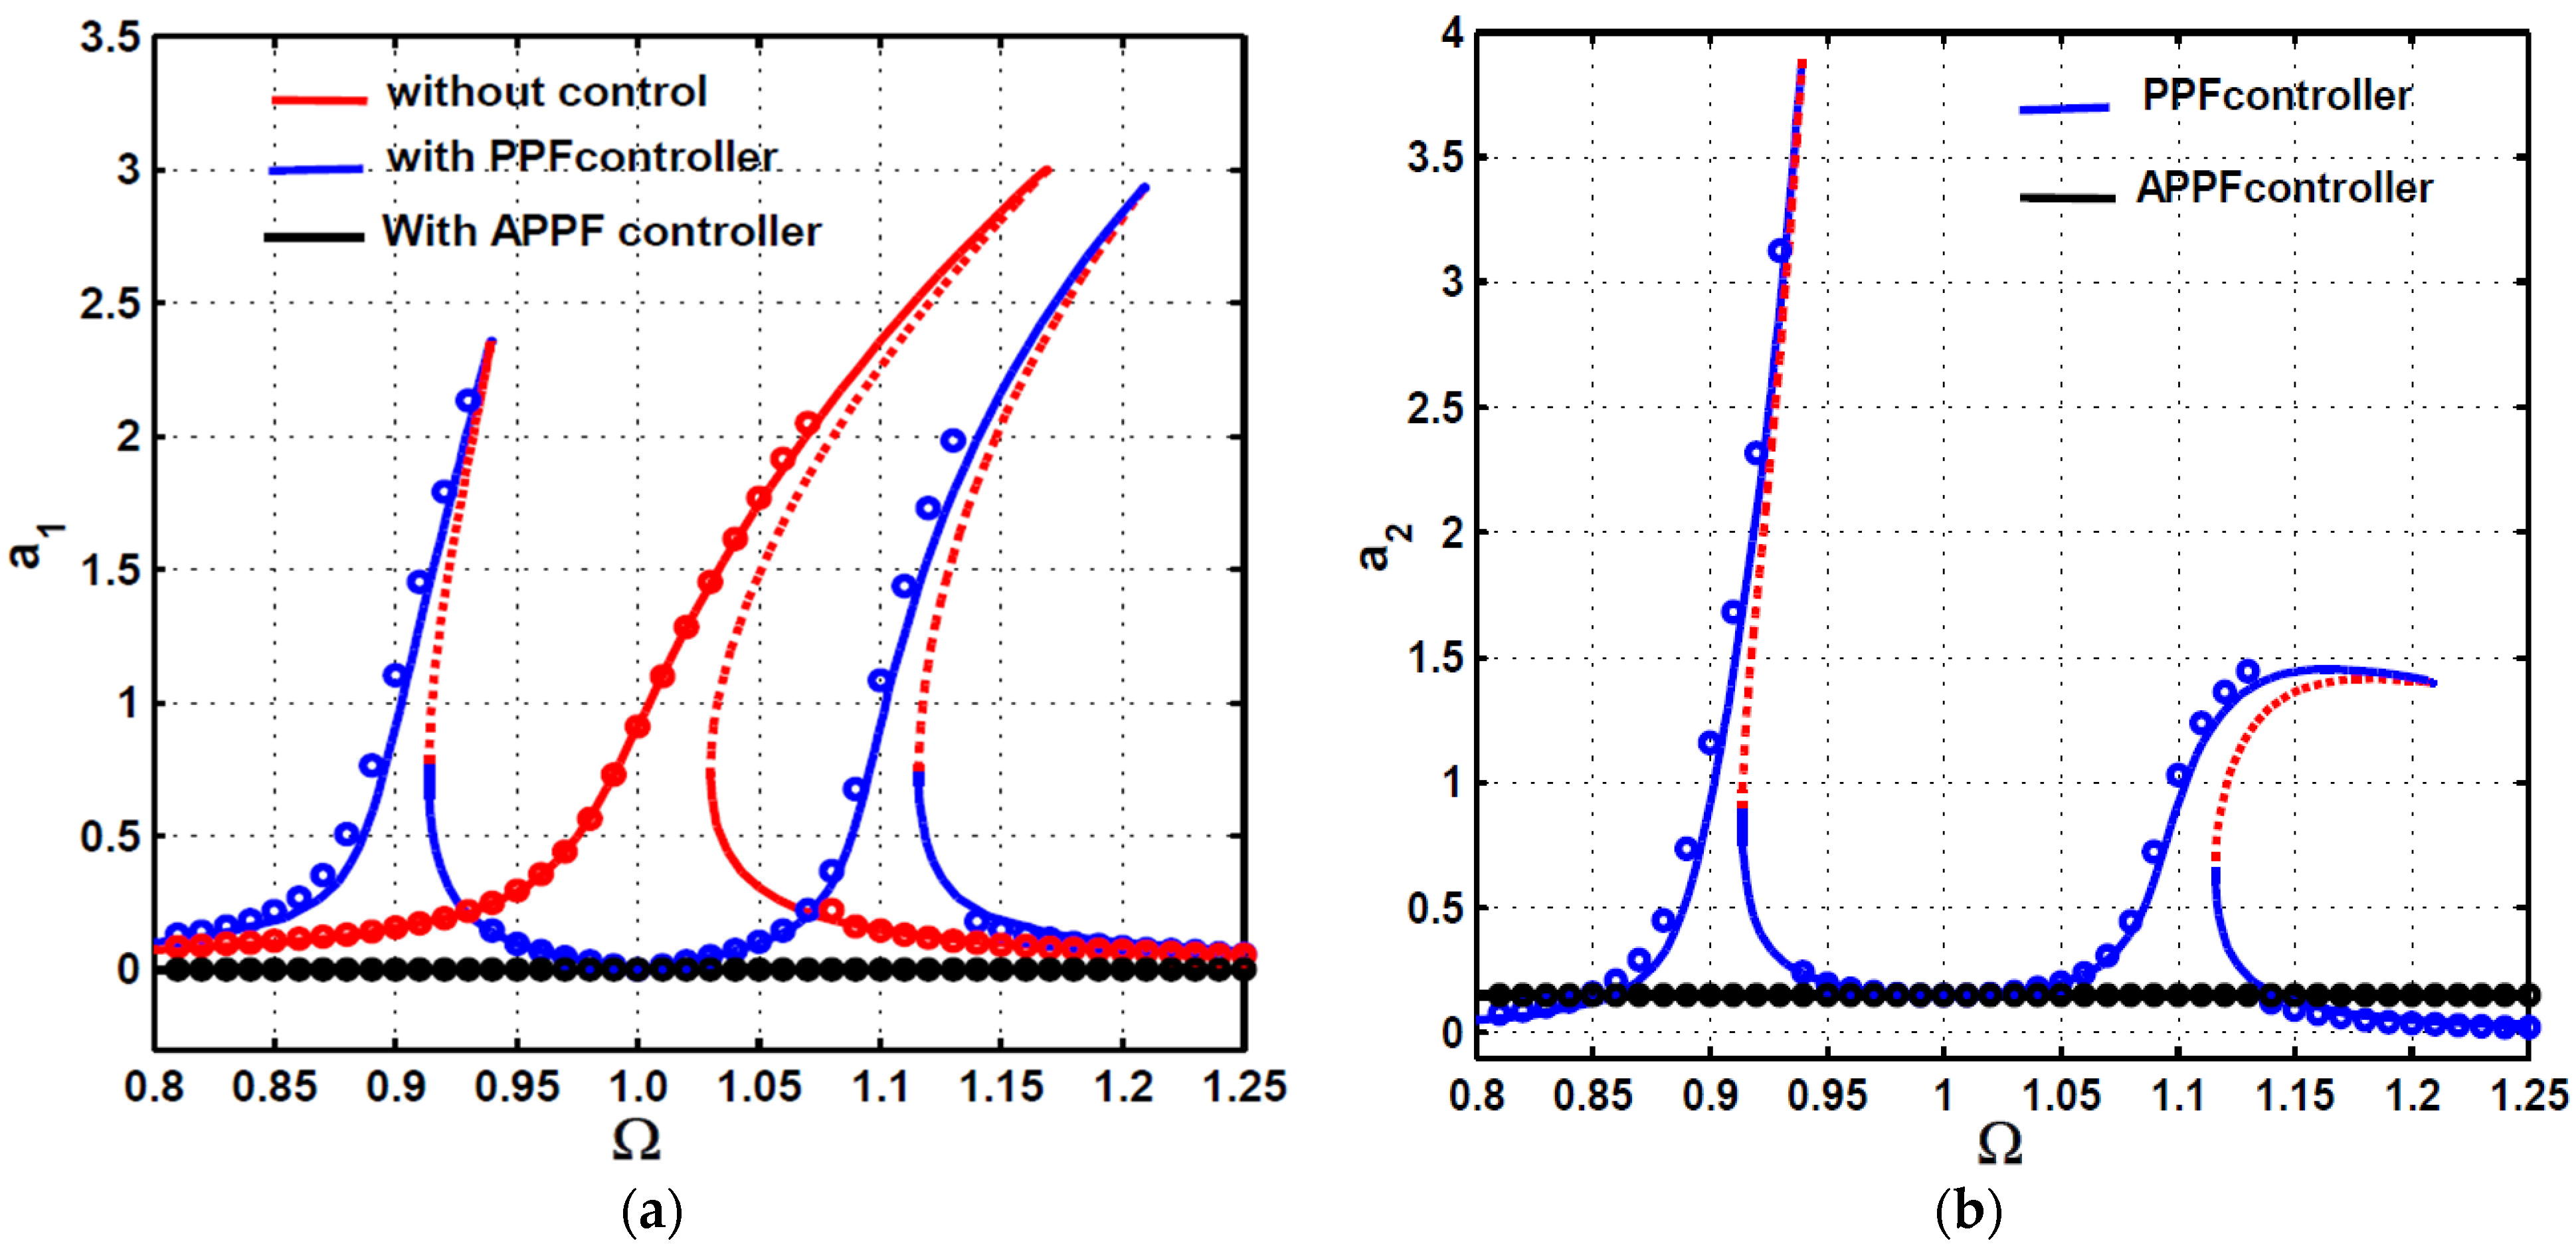
A comparison between the PPF and APPF controllers is introduced in this section, where Figure 16 shows the main system frequency-response curves before control and after connecting the PPF and APPF controllers to the system. It is clear from Figure 16a that the conventional PPF controller can eliminate the main system nonlinear vibration when subjected to a periodic excitation force ( f ) having an angular frequency ( Ω ) as long as the internal and external resonance ratio between the main system and the PPF controller is kept at 1:1:1 (i.e.,   ω 1 = ω 2 Ω ). However, for a small mistuning between Ω and ω 1 , the PPF controller not only loses its efficiency in suppressing the main system nonlinear vibrations but also it may add excessive vibratory energy to the controlled system as shown in Figure 16a when Ω ] 0.85 ,   0.92 [ ] 1.075 ,   1.2 [ . Figure 16a also confirms that once the controller natural frequency ω 2 is made adaptive to track the excitation frequency Ω (i.e.,   ω 2 = Ω ), the APPF controller can eliminate the main system vibration amplitude regardless of the excitation force and excitation frequency.
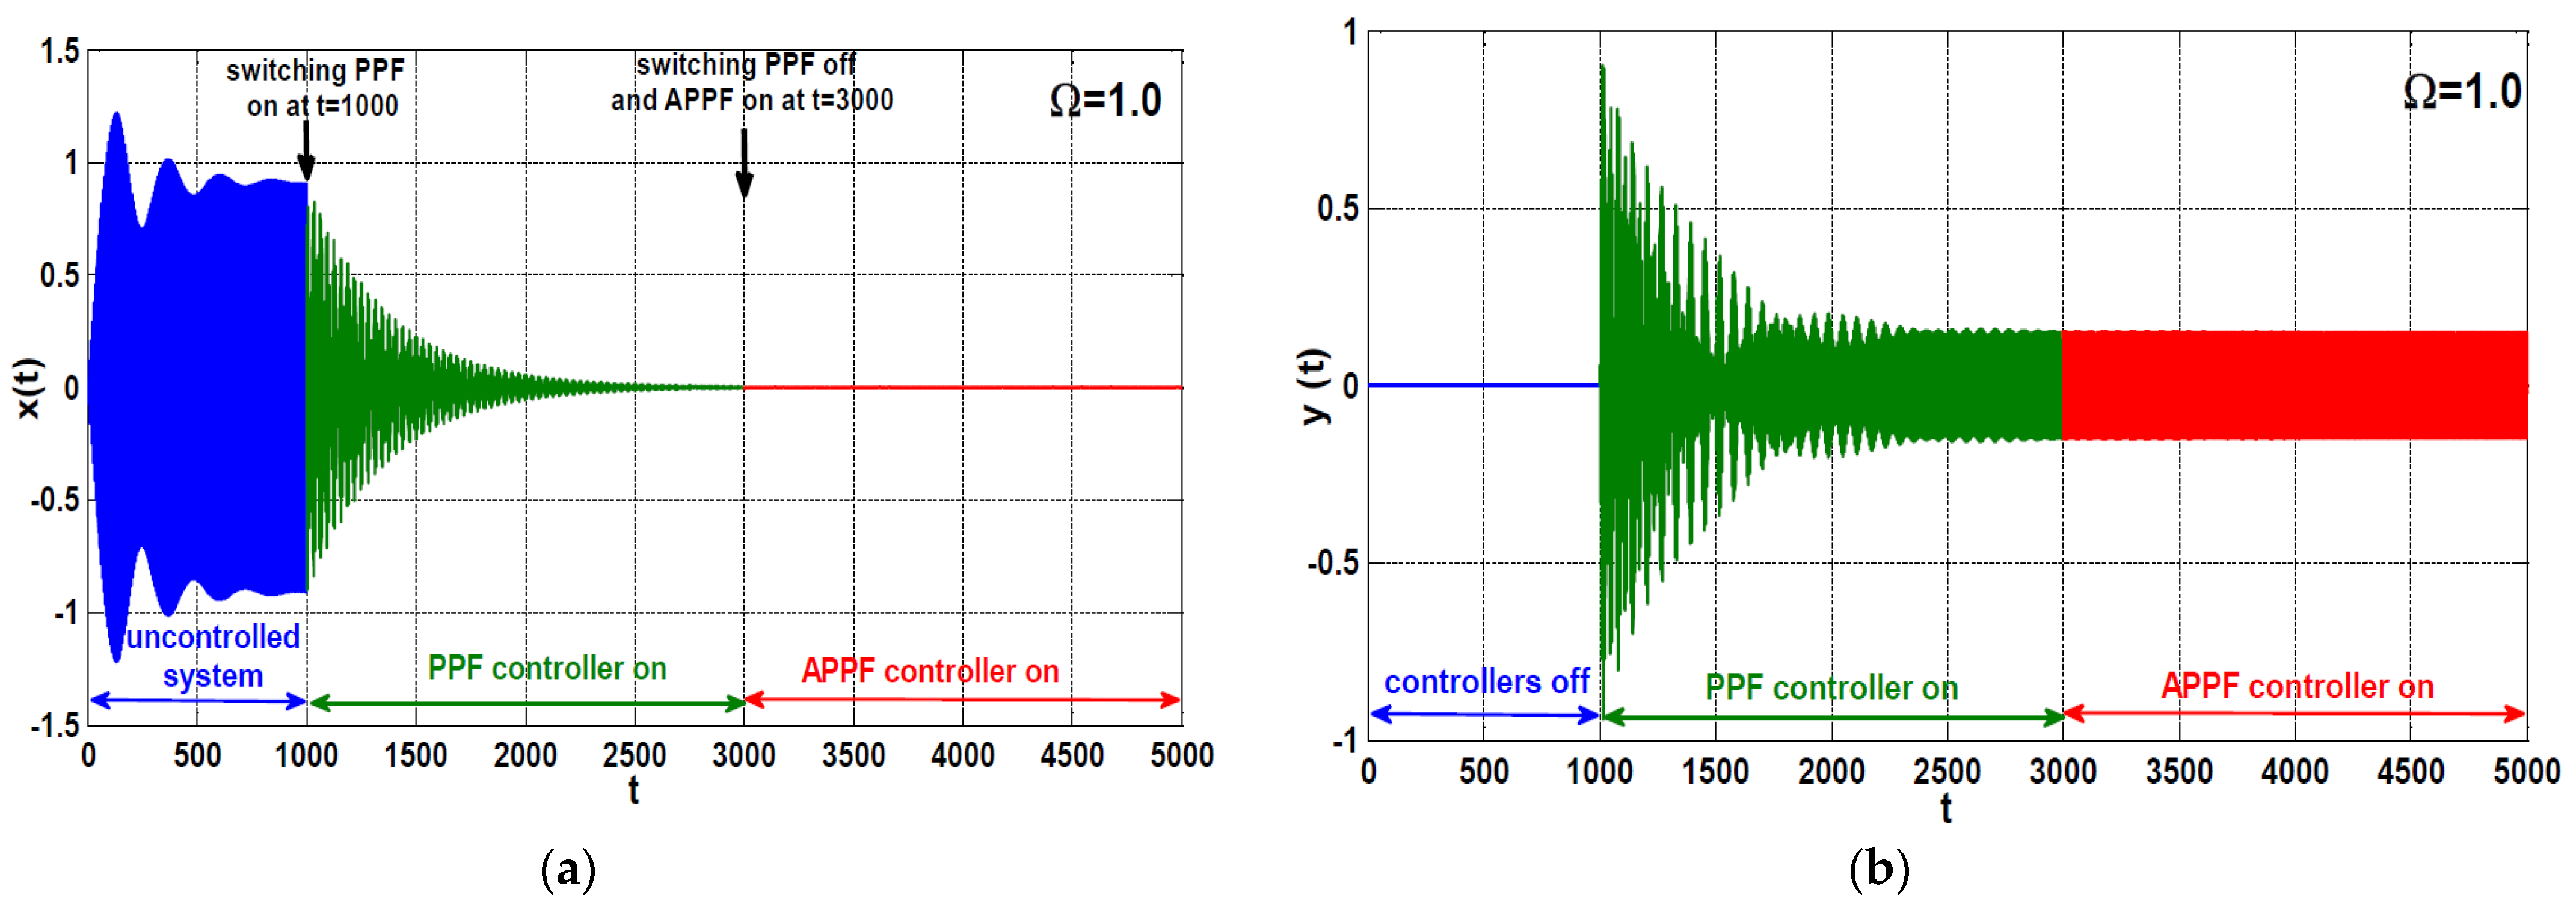
Numerical simulations for temporal oscillations of the main system and the connected controllers according to Figure 16 for three different values of the excitation frequency Ω (i.e., Ω = 0.9 ,   1 ,   1.1 ) are illustrated in Figure 17, Figure 18 and Figure 19, respectively. Figure 17 simulates the main system temporal oscillations before and after control according to Figure 16 when Ω = 0.9 . The figure shows the main system nonlinear oscillation without the control along the time interval t [ 0 ,   1000 ] , where at t = 1000 the conventional PPF controller is turned on along the time interval t [ 1000 ,   3000 ] . At t =   3000 the PPF controller is turned off, while the APPF controller is activated at the same instant (i.e., at t = 3000 ) until the variable t reaches the value t = 5000 . It is clear from Figure 17 that the PPF controller amplifies the vibration amplitude of the main system rather than mitigating it along the time interval t [ 1000 ,   3000 ] , while switching the control strategy from the PPF to APPF at t =   3000 can suppress the main system vibrations close to zero. Figure 18 is a repetition for Figure 17 but with Ω = 1.0 . It is clear from Figure 18 that the PPF controller can work very well as the APPF controller when the resonance condition meets (i.e., Ω ω 1 = ω 2 = 1.0 ). Figure 19 is also a repetition of Figure 17 when Ω = 1.1 . Figure 19 confirms again that the PPF controller adds extra vibrational energy to the main system rather than suppressing it when the resonance condition has been lost (i.e.,   Ω = 1.1 ,   ω 1 = ω 2 = 1.0 ).
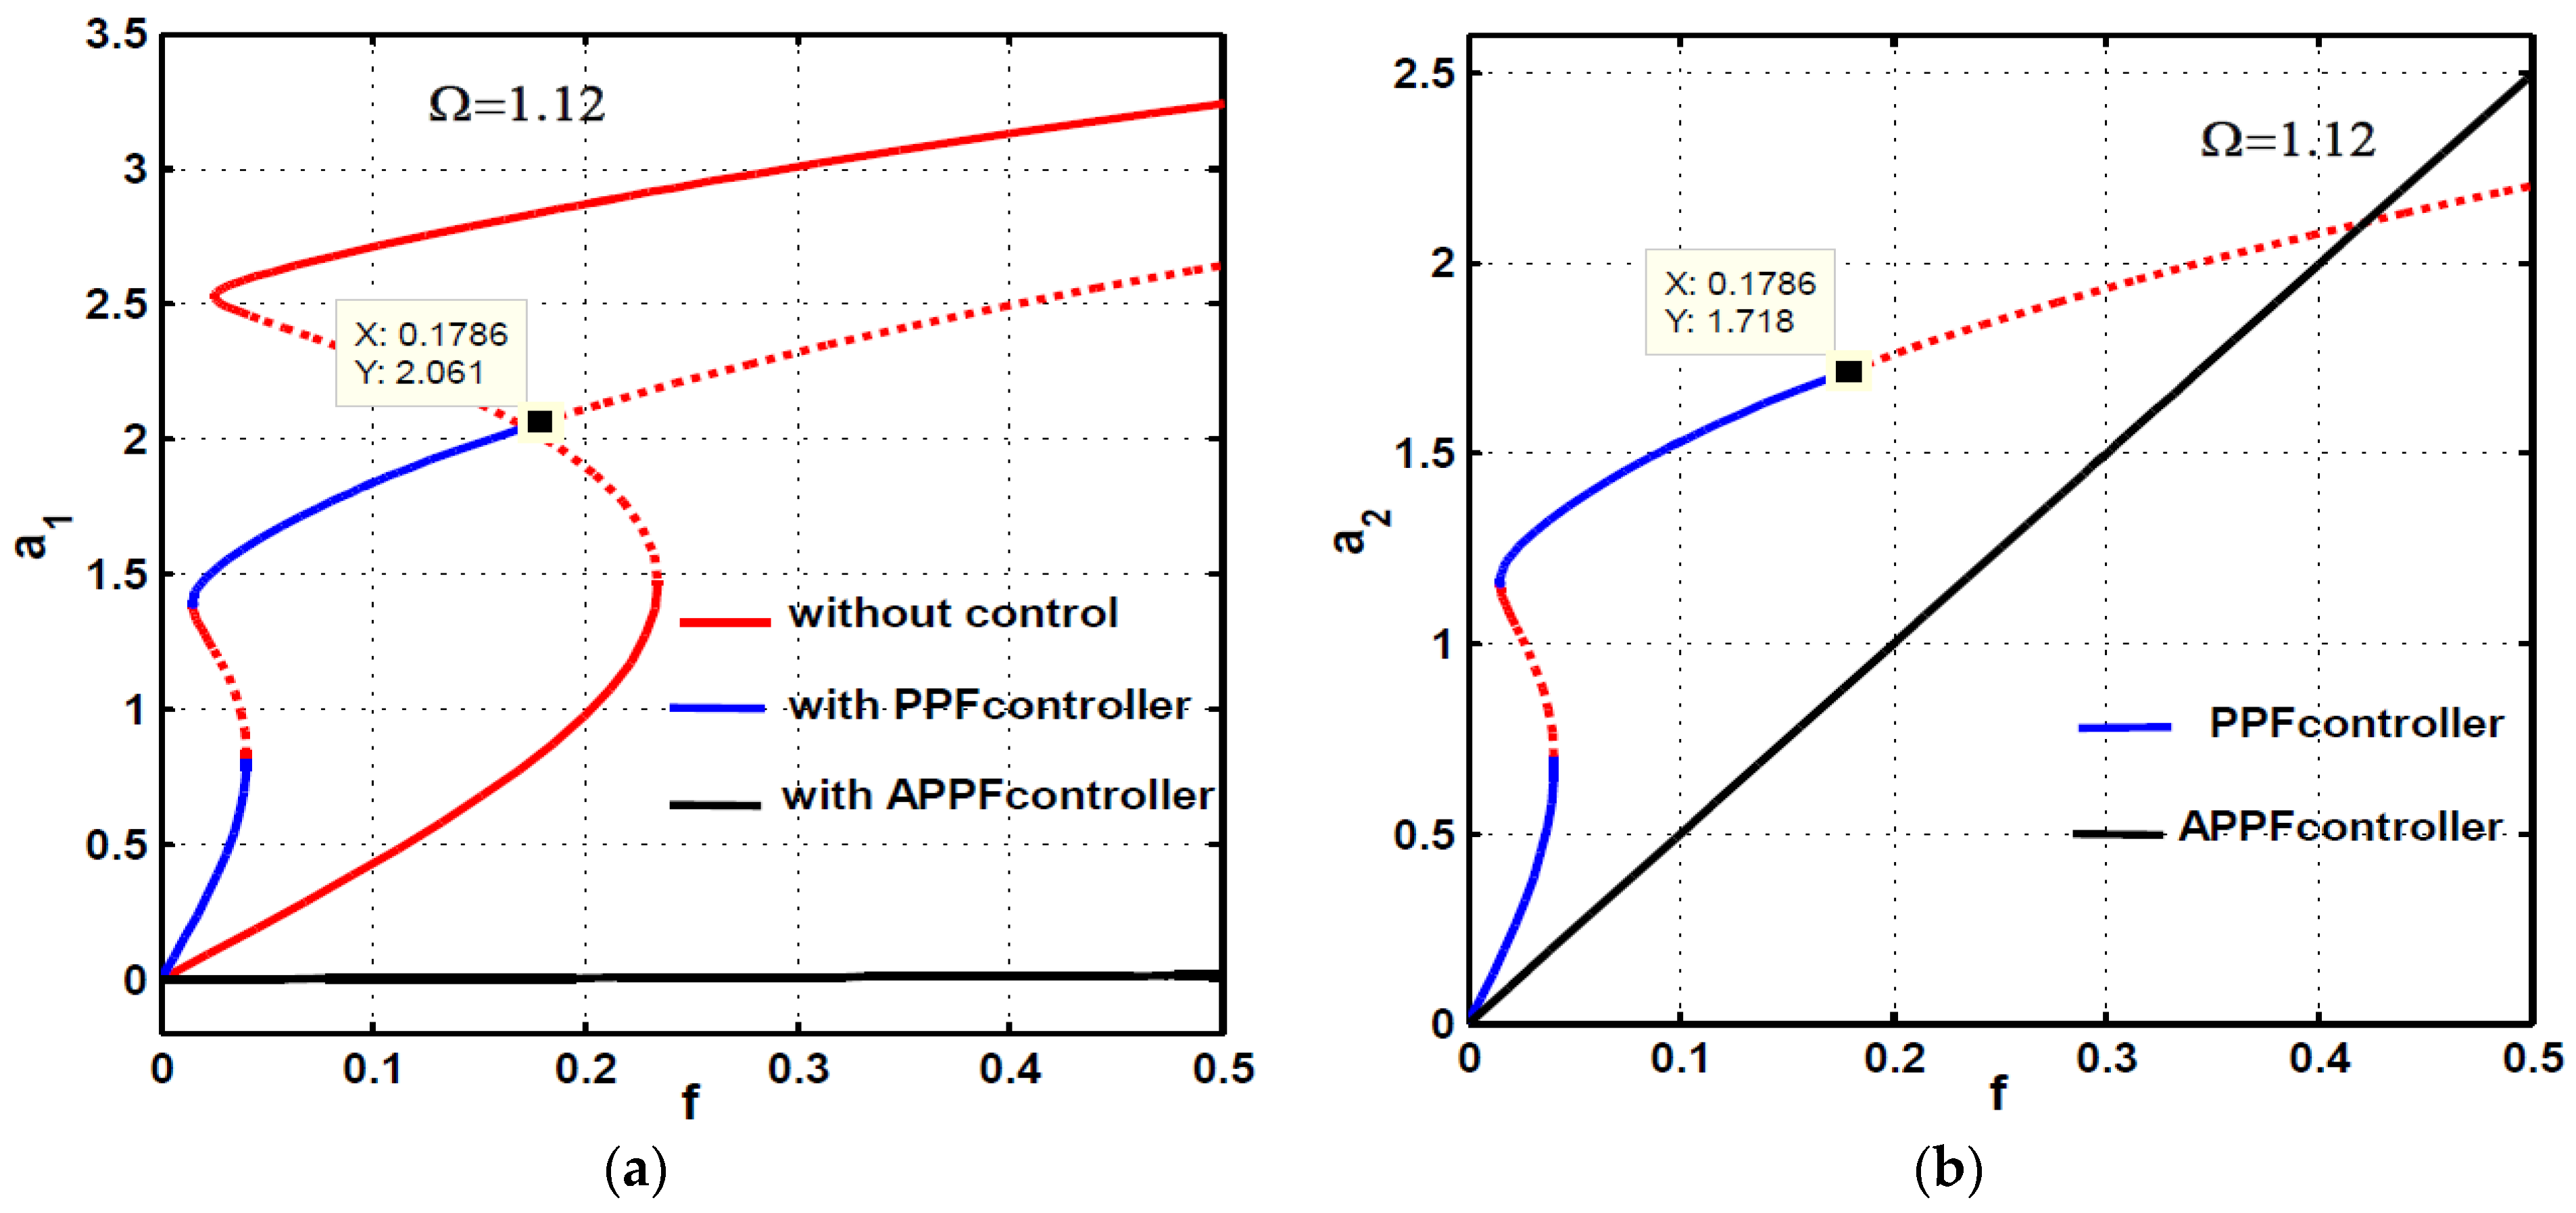
The force-response curves of the main system before and after control (i.e., PPF and APPF controllers) have been compared in Figure 20 when the excitation frequency Ω = 1.12 . Figure 20a illustrates not only the failure of the PPF controller in suppressing the main system nonlinear vibrations when the resonance condition is lost (i.e., Ω = 1.12 ,   ω 1 = ω 2 = 1.0 ), but also it destabilizes the system motion at a large excitation amplitude (i.e., when f 0.18 ). However, the figure shows that the APPF controller has an excellent force-response curve that guarantees the capability of the controller in eliminating the main system vibration amplitude even at strong excitation forces without losing the periodic oscillation of both the main system and the APPF controller.
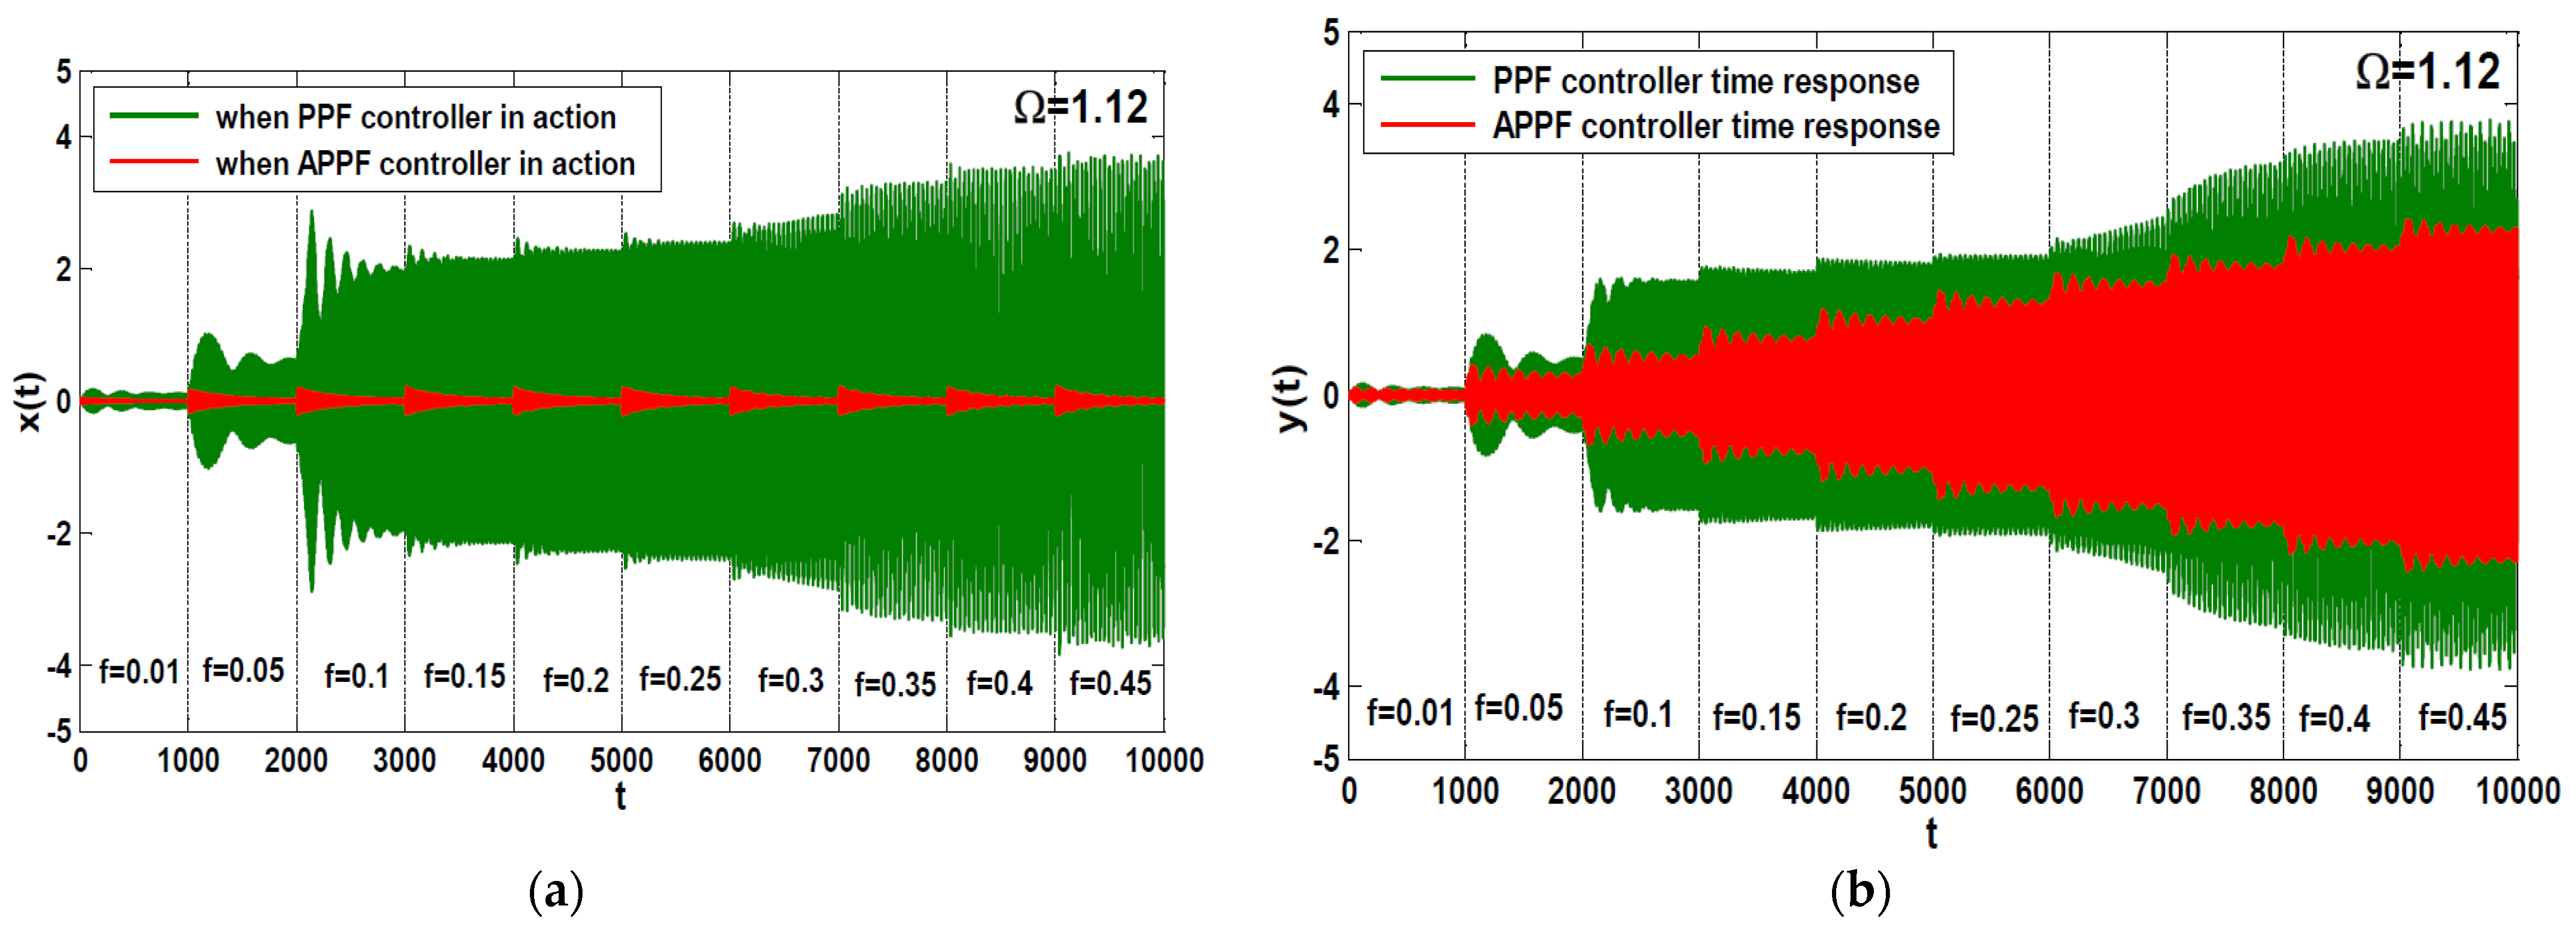
Figure 21 shows the system bifurcation diagram according to the force-response curves in Figure 20, where the Poincaré map for steady-state temporal oscillations of both the main system and PPF controller are plotted against the excitation force f when Ω = 1.12 , while Figure 22 shows the same bifurcation diagram according to the force-response curves in Figure 20, where the Poincaré map for the steady-state temporal oscillations of both the main system and APPF controller are plotted against f when Ω = 1.12 . It is clear from Figure 21 that the main system loses its periodic oscillations to perform a quasiperiodic motion in the case of the PPF controller at strong excitation forces (i.e., when f 0.18 ), while Figure 22 confirms the efficiency of the APPF controller in suppressing the main system vibrations and forcing it to oscillate periodically with very small oscillation amplitudes. Figure 23 compares the time histories of both the main system and controller that is controlled either by the conventional PPF controller or by the APPF controller according to Figure 20, Figure 21 and Figure 22 when the excitation force f is swept from 0.01 to 0.45 . The figure shows that the APPF controller can eliminate the main system vibration amplitude for all the values of the excitation forces, while the conventional PPF controller failed, as shown in Figure 23a.

5. Conclusions

In this work, the positive position feedback (PPF) controller and the adaptive positive position feedback (APPF) controller are suggested to control the primary resonance vibration of a nonlinear dynamical system. The multiple time scales perturbation method is employed to obtain a second-order approximate solution for the controlled system mathematical model. The amplitude-phase modulating equations that govern the steady-state vibration amplitudes of both the main system and controller (i.e., PPF and APPF) are derived. The vibration suppression efficiency of the applied control algorithms is investigated via plotting the different response curves utilizing the excitation frequency and the excitation force amplitude as the main bifurcation control parameters. Based on the discussions given above, the following remarks can be concluded:
  • The conventional PPF controller can eliminate the primary resonance vibrations of the considered system in the presence of 1:1 internal resonance.
  • Once the resonance conditions between the main system and the PPF controller are lost, the controller adds excessive vibrational energy to the main system rather than suppressing it.
  • At the large excitation force amplitudes, the main system may lose its stability to respond with a quasiperiodic motion when the resonance condition between the main system and the PPF controller is lost.
  • Regardless of the main system natural frequency, once the controller natural frequency is properly tuned to be the same value as the excitation frequency ( ω 2 = Ω ), the controller can suppress the main system vibrations when subjected to any excitation force amplitude and/or any excitation frequency.
  • According to point (4) of the conclusion, the adaptive positive position feedback controller is the best control strategy that can eliminate the main system vibrations regardless of the excitation frequency and excitation force amplitude.

Author Contributions

N.A.S. developed the idea of this research and made the problem formulation; N.A.S. derived the formulas, made the calculations and performed the simulation study; N.A.S. and E.M.A. oversaw all aspects of the research, data analysis, validation, prepared the initial draft of the paper, writing, and revised this manuscript; N.A.S., E.M.A., T.A., M.A.E.-M., and M.S. have discussed the results and approved the final version of the paper. All authors have read and agreed to the published version of the manuscript.

Funding

The authors extend their appreciation to the Deanship of Scientific Research at King Saud University for funding this work through research group number RG-1440-048.

Institutional Review Board Statement

Not applicable.

Informed Consent Statement

Not applicable.

Data Availability Statement

Not applicable.

Conflicts of Interest

The authors declared no potential conflicts of interest concerning the research, authorship, and/or publication of this article.

Abbreviations

x ,   x ˙ ,   x ¨ Dimensionless displacement, velocity, and acceleration of the main system.
y ,   y ˙ ,   y ¨ Dimensionless displacement, velocity, and acceleration of the controller.
μ 1 ,   μ 2 Dimensionless linear damping coefficients of the main system and controller, respectively.
ω 1 ,   ω 2 Dimensionless linear natural frequencies of the main system and controller, respectively.
α Dimensionless cubic nonlinear stiffness coefficient.
f Dimensionless excitation force amplitude.
Ω Excitation force angular frequency.
γ Dimensionless control signal gain.
λ Dimensionless feedback signal gain.
σ 1 The detuning parameter σ 1 = Ω ω 1
a 1 ,   a 2 Dimensionless steady-state oscillation amplitudes of the main system and controller, respectively.

References

  1. Baz, A.; Poh, S. Short communications optimal vibration control with modal positive position feedback. Optim. Control Appl. Methods 1996, 17, 141–149. [Google Scholar] [CrossRef]
  2. Baz, A.; Hong, J.-T. Adaptive control of flexible structures using modal positive position feedback. Int. J. Adapt. Control Signal Process. 1997, 11, 231–253. [Google Scholar] [CrossRef]
  3. Friswell, M.I.; Inman, D.J. The relationship between positive position feedback and output feedback controllers. Smart Mater. Struct. 1999, 8, 285–291. [Google Scholar] [CrossRef]
  4. Rew, K.-H.; Han, J.-H.; Lee, I. Multi-Modal Vibration Control Using Adaptive Positive Position Feedback. J. Intell. Mater. Syst. Struct. 2002, 13, 13–22. [Google Scholar] [CrossRef]
  5. Song, G.; Schmidt, S.; Agrawal, B. Experimental robustness study of positive position feedback control for active vibration suppression. J. Guid. Control Dyn. 2002, 25, 179–182. [Google Scholar] [CrossRef] [Green Version]
  6. Song, G.; Qiao, P.; Binienda, W.; Zou, G. Active vibration damping of composite beam using smart sensors and actuators. J. Aerosp. Eng. 2002, 15, 97–103. [Google Scholar] [CrossRef]
  7. Shan, J.; Liu, H.; Sun, D. Slewing and vibration control of a single-link flexible manipulator by positive position feed-back (PPF). Mechatronics 2005, 15, 487–503. [Google Scholar] [CrossRef]
  8. Moon, K.; Seokn, H. Active vibration control of smart grid structure by multiinput and multioutput positive position feedback controller. J. Sound Vib. 2007, 304, 230–245. [Google Scholar]
  9. Kumar, R. Effective active vibration control of single link flexible manipulator with modified positive position feed-back control in the presence of instrumentation phase lead/lag. J. Vib. Control 2012, 19, 1538–1560. [Google Scholar] [CrossRef]
  10. Shin, C.; Hong, C.; Jeong, W. Active vibration control of clamped beams using positive position feedback controllers with moment pair. J. Mech. Sci. Technol. 2012, 26, 731–740. [Google Scholar] [CrossRef]
  11. Jun, L. Positive Position Feedback Control for High-Amplitude Vibration of a Flexible Beam to a Principal Resonance Excitation. Shock. Vib. 2010, 17, 187–203. [Google Scholar] [CrossRef]
  12. El-Ganaini, W.A.; Saeed, N.; Eissa, O.M. Positive position feedback (PPF) controller for suppression of nonlinear system vibration. Nonlinear Dyn. 2013, 72, 517–537. [Google Scholar] [CrossRef]
  13. Ferrari, G.; Amabili, M. Active vibration control of a sandwich plate by non-collocated positive position feedback. J. Sound Vib. 2015, 342, 44–56. [Google Scholar] [CrossRef]
  14. Omidi, E.; Mahmoodi, S. Nonlinear vibration suppression of flexible structures using nonlinear modified positive po-sition feedback approach. Nonlinear Dyn. 2015, 79, 835–849. [Google Scholar] [CrossRef]
  15. Omidi, E.; Mahmoodi, S. Sensitivity analysis of the Nonlinear Integral Positive Position Feedback and Integral Resonant controllers on vibration suppression of nonlinear oscillatory systems. Commun. Nonlinear Sci. Numer. Simulat. 2015, 22, 149–166. [Google Scholar] [CrossRef]
  16. Syed, H.H. Comparative study between positive position feedback and negative derivative feedback for vibration control of a flexible arm featuring piezoelectric actuator. Int. J. Adv. Robot. Syst. 2017, 14, 1–9. [Google Scholar] [CrossRef] [Green Version]
  17. Saeed, N.; Kamel, M. Active magnetic bearing-based tuned controller to suppress lateral vibrations of a nonlinear Jeffcott rotor system. Nonlinear Dyn. 2017, 90, 457–478. [Google Scholar] [CrossRef]
  18. Saeed, N.A.; Eissa, M. Nonlinear vibration control of a horizontally supported Jeffcott-rotor system. J. Vib. Control 2018, 24, 5898–5921. [Google Scholar]
  19. Saeed, N.; Kandil, A. Lateral vibration control and stabilization of the quasiperiodic oscillations for rotor-active magnetic bearings system. Nonlinear Dyn. 2019, 98, 1191–1218. [Google Scholar] [CrossRef]
  20. Zhao, G.; Paknejad, A.; Raze, G.; Deraemaeker, A.; Kerschen, G.; Collette, C. Nonlinear positive position feedback control for mitigation of nonlinear vibrations. Mech. Syst. Signal Process. 2019, 132, 457–470. [Google Scholar] [CrossRef] [Green Version]
  21. Eissa, M.; Kamel, M.; Saeed, N.A.; El-Ganaini, W.A.; El-Gohary, H.A. Time-delayed positive-position and velocity feedback controller to suppress the lateral vibrations in nonlinear Jeffcott-rotor system. Menoufia J. Electron. Eng. Res. 2018, 27, 261–278. [Google Scholar] [CrossRef]
  22. Marinangeli, L.; Alijani, F.; HosseinNia, S.H. Fractional-order positive position feedback compensator for active vibration control of a smart composite plate. J. Sound Vib. 2018, 412, 1–16. [Google Scholar] [CrossRef]
  23. Niu, W.; Li, B.; Xin, T.; Wang, W. Vibration active control of structure with parameter perturbation using fractional order positive position feedback controller. J. Sound Vib. 2018, 430, 101–114. [Google Scholar] [CrossRef]
  24. Ragusa, M.A.; Scapellato, A. Mixed Morrey spaces and their applications to partial diferential equation. Nonlinear Anal. Theory Methods Appl. 2017, 151, 51–65. [Google Scholar] [CrossRef]
  25. Paknejad, A.; Zhao, G.; Osee, M.; Deraemaeker, A.; Robert, F.; Collette, C. A novel design of positive position feed-back controller based on maximum damping and H2 optimization. J. Vib. Control 2020, 26, 1155–1164. [Google Scholar] [CrossRef]
  26. Bin, E.; Shan, J.; Khushnood, M.A.; Wang, X.; Cui, N. Determination of optimal positive position feedback parameters by using nonsmooth H∞ synthesis. J. Vib. Control. 2020, 1–13. [Google Scholar] [CrossRef]
  27. Nayfeh, A.H.; Mook, D.T.; Holmes, P. Nonlinear Oscillations. J. Appl. Mech. 1980, 47, 692. [Google Scholar] [CrossRef]
  28. Nayfeh, A.H. Resolving Controversies in the Application of the Method of Multiple Scales and the Generalized Method of Averaging. Nonlinear Dyn. 2005, 40, 61–102. [Google Scholar] [CrossRef]
  29. Mahmoodi, S.N.; Craft, M.J.; Southward, S.C.; Ahmadian, M. Active vibration control using optimized modified acceleration feedback with Adaptive Line Enhancer for frequency tracking. J. Sound Vib. 2011, 330, 1300–1311. [Google Scholar] [CrossRef]
  30. Mahmoodi, S.N.; Ahmadian, M.; Inman, D.J. Vibration control of microcantilever using adaptive modified positive position feedback. J. Intell. Mater. Smart Struct. 2010, 21, 571–580. [Google Scholar] [CrossRef]
Figure 1. The schematic diagram describes the connection of the main system and the PPF controller.
Symmetry 13 00255 g001
Figure 2. The main system response curves before control: (a) frequency-response curve, (b) force-response curve.
Symmetry 13 00255 g002
Figure 3. Frequency-response curves of the main system and controller when f = 0.03 : (a) the main system, (b) the PPF controller.
Symmetry 13 00255 g003
Figure 4. The effect of varying σ 2 on the frequency-response curve of the controlled system: (a) the main system, (b) the PPF controller.
Symmetry 13 00255 g004
Figure 5. The effect of increasing the control signal gain γ on the frequency-response curve of the controlled system: (a) the main system, (b) the PPF controller.
Symmetry 13 00255 g005
Figure 6. The effect of increasing the feedback signal gain λ on the frequency-response curve of the controlled system: (a) the main system, (b) the PPF controller.
Symmetry 13 00255 g006
Figure 7. The effect of increasing the controller linear damping coefficient μ 2 on the frequency-response curve of the controlled system: (a) the main system, (b) the PPF controller.
Symmetry 13 00255 g007
Figure 8. The effect of increasing the excitation force amplitude f on the frequency-response curve of the controlled system: (a) the main system, (b) the PPF controller.
Symmetry 13 00255 g008
Figure 9. Force response-curves of the controlled system at five different values of the external detuning parameter σ 2 : (a) the main system, (b) the PPF controller.
Symmetry 13 00255 g009
Figure 10. The controlled system time-response, Poincaré map, and frequency spectrum according to Figure 9 when f = 0.5 and σ 1 = 0.0 : (a,b) the temporal oscillation of the main system and PPF controller, (c,d) the Poincaré map of the main system and PPF controller, and (e,f) the frequency spectrum of the main system and PPF controller.
Symmetry 13 00255 g010
Figure 11. The controlled system time-response, Poincaré map and frequency spectrum according to Figure 9 when f = 0.5 and σ 1 = 0.05 : (a,b) the temporal oscillation of the main system and PPF controller, (c,d) the Poincaré map of the main system and PPF controller, and (e,f) the frequency spectrum of the main system and PPF controller.
Symmetry 13 00255 g011
Figure 12. The controlled system time-response, Poincaré map, and frequency spectrum according to Figure 9 when f = 0.5 and σ 1 = 0.14 : (a,b) the temporal oscillation of the main system and PPF controller, (c,d) the Poincaré map of the main system and PPF controller, and (e,f) the frequency spectrum of the main system and PPF controller.
Symmetry 13 00255 g012
Figure 13. The schematic diagram describing the connection between the main system and the APPF controller.
Symmetry 13 00255 g013
Figure 14. The effect of increasing the excitation force amplitude f on the frequency-response curve of the controlled system: (a) the main system, (b) the APPF controller.
Symmetry 13 00255 g014
Figure 15. Force response-curves of the controlled system at five different values of the external detuning parameter σ 2 : (a) the main system, (b) the APPF controller.
Symmetry 13 00255 g015
Figure 16. A comparison between the frequency-response curves of the main system without the control, with the PPF controller, and with the APPF controller: (a) the main system, (b) the PPF and APPF controllers.
Symmetry 13 00255 g016
Figure 17. The effect of online switching between the PPF and APPF control strategies on the main system nonlinear vibration when Ω = 0.9 according to Figure 16: (a) the main system, and (b) the controllers.
Symmetry 13 00255 g017
Figure 18. The effect of online switching between the PPF and APPF control strategies on the main system nonlinear vibration when Ω = 1.0 according to Figure 16: (a) the main system, and (b) the controllers.
Symmetry 13 00255 g018
Figure 19. The effect of online switching between the PPF and APPF control strategies on the main system nonlinear vibration when Ω = 1.1 according to Figure 16: (a) the main system, and (b) the controllers.
Symmetry 13 00255 g019
Figure 20. A comparison between the force-response curves of the main system without the control, with the PPF controller, and with the APPF controller: (a) the main system, (b) the PPF and APPF controllers.
Symmetry 13 00255 g020
Figure 21. The controlled system bifurcation diagram according to Figure 20 in the case of the PPF controller: (a) the main system, and (b) the PPF controller.
Symmetry 13 00255 g021
Figure 22. The controlled system bifurcation diagram according to Figure 20 in the case of the APPF controller: (a) the main system, and (b) the APPF controller.
Symmetry 13 00255 g022
Figure 23. The time histories of the main system when the excitation force f is swept from 0.01 to 0.45 according to Figure 20 in the case of both the PPF and APPF controllers: (a) the main system, (b) the PPF and APPF controllers.
Symmetry 13 00255 g023
Table 1. The main system and PPF controller parameters.
The Main System ParametersPPF Controller Parameters
ω 1 1.0 ω 2 1.0
μ 1 0.01 μ 2 0.001
α 0.05 γ 0.2
f 0.03 λ 0.2
σ 1 0.0 σ 2 0.0
Publisher’s Note: MDPI stays neutral with regard to jurisdictional claims in published maps and institutional affiliations.