Abstract
Blockchain technology has been applied to logistics tracking, but it is not cost-effective. The development of smart lockers has solved the problem of repeated distribution to improve logistics efficiency, thereby becoming a solution with convenience and privacy compared to the in-store purchase and pickup alternative. This study prioritized the key factors of smart lockers using a simulated annealing–genetic algorithm by fractional factorial design (FFD-SAGA) and grey relational analysis, and investigated the main users of smart lockers by grey multiple attribute decision analysis. The results show that the Web application programming interface (API) concatenation and money flow provider are the key success factors of smart lockers, and office workers are the main users of the lockers. Hence, how to better meet the needs of office workers will be an issue of concern for service providers.
1. Introduction
Blockchain technology has not been meeting the expectation of cost-effectiveness in logistic tracking, while smart lockers have been developed to overcome the inefficiency of repeated distribution to improve logistics efficiency. Moreover, it enhances convenience and privacy, as compared to the in-store purchase and pickup mode. In recent years, all-weather and unmanned logistics services have become the international trend, and smart locker developers have grown in number. Under conditions of a manpower shortage and the limited receiving space of supermarkets during holidays, the advantages of automatic pickup from smart lockers (high reliability and blockchain transparency) are as follows: (1) the utilization of smart lockers is increased; (2) small logistics service providers can share the lockers (taking advantage of the accounting and benefit distribution functions of blockchain); and (3) there is improved service during holidays. To solve the above problems, small service providers have shared smart lockers. Through competitor alliance, the joint method of shipment by service provider A and pickup from the smart lockers of service provider B has been adopted, which can integrate smart locker channels and expand service contacts. In this way, the market penetration level of smart lockers can be intensified within the reach of users, thereby attracting more users to the service, building the consumer habit of using smart lockers, shortening the investment return period of smart locker developers, increasing the economic benefits, and creating a smooth ecosphere [1,2,3].
Blockchain has three main benefits to the logistics industry. One is data transparency, ensuring data security and correctness, and accelerating the efficiency of cross-enterprise operation of smart lockers. Finally, a multi-center platform can be created, through which the originally distrusted logistics partners can use smart contracts to build mutual trust and cooperation, and encourage users to pay to share cross-industry resources. The so-called smart locker means that the delivery staff scan package barcodes and put packages into lockers. The system will automatically send a text message to the recipient, allowing consumers to pick up the goods at any time without having to go through the dispatcher or the store staff. This system offers the flexibility to pick up goods and avoid contact with people, reduces labor costs, and takes privacy into account. Even if the package is delivered to someone’s house through a logistics company, if it is not convenient to receive the goods, the recipient can choose to forward it to a neighboring smart locker. The niche appeal of smart lockers is that they allow consumers to consider both privacy and flexibility of delivery [4].
Previous literature has suggested that in order to build this ecosphere and create a new mutualistic type, two key problem areas must be addressed. The key problems and their solutions are detailed as follows [3,4].
- (1)
- Distrust between logistics service providers adds difficulty to B2B alliances.
Even if a legal entity serves as the impartial third party, it is difficult to generate full trust. However, completely transparent business contracts based on blockchain (smart contracts) cannot be altered, and thus can be executed perfectly. Goods stored in other service providers’ smart lockers can be managed by a consensual account, and the operations are recorded and traceable. The records cannot be changed, thereby solving the trust issue of business-to-business (B2B).
- (2)
- There is system rigidity and interface disunity.
As the current systems were individually developed and defined by providers, scalability is poor due to system rigidity. Moreover, the operations for users are complicated due to template and specification nonconformity. However, Internet of Things (IoT) devices can match various image interfaces for management analysis. Reliable data can be effectively collected to make innovative service experiences and build a customer-based consumer-to-business (C2B) structure. Customers can select their preferred delivery location, which is not limited to their logistics providers. This is displayed on unified interfaces in a blockchain (smart contract template). Using an integrated open platform structure based on blockchain technology to build a collaborative network for “solving the distrust of humanity with rational technology” can solve problems such as data interchange security, the universal interoperability of data formats, universal access to open interfaces, multiple participant roles, and complicated benefit sharing. The open platform can rapidly integrate idle lockers, dispatch manpower that matches the logistical needs, and build a low-cost, trustworthy mechanism. Particularly, features of blockchain such as tamper resistance, security, and guaranteed privacy are beneficial for cross-industry reserved lockers, which can prevent database tampering to achieve trust, intensify transaction safety and reliability, improve the transparency and efficiency of logistics and distribution management, and reduce delivery disputes.
In the future, smart mobile carriers (e.g., cars, trucks, and bicycles), distribution planning, route planning, and other data analysis technologies can be used to manage idle manpower and build an integrated logistics sharing service. This is expected to address the insufficient distribution know-how of staff members, reduce bottlenecks due to a lack of carrying capacity (limited physical strength), and improve the promotion success rate of logistics sharing services. After the smart sharing service solution is applied and fully developed in Taiwan’s market, it can even enter the international market, export logistics services and advanced technology to foreign countries, and create a new service mode with high added value. This win–win situation can solve the problem of low asset utility for smart lockers, increase profits, and improve technology export.
The self-service package pickup mode was adopted by the Packstation service of DHL in Germany, the InPost service of Integer.pl in Europe, and the POPStation service in Singapore. In Taiwan, the two major systems are iPickup by ITRI and Palmbox. Integrating automation and mobile technology for unmanned pickup can enhance users’ privacy and convenience and reduce the load of multiple-distribution logistics. With the advent of the sharing economy, undifferentiated pickup services have been provided for the public (regardless of logistics providers). The shopping frenzy on Singles’ Day (11/11) continues to increase year by year, and the day has become the largest online shopping event of the year, making logistics the battlefield in e-commerce. It was estimated that the logistics and home delivery market of Taiwan would reach the scale of USD 1 billion in 2019 [4,5,6,7,8].
Repeated home delivery is a common issue in the logistics industry, and can be as high as 20%, mainly because recipients are not home to receive packages. In order to reduce the additional labor and transportation costs associated with repeated home delivery, self-service pickup using smart lockers has become a favorable mode. Delivery drivers first scan the package barcodes and put the packages in smart lockers. The system then automatically sends messages to the recipients with pickup information. The pickup time is flexible, no second delivery is needed, and the labor cost is reduced. Even with packages for home delivery, recipients can choose to have them delivered to a neighboring smart locker. The niche market of smart lockers addresses consumer concerns regarding both privacy and flexibility. Smart lockers have been widely used in many countries. For example, Amazon Lockers can be found in convenience stores, grocery stores, and chain drugstores.
This study prioritized the key factors of smart lockers using the simulated annealing–genetic algorithm by fractional factorial design (FFD-SAGA) and grey relational analysis, and investigated the main users of smart lockers by grey multiple attribute decision analysis. Online shoppers can use this service without any extra charge. This pickup mode is continually being expanded, as shown in Figure 1 [4,5,6,7,8].
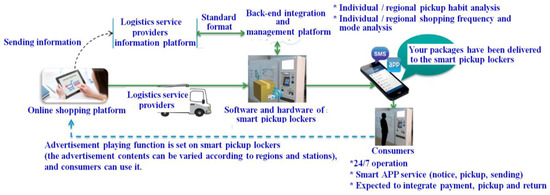
Figure 1.
Usage flow for smart lockers [4].
2. Literature Review
The advantages of blockchain-based smart lockers in the logistics industry include the following:
- (1)
- Package safety is ensured and package loss is avoided due to insufficient warehouse space for express delivery.
In the logistics industry, package loss is common due to insufficient warehouse space for express delivery, wrong and false claims, information disclosure issues, and resource underutilization. A blockchain is a distributed and multi-node database jointly operated by users. It can save data at multiple locations and nodes, and each block contains detailed information, such as buyers, sellers, prices, contract terms, etc. The information is verified by the exclusive signatures of both parties or multiple parties within the entire network. If the encrypted records are the same on the entire network, the information is considered valid and can be uploaded to the network for data sharing and absolute data security. Based on blockchain technology, capital, material, and information flows can be recorded and transmitted truly and reliably.
In the logistics industry, blockchain-based platforms can be used to optimize the resource utilization rate, reduce intermediate links, and improve the overall efficiency of the industry, in order to achieve information interaction and determine logistics scale and benefits. As a result, all users in the system can maintain their accounts, thereby ensuring system security and data openness and transparency. Aside from manual processing and paper-based information, the costs are greatly reduced and efficiency is improved. As the delivery process can be clearly recorded in the chain, the entire process of loading, transportation, and pickup is clear and distinct, which means it can optimize the resource utilization rate, reduce intermediate links, and improve overall efficiency. All the steps from package shipping to receiving are recorded in the blockchain to ensure the traceability of information, and thus avoid package loss and wrong claims. The system can also prevent delivery drivers from forging signatures to claim packages, as users can check the blockchain, thereby improving the implementation of real-name logistics systems. Furthermore, companies can keep track of the logistical status of packages through the blockchain, in order to prevent missing packages, facilitate anti-counterfeiting, and guarantee the interests of offline dealers at all levels [5,6,7,8].
- (2)
- Consensus can be reached that it is tamper-resistant and permanently traceable.
In blockchain technology, the main users act as nodes in the blockchain network; thus, each link in the entire business process forms a data record. As the records are tamper-resistant, complete, and traceable, it is convenient to regulate and audit capital and information flows. Users do not have to worry about some parties tampering with contracts, the database, or loss of interest arising from information asymmetry [9,10].
- (3)
- The system saves costs and improves efficiency.
Blockchain technology can gain credibility through programmatic records, storage, transmission, verification, and information data analysis without damaging data confidentiality. Its application in financial business can bring substantial cost savings, greatly simplify transaction flows, and carry out contracts automatically. Consequently, transactional efficiency is enhanced, the idle cost of capital is reduced, transaction and settlement risks are reduced, and the customer experience is optimized [11,12].
- (4)
- The distributed structure is more flexible and safe.
The distributed structure (non-monocentric) is more flexible and safe, as the transactional account is jointly completed by multiple nodes distributed in different locations, with all nodes recording a complete account. As a result, all nodes can participate in supervising transaction validity and jointly give evidence at the same time, which is different from traditional monocentric or single-node accounting solutions. No single node can record accounts separately, thereby avoiding the possibility of false accounts by single bookkeepers being controlled or bribed. Due to adequate accounting nodes, in theory, unless all nodes are destroyed, accounts will not be lost; thus, the security of account data is guaranteed [11,12].
- (5)
- Smart contracts are automatically executed.
Smart contracts based on these credible and tamper-resistant data can automatically follow some preset rules and terms. Some argue that core enterprises affected by blockchain and other new changes in financial technology will regain the financial advantages in logistics by using the information superiority, trading resource superiority, and customer resource advantages [13,14].
3. Research Method
3.1. Simulated Annealing–Genetic Algorithm
When the genetic algorithm is applied to the calculation of optimization problems, its initial convergence speed is fast because it is based on the population. However, with an increased evolution order, the convergence speed will gradually become slower. On the other hand, the simulated annealing method gradually converges with decreasing temperature of the annealing process through the slow cooling mechanism and sufficient iterations. In contrast, the convergence speed of the simulated annealing method is worse than that of the genetic algorithm at the beginning of the algorithm. However, the simulated annealing method has the ability to search quickly, which the genetic algorithm does not have. The simulated annealing method may get the chance to accept poor solutions through disturbances, and with the gradual decrease of temperature, the chance of the poor solution being accepted becomes smaller and smaller, until the better solution is accepted. Therefore, some hybrid genetic algorithms and simulated annealing methods are proposed to improve efficiency [3,15,16].
In order to improve the efficiency of the genetic algorithm by the fast search of the simulated annealing method, Adler [17] proposed combining the machine function of the simulated annealing method with the selection and mutation operators of the genetic algorithm. The simulated annealing–genetic algorithm (SAGA) proposed by Esbensen et al. [18] is an SA mutation, and the algorithm gradually reduces the population. This method, like Adler’s, changes the operation mode of the original genetic algorithm. Lin et al. [19] proposed the annealing–genetic (AG) algorithm, which is divided into the GA and SA stage in each generation. There are also hybrid methods to improve SA efficiency by using mating operators with the ability to communicate between individuals in the GA, such as PGSA proposed by Mahfoud et al. [20] and GSA proposed by Koakutsu [21].
The simulated annealing–genetic algorithm, which is a hybrid of the genetic algorithm and the simulated annealing method, as shown in the Figure 2, is proposed in this paper [3,15,16]. It improves the ability of the genetic algorithm to search for regions by using the characteristics of the simulated annealing method, which can make small disturbances in adjacent regions of the solution [22,23].
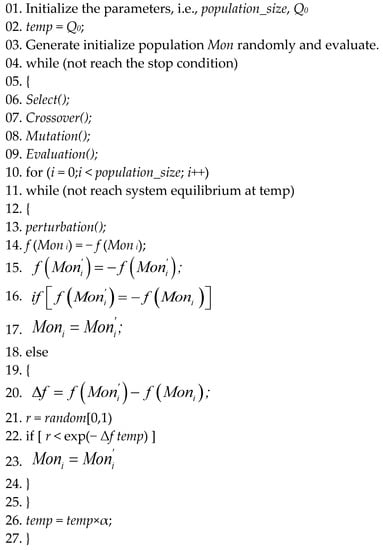
Figure 2.
Simulated annealing–genetic algorithm virtual program.
3.2. Steps of the Simulated Annealing–Genetic Algorithm by Fractional Factorial Design
FFD-SAGA can assist in determining the number and optimal level of key factors, as shown in Equations (1)–(11). Grey relational analysis can help in evaluating consumers who use smart lockers often, in terms of ranking the key service factors of the lockers, as shown in Equations (12)–(17). Grey multiple attribute decision-making can analyze the consumer groups that use smart lockers most frequently, as in Equations (18)–(24).
Fractional factorial design can analyze the advantages of the best factor combination, and can be combined with the genetic algorithm and simulated annealing algorithm in this paper to improve the search ability of the original algorithm. When the traditional genetic algorithm does the mating operation, it will randomly select two individuals for genetic mating. Common ones such as single-point and arithmetic mating have a common feature; that is, the offspring produced after mating cannot be guaranteed. It is better than the parent because it generates offspring in a random manner. In order to improve this shortcoming, this paper uses a partial factorial design method to replace the traditional mating method, so that the solution space generated by the two randomly selected parents can be sampled uniformly, and then the best offspring in this range can be analyzed.
We assume that when solving the problem of three variable dimensions, each variable is equivalent to a factor in the orthogonal table. Using FFD-GA is equivalent to considering a point in the search space generated by two parents, and in these points, we select the best and second best individuals as two offspring. As multiple individuals are considered at the same time and the best and second best are selected, compared to the traditional random exchange of parental genes, there is no guarantee that the offspring will be better than the parent’s method; it is systematic and efficient (Section 1, Section 2 and Section 3, step 2, below). The perturbation of the traditional simulated annealing algorithm is to randomly generate a perturbed solution in the searched solution space and use the probability function to determine whether to accept it as a new solution. This paper proposes that the partial factorial design method has the advantage of systematically inferring the best factor combination to find the best solution in the solution space generated by the current and perturbed solutions, and then judge whether to accept it as a new solution through the probability function. This paper refers to it as fractional factorial design–simulated annealing (FFD-SA). FFD-SA improves the traditional SA without systematic random disturbances, but uses systematic disturbances to improve the search performance of the algorithm (Section 3, steps 3–5, below) [3,15,16,22,23].
By combining the fractional factor design method with the mating operator of the simulated annealing–genetic algorithm, the global optimal solution can be obtained. We call it FFD-SAGA. FFD-SAGA can be regarded as FFD-GA combined with SA because of the added fractional factorial design method (in the same way as FFD-GA). The steps of the simulated annealing–genetic algorithm by fractional factorial design are as follows [3,15,16,22,23]:
- (1)
- Define the objective function
The objective function of the problem is defined as and the individual variable direction in the population is set as . Usually, is a nonlinear function and the search space is the dimensional hyperplane space of .
- (2)
- Generate an orthogonal table of FFD
According to the size of the variable vector dimension, the corresponding orthogonal table with columns and lines can be generated. The first columns are used. Here, N is the size of the variable vector dimension and .
- (3)
- Combine FFD with the mating operator of GA
Assuming that GA randomly selects two individuals in the mating operator, and :
Step 1. The two horizontal values “−” and “+” in the FFD respectively represent the genes of and .
Step 2. Each line of the FFD judges the genes of , , and the kth variables according to the corresponding level value. If the level value corresponding to this variable is “−,” it means that it is a gene of , and such value is expressed as ; if the corresponding level value is “+,” it is a gene of , expressed as .
Step 3. Calculate the value of the target function for each line: . The corresponding variable vector is , and the variable vector is substituted into the objective function to obtain the objective function value .
Step 4. Calculate the main effect of each line and determine the level value with the greater contribution in each line. When the level value of the ith line in the kth column is j, , otherwise , where j is “+”or “−.” Next, compare the main effects of the calculated level values in each column. When the problem is to maximize the adaptation function, the level values with larger main effects will contribute more. On the contrary, when the problem is to minimize the adaptation function, the level value of the smaller main effect will contribute more.
Step 5. The variables corresponding to the N main effect with greater contribution are the optimal factor combination and are taken as the first offspring. Then, the main effect difference for each column is calculated to find the one with the smallest value and the variable corresponding to the column and the same level value as the first offspring just generated as the variable of the second offspring, while the other variables of the second offspring are the same as the first offspring.
Equation (1): Calculate the main effect for each column and find the level value with the larger contribution in each column [16]:
When the level value of row in column is , ; otherwise, , where j is “+” or “−”; M represents the number of experiments; and is the output of the orthogonal array. Regarding the comparison of the main effects of the two level values calculated in each column, if the question is to maximize the fitness function, then the value with a larger main effect contributes more; conversely, if the question is to minimize the fitness function, then the value with a smaller main effect contributes more. The level values of the factors corresponding to the main effects with a larger contribution in each column make up the combination of optimal factors. This paper uses the following example to illustrate FFD-SAGA and how to apply FFD to infer a new solution [3,15,16,22,23].
3.3. Utility Model of Service Level Agreement
After performing the discovery process from step 1 to step 9, we can strengthen the relationship between candidate solutions and obtain a ranking order. The candidate solutions are multi-user services provided by service providers. Therefore, users can obtain appropriate multi-user services through such ranking information [24,25].
Through the normalization of service items based on the service level agreement, utility models can be created to indicate users’ satisfaction in receiving multi-user services [24,25].
is used to represent real value of multi-user service that user t obtains from service provider on issue . The utility value is normalized to fall within and is used to represent utility value , which the user obtains from multi-user service on issue . If the service provider offers high-quality service, the utility value obtained by the user will approach 1. Such relation can be represented as .
When users face multi-user service, the value of expected service issues of interest can be obtained. Given the variety of service issues that users are interested in, a multi-criterion decision analysis method is required to select a suitable multi-user service from a large number of services. In this study, a modified version of the ELECTRE method was adopted to find an appropriate multi-user service. The overall method consists of nine steps to determine the ranking order for the selection of a multi-user service [24,25]:
Step 1. Normalize the decision matrix. If multi-user services are involved in service quality assessment criteria, decision matrix will be normalized based on the service level agreement and utility model. The normalized decision matrix is shown in Equation (2):
Step 2. Multiply each row in the normalized decision matrix by the relevant weight. A weight will be assigned for each service quality assessment item, and all weighted values will form weighted matrix , as shown in Equation (3):
Normalized decision matrix Q is multiplied by its weighted matrix W to obtain weighted normalized decision matrix , as shown in Equation (4):
Step 3. Determine the consistent and nonconsistent sets according to Equation (5):
Step 4. Calculate consistent matrix as shown in Equation (6):
Step 5. Calculate nonconsistent matrix using Equation (7), where is a set containing all service qualities and . The consistent matrix can be denoted as .
Step 6. Calculate modified consistent matrix according to Equation (8):
Step 7. Calculate modified weighted aggregation matrix (the Hadamard product of and ) using Equation (9):
Step 8. Calculate modified aggregation dominant matrix by using the maximum value of each row, , as shown in Equation (10):
In order to identify a suitable solution, we rank in ascending order: . Threshold is a set of values between minimum value and maximum value . If the value of is smaller than threshold value , it will be replaced by 0, otherwise it remains 1. We can obtain modified aggregation dominant matrix , as shown in Equation (11):
Step 9. Finally, modify aggregation dominant matrix . When equals 1, it means that the preferred solution is better than solution . We can therefore eliminate solution , denoted as .
3.4. Grey Relational Analysis—Key Factor Sequencing
Grey system theory, as proposed by Professor Ju-long Deng in 1982, is aimed at describing the uncertainty of system models and the incompleteness of information to conduct information relational analysis and model building. The theory discusses and understands systems by means of prediction and decision-making. Incomplete system information is both the basic feature and the main determining factor of grey theory. In the grey system, information comprises two parts: the immensurable part expressing information visualization, and the measurable part, or the part of information data, which expresses the information scale. Grey relational analysis is aimed at the systems in daily life, such as social systems, economic systems, etc. There are various relationships among these systems, such as causal relationships; some of the relationships are known, while some are unknown or partially known. Hence, how to mine, analyze, and further understand the relationships between all systems is the key to system analysis [15,26].
Step 1. Normalize the original data, as shown in Equation (12):
Step 2. Assign the standard sequence and calculate the difference sequence, as shown in Equation (13):
Step 3. Solve the maximum difference and minimum difference , as shown in Equations (14) and (15):
Step 4. Calculate grey relational coefficient , as shown in Equation (16):
Step 5. Calculate the grey relational degree of all sequences and the standard sequence, as shown in Equation (17):
Step 6. Put in order based on the grey relational degree.
3.5. Grey Multiple Attribute Decision—Optimal Solution Selection
In grey multiple attribute decision-making, when uncertain or incomplete information factors are part of the process of multiple attribute decisions, the decision combination constituted by all possible decision elements is calculated based on the effect measure of grey theory to gain actual effect. The solutions are selected according to the decision matrix. First, the decision elements are defined; in grey multiple attribute decisions, each attribute is called an event. Set A represents an event set (or attribute set), and ai is an element in the event set, namely, some attribute ai, i = 1, 2, …, n. The alternative solution is called a strategy, where set B represents a strategy set, and bj is an element in the set, namely, solution bj, j = 1, 2, …, m. The result of each solution bj under attribute aj is called a situation, which is marked with sij in grey multiple attribute decision analysis. The result matrix can be built according to the evaluation results of each solution under each attribute. The application of grey relational analysis for grey multiple attribute decision analysis is described as follows [15,26].
3.6. Effect Measure
All attributes are required to be considered in multiple attribute decisions, regardless of which attribute is the analysis objective and which is a relevant factor. Hence, a virtual standard sequence must be built to calculate the grey relational coefficient . The virtual standard sequence comprises the optimal sij of the evaluation results under all attributes. The definition of the optimum solution must be determined as maximizing, minimizing, or minimizing the deviation to the target by considering the target of the attribute. The effect measure rij represents the correlativity between all elements and the virtual standard sequences in the progression corresponding to all ai attributes. The calculation method of the effect measure is to maximize, minimize, or minimize the deviation to the target, based on the target of the attribute, which are differentiated as a ceiling effect, a floor effect, and a specific center effect measure. They are described as follows [15,26].
The ceiling effect measure applies to the requirement of maximizing the target effect, that is, the larger the better, such as interests and outputs. Hence, the largest result of all solutions under attribute ai is taken as the corresponding element of the virtual standard sequence. The ceiling effect measure is defined as Equation (18):
The floor effect measure applies to the requirement of minimizing the target effect, that is, the smaller the better, such as resource inputs and variations. Hence, the smallest result of all solutions under attribute ai is taken as the corresponding element of the virtual standard sequence. The floor effect measure is defined as Equation (19):
The specific center effect measure applies to the condition requiring the target to be near a certain intended target, such as weather or temperature. Hence, target under attribute ai is taken as the corresponding element of the virtual standard sequence. The specific center effect measure is defined as Equation (20):
As seen above, the value of effect measure rij is between 0 and 1, and the larger the value, the better the effect of solution bj under attribute ai.
3.7. Multiple Attribute Decision Matrix
To build a decision matrix D based on effect measure rij, if there are n evaluation attributes, namely, , and solutions are selected, namely, , , then decision matrix can be expressed as Equation (21) [15,26]:
3.8. Decision Criterion
After the decision matrix is formed, the optimal solution can be selected according to the decision criterion. The decision criterion for grey multiple attribute decision analysis is to select the maximum effect measure in attribute ai* showing that, under consideration of attribute ai*, bj is the optimal decision solution. As the maximum element is sought in all lines, it is also known as a line decision, as shown in Equation (22) [15,26]:
To consider the comprehensive result of solution in all attributes, the relative weight can be incorporated, as shown in Equation (23), where the determination of is comprehensively scored based on linearly weighted summation, and the comprehensive result is calculated, as shown in Equation (24) [15,26]:
where is the total items of the attribute and is the attribute factor ordering; and
Finally, the maximum solution under the comprehensive result of summation is the optimal solution.
4. Case Study
These two solutions represent the “−” and “+” level values, respectively, in the orthogonal array. The results of the array can be obtained by filling in the corresponding level values of the two solutions in the orthogonal array. The main effect of each column is then evaluated according to Equation (1), where and are the main effects of a level value of “−” and “+,” respectively. Next, the main effect difference is calculated for each column to find the minimum value. After choosing the variable that corresponds to the level value of the first generation as the variable of the second generation, the other variables of the second generation that are the same as the first generation are determined. The suboptimal factors are shown in Table 1 [3,15,16].

Table 1.
Simulated annealing–genetic algorithm by fractional factorial design (FFD-SAGA) calculation results.
After performing steps 1 to 9 of the discovery process from Section 3.3, we can strengthen the relationships between the candidate solutions and obtain the ranking order of all candidate solutions. The candidate solutions are multi-user services provided by the service provider, and users can use this ranking information to access appropriate multi-user services, as shown in Table 2 (; C10 = 0.831, C6 = 0.82, …, C11 = 0.392, C12 = 0.316). Finally, using FFD-SAGA, the key factors (C1–C10) in Table 3 can be obtained.
Table 2.
Performance comparison of FFD-SAGA and SAGA.
Table 3.
Top 10 special search functions of smart lockers.
In this study, 30 people from three major metropolitan areas in northern, central, and southern Taiwan were the interviewees, including office workers (10), students with university education or above (10), and homemakers (10). Face-to-face interviews were conducted with those who used smart lockers more than 10 times per month. The interview contents are shown in Table 3.
5. Discussion
This study is based on the mean values of related data gained from different customer groups in northern, central, and southern Taiwan, as shown in Table 4. The relevant calculation steps are shown in Table 5, Table 6, Table 7 and Table 8.
Table 4.
Initial values of grey relational analysis.
Table 5.
Step 1 of grey relational analysis.
Table 6.
Steps 2 and 3 of grey relational analysis.
Table 7.
Steps 4–6 of grey relational analysis.
Table 8.
Results of grey relational analysis.
- C10:
- Types of Web API-concatenated functions.
Smart lockers look like common lockers. Delivery drivers place packages in the lockers, scan the barcodes on the packages, and send text messages to notify the recipients for pickup. Hence, providing more types of Web API-concatenated functions is conducive to increasing the number of users.
Although using smart lockers for pickup is not as convenient as picking up packages at convenience stores, privacy is the advantage of smart lockers. That said, most items are properly packaged, and sensitive items are avoided, so the appeal of privacy is not enough to convince Taiwanese customers to change their user habits. More protections for privacy and personal information should be considered in Web API-concatenated functions.
- C6:
- Types of money flow provided
As 24 h convenience stores are densely located in Taiwan, promoting smart lockers may not be easy. Officials at the Department of Commerce mentioned that after the Double 11 shopping day, numerous packages are stacked behind the counter, and there is a shortage of manpower to handle the packages, which affects the customers’ check-out speed. Thus, smart lockers will be a feasible solution. According to survey results of the Market Intelligence and Consulting Institute (MIC), more than 80% of consumers in Taiwan prefer “pickup at convenience stores/pay on delivery,” while the new pickup method using smart lockers only accounts for 0.5%, indicating that the ratio varies dramatically. Hence, providing more types of monetary services will enhance customers’ satisfaction.
- C8:
- Types of integrated hardware devices
Generally speaking, the hardware devices of smart lockers are less important, as different kinds of customers share the common objective of retrieving packages quickly. In this study, according to the interview results, the indicative factors C5, C7, C8, and C10 are special center effect measures, while the others are the expected values of different kinds of customers. The grey multiple attribute decision results are shown in Table 9 and Table 10.
Table 9.
Initial values of grey multiple attribute decision-making.
Table 10.
Calculation results of grey multiple attribute decision-making.
The analysis of the optimal solution based on grey multiple attribute decision-making found that office workers are the main user group of smart lockers. As market competition is intense, more logistics providers are seeking a new niche to seize the opportunity and create innovative and interactive networks. However, this cannot be realized until more features are developed for smart lockers, such as lockers set at MRT (Mass Rapid Transit) stations or in remote areas, so as to provide more convenient services and more functions (such as freezers or large storage areas).
The three elements of sustainable development are as follows [1,2]:
- (1)
- Environmental: reducing helium emissions
According to the data in Table 11, consumers can use smart pickup stations 24 h a day and perform self-service pickup according to their individual timeframes. The locations are convenient for personal pickups and for when no one is at home to collect parcels, and the number of transportation vehicles can be reduced, thereby lowering exhaust emissions.
Table 11.
Why consumers use smart pickup lockers.
- (2)
- Social: meeting customer needs
According to the 30 participants from each of the three metropolitan areas in northern, central, and southern Taiwan, Table 11 shows that the top four factors influencing the use of smart pickup lockers are the same as those shown in Table 11.
- (3)
- Economic: reducing costs
According to Table 9, consumers can use smart pickup lockers for 24 h self-service pickup on their own time. The locations are convenient for personal pickups and no one needs to stay home to collect parcels, which will result in lower logistics costs.
The logistics costs were initially categorized as about 6% classification and picking, about 4% concentrated goods, and about 37% long-distance transportation. Delivery of goods to customers accounts for about 53%. The uncertainty of this factor was due to the challenges of urban traffic congestion, distances to remote areas, invalid or wrong addresses, locations that are difficult to find, no one being able accept the goods, buyer regret—not accepting the goods, bad parking, no elevators, etc. Such uncertainties are also the most worrisome situations for office workers [27,28,29].
A total of 1098 Taiwanese consumers were surveyed on their use of smart pickup lockers [27,28,29]. According to Table 9, based on the participants from the metropolitan areas in northern, central, and southern Taiwan, it can be seen that the top four rankings of office workers using smart lockers are the same as in Table 11.
Strategy promotion: (1) combine with the electric business, push the cargo flow service mode to the lockers; (2) cooperate with communities and buildings to establish smart pickup lockers, as shown in Figure 3 [27].
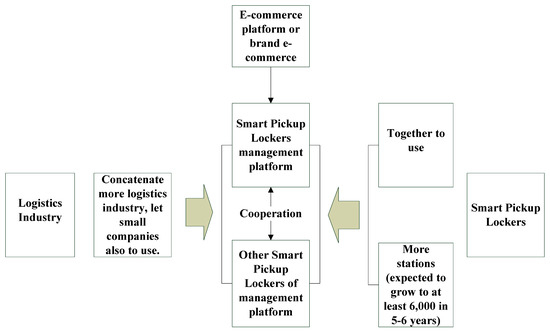
Figure 3.
Use of smart pickup lockers.
6. Conclusions and Future Research Directions
With the rapid development of e-commerce, the volume of express delivery services has expanded, and the huge amount of express delivery has caused many problems. Even though the rural area in Taiwan is not large and express delivery is already very developed, it is still inconvenient to receive goods. Many smart locker companies have emerged in the market. The use of smart pickup lockers involves providing a space for temporary storage of items. When users cannot collect items directly, the courier can deliver the items to lockers, and then recipients can collect the items when they are free. In addition, they can also be used for the mailing function; as long as the items are put into the smart pickup lockers, the logistics personnel will pick up and deliver the goods. The advantage of this is that the courier can deliver multiple items to one location, and there is no need to call and wait for people to collect the items, which can improve the efficiency of logistics. It is more convenient for users to receive packages and pick them up by themselves at any time, without worrying about not being home to receive them. This research analyzed the key success factors related to the use of smart lockers and analyzed the key user groups, hoping to provide the best service plan for the industry and consumers.
As most goods are properly packaged and sensitive items are avoided, the appeal of privacy is not enough to convince Taiwanese customers to change their user habits. Hence, more protections for privacy and personal information should be considered in Web API-concatenated functions. As Taiwan’s market is limited, opportunities are expensive and the actual effects remain to be observed. The time for self-service stores is coming. The Ministry of Economic Affairs in Taiwan has started to support logistics providers installing more smart lockers, including at post offices, convenience stores, community buildings, large public places, and science parks. In the future, logistics providers will develop convenient and inexpensive services to meet the demands of different groups of customers and popularize smart lockers.
Author Contributions
S.-T.W. provided the integrated research method, data analysis and creative concept for this research. M.-H.L. provided the references discuss for this research. C.-C.L. provided the content of integrated for this research. All authors have read and agreed to the published version of the manuscript.
Funding
This research received no external funding.
Institutional Review Board Statement
Not applicable.
Informed Consent Statement
Not applicable.
Data Availability Statement
The data used to support the findings of this study are available from the corresponding author upon request.
Conflicts of Interest
The authors declare no conflict of interest.
References
- Yoo, M.; Won, Y. A Study on the transparent price tracing system in supply chain management based on blockchain. Sustainability 2018, 10, 4037. [Google Scholar] [CrossRef]
- Kouhizadeh, M.; Sarkis, J. Blockchain Practices, Potentials, and Perspectives in Greening Supply Chains. Sustainability 2018, 10, 3652. [Google Scholar] [CrossRef]
- Hayrutdinov, S.; Saeed, M.S.R.; Rajapov, A. Coordination of Supply Chain under Blockchain System-Based Product Lifecycle Information Sharing Effort. J. Adv. Transp. 2020, 2020, 1–10. [Google Scholar] [CrossRef]
- Lo, G.S.; Li, T.Y. Development trend for the application of blockchain and IoT in logistics industry. C.I.E.E. Mag. 2018, 2, 32–39. [Google Scholar]
- Ding, M.J.; Kam, B.H.; Zhang, J.Y.; Jie, F. Effects of human resource management practices on logistics and supply chain competencies—Evidence from China logistics service market. Int. J. Prod. Res. 2014, 53, 2885–2903. [Google Scholar] [CrossRef]
- Ølnes, S.; Ubacht, J.; Janssen, M. Blockchain in government: Benefits and implications of distributed ledger technology for information sharing. Gov. Inf. Q. 2017, 34, 355–364. [Google Scholar] [CrossRef]
- Kleinaki, A.S.; Mytis-Gkometh, P.; Drosatos, G.; Efraimidis, P.S.; Kaldoudi, E. A blockchain-based notarization service for biomedical knowledge retrieval. Comput. Struct. Biotechnol. J. 2018, 16, 288–297. [Google Scholar] [CrossRef]
- Deutsch, Y.; Golany, B. A parcel locker network as a solution to the logistics last mile problem. Int. J. Prod. 2018, 56, 251–261. [Google Scholar] [CrossRef]
- Reyna, A.; Martín, C.; Chen, J.; Soler, E.; Díaz, M. On blockchain and its integration with IoT. Challenges and opportunities. Future Gener. Comput. Syst. 2018, 88, 173–190. [Google Scholar] [CrossRef]
- Min, H. Blockchain technology for enhancing supply chain resilience. Bus. Horiz. 2019, 62, 35–45. [Google Scholar] [CrossRef]
- Minoli, D.; Occhiogrosso, B. Blockchain mechanisms for IoT security. IOT 2018, 1–2, 1–13. [Google Scholar] [CrossRef]
- Pustišek, M.; Kos, A. Approaches to front-end IoT application development for the Ethereum blockchain. Procedia Comput. Sci. 2018, 129, 410–419. [Google Scholar] [CrossRef]
- Casado-Vara, R.; Prieto, J.; De La Prieta, F.; Corchado, J.M. How blockchain improves the supply chain: Case study alimentary supply chain. Procedia Comput. Sci. 2018, 134, 393–398. [Google Scholar] [CrossRef]
- Li, Z.; Barenji, A.V.; Huang, G.Q. Toward a blockchain cloud manufacturing system as a peer to peer distributed network platform. Robot. Comput. Manuf. 2018, 54, 133–144. [Google Scholar] [CrossRef]
- Wang, X.; Zhao, J.; Li, Q.; Fang, N.; Wang, P.; Ding, L.; Li, S. A Hybrid Model for Prediction in Asphalt Pavement Performance Based on Support Vector Machine and Grey Relation Analysis. J. Adv. Transp. 2020, 2020, 1–14. [Google Scholar] [CrossRef]
- Huang, Y.T.; Liu, Z.L. Effectiveness analysis of constructing orthogonal simulated annealing method using partial factor design. In Proceedings of the 9th Symposium on Artificial Intelligence and Application, NCCU, Taipei, Taiwan, 5–6 November 2004. [Google Scholar]
- Adler, D. Genetic Algorithms and Simulated Annealing: A Marriage Proposal. In Proceedings of the IEEE International Conference on Neural Networks, San Francisco, CA, USA, 28 March–1 April 1993; pp. 1104–1109. [Google Scholar]
- Esbensen, H.; Mazumder, P. SAGA: A unification of the genetic algorithm with simulated annealing and its application to macro-cell placement. In Proceedings of the 7th International Conference on VLSI Design, Calcutta, India, 5–8 January 2002; pp. 211–214. [Google Scholar]
- Lin, F.-T.; Kao, C.-Y.; Hsu, C.-C. Applying the genetic approach to simulated annealing in solving some NP-hard problems. IEEE Trans. Syst. Man Cybern. 1993, 23, 1752–1767. [Google Scholar] [CrossRef]
- Mahfoud, S.W.; Goldberg, D.E. Parallel recombinative simulated annealing: A genetic algorithm. Parallel Comput. 1995, 21, 1–28. [Google Scholar] [CrossRef]
- Koakutsu, S.; Kang, M. Genetic Simulated Annealing and Application to Non-slicing Floorplan Design. In Proceedings of the 5th ACM/SIGDA Physical Design workshop, Reston, VA, USA, 15–17 April 1996. Technical Report. [Google Scholar]
- Almomani, O. A Feature Selection Model for Network Intrusion Detection System Based on PSO, GWO, FFA and GA Algorithms. Symmetry 2020, 12, 1046. [Google Scholar] [CrossRef]
- Albadr, M.A.; Tiun, S.; Ayob, M.; Al-Dhief, F. Genetic Algorithm Based on Natural Selection Theory for Optimization Problems. Symmetry 2020, 12, 1758. [Google Scholar] [CrossRef]
- Chang, S.F.; Ke, C.K.; Wu, M.Y. Multi-criteria Decision Analysis Based on SLA Utility Model: A Method for Optimized Multi-tenancy Services Selection. CCL Tech. J. 2012, 145, 71–78. [Google Scholar]
- Chi, Y.L.; Lee, C.W.; Chen, C.Y. A Selection Approach for Optimized Web Services Compositions. Electron. Commer. Stud. 2004, 2, 297–314. [Google Scholar]
- Chien, C.F. Decision Analysis and Management: A Unison Framework for Total Decision Quality Enhancement; Yeh Yeh Book Gallery: Taipei, Taiwan, 2014. [Google Scholar]
- Hong, W.W. Smart Business and Logistics Technology Achievements and Application Promotion Project Briefing Session—Intelligent Logistics; Industrial Technology Research Institute, Service System Technology Center: Hsinchu County, Taiwan, 2018. [Google Scholar]
- Zhang, J.; Cui, W.; Ma, J.; Yang, C. Blockchain-based secure and fair crowdsourcing scheme. Int. J. Distrib. Sens. Netw. 2019, 15, 7. [Google Scholar] [CrossRef]
- Hassan, M.A.; Habiba, U.; Ghani, U.; Shoaib, M. A secure message-passing framework for inter-vehicular communication using blockchain. Int. J. Distrib. Sens. Netw. 2019, 15, 2. [Google Scholar] [CrossRef]


Publisher’s Note: MDPI stays neutral with regard to jurisdictional claims in published maps and institutional affiliations. |
© 2021 by the authors. Licensee MDPI, Basel, Switzerland. This article is an open access article distributed under the terms and conditions of the Creative Commons Attribution (CC BY) license (http://creativecommons.org/licenses/by/4.0/).