Abstract
This study investigated the impacts of different notification modalities used in low and high ambient sound environments for mobile phone interaction. Three different notification modalities—Shaking Visual, Shaking Visual + Vibration, and Vibration—were designed and experimentally tested by asking users to conduct a maze task. A total of 72 participants were invited to take part in the experiment through the convenience sampling method. The generated results indicated that (1) the notification modality affects participants’ task completion time, (2) the error rate pertinent to the number of notifications is positively related to the participants’ task completion time, and (3) the ambient sound level and notification modalities impact the overall experience of the participants. The main contributions of this study are twofold. First, it verifies that the multi-dimensional feature of a Shaking Visual + Vibration synesthesia notification design is implementable. Second, this study demonstrated that the synesthesia notification could be feasible for mobile notification, and it was more perceptible by the users.
1. Introduction
Mobile phones play an important role in life and have evolved into a must-have for leisure and gaming activities. Very often, users receive all types of notifications from their mobile phones to facilitate the interactivities between the user and the device. The user’s response to the mobile notification is, in fact, an interactive process. The notification interaction can drive users to immediately take a specific action, make a decision, and/or choose to express personal preferences. These notification interactions include the buttons for secondary or complementary actions that allow users to interact with notifications from outside of the application (app). Similarly, when the app is active, some notifications inside the app will be triggered through user operations to present the current progress or feedback regarding some operational information to the user. This research study is intended to focus on the impact of in-app notifications pertaining to user operations.
In the notification system of the mobile device, there are at least three forms of notification design, typically vision, sound, and vibration. Previous research on vibration notification forms has focused on the frequency, the strength of vibration, the presentation of the visual graphics and audio tones, etc. [1,2]. These forms usually do not exist independently, and sometimes they are triggered simultaneously in multiple ways. Different notification modalities give users various types of experience in different places. Therefore, the notification modality should be designed according to the context of the environment and the user’s requirements.
In addition, the perceptibility of mobile notifications with modality delivery has been gradually gaining value. Humans possess a perceptual phenomenon named synesthesia, which offers stimulation of one sensory or cognitive pathway leading to automatic, involuntary experiences in a second sensory or cognitive pathway. For instance, seeing a particular image can give us a feeling of vibration. Moreover, some results of the research on human synesthesia can also be used in interaction design.
Based on the above-mentioned viewpoints, we have aimed to present mobile notifications via synesthesia. That is, we adopted an animation effect to help present the vibration notification of the visual presentation, and at the same time, triggered the real vibration notification of the mobile app to attain a sense of synesthesia. The purpose of this study was to (1) explore the feasibility and perceptibility of different notification modalities, (2) evaluate the impact of environmental sounds on notifications, and (3) explore the impact of different notifications on user experience.
This article is divided into six sections. In the second section, notification interactions along with the essential factors are discussed, and the concept of synesthesia is introduced pertinent to the notification design. After describing the experimental methods along with the research process in Section 3, the resulting parameters are evaluated in Section 4. The detailed results of the test are discussed in Section 5. Finally, the paper concludes with some remarks.
2. Literature Review
2.1. Notification on Mobile Phones
Iqbal and Bailey [3] defined a notification as a visual cue, auditory signal, or haptic alert generated by an application or service that relays information to a user. Correspondingly, notifications from mobile phones can be divided into three dimensions—visual, vibration, and sound. According to different use purposes and situations, there are various notification modalities, such as instant messages (e.g., phone calls, social media) for which users are more inclined to perceive sound or vibration, or in-app notifications, which are visually presented to show the current progress to users (e.g., lightbox, dialog).
Many scholars have contributed to the research on mobile phone notifications. Early studies mainly focused on the interference effect caused by instant notification [4,5], but in recent years, in-app notifications have gradually attracted research attention. Scholars have paid more attention to the feedback modality of notifications [6]. For example, Yao, Grant, and Cruz studied the question of strength perception for vibration signals used in mobile devices [7], while other studies distinguished the importance of messages through different auditory notifications [4] and researched the privacy of tactile notifications [1,8]. Very often, however, mobile notifications are not just a single dimension. They occur simultaneously in two or more multiple dimensions. Williamson et al. attempted to use tactile displays and realistic impact sounds to produce a compelling interactive interface system [9].
In addition, some scholars have been concerned about the effect of the environment on the perceptibility of mobile notifications [10,11]. Baek et al. believed that mobile phones offer multimodal feedback (e.g., visual, auditory, and vibration feedback) by essentially considering different environments so that users can set up a reception mode suitable to their situation in mobile environments [12]. Martino and Marks suggested that “although audio output has been proven to be an effective feedback, it can sometimes be inappropriate or go unnoticed, especially in a noisy environment such as a concert or train station, or in a situation where it would be socially improper for a mobile device to ring loudly, e.g., in a library or business meeting” [13]. In a study conducted by Komninos et al., the ambient light was used to help deliver notifications from mobile phones along with using standard modalities [14,15], such as sound and vibration. The results showed that notification modality preferences are dependent on the environmental context and indicated that the perceptibility of notifications can only be strongly affected by the presence of audio or ambient lighting cues. Hence, it is necessary to pay attention to the effect of the environment on users’ mobile interactions.
Figure 1 summarizes previous research regarding mobile notifications. The notification modality is presented in the visual, auditory, and tactile dimensions based on the function and information of the purpose. Different notification modalities may affect users’ perceptions and emotions, and thereby affect the users’ actions (i.e., ignore or respond). The environment may also affect the perception of users or the perceptibility of the notification. Subsequently, these effects are reflected in the users’ subjective emotions, such as satisfaction. Ambient sound has an impact on the perceptibility of auditory notifications [13,16], but the impact on visual and tactile dimensions is still an unresolved issue in the previous literature; hence, this is the focus of this study.
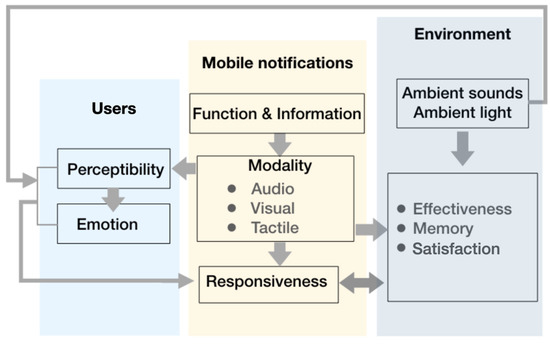
Figure 1.
Previous research on mobile notifications.
2.2. Synesthesia in Design
The psychological phenomenon that interacts with various senses is called “synesthesia”, that is, the stimulating effect on one sense triggers another. The most common synesthesia is grapheme–color. Colors can be used as a temperature sensor; for instance, red, orange, and yellow can make people feel warm, whereas blue and green can make people feel cool. In auditory–tactile synesthesia, certain sounds can induce sensations in parts of the body; someone with auditory–tactile synesthesia may experience that hearing a specific word feels such as being touched on one specific part of the body or may experience that certain sounds can create a sensation in the skin without being touched. It is one of the least common forms of synesthesia. Not every user can experience the synesthesia phenomenon, but it can sometimes be created by design [17,18,19].
Synesthesia in design refers to the enhancement of a corresponding effect by using certain words in painting, architecture, and environmental layout. Pattern design and visual design often adopt synesthesia concepts, and some painters even perform synesthesia experiments through vivid color contrast, which causes non-visual reactions [20,21,22]. Synesthesia is more similar to a metaphor adopted in a specific design.
Most of the previous literature on synesthesia design sought to explore the interactions between auditory and visual senses. For instance, the sound of shattering dishes can represent the dropping of a virtual object into a (virtual) recycling bin, whereas the sound of a door slamming indicates a remote user logging off the network [23]. There are scholars who have evaluated the appropriateness of auditory icons as mobile notifications. In their experimental results, auditory icons performed significantly better in terms of intuitiveness, learnability, memorability, and user preference because users can naturally associate them with metaphorical things [24,25]. Furthermore, some scholars have also explored the interaction between the visual and tactile senses. The results obtained in a selective attention experiment by Martino and Marks showed that cross-modal interactions between vision and touch depend on the synesthetic relationship among all the stimulus combinations. Under orthogonal variation of stimulus by vibration and vision dimensions, participants responded more quickly to matched than to mismatched patterns [12].
In summary, in view of the multi-dimensional features of mobile notifications, we used animated shaking visual designs with vibration in the experiment to help users achieve a sense of synesthesia. Regardless of the information of the notification, the experiment focused on the perceptibility of notifications with different ambient sounds.
Hypotheses are as follows:
- The notification modality will affect the participants’ operation time;
- The notification modalities have different effects on participants’ emotions with different ambient sounds;
- There are significant interaction effects between notification modality and the environment;
- There is a significant correlation between the error rate and the task completion time.
3. The Experiment
This experiment implemented a 3 (notification modality) × 2 (environment) between-subjects design (see Figure 2). There were six groups of participants in total. According to the different modalities of notifications and environments, each group experienced one of the notification modalities with one ambient sound environment.
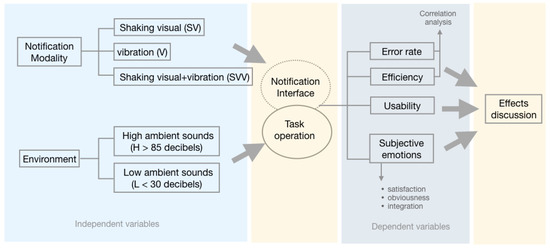
Figure 2.
The research model of this study.
The International Labour Organization (ILO) has pointed out that a safe level of noise refers to 85 dB over an eight-hour workday [26]. Physically, 30–40 dB is an ideal quiet environment, whereas 70 dB will interfere with conversation and affect work efficiency. Long-term living in a noisy environment above 90 dB may severely affect human hearing and cause neurasthenia, headaches, high blood pressure, and other diseases [27]. Therefore, higher ambient sound is defined as greater than 80 decibels but less than 90 decibels. The experimental areas were in public places, such as city parks and restaurants. The lower ambient sound is defined as less than 30 decibels. The experimental area was in a quiet laboratory. Before the participants performed the task, the ambient sound level was tested by a decibel meter to ensure the validity of the experiment. The experimental data were collected through a time estimation and a 7-point Likert scale.
3.1. Variables
Table 1 shows the variables of the experiment.

Table 1.
Experimental variables.
The independent variables were as follows:
- Notification modality: (1) Shaking Visual + Vibration (SVV); (2) Shaking Visual (SV); and (3) Vibration (V).
- Environment: high ambient sound (H, 80–90 decibels) and low ambient sound (L, <30 decibels)
The dependent variables were as follows:
Task completion time, error rate (the number of notifications), and subjective evaluations.
Control variables were as follows:
Participants: Individuals with no health problems (hearing ability, cognitive ability, etc.) and 20–30 years of age.
Devices: during the experiment, the experimental phone was in flight mode. We ensure that no other out-of-app notifications occur during the experiment.
Ambient sound: We use a decibel tester to strictly monitor the changes in the environmental sound level during the process. The experiment will be aborted if any sudden voices change in the decibel level during the experiment.
3.2. Process
The experimental device is an iPhoneXS (Apple, Cupertino, CA, USA) with a 5.8-inch screen running the iOS14 system. An interactive maze was created for the experiment using Xcode. Four intersections were planned in the maze, each with no more than three selections. There was only one correct route in the maze. The platform of the maze notified the user when the moving point deviated one pixel from the correct route. Each of the notifications pertinent to the deviated pixel was recorded once. Therefore, the error rate was calculated based on the number of notifications.
Figure 3 shows the sample interface of the experiment. The experiment has two tasks. Task 1 requires participants to interact with the maze from the starting point (S) to the ending point (E), and Task 2 requires them to return from the ending point (E) to the starting point (S). Tapping the arrow at the bottom of the screen will move the green dot, and each tap will move one pixel. Long press is not supported. The notification modality of SV is a shaking animation shown on the display of the maze area. The notification modality of SVV is a synesthesia notification where a shaking visual and vibration occur at the same time, and the shaking frequency is consistent with the vibration frequency. The V modality is a vibration with the original strength of the iPhone XS set to 0.5 s.
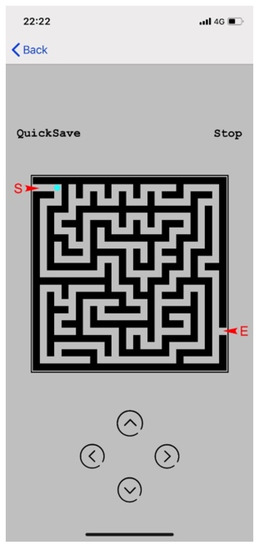
Figure 3.
The maze interface of this experiment.
Participants were required to complete the maze as quickly as possible with the mobile phone during the experiment. After the assigned task was completed, they were asked to fill in the subjective questionnaire, describe the emotion, and provide comments on the designed notifications. The entire experiment took approximately 15 min. The experimental data were collected through a time estimation, error rate, and a 7-point Likert scale.
3.3. Participants
A total of 72 participants were invited to take part in the experiment through a convenience sampling method. They were all between 20 and 30 years old. According to semi-structured interviews before the experiment, participants in this age group use mobile devices more frequently and like to use mobile phones for shopping, social networking, entertainment, office work, etc. They are sensitive to mobile notifications. Therefore, they are representative. All participants signed informed consent before the experiment. To ensure the validity of the experiment, we strictly monitored the ambient sound changes during the process to ensure that the participants operated in a qualified sound environment. For this reason, the data of six participants were not included in the statistical analysis due to the change in ambient sound during the experiment.
4. Results
4.1. The Results of Task Completion Time
There are four intersections designed in the maze, each with no more than three selections. Table 2 illustrates the results of task completion time generated from the two-way ANOVA regarding the comparison of the variables of notification modality and environment.
Table 2.
The result of two-way ANOVA of task time.
4.1.1. Task 1: From S to E
The results pertinent to “Task 1 (S to E)” indicated that the main effect of the notification modality showed a significant difference (p = 0.007). The results from a subsequent post hoc comparison (i.e., least significant difference, LSD) showed that SV (M = 40.78) and SVV (M = 49.63) showed a significant difference (p = 0.002). V (M = 37.11) and SVV also showed a significant difference (p = 0.03). No significant difference was found between SV and V (p = 0.36). In addition, the main effect of the environment showed no significant difference (p = 0.37). The interaction effects between the two variables of “notification modality” and “environment” revealed statistically significant effects (p = 0.007) regarding the participants’ operating time of Task 1 (see Figure 4).
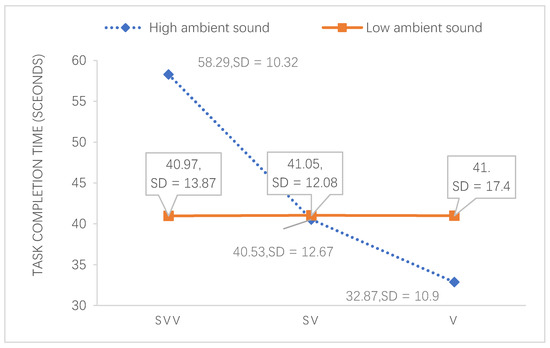
Figure 4.
The interaction diagram between “notification modality” and “environment” regarding the participants’ operating time of Task 1 starting point (S) to ending point (E).
According to Figure 4, the participants’ operation time of Task 1 showed that in the high ambient sound environment, the participant takes more time to complete the task with the SVV notification modality than in the low ambient sound environment. With the SV notification modality, the effect of high and low ambient sound environments seems to be similar. Nonetheless, participants encountering the V notification modality spent significantly less time in the high ambient sound environment than in the low ambient sound environment.
4.1.2. Task 2: From E to S
The results pertinent to “Task 2 (E to S)” indicated that the main effect of the notification modality showed a significant difference (p = 0.032). The results from a subsequent Post Hoc comparison (LSD) indicated that SV (M = 37.01) and SVV (M = 47.01) showed a significant difference (p = 0.028). V (M = 36.72) and SVV also showed a significant difference (p = 0.02). No significant difference was found between SV and VS (p = 0.94). This result is consistent with the result from S to E. Moreover, there was no significant difference in the main effect of the environment (p = 0.31). The interaction effects between the two variables of “notification modality” and “environment” showed statistically significant effects (p = 0.004) regarding the participants’ operating time of Task 2 (see Figure 5).
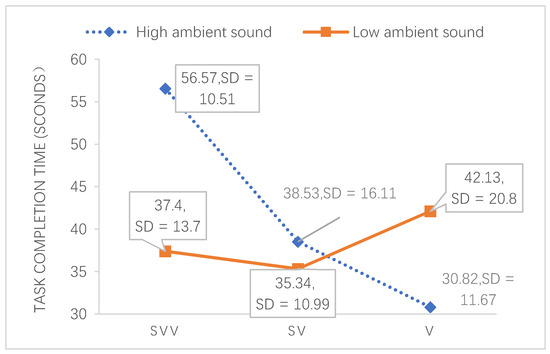
Figure 5.
The interaction diagram between “notification modality” and “environment” regarding the participants’ operating time of Task 2.
According to Figure 5, the task completion time of E to S showed that in a high ambient sound environment, the participant takes more time to complete the task with the notification modalities of SVV and SV than in a low ambient sound environment. Nonetheless, participants encountering the notification modality of V spent less time in the high ambient sound environment than in the low ambient sound environment.
4.1.3. Total Completion Time
For an overview of the participants’ task performance, the data of the one round total (i.e., from S to E to S) were analyzed. The results indicated that the main effect of the notification modality showed a significant difference (p = 0.014). The results from a subsequent Post Hoc comparison (LSD) showed that SV (M = 77.79) and SVV (M = 96.60) showed a significant difference (p = 0.026). V (M = 73.84) and SVV also showed a significant difference (p = 0.006). No significant difference was found between SV and V (p = 0.63). In addition, there existed no significant difference in the main effect of the environment (p = 0.32). The interaction effects between the two variables of “notification modality” and “environment” showed statistically significant effects (p = 0.004) regarding the participants’ operating time of one round total (see Figure 6).
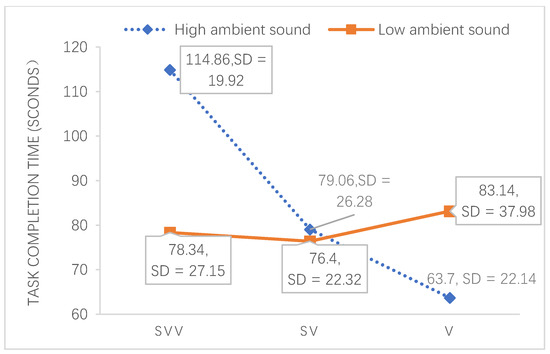
Figure 6.
The interaction diagram between “notification modality” and “environment” regarding the participants’ operating time of one round total.
From Figure 6, the result of one round total (i.e., S to E to S) showed consistency with Task 2 from E to S. Overall, the participants encountering the notification modalities of SVV and SV in the high ambient sound environment obviously spent more time completing the task than they spent in the low ambient sound environment. Conversely, the participants encountering the V notification modality showed significantly better task completion time performance in the high ambient sound environment.
In addition, the task completion time of “S to E” and “E to S” was also compared by using paired sample t-tests. The results are shown in Table 3. There was a significant difference between the “S to E” and “E to S” (p = 0.01). The participants’ task completion time indicated that “S to E” (M = 42.45) was greater than “E to S” (M = 40.24).
Table 3.
The result of the paired sample t-test of the task completion time “from S to E” and “from E to S”..
4.1.4. Discussion of the Task Completion Time
The above-mentioned results indicated that the participant who experienced the SVV notification modality spent more time than others. The results are consistent with the study by Martino and Marks [13]. In the cross-dimensional interaction, users tend to have the phenomenon of selective attention, especially choosing between auditory and visual channels. The ambient sound affected the participants’ selective attention to the notification modality, thus explaining the different task times. The synesthesia notification (SVV) showed the longest task completion time among the three notification modalities. This phenomenon can be explained by the central capacity theory, which suggests that human attention is limited [28,29]. When multiple stimuli are presented in the context, there can be too much information, and too much stimulus distracts participants. This may also affect their task performance. Combined with the semi-structured interviews with the participants after the experiment, we also learned that when they returned from direction E to S, they could determine the direction of the route more efficiently. This is because they had already had previous experience from S to E. Therefore, they showed greater efficiency from E to S. It is possible that their experience and memory might reduce the task completion time when returning to the S point from the E point.
4.2. Error Rate
During the experimental process, participants’ task error rates were also calculated when they traveled through the maze. The error rate was counted based on the number of notifications when the moving point deviated one pixel from the correct route. Table 4 illustrates the results generated from the two-way ANOVA of the comparison of error rate pertinent to the notification modality and the environment. The results indicated that the main effect of the notification modality showed no significant difference (p = 0.56). The main effect of the environment also showed no significant difference (p = 0.64). Nonetheless, the interaction effect between the two variables of “notification modality” and “environment” showed a statistically significant difference (p = 0.02). Figure 7 shows the interaction effects between “notification modality” and “environment” regarding the error rate.
Table 4.
The result of two-way ANOVA of the error rate.
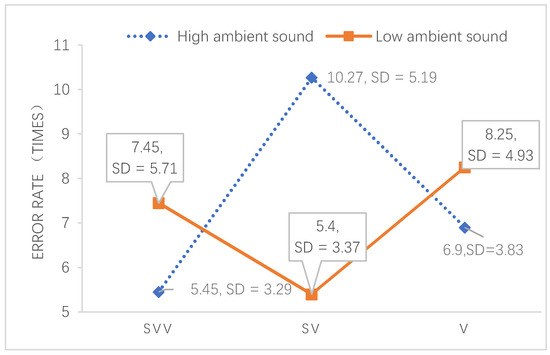
Figure 7.
The interaction diagram between “notification modality” and “environment” regarding the error rate.
In the high ambient sound environment, the participants who encountered the SV notification modality had more errors than those who used SVV and V. Conversely, in the low ambient sound environment, participants who experienced the SV notification modality had fewer errors than those who used SVV and V.
In the semi-structured interviews after the experiment, participants thought they were distracted by the high ambient sounds, and they tended to ignore the number of errors that occurred. They paid attention to completing the task as quickly as possible. Compared with the notifications of SVV and V, the SV modality without tactile cues could be easily ignored because of distraction by high ambient sounds. That is, participants who experienced SV often did not immediately realize the occurrence of errors. Sometimes they needed to experience three or more notifications to realize that an error had just occurred. At this time, we observed that the frequency of the participant’s hand tapping greatly increased. Thus, the SV might result in more errors in a high ambient sound environment. On the contrary, in the low ambient sound environment, the participants’ attention was more concentrated on the visual part of the mobile interface. Participants were distracted by the tactile cues of the SVV modality and tended to ignore the V modality, so the participants might perceive the SV modality more quickly, thereby avoiding more errors.
4.3. Correlation Analysis
To understand further whether each group of the participants’ task completion time and error rate had any correlation, the Pearson correlation coefficient was conducted to help investigate the question. The count of error rates was divided into two parts, i.e., “from S to E” and “from E to S” in order to correspond with the two wayfinding tasks (tasks have two directions, S to E and E to S, and the operation time and error number of each direction are correspondingly analyzed for correlation). The results of the correlation analysis are shown in Table 5.
Table 5.
The Pearson product–moment correlation analysis of task completion time and error rate regarding each group.
The results show that for group 1, there existed a strong positive correlation between the task completion time and error rate in “Task 1 from S to E” (r = 0.676, p = 0.032). This means that in the group of participants who experienced the notification of SVV in a high ambient sound environment when conducting Task 1 from S to E, the more mistakes they made, the longer the completion time. In addition, there is also a strong positive correlation between the task completion time and error rate in “Task 1 from S to E” (r = 0.651, p = 0.041) in group 3. This means that for participants who experienced SV in high ambient sounds, the more task operation errors, the longer the completion time. It shows consistency with group 1. This may be caused by the interference of environmental noise and visual shaking. There is no significant correlation between task completion time and the error rate of other groups.
However, there was no significant correlation between task completion time and error rate in terms of Task 2 from E to S and the one round total. The participants indicated that they would conduct Task 1 from S to E more carefully without experience to avoid the occurrence of notifications. Nonetheless, when they conducted Task 2 from E to S, their previous experience made them realize that the notifications would help them find the correct route faster; thus, the participants clicked on the screen faster without fear of making errors. Therefore, the significant correlation between error rate and operation time is only shown in Task 1 from S to E. The fewer errors might result in faster task completion time.
4.4. The Result of the System Usability Scale (SUS)
After the experiment, the participants were also required to complete the system usability scale (SUS). It consists of 10 questions and the total score is 100 points. Each participant’s SUS score was calculated. A score above 68 points is considered to be the average, and any value below 68 points is considered to be below the average. Table 6 illustrates the result of two-way ANOVA pertinent to the SUS scores generated by each participant.
Table 6.
The results of two-way ANOVA of the system usability scale (SUS).
The main effect of notification modality showed no significant difference (p = 0.573), and the participants considered that the different notification modality would not affect the usability of the maze game. Nonetheless, the main effect of the environment showed a significant difference (p = 0.032). The mean value indicated that those participants who played the maze game in the low ambient sound environment (M = 83.86) had higher SUS scores (i.e., better maze usability) than those who played in the high ambient sound environment (M = 78.03). In addition, the mean values of SUS scores in both low and high ambient sound environments were above 68. Therefore, the participants believed that the maze interface seemed to possess good usability regardless of the type of environment. The interaction effects between the two variables of “notification modality” and “environment” showed no statistically significant effect regarding the SUS (p = 0.599).
The above results indicate that ambient sound may influence participants’ judgments on maze usability. Participants tend to give a rating of lower scores in a higher ambient sound environment. Previous research has demonstrated that the ambient sound may influence specific user emotions, such as social presence and perceived safety in a public place [6]. It can also be used as an environmental cue that can demonstrate effects on individuals’ mood, perceptions, and behaviors [16]. The above-mentioned studies show similar results to those of our study. The effect may cause the user to show different viewpoints in their subjective feelings regarding the maze usability [30].
4.5. Subjective Evaluations
This study also investigated participants’ subjective feelings regarding this maze game. A 7-point Likert scale was used to help create questionnaires for this purpose. i.e., satisfaction with the notification (from 1, least satisfied, to 7, most satisfied), the obviousness of the notification (from 1, least obvious, to 7, most obvious), and suitability (from 1, least suitable, to 7, most suitable).
4.5.1. Satisfaction
The first question was to investigate the participants’ subjective feelings of satisfaction after they conducted the assigned task. Participants were required to rate the notification modality, ranging from 1, the least satisfied, to 7, the most satisfied. The higher the score, the more satisfied the participants were with the notification modality. The results are illustrated in Table 7.
Table 7.
The results of two-way ANOVA of satisfaction.
Table 7 indicates that the main effect of the notification modality showed a significant difference (p = 0.02 < 0.05). The result of the post hoc comparison indicated that the SV notification modality (M = 4.28) and SVV (M = 3.18) showed no significant difference (p = 0.16). The SV notification modality also showed no significant difference from V (p = 0.73). However, the SVV and V notification modalities (M = 4.73) showed a significant difference (p = 0.02). Participants were most satisfied with the V notification modality and least satisfied with the SVV. That is, the mean value of SVV is less than the medium of 4, which means that the participants were not satisfied with SVV. The interaction effects between the two variables of “notification modality” and “environment” showed no statistically significant effect (p = 0.68) regarding satisfaction.
4.5.2. Obviousness
Participants’ subjective evaluations pertaining to obviousness required them to assess whether the notification modalities were obvious in the environment. Participants in each group rated the notification modality they experienced, from 1, the least obvious, to 7, the most obvious. The higher the score, the more obvious the notification.
Table 8 illustrates the results generated from the two-way ANOVA. The main effect of notification modality showed a significant difference (p = 0.001). The results from a subsequent post hoc comparison (LSD) indicated that the SVV notification modality (M = 6.40) and SV (M = 6.47) showed no significant difference (p = 0.98). The V notification modality (M = 5.39) and SV modality had a significant difference (p = 0.001). There also existed a significant difference between the V and SVV notification modalities (p = 0.002). The participants considered that V was the least obvious tool as a notification modality.
Table 8.
The results of two-way ANOVA of obviousness.
The main effect of the environment also showed a significant difference (F = 4.66, p = 0.03 < 0.05). The participants considered that the notification that occurs in a low ambient sound environment (M = 6.36, Sd = 0.89) is more obvious than when it occurs in a high ambient sound environment (M = 5.78, Sd = 1.51). The mean values of these two notification modalities are all higher than the medium of 4, which means that they were both obvious to the participants.
The interaction effects between the two variables of “notification modality” and “environment” showed a statistically significant effect (p = 0.01) regarding obviousness. Figure 8 indicates that in the low ambient sound environment, participants who experienced the SVV and V modalities gave higher scores for obviousness than those who experienced the SV. That is, the notification modalities of SVV and V are more obvious than SV in a low ambient sound environment. On the contrary, in a high ambient sound environment, participants who experienced the SV modality gave a higher score for obviousness than those who experienced the SVV and V modalities. That is, the notification modality of SV is more obvious than SVV and V. The V notification modality was the least obvious of the three notification modalities, regardless of whether the ambient sound was high or low.
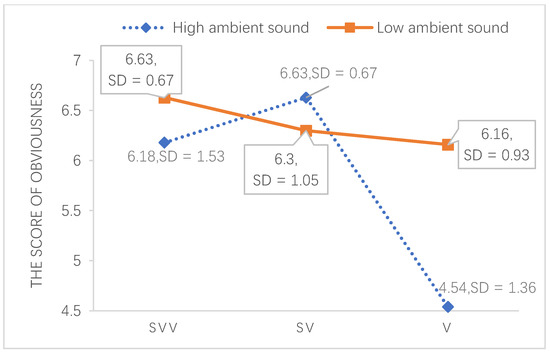
Figure 8.
The interaction diagram of the obviousness.
In addition, the results also show that the environmental ambient sounds were more likely to affect the tactile modality. The participants might not have had a strong sense of synesthesia in the high ambient sound environment because they may have ignored the vibration. This result is consistent with the findings generated by Komninos et al. [14]. Participants’ perceptibility of notifications can be strongly affected by the ambient sound in an environment.
4.5.3. Suitability
This question required participants to assess the degree of suitability between the notification modality and the environment, from 1, least suitable, to 7, most suitable. The higher the score, the more suitable the notification and the environment.
Table 9 illustrates the results generated from the two-way ANOVA. The main effect of notification modality showed a significant difference (p = 0.04). The results from a subsequent post hoc comparison (LSD) indicated that the SVV (M = 4.50) and SV modality (M = 5.57) showed a significant difference (p = 0.04), SVV and V (M = 5.73) also had a significant difference (p = 0.01). No significant difference was found between V and SV (p = 0.76). The main effect of the environment showed no significant difference (F = 0.03, p = 0.84 > 0.05). The interaction effects between the two variables of “notification modality” and “environment” showed no statistically significant effect (p = 0.18) regarding the suitability.
Table 9.
The results of two-way ANOVA of suitability.
This result indicates that participants consider that the SVV modality was the least suitable notification for the environment, and it could be intrusive for participants, regardless of the ambient sound level. The notification modality also affected the degree of suitability of the notification within the environment, but the environmental ambient sound did not. In this study, the single notification modality could be more integrated within the environment than the synesthesia modality, and participants considered that the synesthesia notification (i.e., SVV) was least suitable for the environment.
5. Discussions
5.1. The Impact of Notification Modality
The results generated from this study have clear implications for the design of notification modalities in different ambient sound environments. The previous hypotheses were verified through the experiment. The experimental results show that the notification modalities may affect participants’ task completion time. That is, participants who experienced the SVV notification modality took a longer task completion time than those who used the other two, which means that the notification modality of synesthesia may affect users’ task reaction time. In addition, the participants’ subjective evaluation of satisfaction with synesthesia notification does not look optimistic. They considered that although the notification of synesthesia (i.e., SVV) can be obvious and perceptible, they are not as integrated within the ambient sound as the other two modalities (i.e., SV and V). Due to the fact that the sympathetic notification can be triggered to have multiple dimensions at the same time, the multiple-stimulus may bring more perceptibility to the participants. This result is consistent with Martino and Marks [13], who argued that the audition and vision in a cross-dimensional interaction can interfere with the participants. The strength of the perceptibility of notification does not determine the speed of the users’ reaction time; instead, too many perceptible stimuli may interfere with their decisions. This view is based on Kahneman (1973), who suggests that when multiple stimuli are presented in context, the humans’ limited attention allows them to process only part of the information [28,29].
5.2. The Impact of Ambient Sound
The experiments conducted in this study also confirm the impact of ambient sound on notification interaction. A significant interaction was found between the environment and notification modality. This is mainly reflected in the SVV and V modalities. In the high ambient sound environment, the SVV modality obviously takes more time than in the low ambient sound environment. Conversely, the V modality shows significantly faster task completion time in the high ambient sound environment. The SVV modality has more perceptibility than the V modality due to the multidimensional nature of synesthesia notification. In an environment with high ambient sound, participants thought that the combination of synesthesia notification (i.e., SVV) and ambient sound would be distracting, so they needed to pay more attention to the interface design and complete the task slowly. The V notification can be minimally disturbing as has been proven in many studies. Hence, it is easier for participants to ignore the perceptibility of V modality in a low ambient sound environment. This result is consistent with the study conducted by Baek, Myung, and Yim [12]. The vibration frequency can be most susceptible to the users in a dynamic state and is much higher than in the static state. The result also shows consistency with the findings of [1,2]. The ambient sound can severely affect participants’ perception of notifications. When the notification is ignored in the experiment, the participant cannot return to the correct path and complete the task immediately. It may therefore result in a longer task completion time.
5.3. The Error Rate Result
In terms of error rate, an interesting phenomenon was observed. That is, in the task from S to E, the participants showed great caution to avoid errors, and they tended to judge the intersection in advance, tapping the screen with a slower frequency to move the blue dot. However, in Task 2 from E to S, they became bold and confident due to previous experience. In order to complete the task as quickly as possible, they relied on memory and intuition without worrying about the occurrence of errors; at this time, they clicked continuously with very fast frequency. It is worth mentioning that there exists a significant and positive low correlation between the task completion time and error rate from “S to E”. This indicates that the fewer errors the participants make from “S to E”, the shorter the task completion time. In addition, there was a significant interaction effect between “notification modality” and “environment” regarding the error rate. In the low ambient sound environment, the participants who operated the SV notification modality had more errors than those who used the V and SVV modalities. Conversely, in the high ambient sound environment, participants who experienced the SV notification modality had fewer errors than those who experienced the V and SVV modalities. SV has the highest error rate among the three notification modalities in the high ambient sound environment, but the lowest error rate in the low ambient sound environment. This result is interesting and unexpected. The SV notification modality visually presents a sense of vibration, but it does not provide actual tactile stimuli as SVV does. Participants stated that they would pay more attention to the visual interference of SV, especially in the high ambient sound environment. Participants were more likely to be disturbed and might cause errors. However, in the low ambient sound environment, the SV notification modality was easier to perceive than V, but it was less interfered with than SVV.
5.4. Impact on Subjective Evaluations
Moreover, different notification modalities and environments might have a significant impact on the participants’ subjective evaluation regarding the SUS, satisfaction, obviousness, and suitability. Participants considered that the V notification modality was the least obvious. The SVV and SV notification modalities were the most obvious, and the user interface affected the obviousness of the notification. The shape of the interface is one of the important factors of the emotional response pertinent to interface design, Asymmetric interface design is more likely to cause emotional arousal than the symmetric interface design, but it has an opposite effect on emotional valence [31]. The interface design in our experiment adopts a symmetrical quadrilateral, which can help attract user attention and bring positive emotional valence. They also considered that SVV is the most difficult of these three notification modalities to be integrated into the environment, regardless of the level of ambient sound. Compared with the other two modalities, the participants did not enjoy the experience brought by SVV. This result indicates that synesthesia notification might not be ideal for use in notifications for mobile interaction. The ambient sound also affected the participants’ experience. The SUS scores were significantly higher for the low ambient sound environment than for the high ambient sound environment. Participants felt that conducting tasks with a low ambient sound could lead to better task performance, and the notification would be more obvious and perceptible in a low ambient sound environment than in a high ambient sound environment.
5.5. Limitations
This research study provides several contributions to the design of mobile notifications. The multi-dimensional feature of notifications makes it possible to simulate synesthesia, and the experimental hypotheses were all supported. We argue that synesthesia notifications could be feasible for mobile notifications because they are more easily perceived by the user. A good user experience of mobile notifications, however, requires the adoption of a suitable notification modality in an appropriate environment. Although the synesthesia notification of SVV has a more perceptual advantage in a high ambient sound environment that helps participants avoid error occurrence, participants do not seem to enjoy SVV. Therefore, synesthesia notifications may not be suitable for use in a noisy environment, and so should be applied with caution.
This study also has some limitations that should be noted. We were not able to program mobile notifications to actively trigger outside of the app. When the in-app notification occurs, users may have only one option to respond to the notification and have to re-select the correct path to complete the task. Therefore, there is a lack of research on the response rate of users in terms of notifications. Regarding our future research, we intend to continue exploring the interactive experience brought by a variety of notification modalities.
6. Conclusions
In this study, the impacts of different notification modalities used in low and high ambient sound environments for mobile interaction were investigated. First, we designed a synesthesia notification using the multi-dimensional features of mobile notification, in order to bring a synesthesia stimulating experience to users in the interaction. Then, we experimentally tested the perceptibility of the different notifications by asking users to conduct a maze task. Subjective evaluations were performed to help compare the different notification modalities. The generated results indicated the following:
- Different notification modalities showed significant differences in task completion time, but no significant difference was found regarding the environment. A significant interaction effect was found between the environment and the notification modality regarding the task completion time;
- The synesthesia notification (i.e., SVV) might increase users’ task completion time;
- The error rate is positively related to the task completion time in Task 1 (S to E);
- In the low ambient sound environment, the participants who used the SV notification modality made more errors than those who used V and SVV, but the opposite result was found in the high ambient sound environment;
- The environmental sound level might impact the participants’ judgment of the results regarding SUS and obviousness.
In the future, we also plan to pay more attention to cross-media notification feedback, for instance, the situation when an environmental or wearable device triggers a notification at the same time as the mobile phone does. We will continue to explore ways to design appropriate notifications to enhance the user’s experience.
Author Contributions
Conceptualization, M.H. and C.-H.C.; formal analysis, M.H.; investigation, M.H.; methodology, M.H. and C.-H.C.; writing—original draft preparation, M.H.; writing—review and editing, C.-H.C. All authors have read and agreed to the published version of the manuscript.
Funding
The research received no external funding.
Institutional Review Board Statement
Not applicable.
Informed Consent Statement
Informed consent was provided to all participants involved in the study.
Data Availability Statement
Not applicable.
Conflicts of Interest
The authors declare no conflict of interest.
References
- Hoggan, E.; Anwar, S.; Brewster, S.A. Mobile Multi-Actuator Tactile Displays. In International Workshop on Haptic and Audio Interaction Design; Springer: Berlin/Heidelberg, Germany, 2007. [Google Scholar]
- Hwang, J.; Hwang, W. Vibration perception and excitatory direction for haptic devices. J. Intell. Manuf. 2011, 22, 17–27. [Google Scholar] [CrossRef]
- Iqbal, S.T.; Bailey, B.P. Effects of intelligent notification management on users and their tasks. In Proceedings of the SIGCHI Conference on Human Factors in Computing Systems, Florence, Italy, 5–10 April 2008; pp. 93–102. [Google Scholar]
- Czerwinski, M.; Cutrell, E.; Horvitz, E. Instant Messaging and Interruption: Influence of Task Type on Performance. OZCHI 2000 Conf. Proc. 2000, 356, 361–367. [Google Scholar]
- Leiva, L.; Böhmer, M.; Gehring, S.; Krüger, A. Back to the app: The costs of mobile application interruptions. In Proceedings of the 14th International Conference on Human-Computer Interaction with Mobile Devices and Services, San Francisco, CA, USA, 21–24 September 2012. [Google Scholar]
- Saket, B.; Prasojo, C.; Huang, Y.; Zhao, S. Designing an Effective Vibration-Based Notification Interface for Mobile Phones. In Proceedings of the 2013 Conference on Computer Supported Cooperative Work, San Antonio, TX, USA, 23–27 February 2013. [Google Scholar]
- Yao, H.-Y.; Grant, D.; Cruz, M. Perceived vibration strength in mobile devices: The effect of weight and frequency. IEEE Trans. Haptics 2010, 3, 56–62. [Google Scholar]
- Lee, H.P.; Lim, S.P. Comparative studies of perceived vibration strength for commercial mobile phones. Appl. Ergon. 2014, 45, 807–810. [Google Scholar] [CrossRef] [PubMed]
- Williamson, J.; Murray-Smith, R.; Hughes, S. Shoogle: Excitatory Multimodal Interaction on Mobile Devices. In Proceedings of the SIGCHI Conference on Human Factors in Computing Systems, San Jose, CA, USA, 28 April–3 May 2007. [Google Scholar]
- Hansson, R.; Ljungstrand, P.; Redström, J. Subtle and public notification cues for mobile devices. In Proceedings of the International Conference on Ubiquitous Computing; Springer: Berlin/Heidelberg, Germany, 2001; pp. 240–246. [Google Scholar]
- Sayin, E.; Krishna, A.; Ardelet, C.; Decré, G.B.; Goudey, A. “Sound and safe”: The effect of ambient sound on the perceived safety of public spaces. Int. J. Res. Mark. 2015, 32, 343–353. [Google Scholar] [CrossRef]
- Baek, Y.; Myung, R.; Yim, J. Have you ever missed a call while moving?: The optimal vibration frequency for perception in mobile environments. WSEAS Trans. Commun. 2006, 5, 1981–1985. [Google Scholar]
- Martino, G.; Marks, L.E. Cross-modal interaction between vision and touch: The role of synesthetic correspondence. Perception 2000, 29, 745–754. [Google Scholar] [CrossRef] [PubMed]
- Komninos, A.; Besharat, J.; Stefanis, V.; Gogoulou, G.; Garofalakis, J. Assessing the perceptibility of smartphone notifications in smart lighting spaces. J. Ambient Intell. Smart Environ. 2019, 11, 277–297. [Google Scholar] [CrossRef]
- Matviienko, A.; Rauschenberger, M.; Cobus, V.; Timmermann, J.; Fortmann, J.; Löcken, A. Towards new ambient light systems: A close look at existing encodings of ambient light systems. Interact. Des. Archit. 2015, 2015, 10–24. [Google Scholar]
- Yorkston, E. Auxiliary auditory ambitions: Assessing ancillary and ambient sounds. In Sensory Marketing; Routledge: New, NY, USA, 2011; pp. 187–198. [Google Scholar]
- Gallace, A.; Spence, C.J.P. Multisensory synesthetic interactions in the speeded classification of visual size. Psychophysics 2006, 68, 1191–1203. [Google Scholar] [CrossRef] [PubMed]
- Riccò, D.; Belluscio, A.; Guerini, S. Design for the Synesthesia. Audio, Visual and Haptic Correspondences Experimentation. In Proceedings of the 1st International Meeting of Science and Technology of Design, Lisbon, Portugal, 25–26 September 2003. [Google Scholar]
- Konishi, Y.; Hanamitsu, N.; Outram, B.; Minamizawa, K.; Mizuguchi, T.; Sato, A. Synesthesia Suit: The Full Body Immersive Experience. In Proceedings of the ACM SIGGRAPH 2016 VR Village, Anaheim, CA, USA, 24–28 July 2016. [Google Scholar]
- Marks, L.E. On colored-hearing synesthesia: Cross-modal translations of sensory dimensions. Psychol. Bull. 1975, 82, 303. [Google Scholar] [CrossRef] [PubMed]
- Garzonis, S.; Bevan, C.; O’Neill, E. Mobile Service Audio Notifications: Intuitive Semantics and Noises. In Proceedings of the 20th Australasian Conference on Computer-Human Interaction: Designing for Habitus and Habitat, Cairns, QLD, Australia, 8–12 December 2008. [Google Scholar]
- Gaver, W.W. The SonicFinder: An interface that uses auditory icons. Hum. Comput. Interact. 1989, 4, 67–94. [Google Scholar] [CrossRef]
- Kramer, G.J.A.d.-S. An Introduction to Auditory Display. In Auditory Display Sonification, Audification and Auditory Interfaces; Addison-Wesley Publishing Company: Boston, MA, USA, 1994; pp. 1–77. [Google Scholar]
- Walker, B.N.; Kramer, G. Mappings and metaphors in auditory displays: An experimental assessment. ACM Trans. Appl. Percept. TAP 2005, 2, 407–412. [Google Scholar] [CrossRef]
- Garzonis, S.; Jones, S.; Jay, T.; O’Neill, E. Auditory Icon and Earcon Mobile Service Notifications: Intuitiveness, Learnability, Memorability and Preference. In Proceedings of the SIGCHI Conference on Human Factors in Computing Systems, Boston, MA, USA, 4 April 2009. [Google Scholar]
- Fridlund, L.F.; Buváry, G. Safety-Health and Working Conditions; Joint Industrial Safety Council: Stockholm, Sweden, 1987. [Google Scholar]
- Melamed, S.; Luz, J.A.I.R.; Green, M.S. Noise exposure, noise annoyance and their relation to psychological distress, accident and sickness absence among blue-collar workers—The Cordis Study. Isr. J. Med Sci. 1992, 28, 629–635. [Google Scholar]
- Kahneman, D. Attention and Effort; Citeseer: Englewood Cliffs, NJ, USA, 1973; Volume 1063. [Google Scholar]
- Bartram, L.; Ware, C.; Calvert, T. Moving Icons: Detection and Distraction. In Human-Computer Interaction: INTERACT’01: IFIP TC, Proceedings of the 13 International Conference on Human-Computer Interaction, Tokyo, Japan, 9–13 July 2001; IOS Press: Amsterdam, The Netherlands, 2001; p. 145. [Google Scholar]
- Ryu, J.; Jung, J.; Choi, S. Perceived Magnitudes of Vibrations Transmitted through Mobile Device. In Proceedings of the 2008 Symposium on Haptic Interfaces for Virtual Environment and Teleoperator Systems, Reno, NV, USA, 13–14 March 2008. [Google Scholar]
- Wang, J.; Hsu, Y. The Relationship of Symmetry, Complexity, and Shape in Mobile Interface Aesthetics, from an Emotional Perspective—A Case Study of the Smartwatch. Symmetry 2020, 12, 1403. [Google Scholar] [CrossRef]


Publisher’s Note: MDPI stays neutral with regard to jurisdictional claims in published maps and institutional affiliations. |
© 2021 by the authors. Licensee MDPI, Basel, Switzerland. This article is an open access article distributed under the terms and conditions of the Creative Commons Attribution (CC BY) license (http://creativecommons.org/licenses/by/4.0/).