
In Vacuo Dispersion-Like Spectral Lags in Gamma-Ray Bursts

Abstract
:1. Introduction
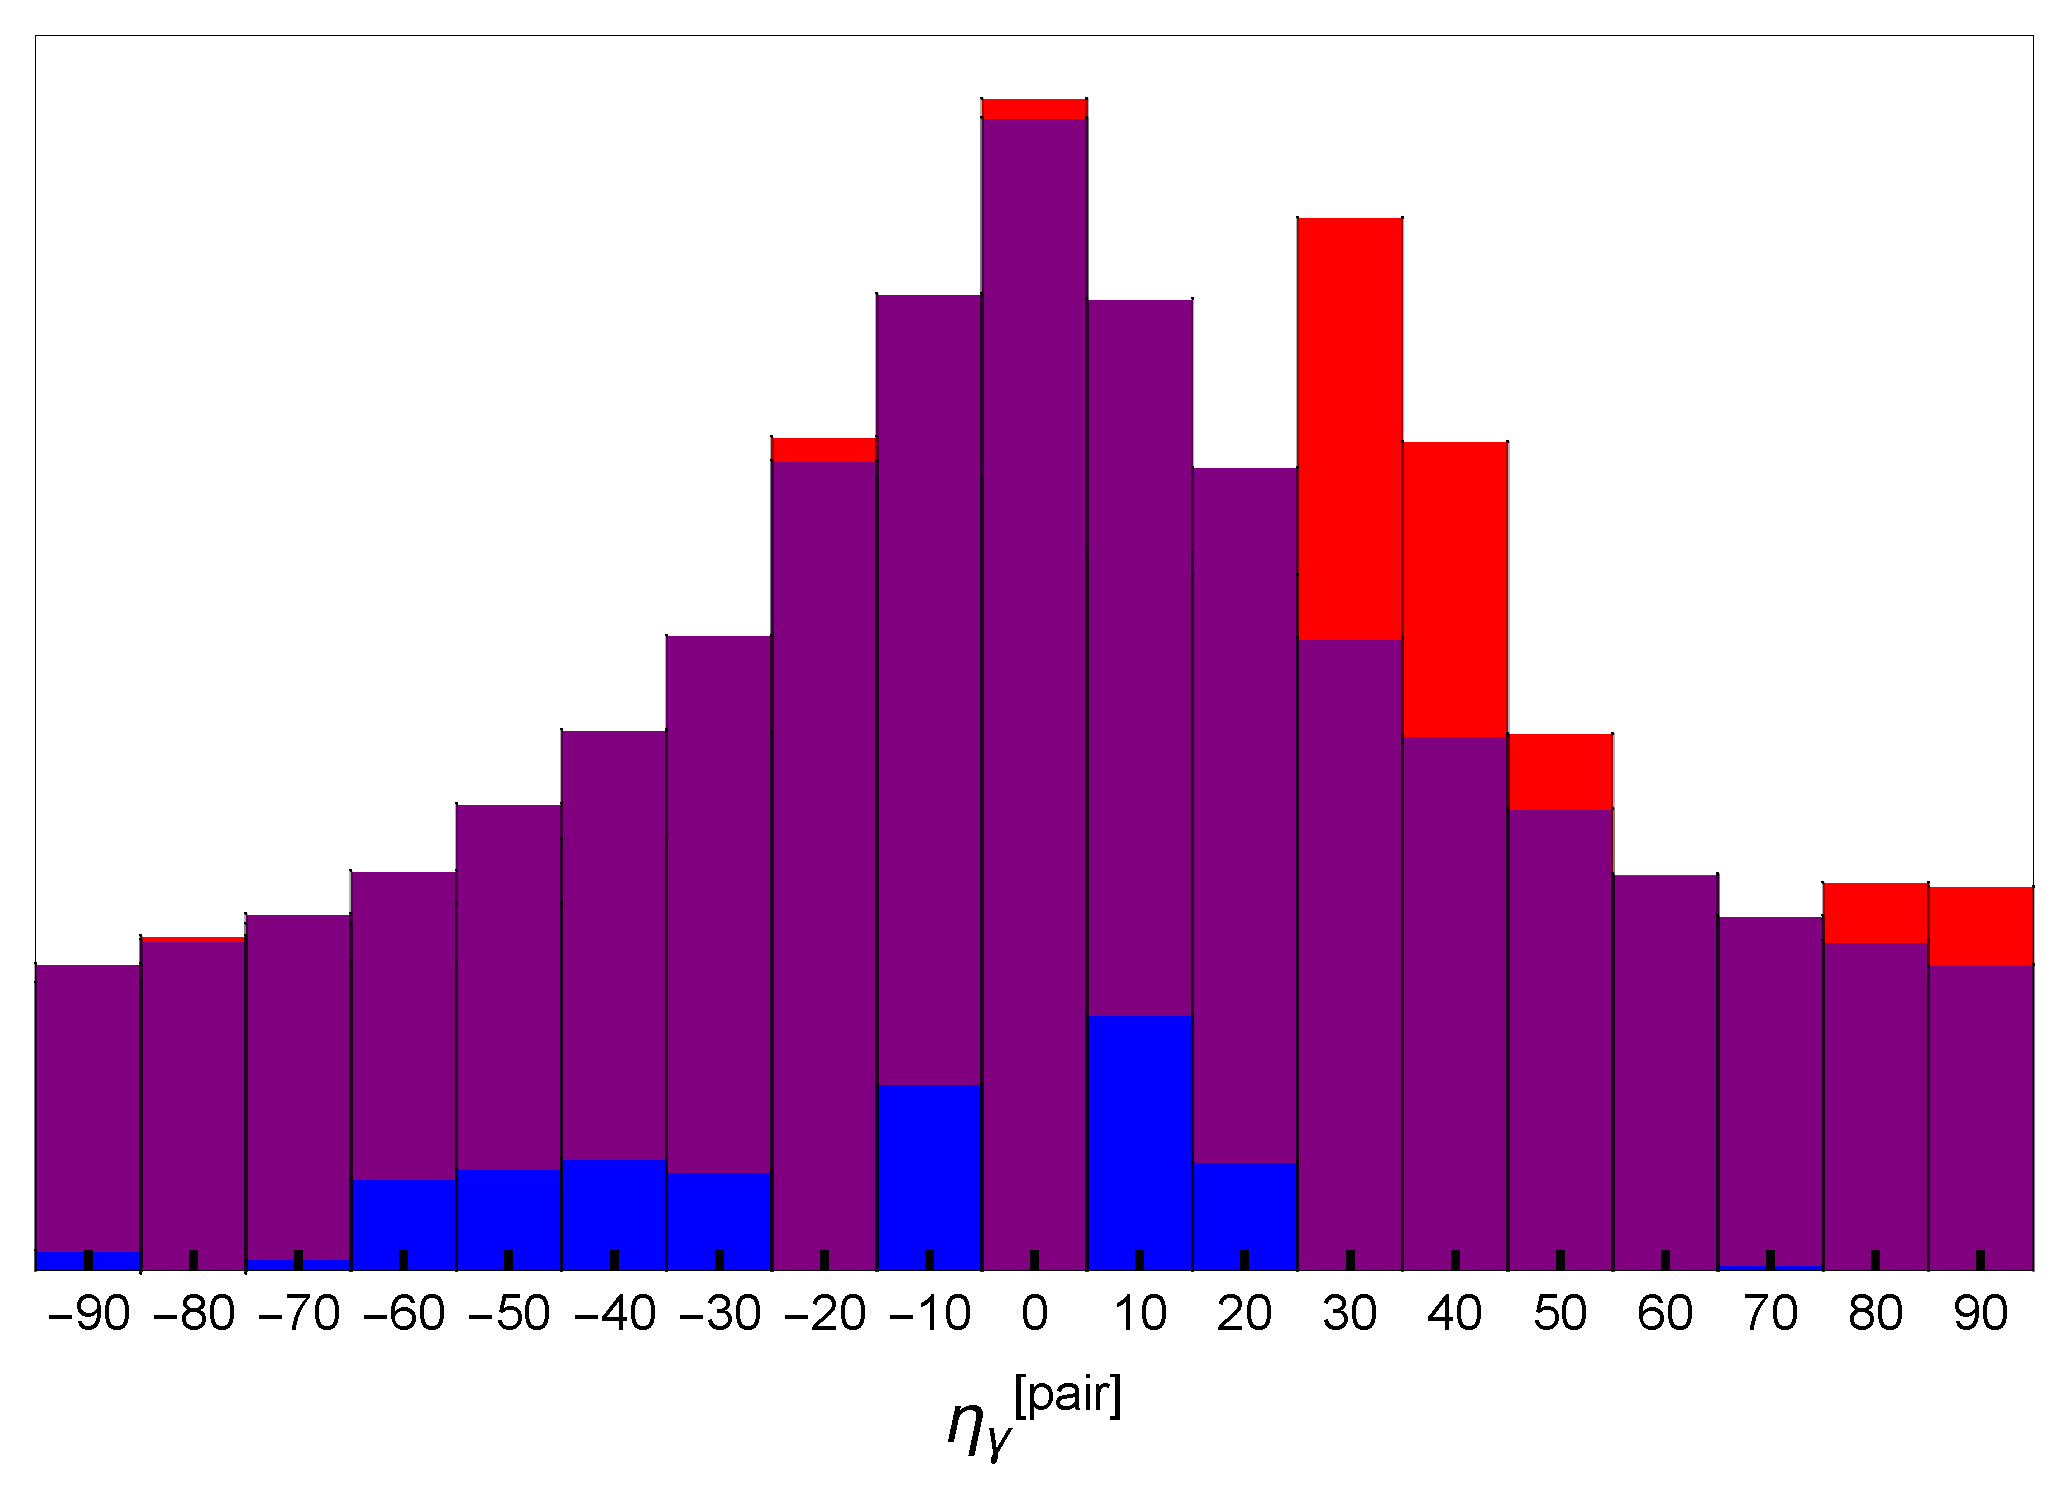
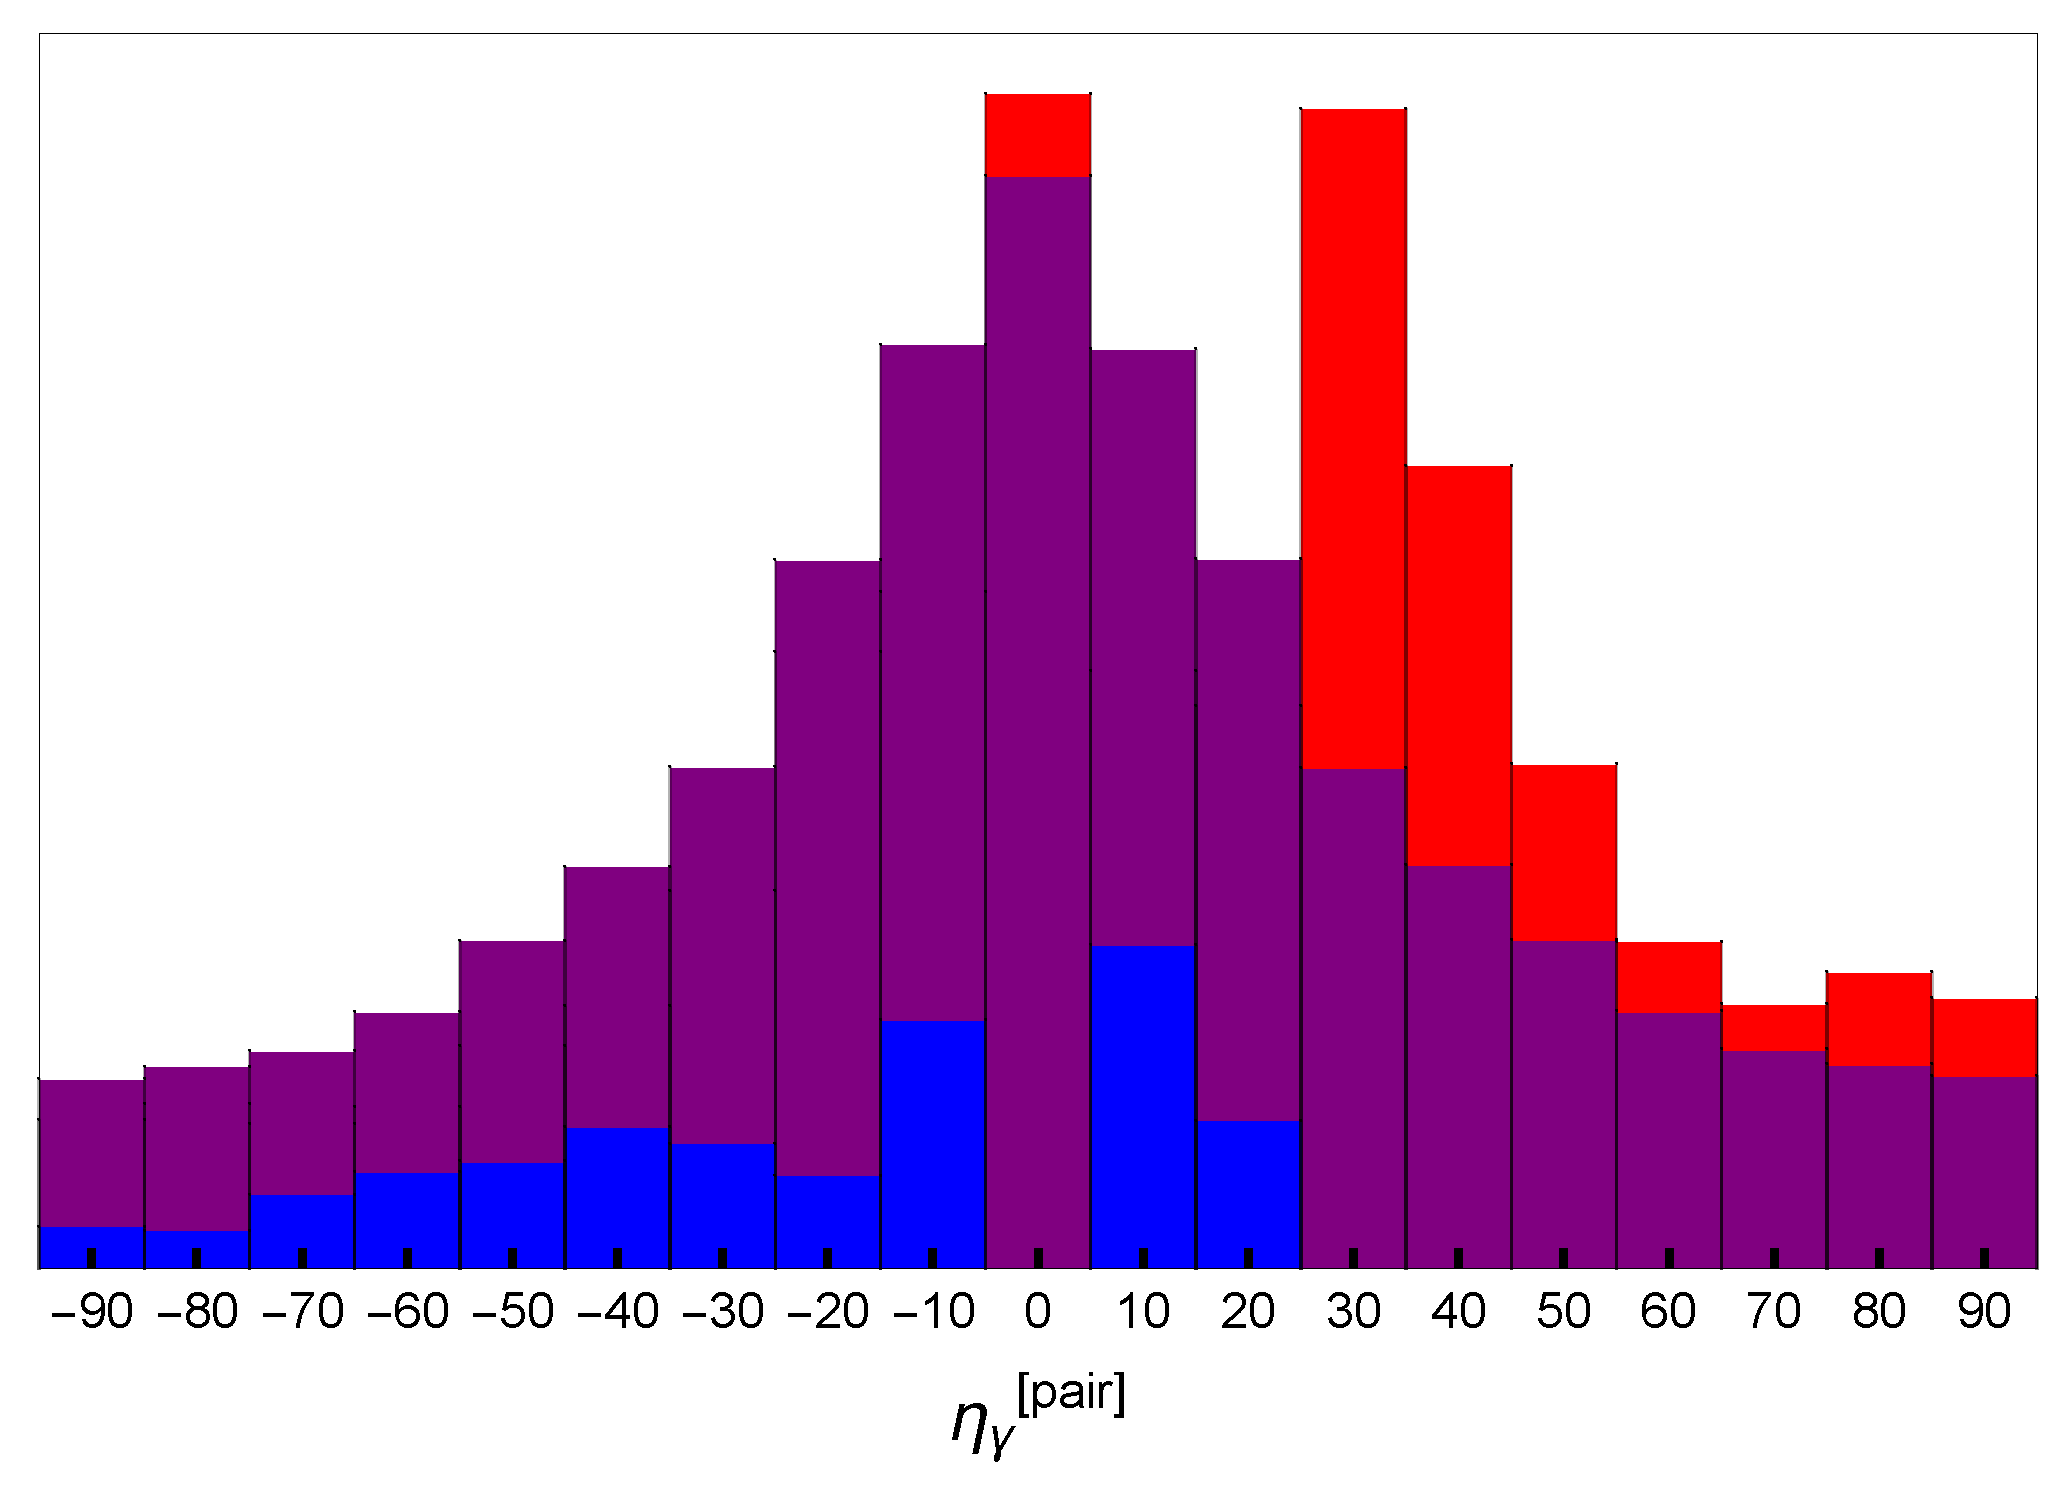
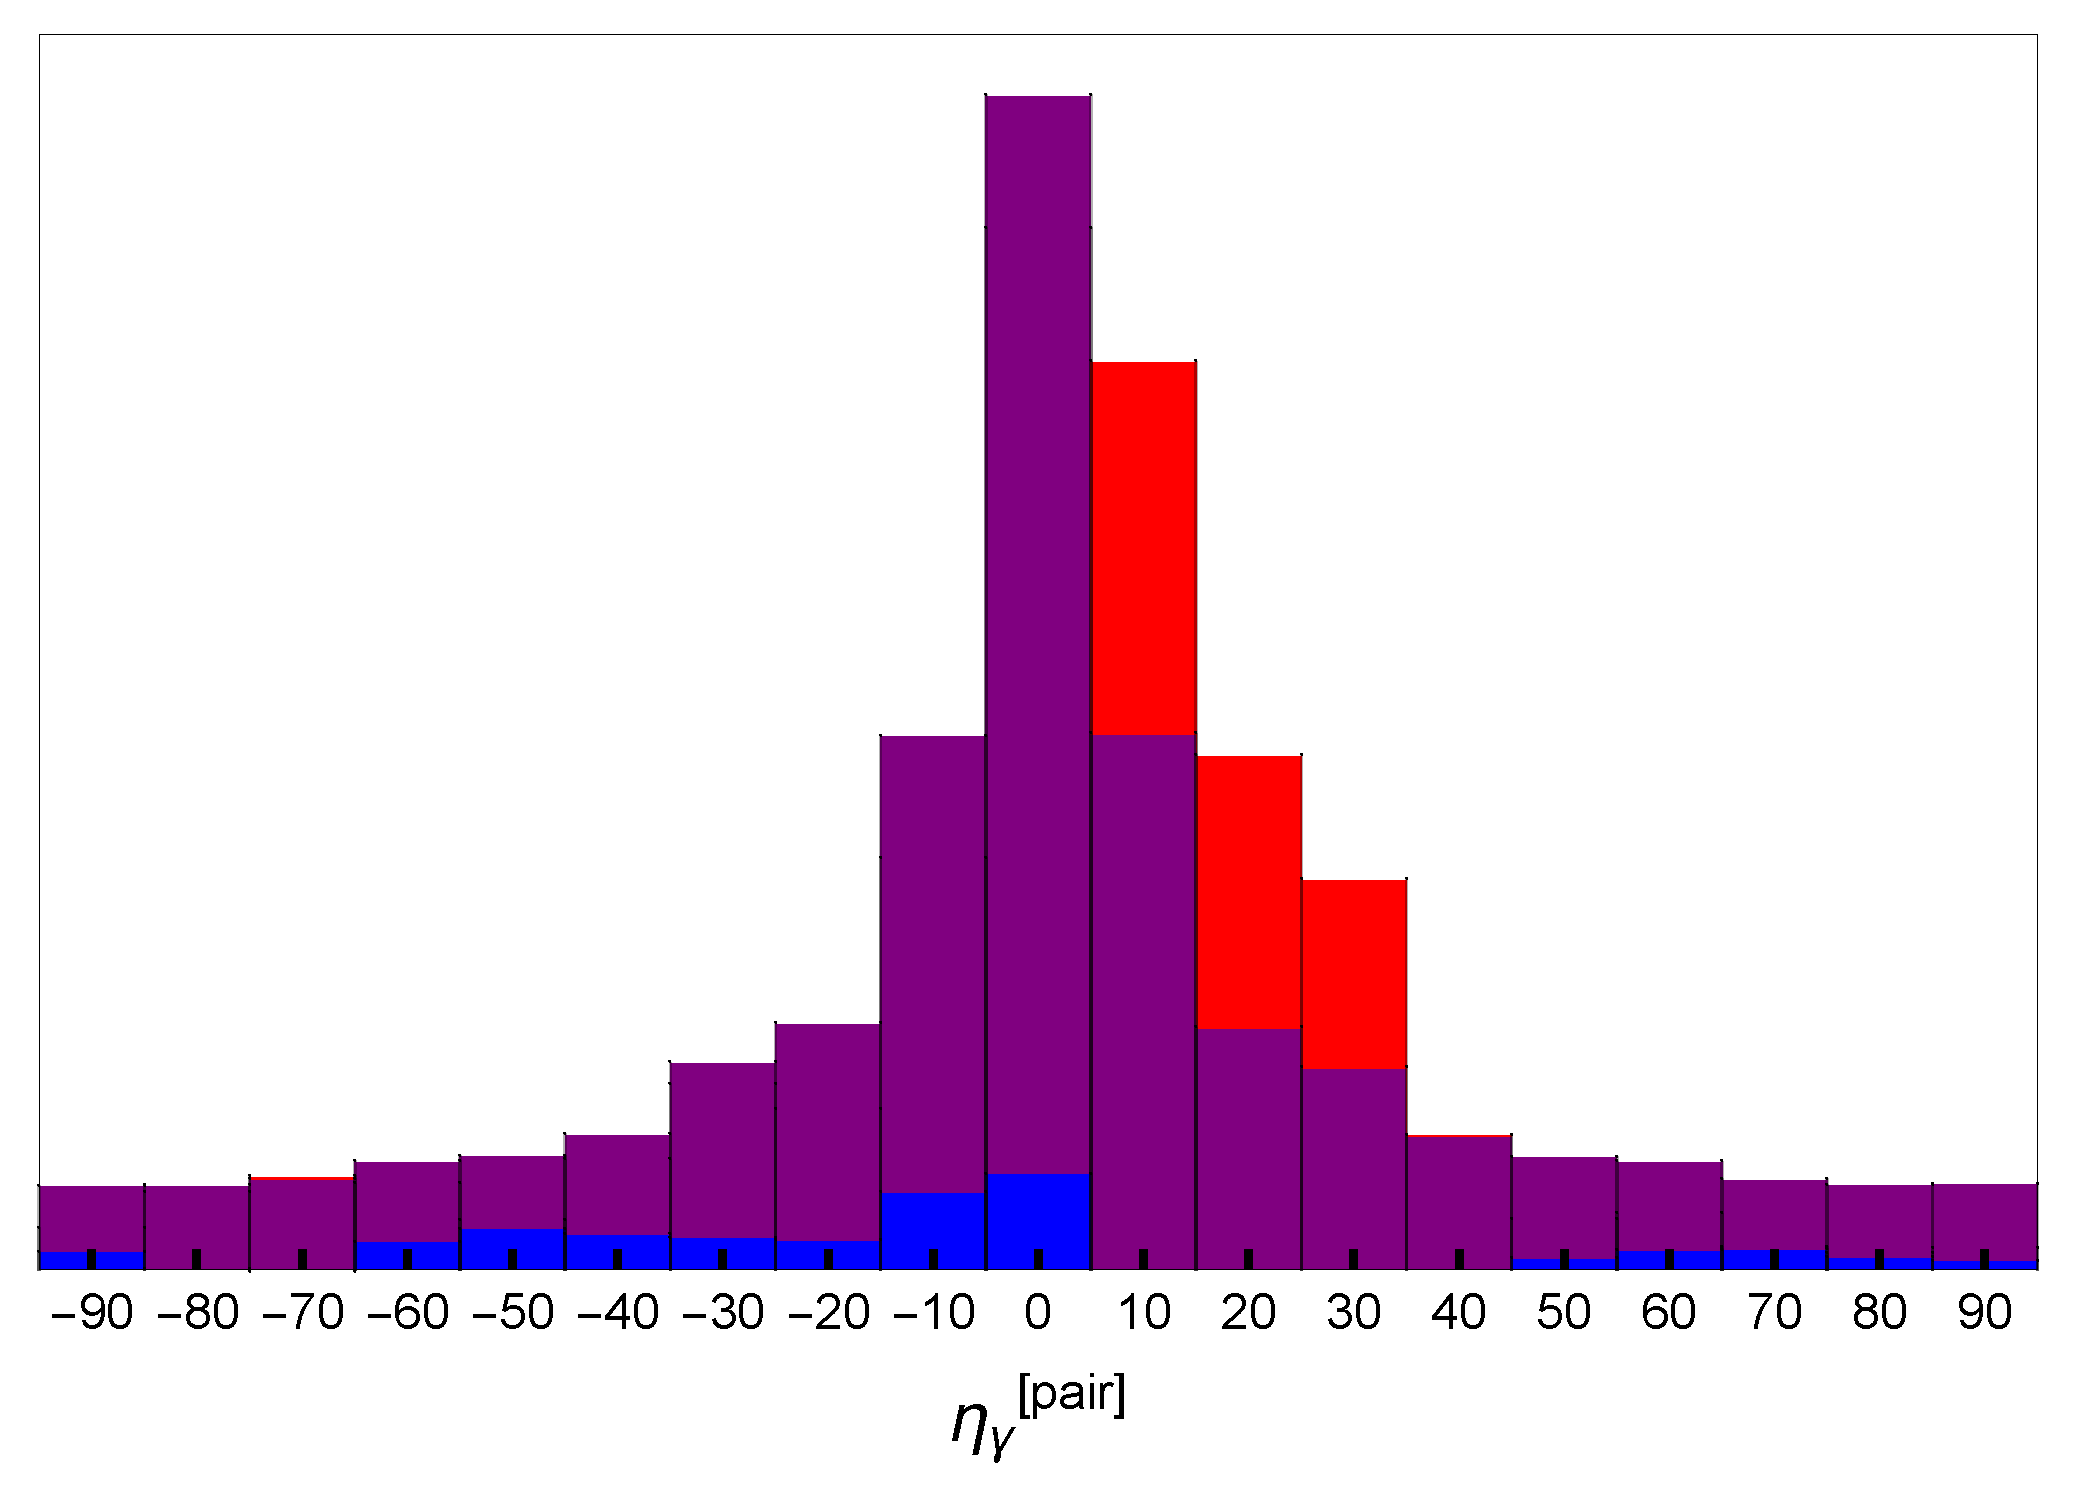
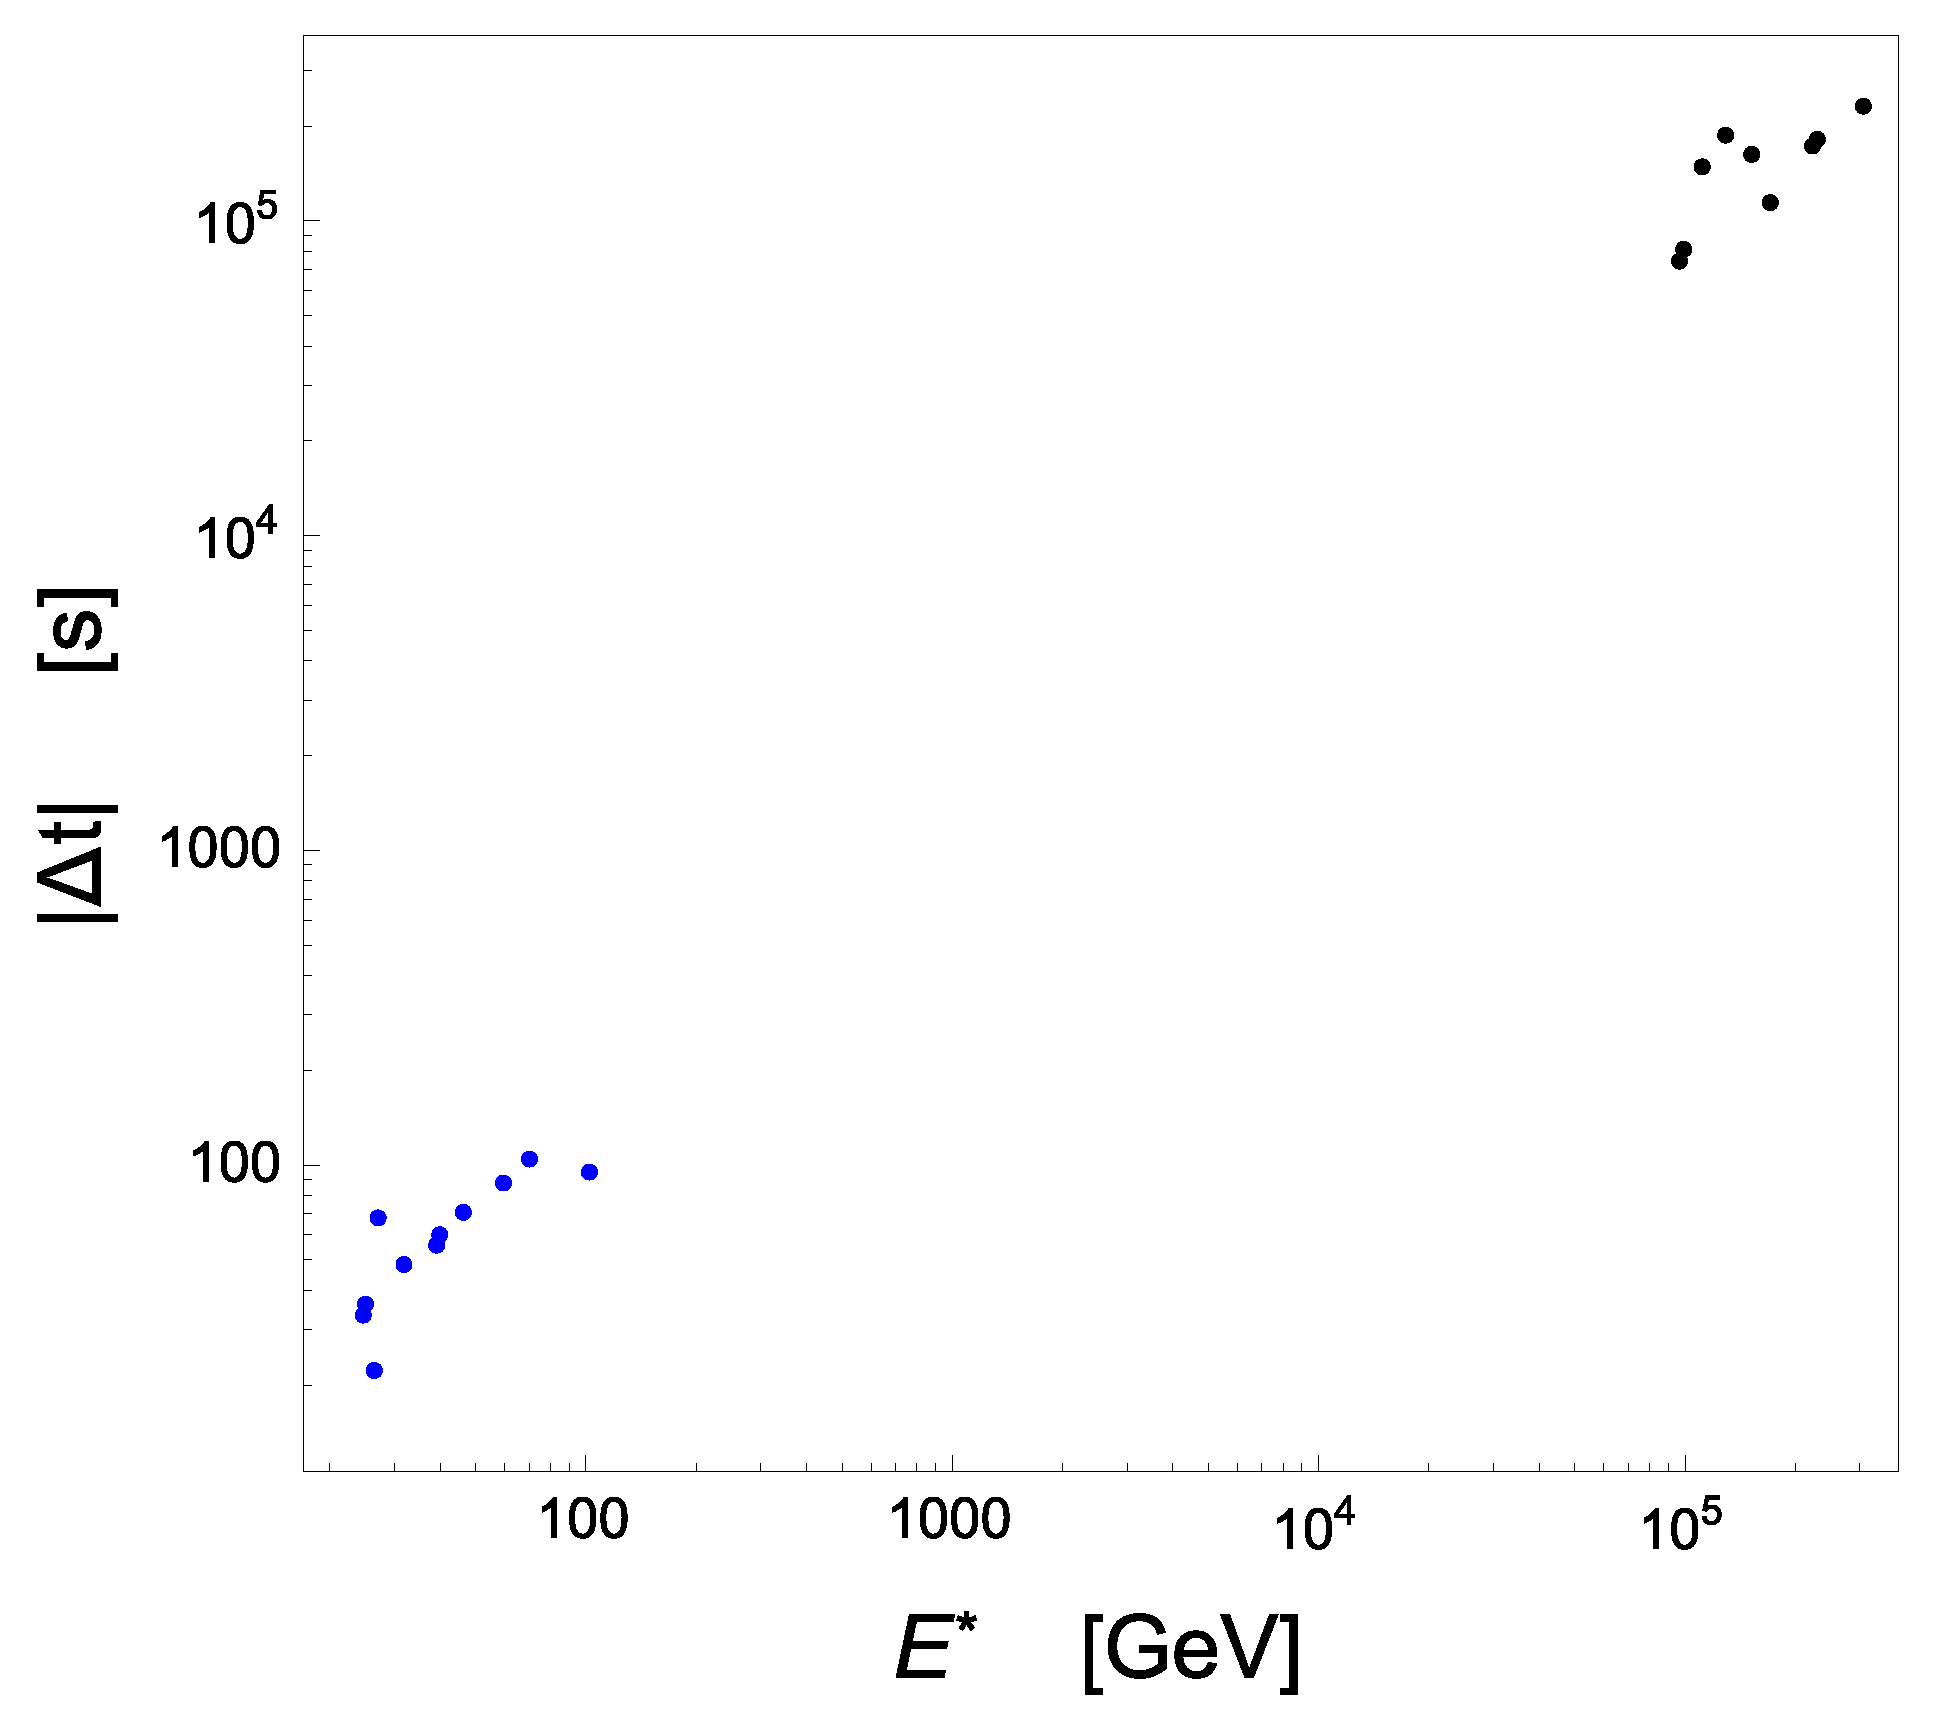
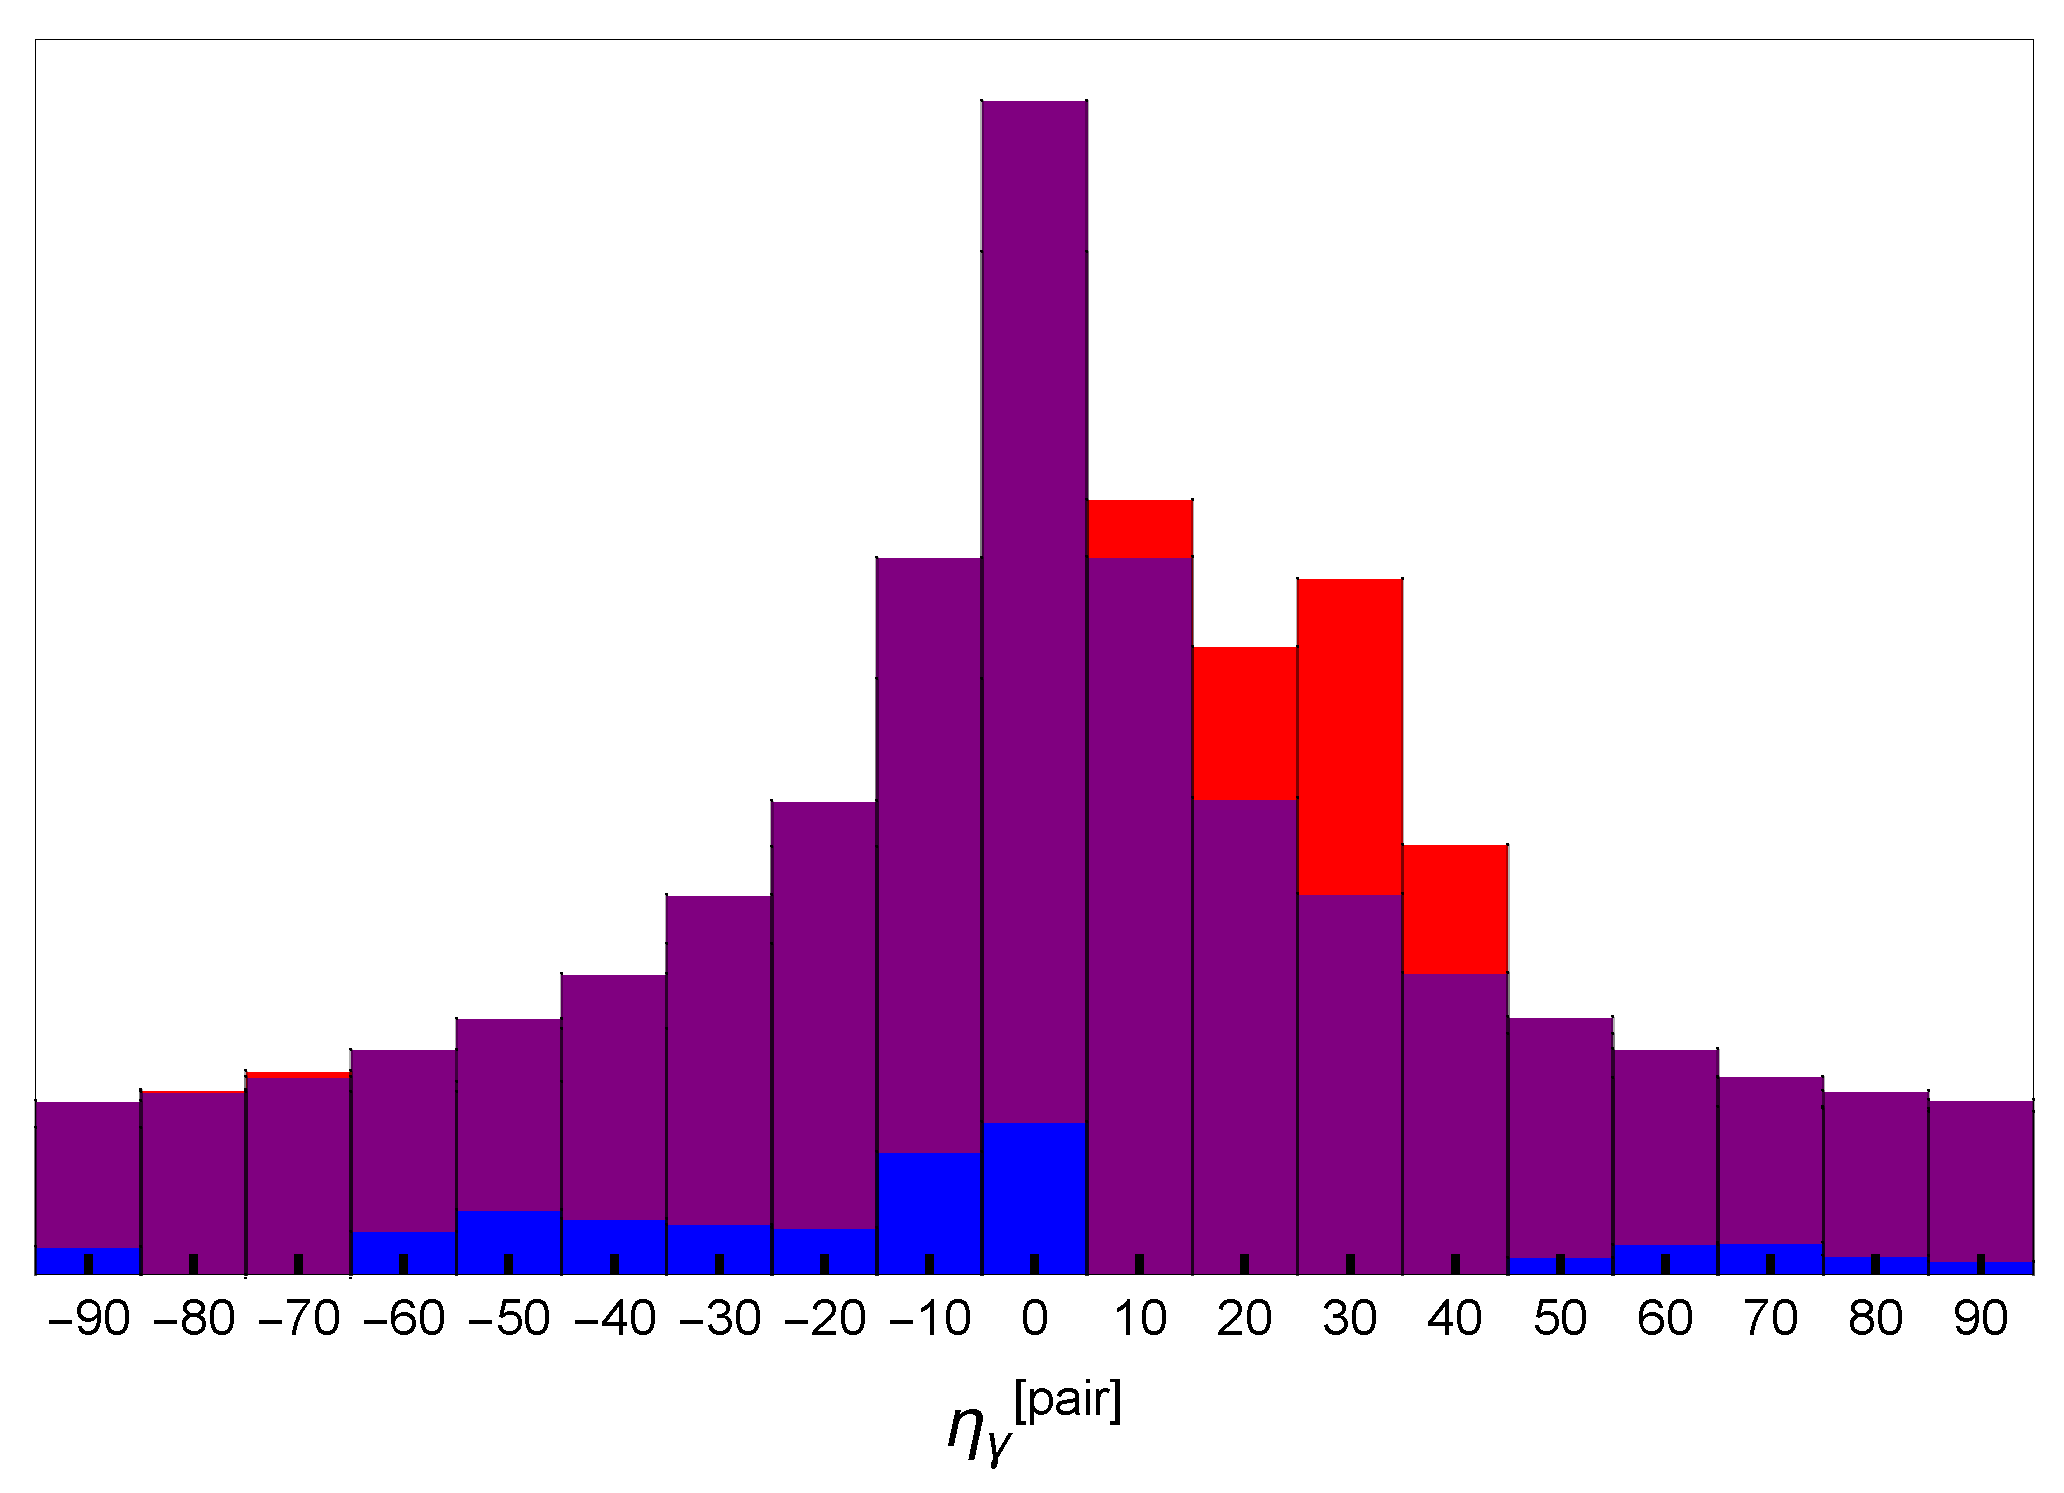
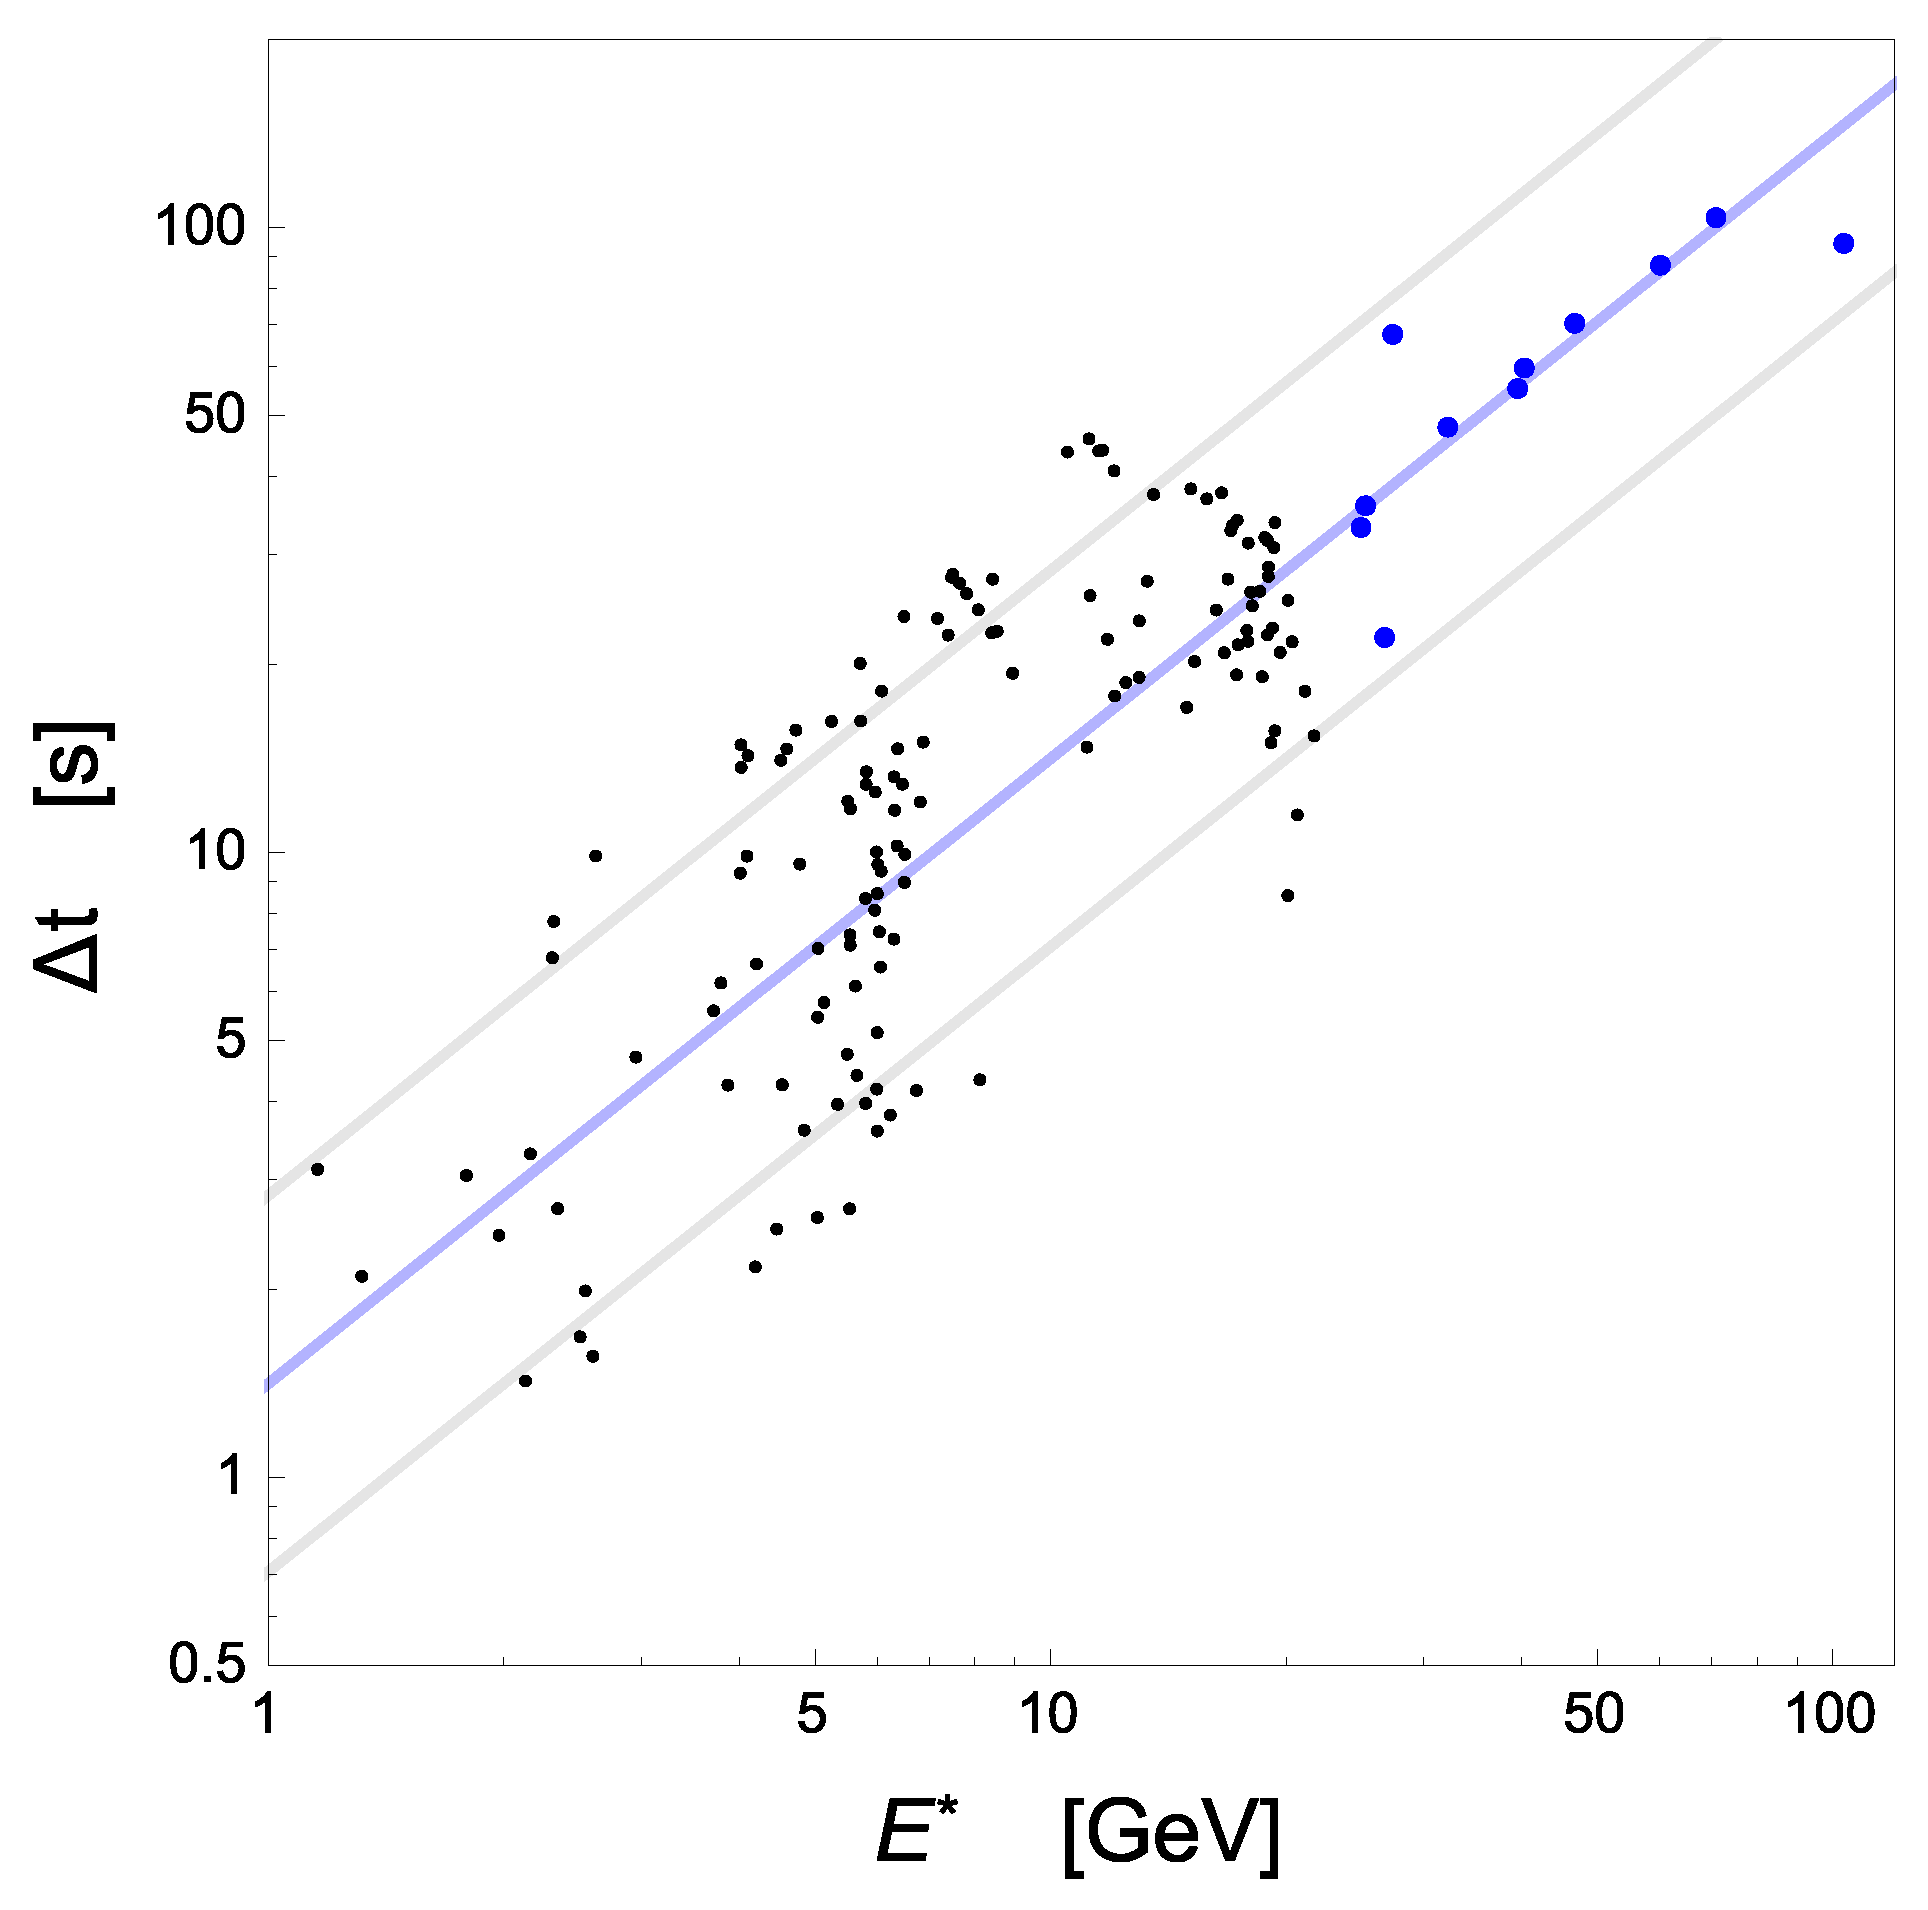
2. Analysis
3. Closing Remarks
Author Contributions
Funding
Institutional Review Board Statement
Informed Consent Statement
Data Availability Statement
Conflicts of Interest
Appendix A
References
- Amelino-Camelia, G. Quantum Spacetime Phenomenology. Living Rev. Relativ. 2013, 16, 5. [Google Scholar] [CrossRef] [PubMed] [Green Version]
- Jacob, U.; Piran, T. Neutrinos from gamma-ray bursts as a tool to explore quantum-gravity-induced Lorentz violation. Nat. Phys. 2007, 3, 87. [Google Scholar] [CrossRef] [Green Version]
- Amelino-Camelia, G.; Smolin, L. Prospects for constraining quantum gravity dispersion with near term observations. Phys. Rev. D 2009, 80, 084017. [Google Scholar] [CrossRef] [Green Version]
- Amelino-Camelia, G.; Ellis, J.; Mavromatos, N.E.; Nanopoulos, D.V.; Sarkar, S. Tests of quantum gravity from observations. Nature 1998, 393, 763. [Google Scholar] [CrossRef] [Green Version]
- Gambini, R.; Pullin, J. Nonstandard Optics from Quantum Space-Time. Phys. Rev. 1999, D59, 124021. [Google Scholar] [CrossRef] [Green Version]
- Alfaro, J.; Morales-Tecotl, H.A.; Urrutia, L.F. Quantum Gravity Corrections to Neutrino Propagation. Phys. Rev. Lett. 2000, 84, 2318. [Google Scholar] [CrossRef] [Green Version]
- Amelino-Camelia, G.; Majid, S. Waves on noncommutative space-time and gamma-ray bursts. Int. J. Mod. Phys. A 2000, 15, 4301. [Google Scholar] [CrossRef]
- Myers, R.C.; Pospelov, M. Ultraviolet modifications of dispersion relations in effective field theory. Phys. Rev. Lett. 2003, 90, 211601. [Google Scholar] [CrossRef] [Green Version]
- Amelino-Camelia, G.; Guetta, D.; Piran, T. Icecube Neutrinos and Lorentz Invariance Violation. Astrophys. J. 2015, 806, 269. [Google Scholar] [CrossRef] [Green Version]
- Stecker, F.W.; Scully, S.T.; Liberati, S.; Mattingly, D. Searching for traces of Planck-scale physics with high energy neutrinos. Phys. Rev. D 2015, 91, 045009. [Google Scholar] [CrossRef] [Green Version]
- Colladay, D.; Kostelecky, V.A. Lorentz-violating extension of the standard model. Phys. Rev. D 1998, 58, 116002. [Google Scholar] [CrossRef] [Green Version]
- Kostelecky, V.A.; Russell, N. Data Tables for Lorentz and CPT Violation. arXiv 2008, arXiv:0801.0287. [Google Scholar]
- Friedman, A.S.; Gerasimov, R.; Leon, D.; Stevens, W.; Tytler, D.; Keating, B.G.; Kislat, F. Improved constraints on anisotropic birefringent Lorentz invariance and CPT violation from broadband optical polarimetry of high redshift galaxies. Phys. Rev. D 2020, 102, 043008. [Google Scholar] [CrossRef]
- Pogosian, L.; Shimon, M.; Mewes, M.; Keating, B. Future CMB constraints on cosmic birefringence and implications for fundamental physics. Phys. Rev. D 2019, 100, 023507. [Google Scholar] [CrossRef] [Green Version]
- Friedman, S.; Leon, D.; Crowley, K.D.; Johnson, D.; Teply, G.; Tytler, D.; Keating, B.G.; Cole, G.M. Constraints on Lorentz invariance and CPT violation using optical photometry and polarimetry of active galaxies BL Lacertae and S5. Phys. Rev. D 2019, 99, 035045. [Google Scholar] [CrossRef] [Green Version]
- Kislat, F. Constraints on Lorentz Invariance Violation from Optical Polarimetry of Astrophysical Objects. Symmetry 2018, 10, 596. [Google Scholar] [CrossRef] [Green Version]
- Kislat, F.; Krawczynski, H. Planck-scale constraints on anisotropic Lorentz and CPT invariance violations from optical polarization measurements. Phys. Rev. D 2017, 95, 083013. [Google Scholar] [CrossRef] [Green Version]
- Amelino-Camelia, G.; Barcaroli, L.; D’Amico, G.; Loret, N.; Rosati, G. IceCube and GRB neutrinos propagating in quantum spacetime. Phys. Lett. B 2016, 761, 318. [Google Scholar] [CrossRef] [Green Version]
- Amelino-Camelia, G.; Barcaroli, L.; D’Amico, G.; Loret, N.; Rosati, G. Quantum-gravity-induced dual lensing and IceCube neutrinos. arXiv 2016, arXiv:1609.03982 [gr-qc]. [Google Scholar] [CrossRef] [Green Version]
- Amelino-Camelia, G.; D’Amico, G.; Rosati, G.; Loret, N. In-vacuo-dispersion features for GRB neutrinos and photons. Nat. Astron. 2017, 1, 0139. [Google Scholar] [CrossRef] [Green Version]
- Zhang, S.; Ma, B.Q. Lorentz violation from gamma-ray bursts. Astropart. Phys. 2014, 61, 108. [Google Scholar] [CrossRef] [Green Version]
- Xu, H.; Ma, B.Q. Light speed variation from gamma-ray bursts. Astropart. Phys. 2016, 82, 72. [Google Scholar] [CrossRef] [Green Version]
- Xu, H.; Ma, B.Q. Light speed variation from gamma ray burst GRB 160509A. Phys. Lett. B 2016, 760, 602. [Google Scholar] [CrossRef] [Green Version]
- Amelino-Camelia, G.; Fiore, F.; Guetta, D.; Puccetti, S. Quantum-spacetime scenarios and soft spectral lags of the remarkable GRB130427A. Adv. High Energy Phys. 2014, 2014, 597384. [Google Scholar] [CrossRef]
- Planck Collaboration: Ade, P.A.R.; Aghanim, N.; Arnaud, M.; Ashdown, M.; Aumont, J.; Baccigalupi, C.; Banday, A.J.; Bartlett, J.G.; Bartolo, N.; Battaner, E.; et al. Planck 2015 results. XIII. Cosmological parameters. arXiv 2016, arXiv:1502.01589v2. [Google Scholar]
- Ghirlanda, G.; Ghisellini, G.; Nava, L. The onset of the GeV afterglow of GRB 090510. Astron. Astrophys. 2010, 510, L7. [Google Scholar] [CrossRef]
- Vasileiou, V.; Jacholkowska, A.; Piron, F.; Bolmont, J.; Couturier, C.; Granot, J.; Stecker, F.W.; Cohen-Tanugi, J.; Longo, F. Constraints on Lorentz invariance violation from Fermi-Large Area Telescope observations of gamma-ray bursts. Phys. Rev. D 2013, 87, 122001. [Google Scholar] [CrossRef] [Green Version]
- Abdo, A.A.; Ackermann, M.; Ajello, M.; Asano, K.; Atwood, W.B.; Axelsson, M.; Baldini, L.; Ballet, J.; Barbiellini, G.; Baring, M.G. A limit on the variation of the speed of light arising from quantum gravity effects. [Fermi LAT/GBM Collaborations]. Nature 2009, 462, 331. [Google Scholar] [CrossRef]
Publisher’s Note: MDPI stays neutral with regard to jurisdictional claims in published maps and institutional affiliations. |
© 2021 by the authors. Licensee MDPI, Basel, Switzerland. This article is an open access article distributed under the terms and conditions of the Creative Commons Attribution (CC BY) license (http://creativecommons.org/licenses/by/4.0/).
Share and Cite
Amelino-Camelia, G.; D’Amico, G.; Fiore, F.; Puccetti, S.; Ronco, M. In Vacuo Dispersion-Like Spectral Lags in Gamma-Ray Bursts. Symmetry 2021, 13, 541. https://doi.org/10.3390/sym13040541
Amelino-Camelia G, D’Amico G, Fiore F, Puccetti S, Ronco M. In Vacuo Dispersion-Like Spectral Lags in Gamma-Ray Bursts. Symmetry. 2021; 13(4):541. https://doi.org/10.3390/sym13040541
Chicago/Turabian StyleAmelino-Camelia, Giovanni, Giacomo D’Amico, Fabrizio Fiore, Simonetta Puccetti, and Michele Ronco. 2021. "In Vacuo Dispersion-Like Spectral Lags in Gamma-Ray Bursts" Symmetry 13, no. 4: 541. https://doi.org/10.3390/sym13040541
APA StyleAmelino-Camelia, G., D’Amico, G., Fiore, F., Puccetti, S., & Ronco, M. (2021). In Vacuo Dispersion-Like Spectral Lags in Gamma-Ray Bursts. Symmetry, 13(4), 541. https://doi.org/10.3390/sym13040541