Article

Symbiosis Evolution Model and Behavior of Multiple Resource Agents in the Smart Elderly Care Service Ecosystem

1
School of Management, Hefei University of Technology, Hefei 230009, China
2
School of Public Health and Management, Wenzhou Medical University, Chashan Higher Education Park, Wenzhou 325035, China
*
Author to whom correspondence should be addressed.
Symmetry 2021, 13(4), 570; https://doi.org/10.3390/sym13040570
Submission received: 11 March 2021 / Revised: 23 March 2021 / Accepted: 25 March 2021 / Published: 29 March 2021

Abstract

:
Population aging has become an important factor restricting China′s social and economic development. The smart health and elderly care industry has developed rapidly in the past five years. However, the service resources among various elderly service providers are relatively isolated and scattered. In other words, the core management problem in the components of the smart elderly care service ecosystem is how to deal with the relationships of interest among multiple resource agents. Thus, the main contribution of this study is to employ symbiosis theory and the logistic growth model to construct a model of the evolution of the symbiosis of multiple resource agents in the smart elderly care service ecosystem. Then, we carry out a stability analysis, and analyze the evolutionary model of two resource agents′ symbiosis under different values of interdependence coefficients. Finally, we use computer simulations to dynamically simulate the model and comparatively analyze the population density of the hospital–nursing home symbiotic relationship using real cases in China. According to the study, we find that the enterprise goal in the smart elderly care service ecosystem should be to maximize the overall value of the multiple resource agents, and the result of the symbiotic evolution between different resource agents depends on the symbiotic interdependence coefficient, while the resource agent uses different strategies under different symbiosis models. Therefore, regulation is needed to ensure the relative fairness of the distribution of value co-creation in the smart elderly care service ecosystem when the resource agent takes actions that benefit itself. Of course, when the ecosystem is in a reciprocal symbiosis model, each resource agent benefits from the activities of the other resource agents, which is ideal in reality; in other words, the best symbiosis model between the two resource agents should be the similar reciprocal symbiosis model.

1. Introduction

With the continuous improvement of social development and living standards, human life expectancy has significantly improved. Low mortality and low birth rates have become universal phenomena around the world [1]. The proportion of the elderly population has gradually increased, leading to related developments in developed and developing countries around the world [2]. China is one of the countries with a relatively high degree of population aging and faces severe challenges. According to the latest data from the National Bureau of Statistics of China, as of the end of 2019, the number of people aged 60 and over in the country was 253.88 million, accounting for 18.1% of the population. Among them, the population aged 65 and over was 176.03 million people, or 12.6% (http://www.stats.gov.cn/tjsj/zxfb/202002/t20200228_1728913.html, accessed on 28 February 2020), and this number is expected to reach nearly 500 million in China by 2050.
Population aging has become an important factor restricting China’s social and economic development. This is due to the growth of demand for services for the elderly and the rapid growth of the elderly care service industry [3,4]. In the past five years, with the in-depth application of new-generation information technology and smart hardware products such as artificial intelligence, the Internet of Things, cloud computing, and big data in the field of elderly care services, the smart health and elderly care industry has developed rapidly [5], and multiple resource agents have continuously entered and diversified. A new model of elderly care with specialized operations and refined services has been gradually established [6]. However, the service resources among various elderly service providers such as government, medical institutions, nursing homes, communities, social service organizations, and elderly enterprises are relatively isolated and scattered. The degree of resource fragmentation is high, and effective resource integration and coordination mechanisms are lacking [7]. It is difficult to realize the complementary advantages of elderly service agents and form a mutually beneficial and symbiotic elderly service industry ecosystem. The core management problem in the components of the smart elderly care service ecosystem is how to deal with the relationships of interest among multiple resource agents.
The smart elderly care service ecosystem is similar to other service ecosystems; it is a relatively independent, self-regulated system connected by resource integrators through shared systems, arrangements, and mutual value creation of service exchange [8]. Through resource integration and service exchange, all participants are institutionalized and coordinated to jointly create value in the experience of nested and overlapping service ecosystems [9], so service ecosystems are seen as organizational logic for elderly service enterprises to achieve value co-creation [10]. The smart elderly care service ecosystem puts more emphasis on resource interaction under a more complex network system [11], considering enterprise, elder, and other resource agents as nodes in this network system [12,13]. Based on their value position, each actor will produce, serve, and create value jointly under the technology, rules, and language frameworks [14]. The participants in value co-creation from the perspective of the service ecosystem are all economic and social participants [15,16]; the differences in roles of all participants are weakened or even removed, and all participants or beneficiaries are value co-creators [9,14]. Some researchers have noted that all participants in socio-economic activities in the service ecosystem should be considered value-for-value participants [17,18,19,20,21,22,23]. Value co-creation is a dynamic network system for all participants, emphasizing resource integration and interactive services, and highlighting the importance of institutions and social norms [10,24,25,26,27,28].
In the smart elderly care service ecosystem, the extensive resource agent refers to any group or individual that can affect the realization of the organizational goal or be affected by the realization of the organizational goal, generally including shareholders, employees, governments, medical institutions, nursing homes, communities, social service organizations, and so on [29,30]. Higgins noted that the providers of community home care services include the government, for-profit organizations, non-professional nursing staff, employee and industry associations, volunteers, and non-governmental non-profit organizations [31] There are two main modes in the governance of a resource agent. The first is the management mode of the resource agent under the logic of a shareholder′s unilateral governance [32,33,34,35,36]. The goal is to coordinate the relationship between the resource agent, through communication and appropriate economic incentives, and to maximize the shareholders′ benefits. The second is the resource agent participation governance model, mainly including resource agent joint governance [37,38] and key resource agent governance [39,40]; this model includes shareholders in the overall scope of the resource agent, realizing the reasonable appeal of the resource agent collective and ultimately maximizing corporate value. Because it is difficult to balance and ensure the interests of resource agents [41,42], the former model has not brought significant improvement to the company performance [43,44]. The latter model is a more reasonable governance model that has been applied to many companies in management practice, but many areas still need to improve in regards to the selection of resource agent objective function and the demand of global resource subject allocation [45,46]. In the field of elderly care services, the city of Oxford in the United Kingdom integrates services for the elderly in management and governance via needs and results goals, service user paths, infrastructure construction, human resources, and workplace management (Oxfordshire County Council, 21 December 2015. Older People’s Joint Commissioning Strategy 2013–2016. http://www.oxfordshire.gov.uk/cms/news/2013/jan/older-peoples-joint-commissioning-strategy-2013-2016 accessed on accessed on 28 February 2020).
To make up for the deficiency, many scholars have introduced the concept of “symbiosis” from biology into research on resource agents and have constructed the common governance model of resource agents from the perspective of symbiosis [47]. The key to symbiotic management of resource agents is to clarify the mutual relationship between the symbiotic units (each resource agent) and reveal its essential relation [48], that is, to study the symbiotic behavior model of resource agents. This model should be dynamic or symbiotic evolution [49]. Within the existing literature, the theoretical basis of the symbiotic evolution model is still derived from biology, that is, the logistic growth model [50] used to study the growth, development, or reproduction of plants and animals [51,52]. It is widely used in socio-economic research and is a population dynamic evolution model based on private resource consumption. For example, scholars use the logistic growth model to describe the optimal management of agricultural commodities and fishery production resources [53]; to determine the dynamical mechanism of urbanization [54]; to describe the market penetration of many new products and technologies [55]; to give a summary of world energy usage and source substitution [56]; to describe the industrial revolution as an evolutionary process [57]; and so on. Furthermore, the stable and sustainable development of the service ecosystem requires a set of reasonable income distribution mechanisms to regulate the benefits relationship, enhance the cooperative ability among enterprises, and enhance the efficiency of value creation of the whole service ecosystem.
Under the smart elderly care model, reasonable and effective technical means can improve the efficiency of support for the elderly [58,59]. The ultimate goal of smart elderly care is to combine emerging information technology to establish a comprehensive elderly care service system platform [60,61] at the system level to meet the needs of the elderly and improve the quality of elderly care [62,63,64]. The construction of a smart elderly care service ecosystem can not only realize information sharing between multiple resource agents, but also greatly enhance the coordination capabilities between multiple resource agents, and provide the possibility to establish a mutually beneficial and symbiotic elderly care service ecosystem. The management science problem of how to use symbiosis theory to study the symbiosis mode between two resource agents and even multiple resource agents, and realize the symbiotic evolution of interests among multiple resource agents, should be solved at present.
A review of the existing literature shows that the construction of a multiple resource symbiosis governance model in the smart elderly care service ecosystem has important theoretical research significance and practical application value. The starting point of multiple resource symbiosis governance should not only realize the maximization of profits of a single agent, but also achieve the maximization of the value of multiple resource agents in the service ecosystem, and then a harmonious symbiosis of multiple resource subjects should be built. The key lies in recognizing the symbiotic evolution of the multiple resource agent to promote the sustainable development of enterprises.
Therefore, the main contribution of this study is to employ symbiosis theory and the logistic growth model to construct a model of the evolution of the symbiosis of multiple resource agents in the smart elderly care service ecosystem. This study then verifies the rationality of the constructed theoretical model from two aspects: model simulation and real cases. The rest of this paper is organized as follows: In Section 2, we construct the model of the evolution of the symbiosis of multiple resource agents based on the logistic growth model. Then, in Section 3 we carry out a stability analysis, and then analyze the evolutionary model of two resource agents′ symbiosis under different values of interdependence coefficients. Next, Section 4 provides the model simulation and a case study, respectively. Finally, Section 5 concludes the paper.

2. Methods

2.1. Logistic Growth Model

A multiple resource agent in the smart elderly care service ecosystem, denoted by i , can be viewed as a different population, the density and number of which are in dynamic change. This paper attempts to construct a model of the evolutionary dynamic of multiple resource agents’ symbiosis using the logistic growth model.
The logistic growth model is a model of population evolution based on exclusive resource consumption. It is used to describe the evolutionary trajectory of species’ populations over time in the biological world. When only one biological population exists in a natural environment, the model can be used to describe its number. The differential equation of the logistic growth model can be written as follows [50]:
x ( t ) = r x ( 1 x N )
where x ( t ) is the population density or the number of people at a time t; r is the inherent growth rate; N is the maximum number of people allowed by the environmental resources; and 1 x N reflects the retardation effect of the population on its own growth caused by the consumption of limited resources [65].
When the logistic growth model is introduced into the field of economics, according to the relevant theories and mathematical models of modern evolutionary economics, the multiple resource agent symbiosis evolutionary dynamic model construction process can be shown as follows.

2.2. Model Construction

In this section we describe the model construction. First, the following assumptions are made:
Hypothesis 1 (H1).
This paper selects revenue v i as the measure of the population density of the resource agent i ; the expansion of population size includes the increase of both population number and income, which can be denoted as a function of time, v i ( t ) . It includes not only the meaning in the daily sense, but also the impact of various exogenous influencing factors such as technological innovation, information, specialization and collaboration, institutional arrangements, and market environment [66]. Due to social and market constraints, under certain environmental constraints, the limited nature of resources makes the revenue created by the industry limited. In this case, the resource agent’s benefits obtained from the value creation process are limited.
Hypothesis 2 (H2).
The type space and strategy space of the multiple resource agent are assumed to be exogenously given and unchanging; that is, no new species or strategy is involved in this model.
Second, the model is constructed as follows:
v i = v i f i ( u , v )
where the revenue of the enterprise v i is the population density of the resource agent; u denotes the strategy of the population, which, in economics, can represent a certain genetic trait of the participant i (e.g., investment routines of shareholders); and f i ( u , x ) denotes the fitness of the species i , representing an average variation of the density of the species i from one period to another. When only one stakeholder i exists alone in the symbiotic circle, the fitness function of this population can be denoted as follows:
f i ( u , v ) = r i ( 1 v i k i )
where r i is the endogenous growth rate of resource agent i ; k i is the resource carrying capacity of the environment where species i resides, that is, the maximum revenue in the symbiotic environment where the stakeholder i resides; v i / k i is the ratio of the size level of stakeholder i against the maximum size, that is, the natural saturation; and 1 v i / k i denotes the drag effect caused by stakeholder i ’s consumption of limited resources.
We assume that the number of multiple resource agents in the symbiotic circle is s , and that a positive interdependence relation (j) dominates the symbiotic relations among multiple resource agents; that is, j exerts facilitating effects on the growth of revenue v i of i ; hence, the fitness function of each agent can be denoted as follows:
f 1 ( u , v ) = r 1 ( 1 v 1 / k 1 + j = 2 s α 1 j v j / k j )
……
f i ( u , v ) = r i ( 1 v i / k i + j = 1 , j i s α i j v j / k j )
Therefore, the model of the evolutionary dynamics of multiple resource agent symbiosis can be denoted as follows:
v i = v i f i ( u , v ) = v i r i ( 1 v i / k i + j = 1 , j i s α i j v j / k j )
where α i j is the interdependence coefficient, which indicates a facilitating effect of j on i if α i j > 0 ; no influence if α i j = 0 ; and a hindering effect when α i j < 0 , where α i j is called the competition coefficient.

2.3. Model Construction with Two Resource Agents

Assume that in the circle of two symbiotic resource agents, v i ( t ) indicates revenue generated by i and v j ( t ) indicates revenue by j . When i or j exist alone, the model of evolutionary symbiosis can be separately denoted as follows:
v i = v i f i ( u , v ) = v i r i ( 1 v i / k i )
v j = v j f j ( u , v ) = v j r j ( 1 v j / k j )
Because it has an interdependence relationship between the two resource agents, the model of evolutionary symbiosis can be separately denoted as follows:
v i = v i f i ( u , v ) = v i r i ( 1 v i / k i + α i v j / k j )
v j = v j f j ( u , v ) = v j r j ( 1 v j / k j + α j v i / k i )
where α i , the interdependence coefficient of i , indicates a facilitating effect of j on i ; and α j , the interdependence coefficient of j , indicates a facilitating effect of i on j . The combination of Equations (7) and (8) can be considered the model of evolutionary symbiosis:
{ v i = v i r i ( 1 v i / k i + α i v j / k j ) v j = v j r j ( 1 v j / k j + α j v i / k i )

2.4. Evolutionary Model of Multiple Resource Agents’ Strategy Learning Rules

When resource agent i changes its strategy u i , the original dynamic evolution model will undergo drastic changes, which can be analyzed with the replicator dynamic model from the discipline of ecology. Equation (11) is a generalized fitness function, from which a generalized multiple resource agent evolution model is obtained. Through appropriate transformation, the above model can be transformed into a dynamic model of strategy frequency (or strategy learning).
p = K v i v i K K 2 = p i ( f i f )
where K = i = 1 n s v i is the total number of the population; p i = v i K is the number of species using strategy; u i is a proportion of the population; i = 1 n s p i = 1 ; f i denotes the fitness of the species i ; and f _ = i = 1 n s p i f i ( u , p , K ) denotes the average fitness of the population.
In the model, the type space and strategy space of species are both exogenous given invariants; the model does not involve the generation of new species or strategies. Therefore, such an evolution model is a local evolution analysis. The above evolution model can describe the selection process of strategies during participants′ interaction; participants in such models are less conscious and usually adopt unconscious learning rules, and changes in strategy are mainly influenced by natural selection (market competition).

3. Analysis of the Two Resource Agents’ Symbiotic Behavior

According to the results of building the model, we can analyze the two resource agents’ symbiotic behaviors. When two resource agents have reached a stable symbiotic state, it can be denoted by the following differential equations:
{ v i r i ( 1 v i / k i + α i v j / k j ) = 0 v j r j ( 1 v j / k j + α j v i / k i ) = 0
When α i = 0 and α j = 0 , then,
{ 1 v i / k i = 0 1 v j / k j = 0
We have the equilibrium point ( k i , k j ); that is, the incomes for parties of i and j are k i and k j , respectively. According to the service ecosystem perspective, this is an independent symbiosis mode between i and j ; that is, no symbiotic relation exists and no party has made contributions to the counterparty; in disregard of other stakeholders, the corporation has not made any new value-added, which is obviously contradictory to the corporation′s vision. Therefore, the independent symbiotic mode is inappropriate in contemporary corporations.
When α i = 0 and α j 0 , or α i 0 and α j = 0 , then,
{ 1 v i / k i = 0 1 v j / k j + α j v i / k i = 0 or { 1 v i / k i + α i v j / k j = 0 1 v j / k j = 0
We have the equilibrium points ( k i , k j ( 1 + α j ) ) or ( k i ( 1 + α i ) , k j ). The former scenario denotes that i , whose income of equilibrium is k i , cannot obtain benefits from j , but j , whose income of equilibrium is k j ( 1 + α j ) , can gain benefits from i . The latter scenario denotes that i , whose income of equilibrium is k j ( 1 + α j ) , can retain benefits from j , but j , whose income of equilibrium is k i , cannot gain benefits from i . This mode is called partial benefit symbiosis; that is, the resource agent who has not received an effective facilitating effect from its counterparty can reach the original equilibrium value of k i or k j under the existing environmental carrying capacities, while the other resource agent, who has received effective facilitating effects from its counterparty, can break through the existing environmental carrying capacities to form new equilibrium value.
When α i 0 and α j 0 , then,
{ v j = k j ( v i / k i 1 ) / α i v j = k j ( 1 + α j v i / k i )
Equation (16) gives the equilibrium points ( k i ( 1 + α i ) 1 α i α j , k j ( 1 + α j ) 1 α i α j ), where the following conditions should be fulfilled depending on realistic meanings:
{ k i ( 1 + α i ) 1 α i α j > 0 k j ( 1 + α j ) 1 α i α j > 0
On this occasion, α i α j < 1 . From the perspective of a stability analysis on the differential equation, the Taylor expansion of differential equations should be carried out at the equilibrium points:
{ v i = r i ( 1 2 v i / k i + α i v j / k j ) ( v i v i * ) + ( r i v i α i / k j ) ( v j v j * ) v j = ( r j v j α j / k i ) ( v i v i * ) + r j ( 1 2 v j / k j + α j v i / k i ) ( v j v j * )
Substituting ( k i ( 1 + α i ) 1 α i α j , k j ( 1 + α j ) 1 α i α j ) into the expansion equation gives the coefficient matrix A :
A = [ r i ( 1 α i ) / ( 1 α i α j ) r i k i α i ( 1 + α i ) / k j ( 1 α i α j ) r j k j α j ( 1 + α j ) / k i ( 1 α i α j ) r j ( 1 α j ) / ( 1 α i α j ) ]
According to the stability theory of differential equations, the condition for a stable node is α i α j < 1 ; the fulfillment of this condition also falls into the following scenarios:
Scenario 1: when α i < 1 , α j > 1 , and α i α j < 1 ; or when α i > 1 , α j < 1 , and α i α j < 1 .
When α i < 1 , α j > 1 , and α i α j < 1 , the effect of i on j is significantly larger, and vice versa; as a result, the evolutionary process of dynamic growth for i and j will gradually converge toward an equilibrium point. This dynamic evolutionary trend is dissymmetrical, so we call it an asymmetric reciprocal symbiosis model. From the perspective of economics and management, both parties can obtain benefits from the counterparty, that is, share the created corporate value, but such a sharing mechanism is dissymmetrical. In this model, both symbiotic parties can produce new value, which is distributed as per the dissymmetrical mechanism, giving rise to the asynchrony of both parties′ evolutions.
Scenario 2: when α i < 1 , α j < 1 , and α i α j < 1 .
When α i < 1 , α j < 1 , and α i α j < 1 , the effect of i on j is not much different from the effect of j on i , with nearly the same or equal effect. The dynamic evolutionary trend is close or similar to the state of symmetric evolution. Therefore, when α i = α j , we call it a symmetric reciprocal symbiosis model, while when α i α j , we call it a similar reciprocal symbiosis model. From the perspective of economics and management, under the symmetric reciprocal symbiosis model, each party can benefit from the behaviors of the counterparty, and both symbiotic parties can produce new value, which is distributed as per a symmetric mechanism, and the evolutions of both parties are synchronized. However, the symmetric reciprocal symbiosis model is ideal in reality, and the best symbiosis model between the two resource agents should be the similar reciprocal symbiosis model.
When the Interdependence Coefficient is Negative
When the dependency coefficient is less than zero, it can be specifically analyzed as follows: When α i = 0 and α i < 0 , or α i < 0 and α j = 0 , then i and j are in the symbiotic mode, one side is damaged, and the other party is neither profitable nor harmful. When α i > 0 and α j < 0 , or α i < 0 and α j > 0 , then i and j are in the parasitic mode, although it is not necessarily harmful to the host; but there is a transfer of the host’s interest to the parasite, and no new value is generated. When α i < 0 and α j < 0 , i and j are in a competitive symbiotic relationship. According to the degree of influence of the competing parties on each other, i and j are in a symmetric competitive symbiotic relationship or an asymmetric competitive symbiotic relationship.
To summarize, two resource agents′ symbiotic relations and equilibrium points can be determined according to difference values of the interdependence coefficient. The above scenarios are summarized in Table 1.

4. Model Simulation

The numerical simulation of the symbiosis model assigns the parameters of the model based on the experience of large enterprises in China [66]. Based on previous research [67], this paper assumes that the natural growth rates of resource agents i and j, respectively, are 0.03 and 0.01. The variable K represents the natural load and can represent the total value in an economic sense, assuming that the value load of i and j each is 100 units, and the initial population density of resource subjects i and j is 1 unit.
This part gives the simulation results of 8 kinds of symbiosis behavior mode in Table 1. The left plot shows the population density of the resource agent, V, over several thousand iterations, while the right plot shows the strategy frequency of each resource agent, P, over several thousand iterations. At last, we take three resource agents as the case of the simulation of the evolution curve of multiple resource symbiotic dynamics.

4.1. Simulation of the Independent Symbiosis Model

The independent symbiosis ( α i = 0 , α j = 0 ) represents two resource agents that have no relationship with each other. In Figure 1a, after nearly 1000 iterations, resource agent i grows faster than resource agent j due to its larger internal growth rate, and it reaches the environmental load first. In Figure 1b, the two resource agents reach the frequency of about 0.5 from opposite directions after about 1000 iterations. The difference is that i first rises and then falls, whereas j first falls and then rises. Figure 1 shows that the two resource agents are using the same strategy; that is, the strategy of development independent of each other is equal to the development opportunities of the two resource subjects.

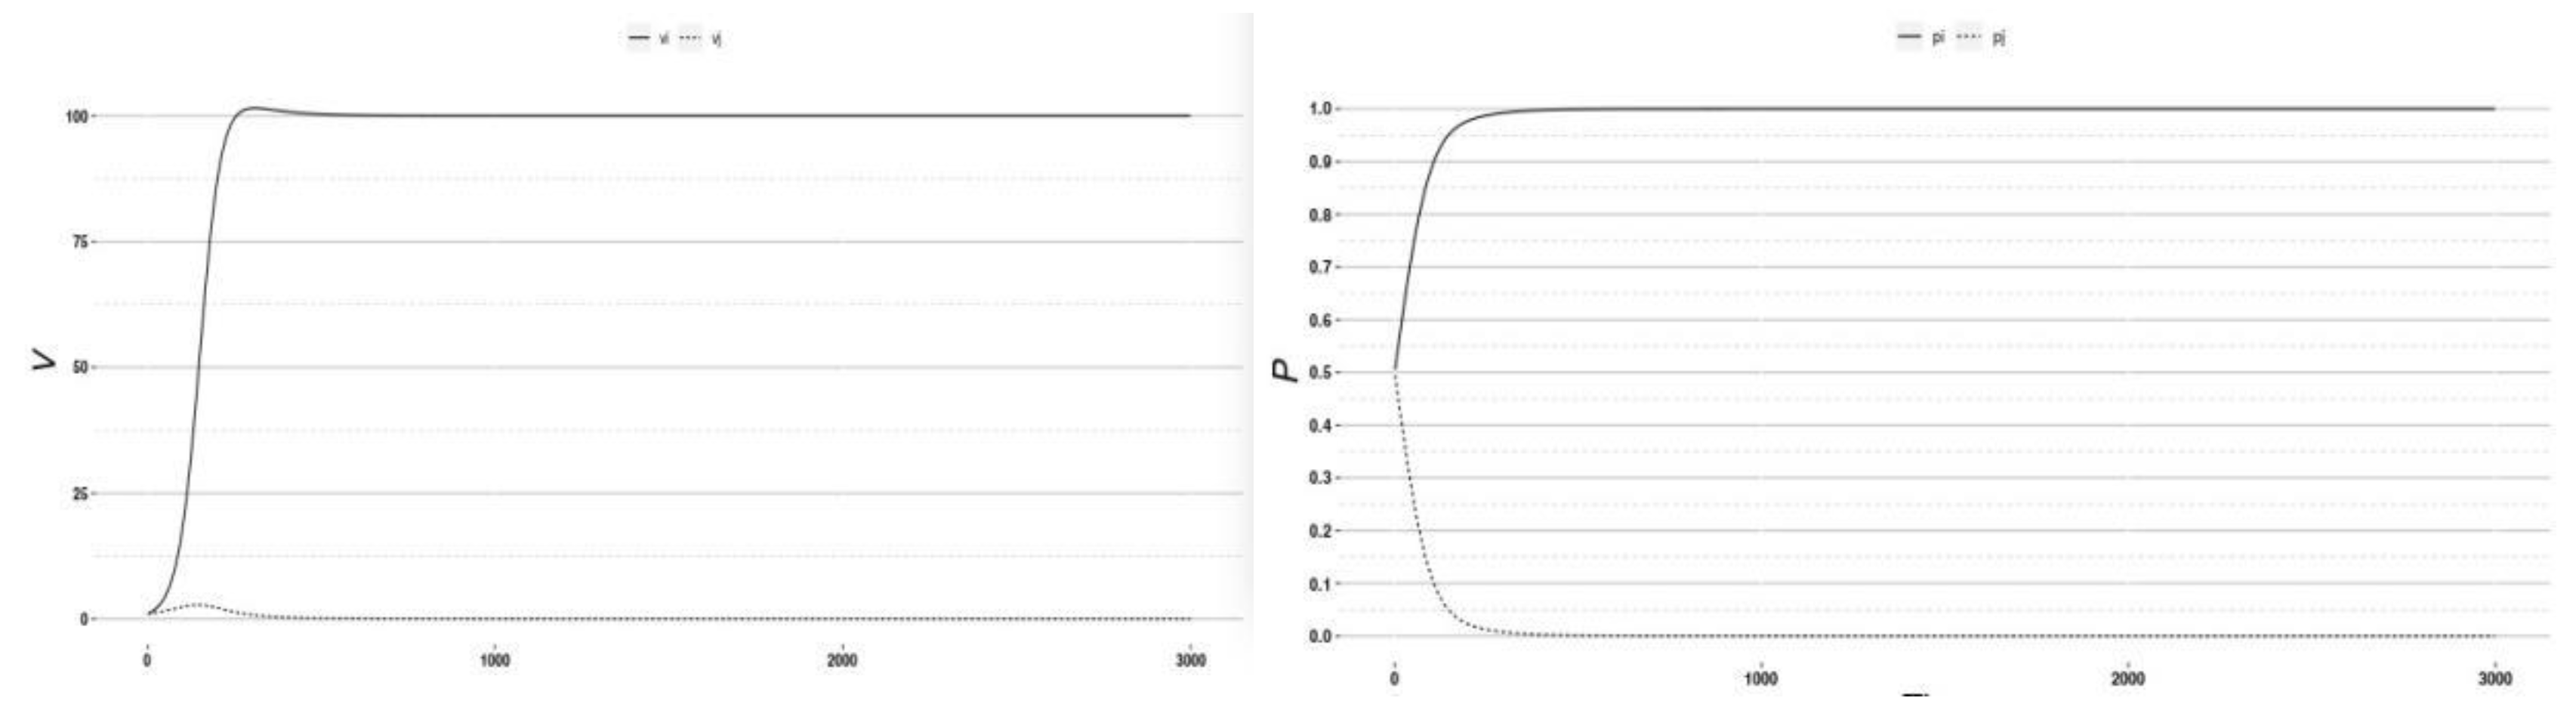
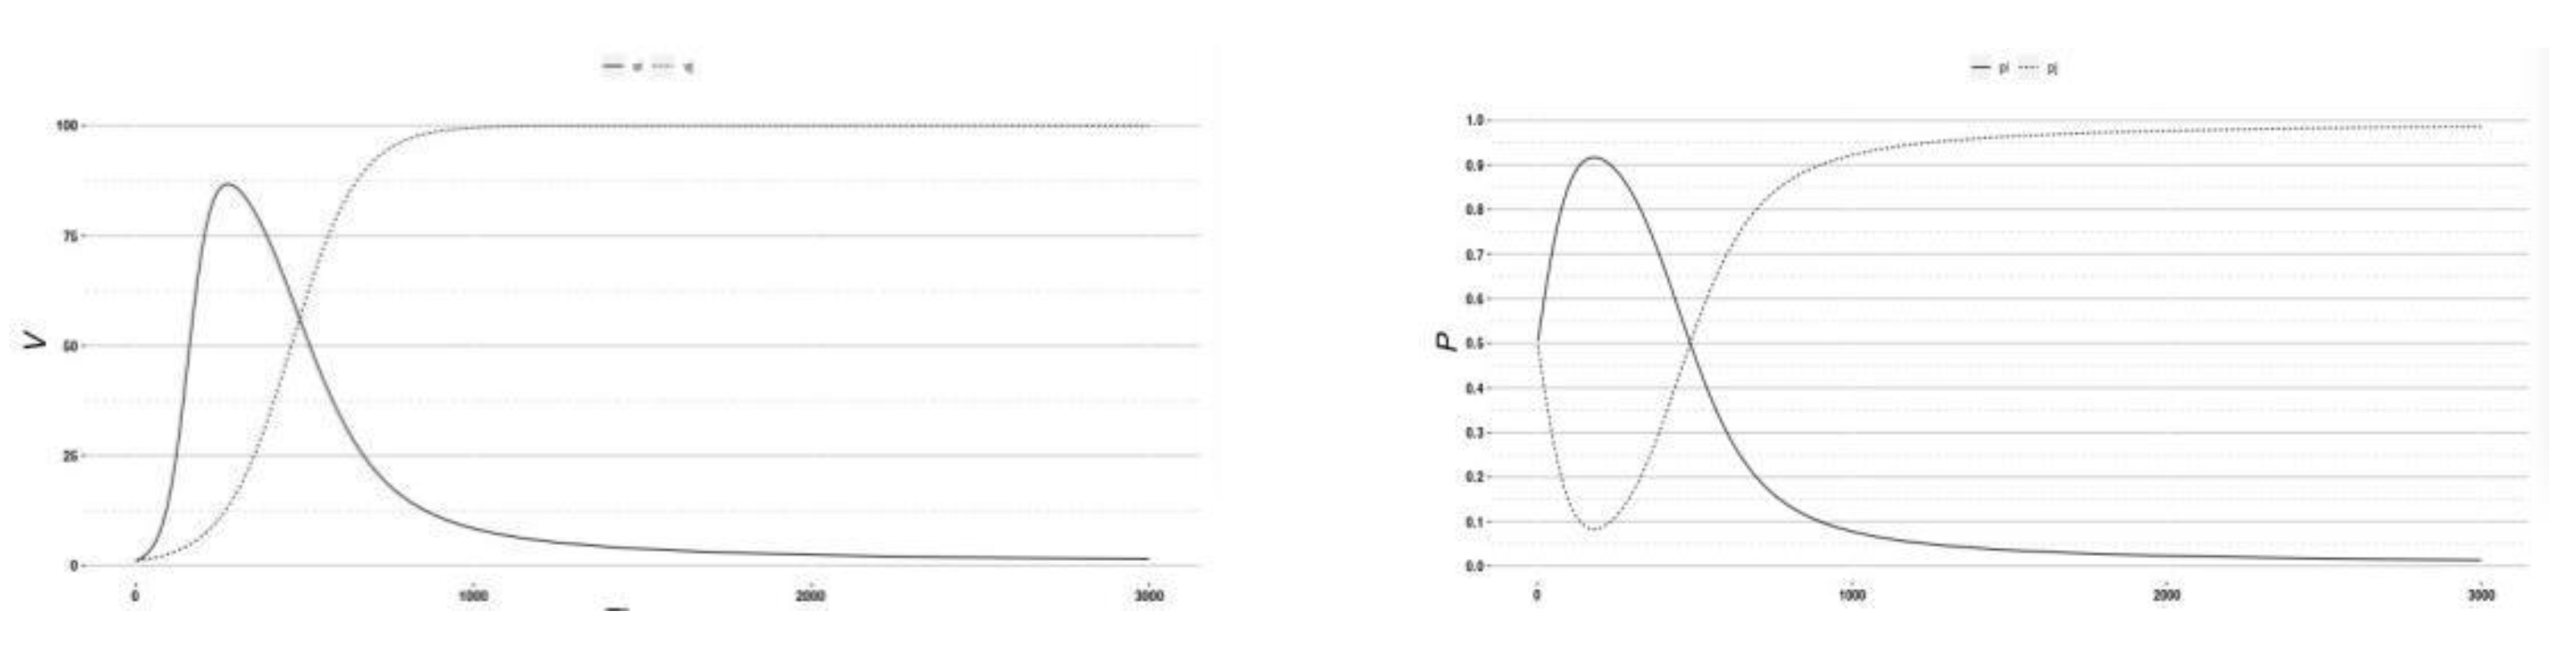
4.2. Simulation of the Parasitic Symbiosis Model

One of the parasitic symbiosis models is α j < 0 and α i > 0 ; that is, j has a positive effect on i while i has a negative effect on j. In other words, i is a parasite, which is conducive to the development of i but not to the development of host j. Figure 2 presents in the dynamic evolution of population density, i quickly increases to the environmental carrying capacity, whereas j first increases and then decreases and basically does not share the rights and interests. In the choice of strategy, the frequency of the parasitic i continues to rise to 1, indicating that i prefers the parasitic strategy, while j tends to give up or go to a p value of 0 under the parasitic strategy.
One of the parasitic symbiosis models is α i < 0 and α j > 0 ; that is, i has a positive effect on j, while j has a negative effect on i. In other words, j is a parasite, which is conducive to the development of j but not to the development of host i. Figure 3 presents in the dynamic evolution of population density, due to its own internal growth, i first increases and then declines to basically share no rights and interests, whereas j quickly grows nearly to the environmental load. In the selection of dynamic strategy, the frequency of the parasitic j tends to be 1 after decreasing first and then increasing, indicating that j prefers the parasitic strategy, while i tends to give up or go to a P value of 0 under the parasitic strategy.

4.3. Simulation of the Competitive Symbiosis Model

The competitive symbiosis mode is α i < 0 and α j < 0 . The dynamic simulation curve of the competitive symbiosis model shows that although i and j are competitive, the absolute value of the dependence coefficient is less than 1, and both the population densities increase and then stabilize, which is reflected in the change of strategy of the dynamic selection curve. Figure 4 presents the state of this trade-off, forming a symmetrical symbiotic state of competition.

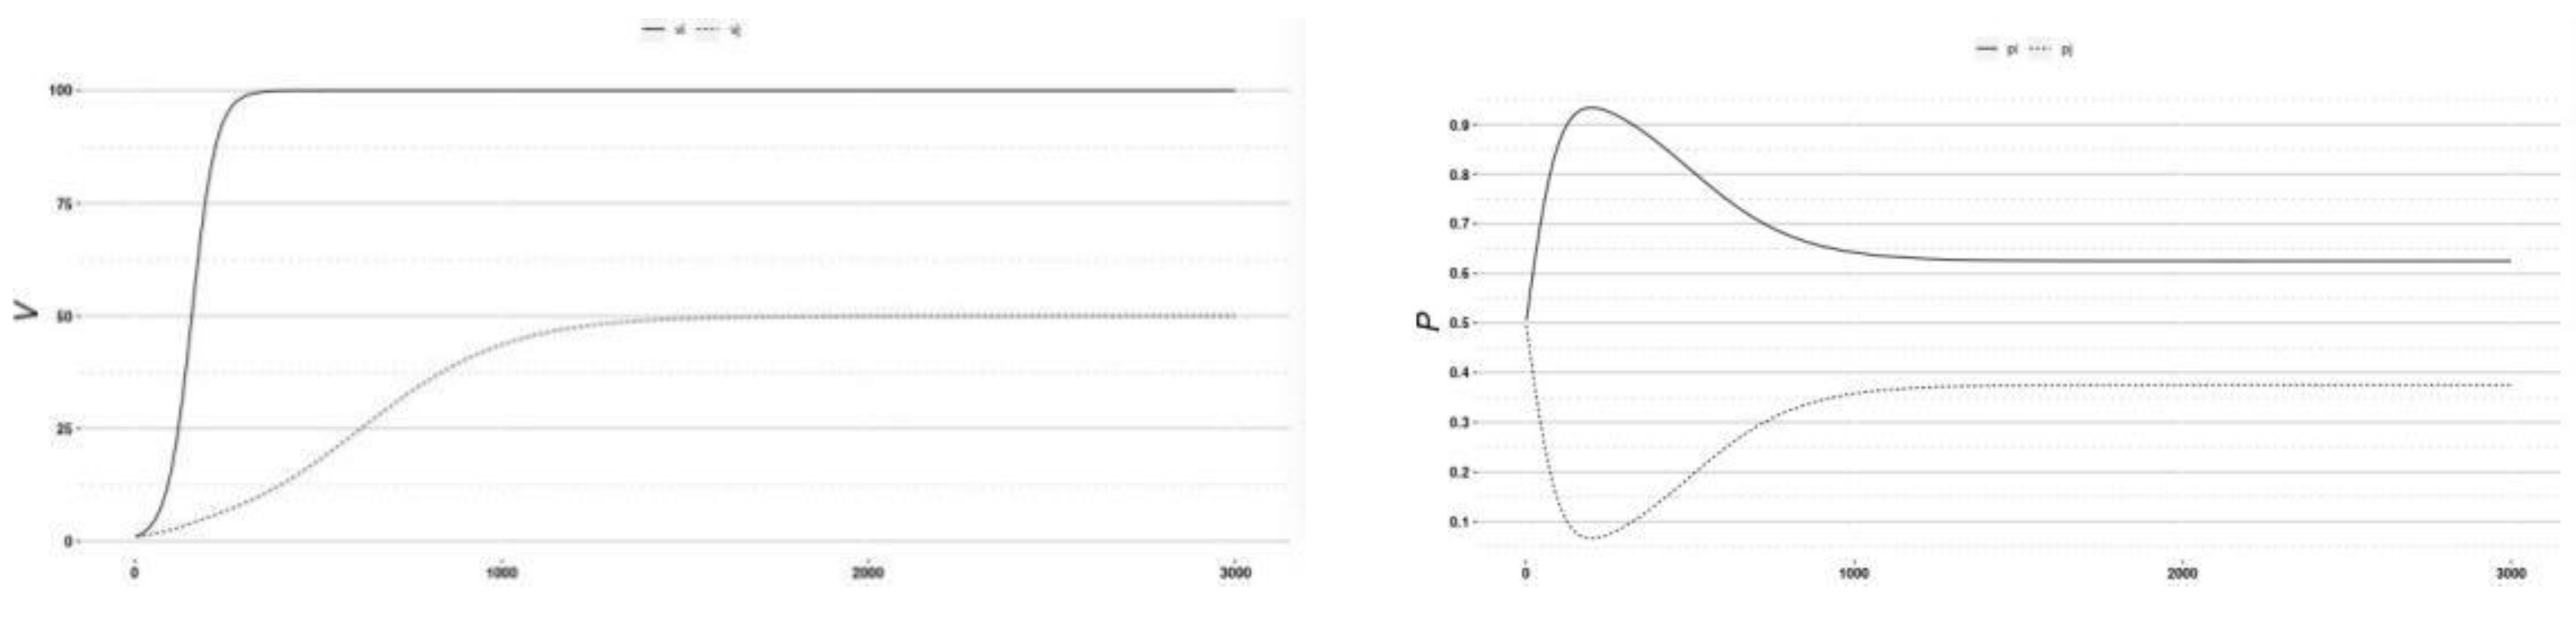
4.4. Simulation of Partial Harm Symbiosis Model

One of the partial harm symbiosis models is that the resource agent i is harmful to j, losing the benefit to j, which makes its population density increase slowly. The dynamic selection curve of the strategy changes in the opposite direction. As shown in Figure 5, the frequency of resource agent i tends toward 1, and it is willing to continue to execute the strategy, while j tends to give up the strategy.
One of the partial harm symbiosis models is that the resource agent j is harmful to i, losing the benefit of i, which makes its population density increase change from quickly to slowly, while the population density of j tends to increase quickly. The dynamic selection curve of the strategy changes in the opposite direction. As shown in Figure 6, the resource agent i first rises and then falls to 0; thus, i chooses to give up the strategy. Meanwhile, resource agent j first falls and then rises to 1, showing that it is willing to continue to execute the strategy.

4.5. Simulation of Partial Benefit Symbiosis Model

One of the partial benefit symbiosis models is that resource agent j benefits from the behavior of i, which makes the population density of j rise. While i is not affected by j, its population growth rate first rises and then declines, depending on its internal growth rate, indicating that its dynamic benefits are still affected under the interaction with j. The effect is reflected in the change of the strategy’s dynamic selection curve due to its own internal growth; the curve of i appears to rise first in this strategy selection and then tends to give up the strategy. Meanwhile, the curve of j appears to fall first and then rise. It can be seen in Figure 7.
The second partial benefit symbiosis model is that resource agent i benefits from the behavior of j. Because i’s own internal growth rate is higher than that of j, its population density rises faster and then tends to be stable. However, j is not affected by i and depends on its internal growth rate, making its population density rise slowly and tend to be stable. As reflected in the change of the strategy’s dynamic selection curve, i still tends to rise and then decline in the strategy selection, but the downward trend is significantly less than the degree not affected by j, tending to be stable at 0.6; that is, in the long run, the frequency of the selection of this strategy by i is 0.6. Meanwhile, j can benefit from its own growth, and the strategy selection curve shows a trend of falling first and then rising and tends to be stable at 0.4; that is, in the long run, the frequency of the selection of this strategy by j is 0.4. It can be seen in Figure 8.

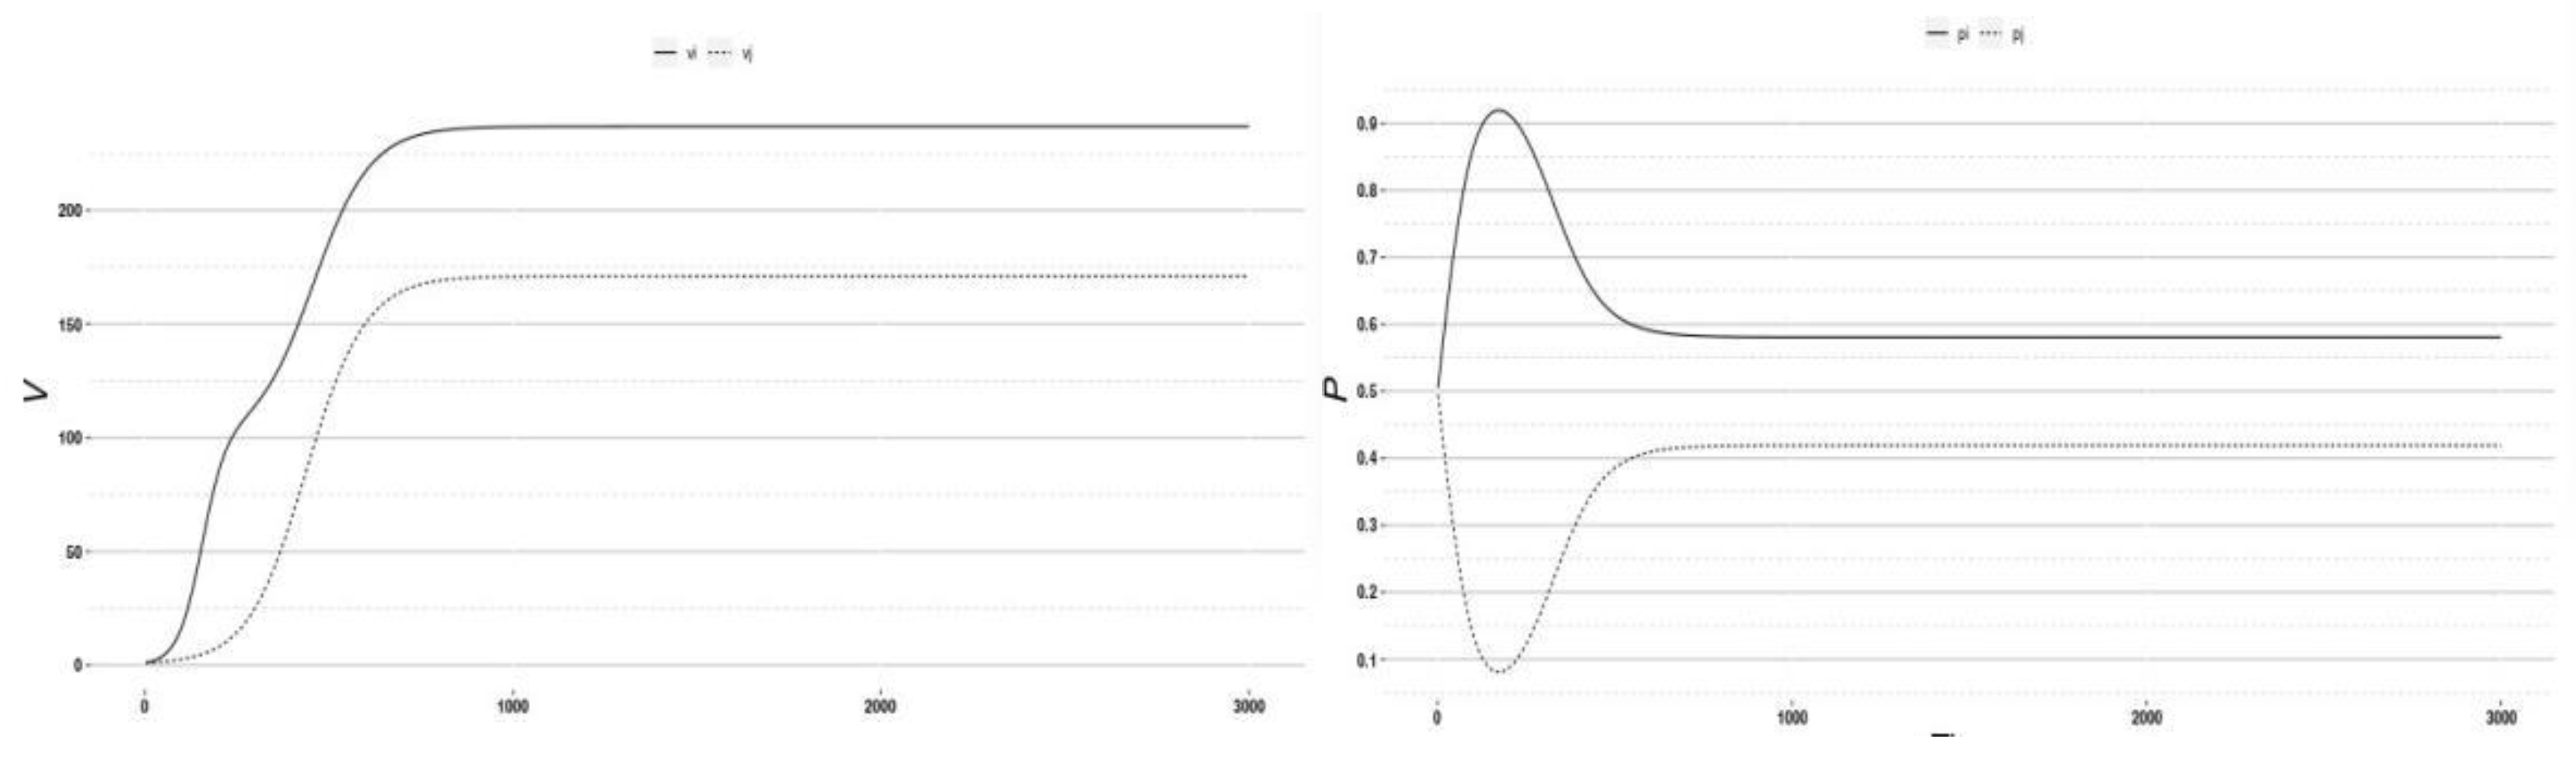
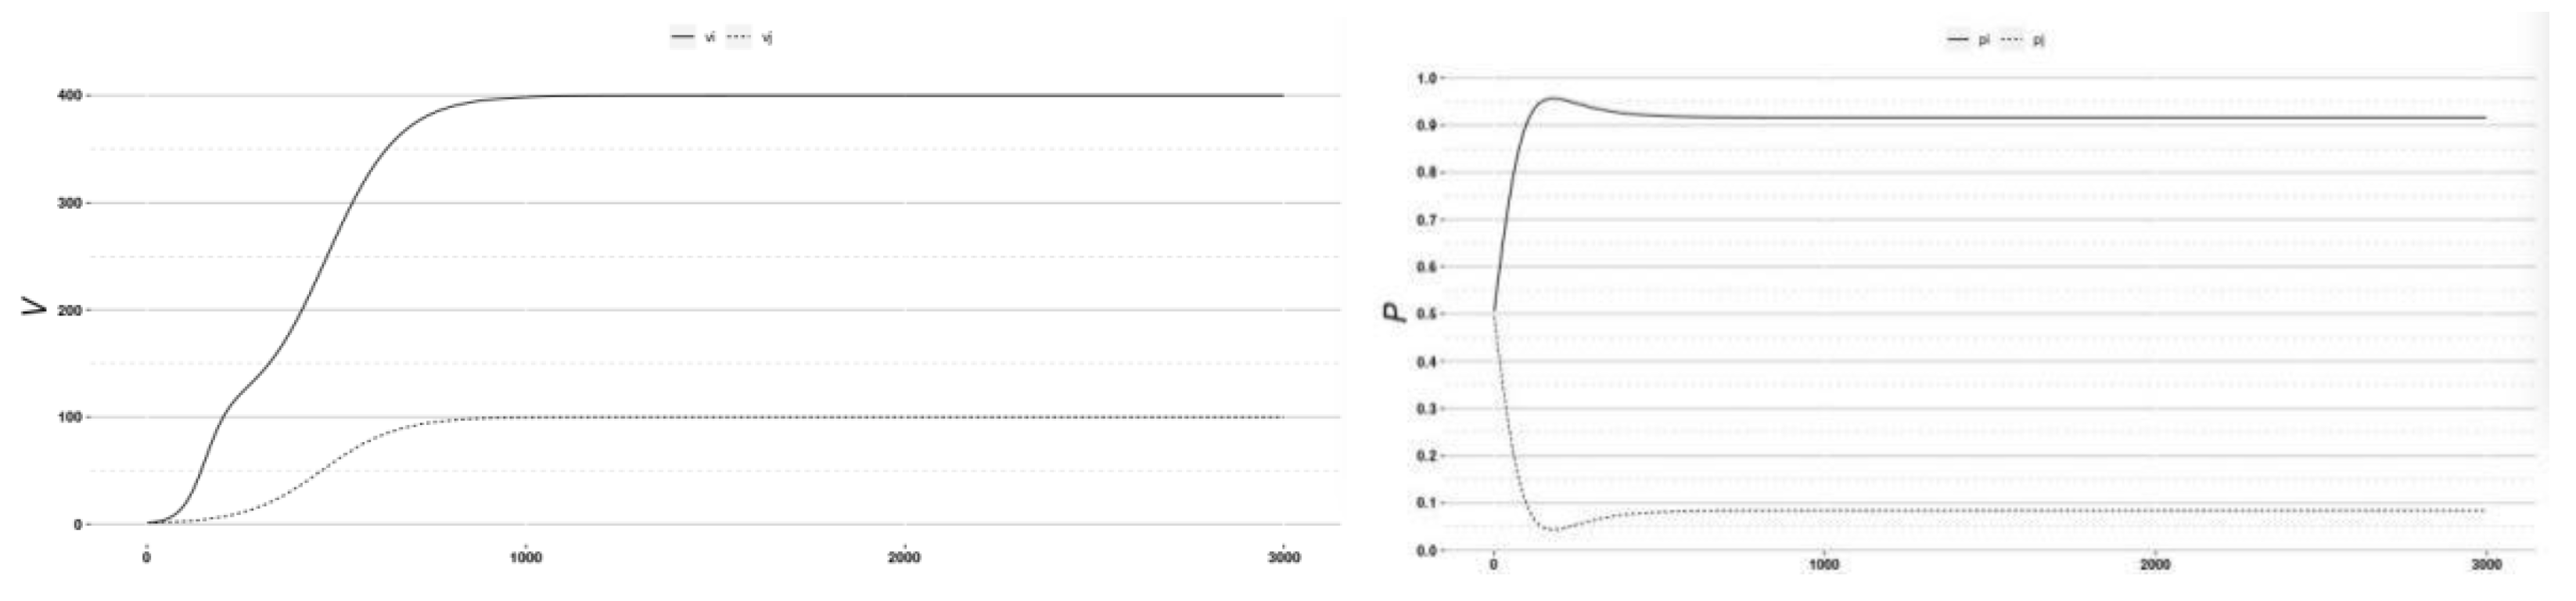
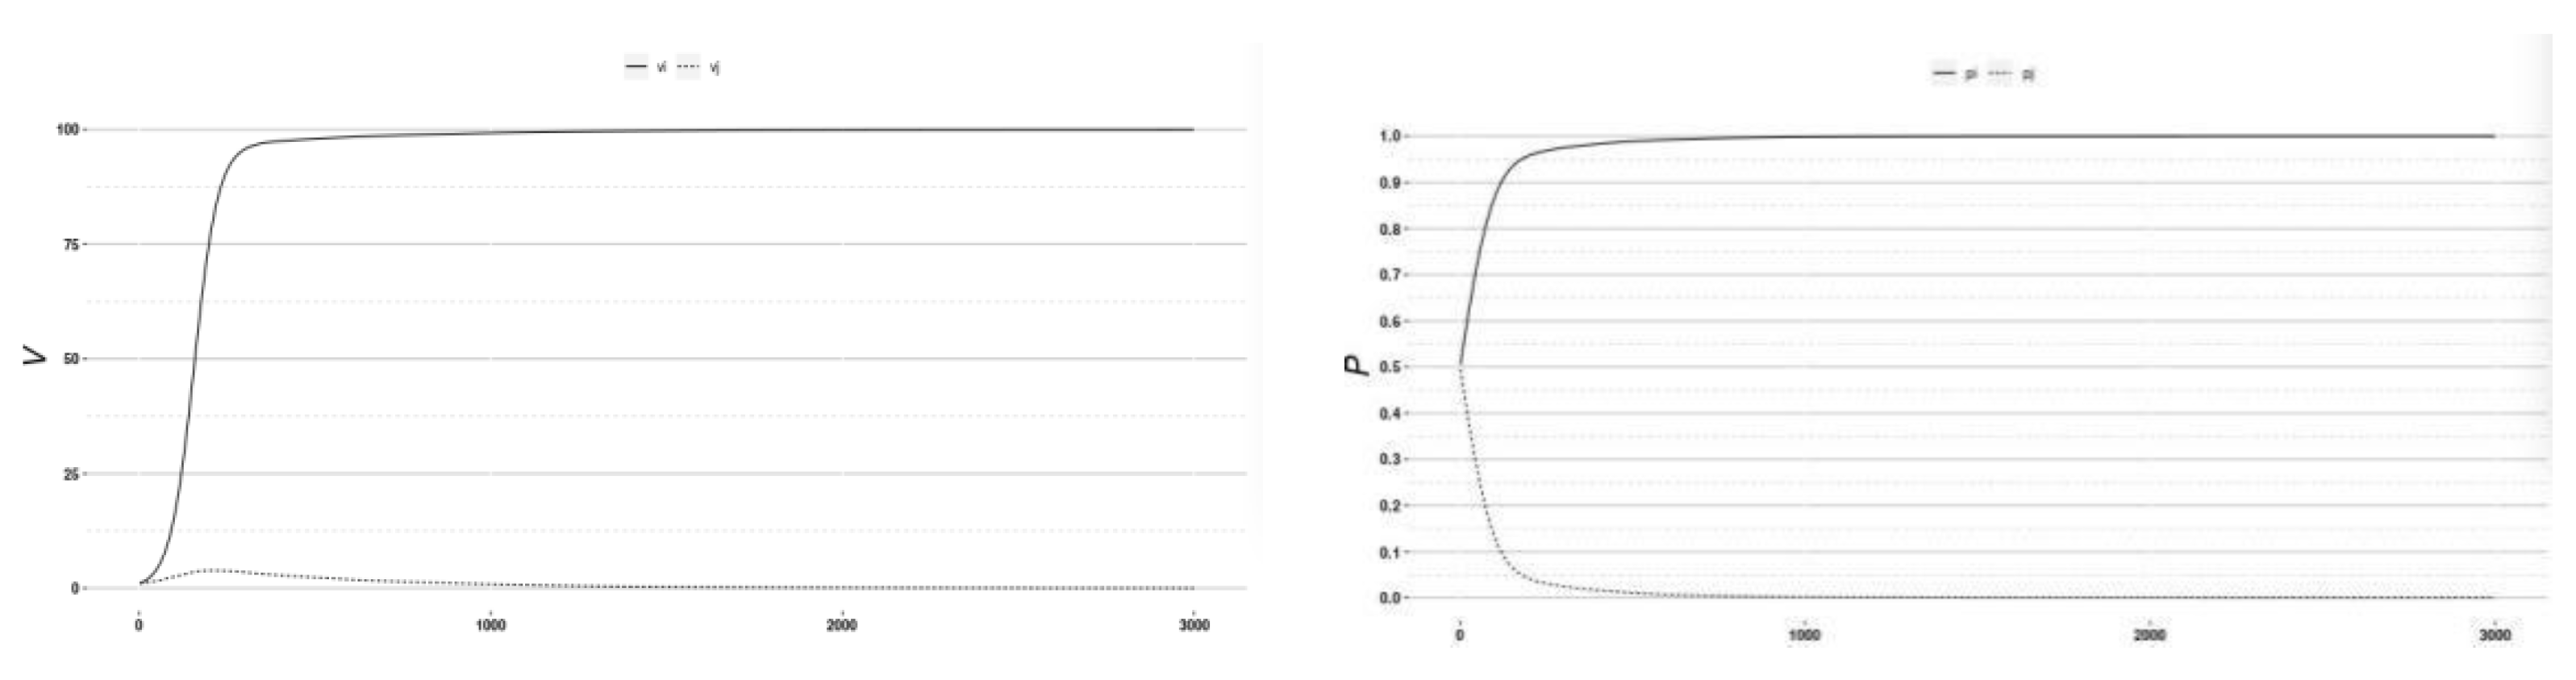
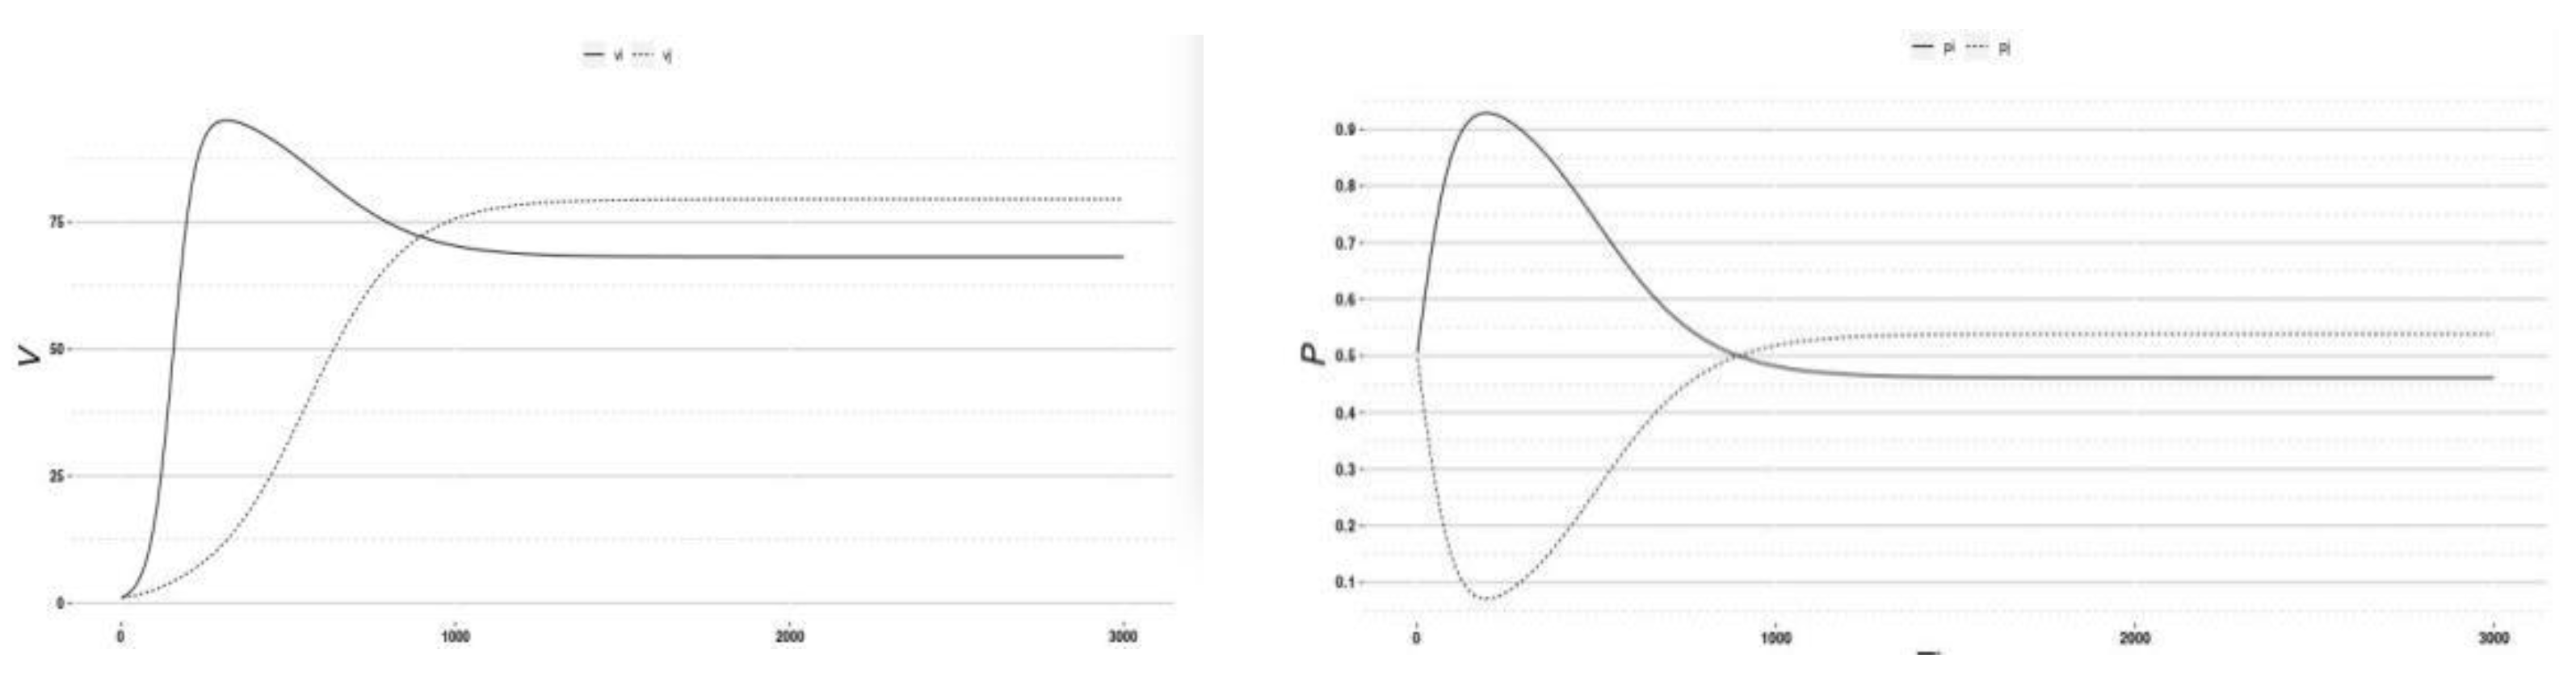
4.6. Simulation of Asymmetric Reciprocal Symbiosis Model

Asymmetrical reciprocal symbiosis is actually an asynchronous evolution, which brings great instability. One of the patterns is that the influence on resource agent i by resource agent j is higher than that of resource agent i on resource agent j, because the internal growth rate of i is greater than that of j, so the population density of i grows faster, and the population density of j first rises and then falls. These patterns are reflected in the changes of the strategy’s dynamic selection curve: in Figure 9, for i, the curve of the strategy selection continues to rise and tends to 1, so i sticks to the strategy, while j shows a continuous decline in the strategy selection, tending to 0, indicating that j gives up the strategy.
The second of the patterns is that the influence of resource agent i on resource agent j is higher than that of resource agent j on resource agent i, because the internal growth rate of i is greater than that of j, so the population density of i first rises and then falls, and the population density of j first rises slowly and then grows more quickly. These patterns are reflected in the changes of the strategy’s dynamic selection curve: as shown in Figure 10, for i, the curve of the strategy selection tends to first rise and then fall, so i tends to give up the strategy, while for j, the curve of the strategy selection tends to first fall and then rise, indicating that j tends to choose the strategy.

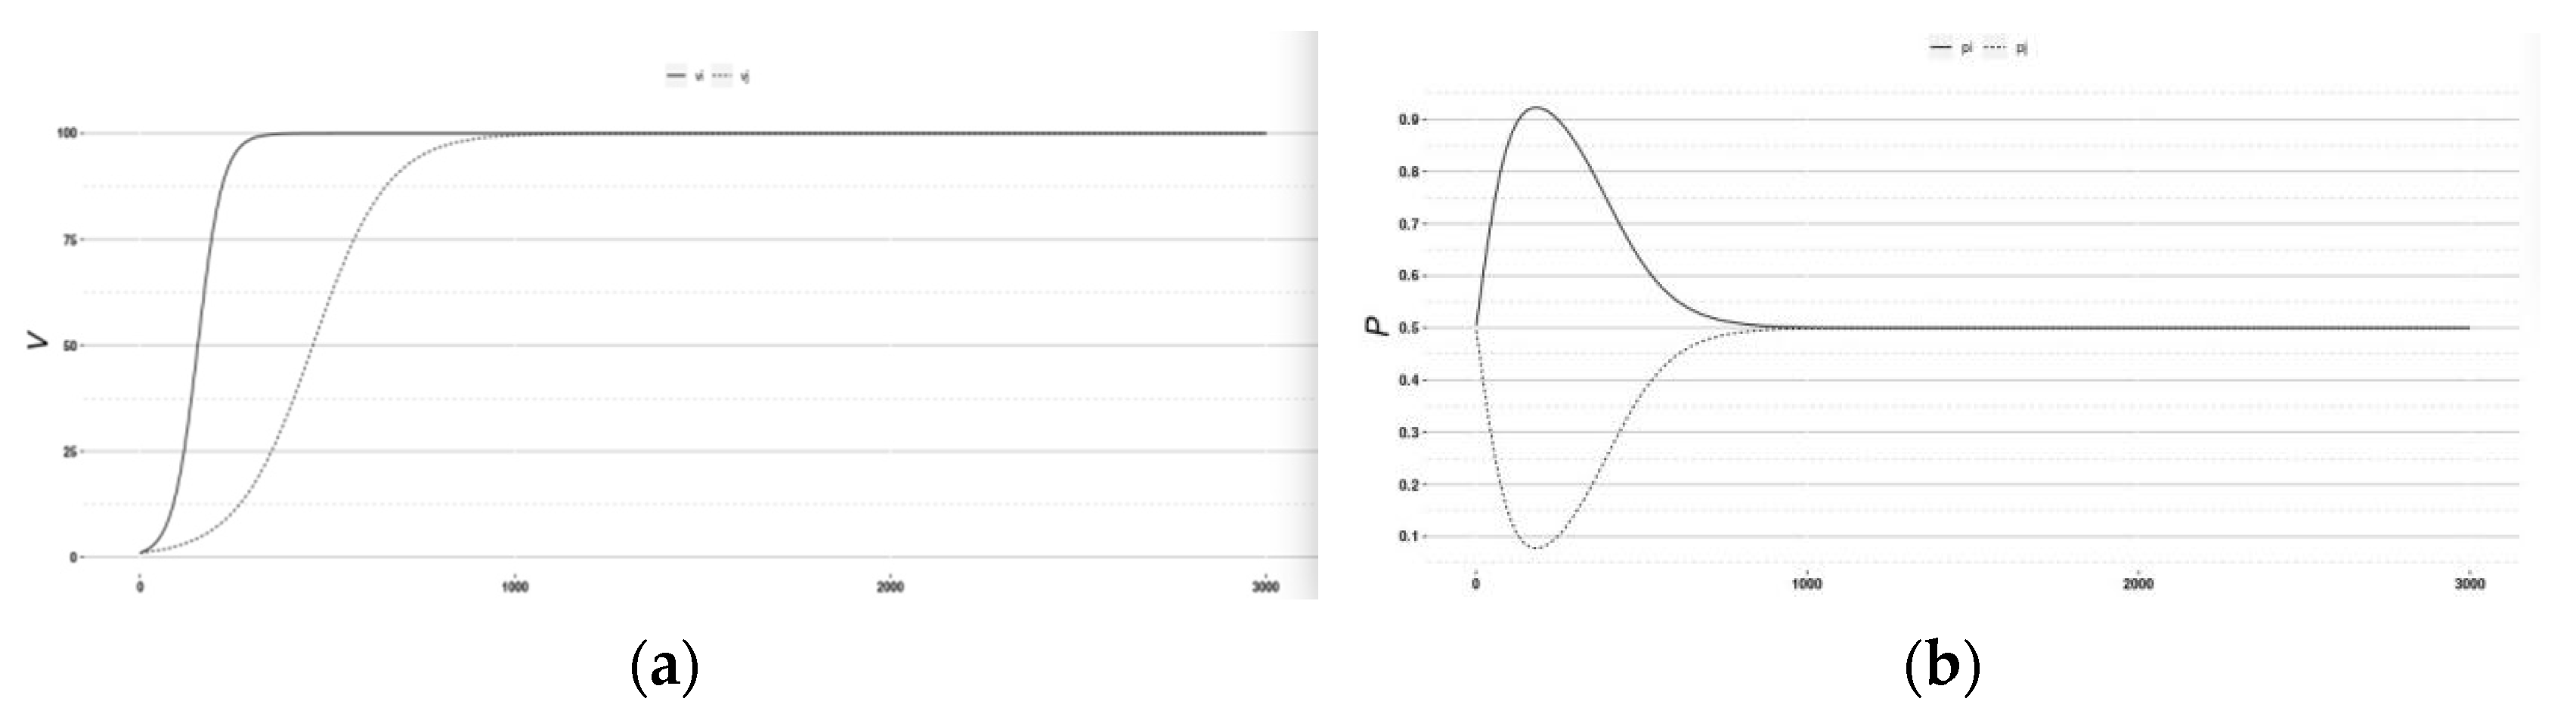
4.7. Simulation of a Similar Reciprocal Symbiosis Model

Similar to the reciprocal symbiosis model, both i and j will influence each other, and the degree of influence is weak; that is, the dependency coefficient is less than 1. In this model, the population density curve and the dynamic strategy selection curve of the two resource subjects are basically synchronized, but they are slightly different because of the different degree of influence between i and j. The i population density curve shows the trend of rapid growth and then decline, while the j population density curve shows a steady growth trend; but the trends of both i and j are synchronous, and the j population density curve is below that of i. These patterns are reflected in the changes of the strategy’s dynamic selection curve; as shown in Figure 11, there are fluctuations in i and early in j that show that the frequency of i increases rapidly, whereas the frequency of j decreases rapidly; then i decreases steadily to 0.6, while j rises to 0.4. Overall, the strategy is slightly beneficial to i.
When resource agent j is slightly affected by i, the i population density curve shows a trend of rapid growth first and then tends to decrease, while the j population density curve shows a rapid growth trend and exceeds the i curve at about 1000 iterations, but the trends of both i and j are synchronous. These patterns are reflected in the changes of the strategy’s dynamic selection curves; as shown in Figure 12, the frequency of i rises first and then decreases, while the frequency of j decreases first and then rises and exceeds the i curve at about 1000 iterations. Overall, the strategy is slightly beneficial to j.

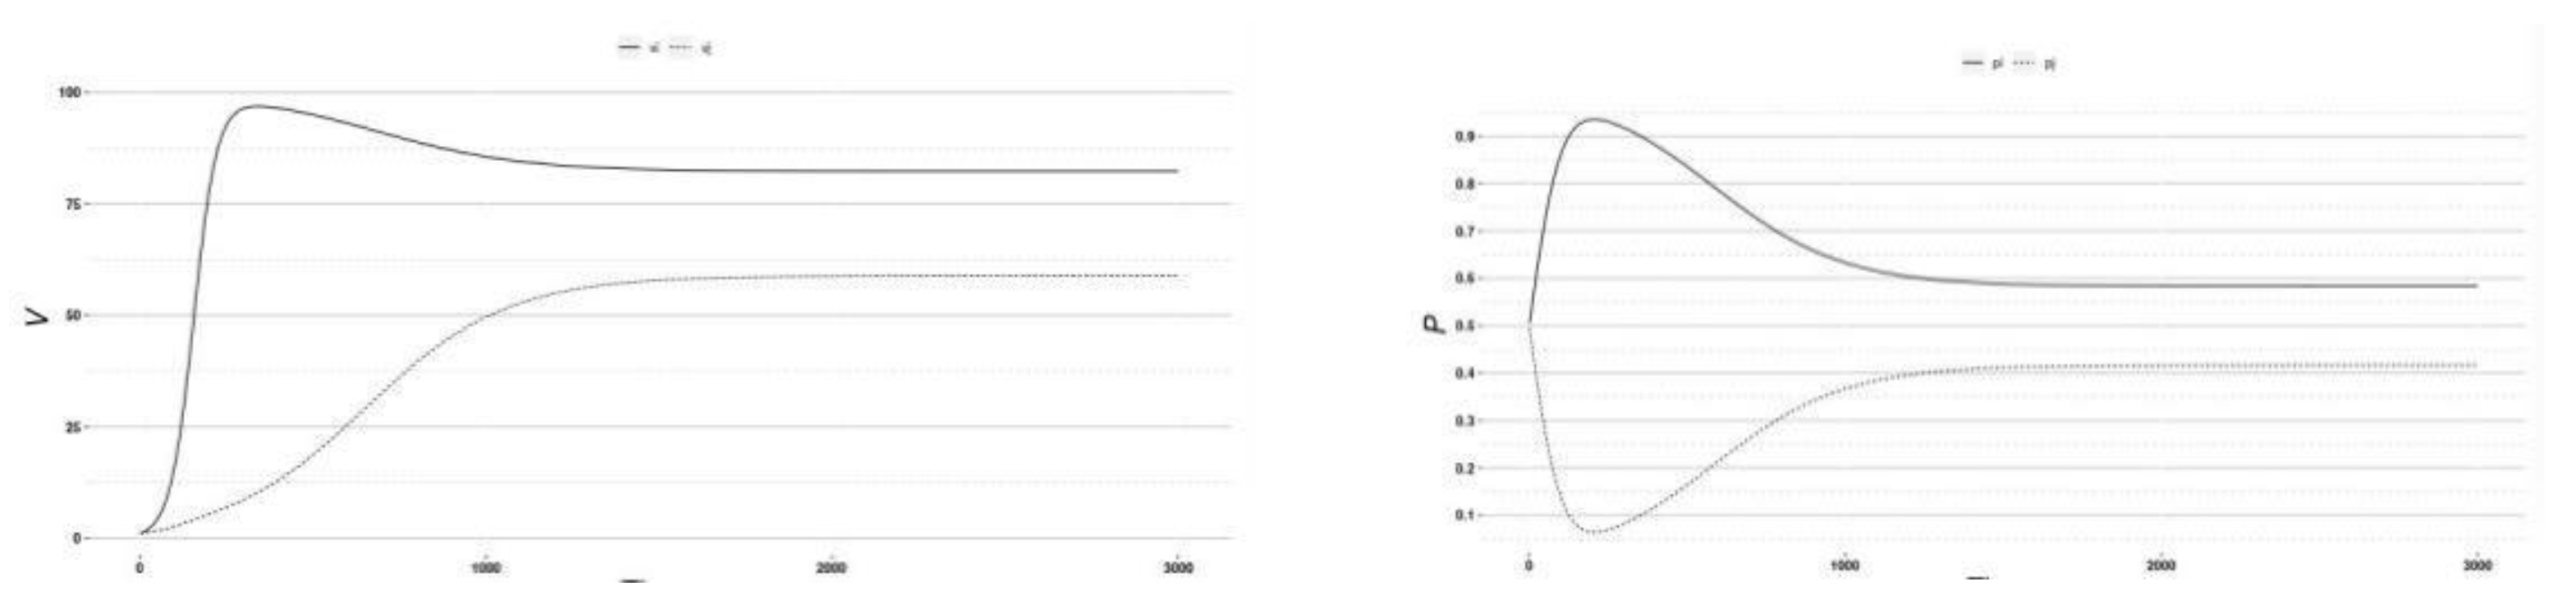
4.8. Simulation of Symmetric Reciprocal Symbiosis Model

The symmetric reciprocal symbiosis model describes two resource agents with the same influence on each other and the interdependence coefficient of less than 1, which is an ideal state. In this state, the population density of resource agent i increases rapidly and then decreases, and the population density curve of j increases first slowly and then rapidly, and then the population density curves of the two overlap for thousands of iterations. These patterns are reflected in the changes of the strategy’s dynamic selection curves; as shown in Figure 13, the frequency of i first rises and then falls, while the frequency of j first falls and then rises, and it overlaps with the i curve at a frequency of 0.5 from about 1000 iterations onward, indicating that the selection probabilities of the two resource agents in the strategy are the same. That is, the development opportunities of the two resource entities are equal.

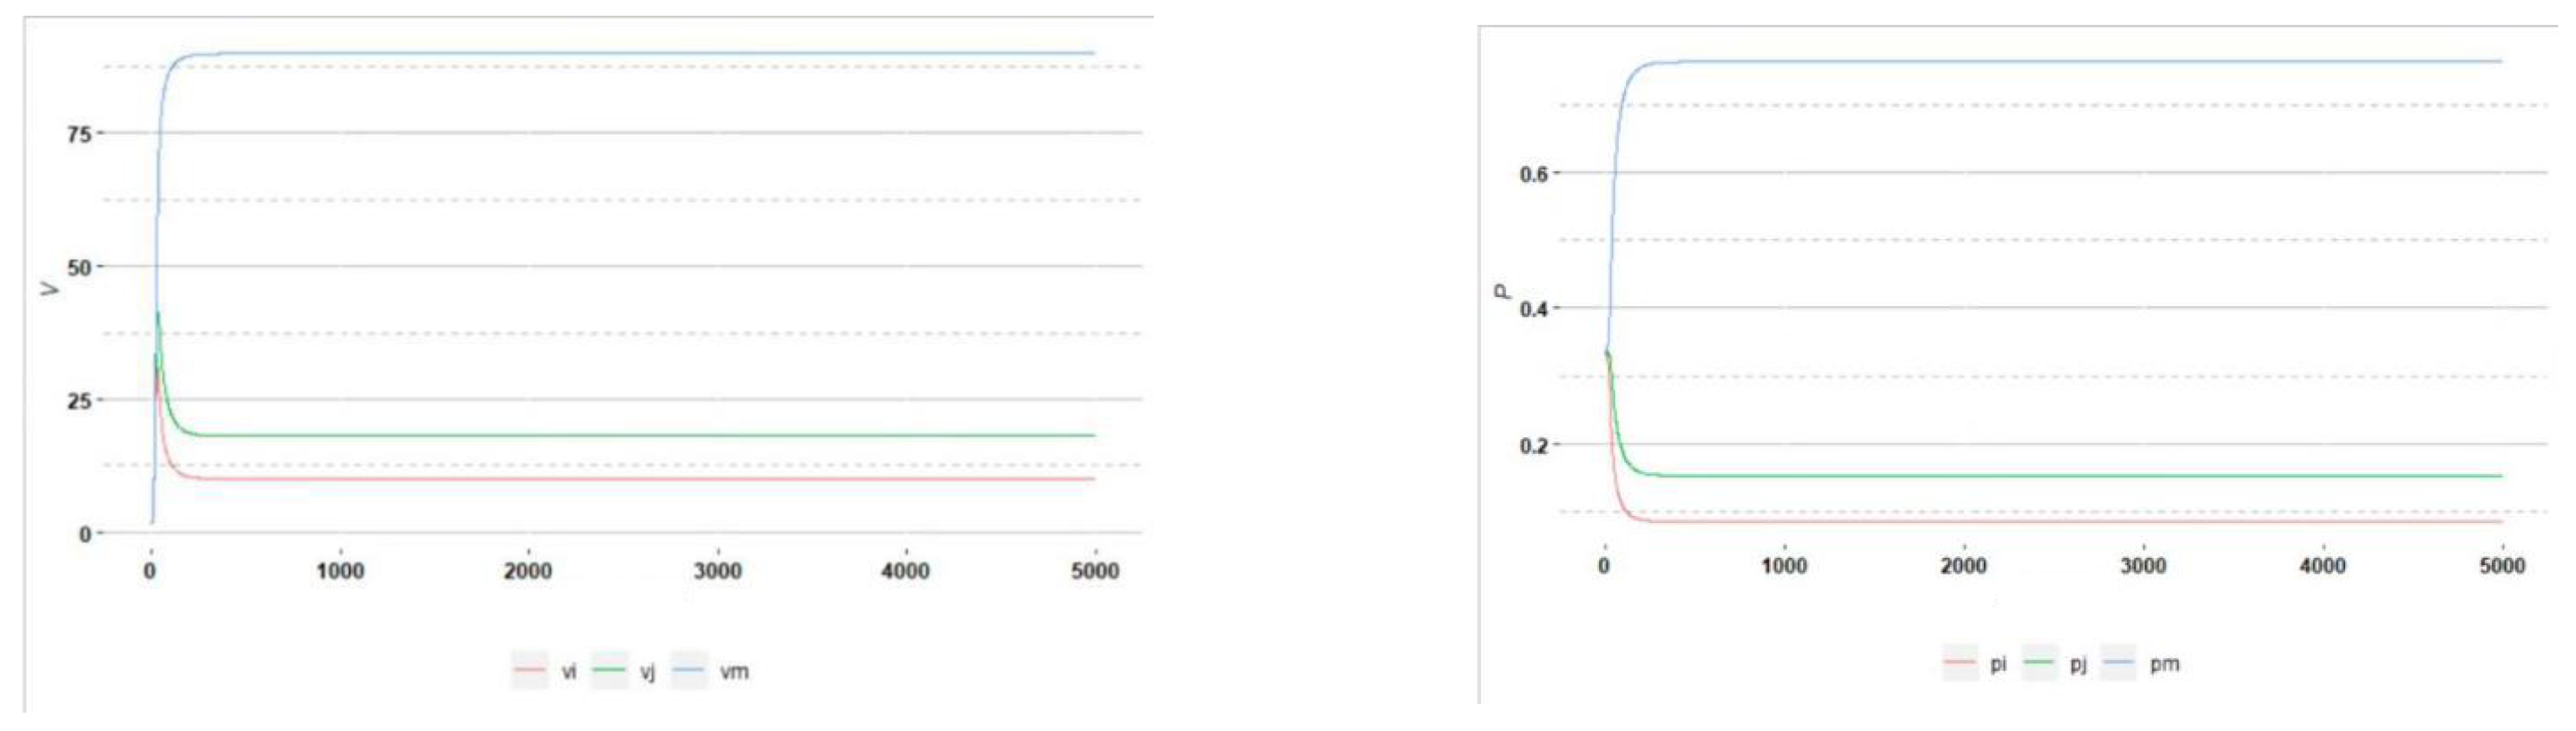
4.9. Simulation of Multiple Resource Agents Model

Simulation of the evolution curve of multiple resource agents’ symbiotic dynamics (in this case, three resource agents) can be established on the basis of that of two resource agents, assuming that the three resource agents have an inherent growth rate of 0.2, the environmental carrying rate is 100, the interdependence coefficient of j on i is 0.1, the interdependence coefficient of m on i is 0.1, the interdependence coefficient of i on j is 0.5, the interdependence coefficient of m on j is 0.5, the interdependence coefficient of i on m is 0.9, and the interdependence coefficient of j on m is 0.9. It can be seen in the Figure 14 that the interdependence coefficient of i is 0.2, the interdependence coefficient of j is 1, and the interdependence coefficient of m is 1.8. That is, the three resource agents are in a symbiotic state; their population density evolution curves and strategy selection curves are shown in Figure 14. This model is obviously beneficial to the resource agent m.

5. Case Study

American nursing homes can provide medical treatment, long-term care, and end-of-life care, which can be seen as a service complex of medical and elderly care [68,69,70]. Moreover, medical care and elderly care in China are separate [71,72]; that is, the division of labor between hospitals and nursing homes is clearly different from that in other countries. Many scholars have borrowed from the American nursing home model and proposed an old-age care model with Chinese characteristics. Scholars have suggested that medical resources and elderly care resources should be organically integrated to provide professional and continuous health care services for the elderly to form a service model that integrates medical care and elderly care [2,73]. The government has also issued a series of policy documents to promote medical care integration (http://www.gov.cn/xinwen/2019-10/26/content_5445271.htm accessed on 25 September 2020). The integration of medical care and elderly care is of great significance to cope with the challenges of aging. How to handle the relationship between hospitals and nursing homes remains to be solved in China. It is also the core duality in the construction of a smart elderly care service ecosystem. Chinese companies represented by JAG (a diversified investment enterprise group, Anhui, Jingan have explored the integration of medical and elderly care and the construction of a smart elderly care service ecosystem.
JAG was established in 2001. It has integrated health care, elderly care services, international trade, financial services, urban public services, real estate development, property management, construction and building materials, and so on. The Health Industry Management Group was one of three major industry sectors in JAG, which was established in 2010. It started with the establishment of JAG Nursing Home and JAG Hospital. By providing more comprehensive and professional elderly care services, it builds the core layer of a smart elderly care service ecosystem based on the combination of medical and elderly care. On this basis, JAG will combine elderly care with the real estate industry and implement the strategy of building a health care complex for the elderly. The health care complex will include the use of the Internet, big data, and other information technology, on site, to implement the integration of institutions, communities, and homes; in terms of services, the integration of medical care, nursing care, and housekeeping will be implemented. In order to achieve this strategy, JAG has successively invested in institutions such as vocational training schools, nursing homes and hospitals in many cities, and other institutions. This investment will help JAG cover the whole field, all the elements, and all the functions of elderly care, and implement the strategies of basic informatization, management informatization, and service informatization to establish the internal ecosystem network of the enterprise. Finally, by establishing a development model of production, education, and research, the social network of the enterprise will be extended.
In the smart elderly care service ecosystem, the relationship between the nursing home and hospital is the most basic dual relationship or symbiosis. While providing medical services to society, JAG Hospital also provides medical security for the elderly care services of JAG Nursing Home. JAG Nursing Home is the geriatrics department of JAG Hospital. It has a geriatrics department stationed on every floor, realizing the integrated medical care and elderly care service model, and it has achieved good performance.
This article intends to introduce the hospital–nursing home symbiosis into the evolution model constructed in the previous sections, using a case analysis of JAG, which fits the model to a certain extent and meets the two basic assumptions. First, hospitals and nursing homes are the two main resource entities in the smart elderly care service ecosystem, and the acquisition and changes of their operating income are related to factors such as resource input, the symbiotic relationship of nursing homes or hospitals, information technology innovations, institutional arrangements, market competition, and so on. Both hospital and nursing home incomes are functions of time t and have an upper limit of allowable resources under certain conditions, which meets the first assumption. Second, the JAG medical and elderly care integration model is actually the core link in the construction of the smart elderly care service ecosystem. That is to say, since 2011, the type space and strategic space in the JAG medical and elderly care integration service ecosystem have not fundamentally changed, which meets the second assumption. Third, similar to the original logistic growth model, the population density curve of the evolution model of multiple resource symbiosis shows an S-shaped growth over time; that is, it generally shows an upward trend that accelerates first and then decelerates within a certain period of time. However, after a certain point in time, it will decelerate and then accelerate. In this paper, the operating incomes of JAG Nursing Home and JAG Hospital are used as the population density parameters to study the trend and direction of the change curve for the strategy of combining medical care and elderly care, with Figure 15 showing the details. The figure shows that the population density curve changes of nursing homes and hospitals are in line with the original model’s trends.
Next, this paper carries out the model calculation and analysis of the hospital–nursing home symbiosis model.

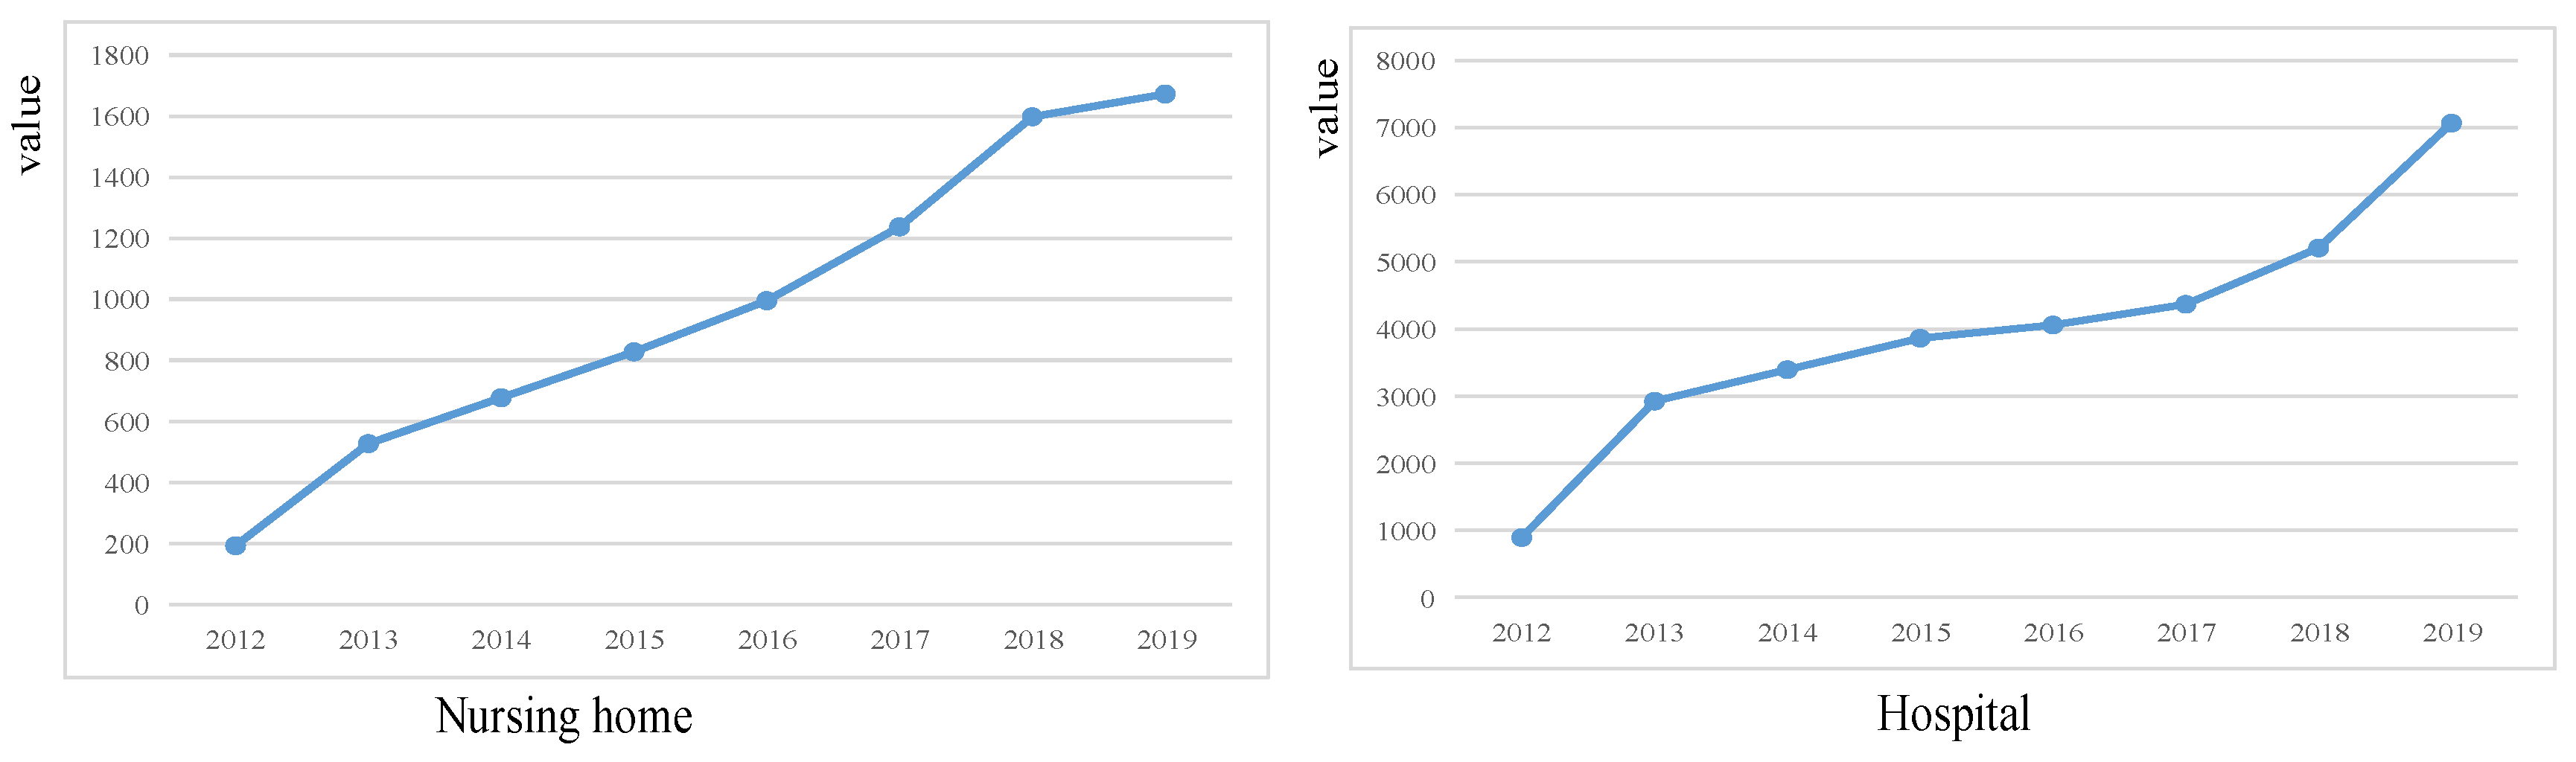
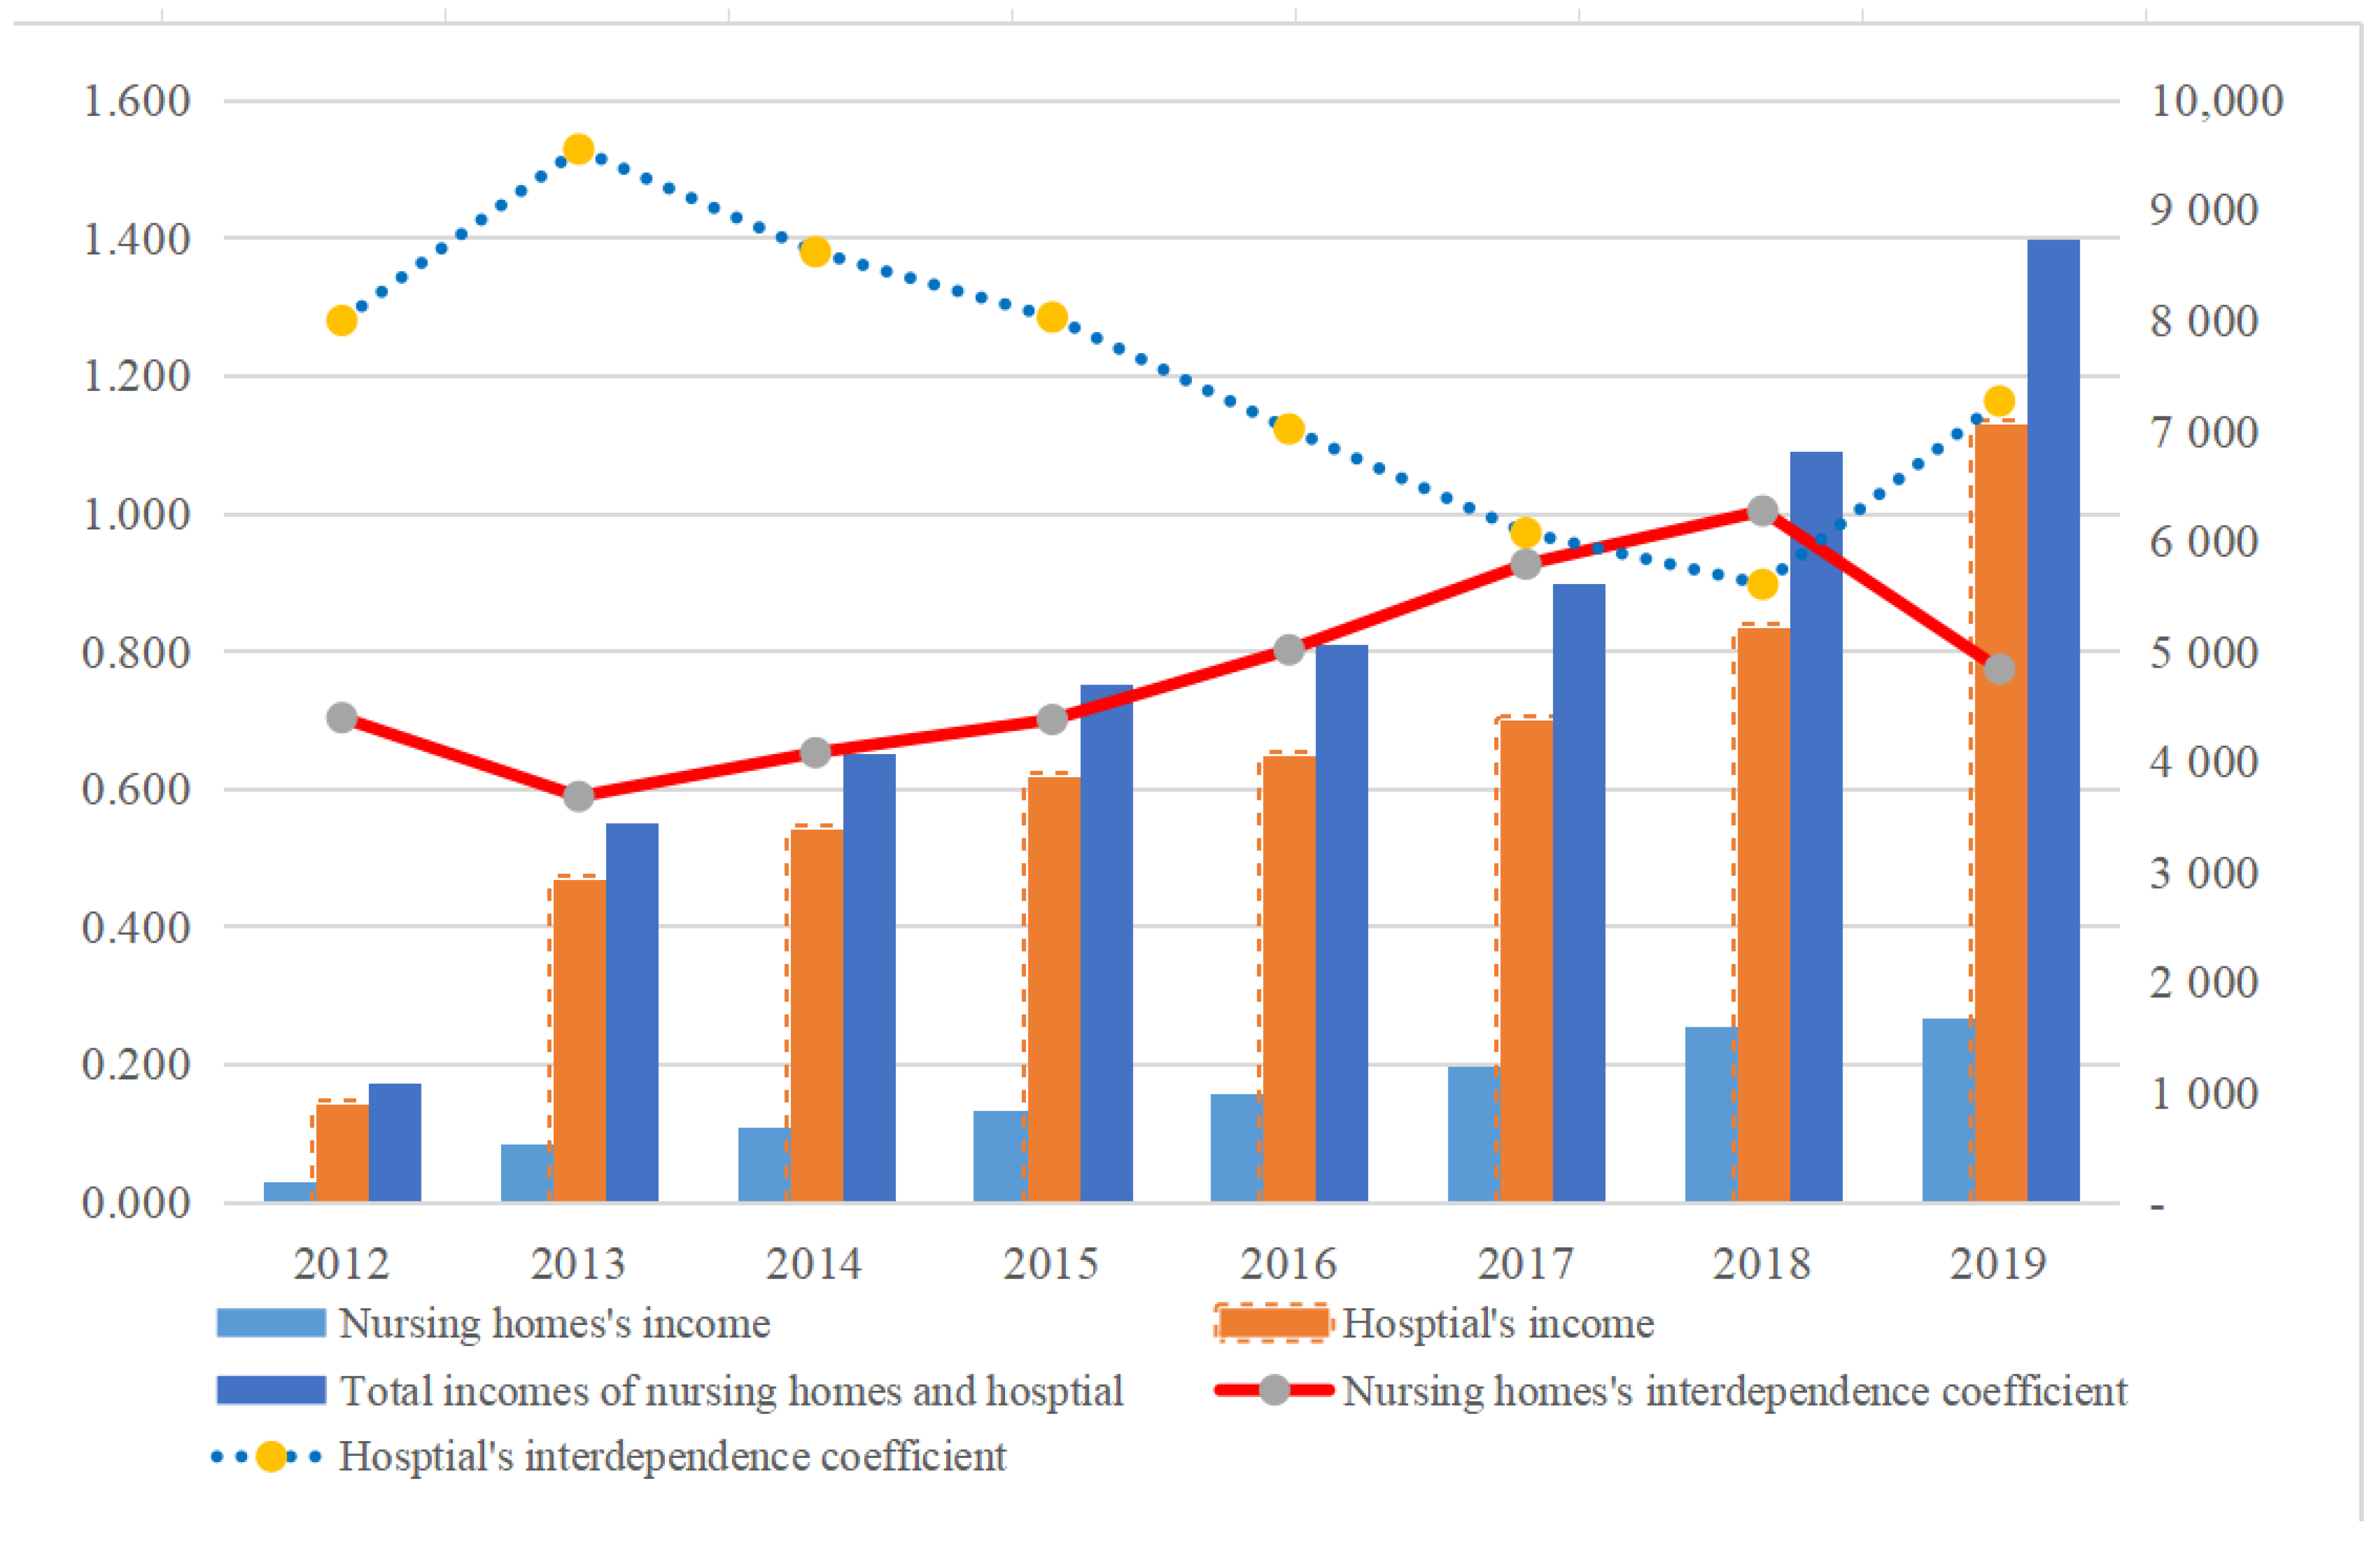
5.1. Estimation of Hospital–Nursing Home Dependence Coefficient

In the model of the evolution of symbiosis, the determination of the dependence coefficient is the key to the model calculation, but there is no unified measurement standard in the existing literature. The dependence coefficient reflects the degree of influence of a species on the population density of another species. The degree of symbiosis in biological symbiosis theory is similar, so this paper uses the degree of symbiosis to estimate the dependence coefficient.
The degree of symbiosis refers to the degree of correlation between the changes of the quality parameters of the two symbiosis units, reflecting the degree of mutual influence of the quality parameters of the two symbiosis units; the quality parameters refer to the parameters that reflect the intrinsic properties of the symbiosis unit. This article selects operating income as the main quality parameter of hospitals and nursing homes. The symbiosis degree δ i j reflects the influence of the change rate of the main quality parameters of nursing homes v i on the change rate of hospitals’ main quality parameters v j . Therefore, the symbiosis degree δ i j is used to estimate the dependence coefficient of hospitals, that is, α j = δ i j (see Equation (20)). Similarly, the symbiosis degree δ j i reflects the influence of the change rate of the main quality parameters of the hospital v j on the change rate of nursing homes’ main quality parameters v i . Therefore, the symbiosis degree δ j i is used to estimate the dependency coefficient of nursing homes, that is, α i = δ j i (see Equation (21)).
α j = δ i j = Δ v i v i / Δ v j v j = d v i v i / d v j v j = d v i d v j × v j v i
where Δ is the difference, which is equal to the difference between the amount of this year and the previous year, and d is the differential, which represents the derivative relationship. The difference is converted into a derivative relationship in the formula, which is convenient for solving by the linear regression method, below.

5.2. Hospital–Nursing Home Population Density Function Relationship and Calculation of Dependence Coefficient

Equations (20) and (21) show that the solution of the dependence coefficient requires the derivative or functional relationship between the operating income of the nursing home v i and the operating income of the hospital v j to establish a linear relationship between the two variables; we then use IBM SPSS STATISTICS 22.0 to perform the linear regression analysis. The pair of functional relations (22) and (23) are obtained, respectively. The coefficient of determination of linear fit or linear regression R 2 is 0.948, which is close to 1, indicating that the two have a good linear fit; the linear regression coefficient is significant at the confidence level of 0.05, which also indicates that the linear fit is reasonable. The standardized residual ZRE on the vertical axis and the operating income of the nursing home or the hospital on the horizontal axis are all around e = 0 random fluctuations, indicating that the fitting effect is good and the linear regression equation is satisfactory.
v j = 816.562 + 3.268 v i
v i = 126.425 + 0.275 v j
In this case study, α i = δ j i = 3.268 v i / v j , α j = δ i j = 0.275 v j / v i , and α i α j = 0 . 899 < 1 . This paper calculated and analyzed the JAG hospital–nursing home symbiosis behavior pattern, as shown in Table 2.

5.3. Analysis of Hospital–Nursing Home Symbiosis Behavior Pattern

Table 2 shows that the hospital–nursing home symbiosis behavior pattern from 2012 to 2019 basically belongs to the asymmetric reciprocal symbiosis pattern because of α i α j < 1 . In 2012–2016 and 2019, nursing homes had a greater degree of beneficial influence on hospitals than vice versa and were more beneficial to the hospitals. In 2018, the hospitals had a greater degree of beneficial influence on nursing homes than vice versa and were more beneficial to the nursing homes, and in 2017, the degree of mutual influence between the two parties was basically the same, making the symbiotic relationship between the two similar to the symmetrical and mutually beneficial symbiosis. Expressing the dependence coefficient curves of the two, as shown in Figure 16, shows that the impact on nursing homes under the combined medical care model tends to be positive and shows an upward trend, and the dependence coefficient curves of the two tend to be close; that is, the two population density (income) evolutions tend to be synchronized. In addition, Figure 16 shows that under the asymmetric reciprocal symbiosis model from 2012 to 2019, the incomes of nursing homes and hospitals, and the total income of the medical-care integration, all showed an increasing trend, indicating that a good medical-care symbiosis relationship is beneficial to income growth, and that nursing home and hospitals tend to evolve simultaneously.

6. Conclusions

All participants or resource agents in the service ecosystem have their own independent market goal, which makes it difficult to integrate the goals in the ecosystem. Individuals driven by profit maximization excessively pursue short-term profit maximization, affecting the entire service ecosystem’s realization of the goal of value co-creation. From the perspective of an evolutionary game, this paper uses the logistic growth model to build a model of the symbiotic evolution of multiple resources in the smart elderly care service ecosystem, uses computer simulations to dynamically simulate the model, and comparatively analyzes the population density of the hospital–nursing home symbiotic relationship using real cases in China.
The conclusions and suggestions are as follows: (1) The result of the symbiotic evolution between different resource agents in the smart elderly care service ecosystem depends on the symbiotic interdependence coefficient. (2) The enterprise goal in this ecosystem should be to maximize the overall value of the multiple resource agents. (3) When this ecosystem is viewed using a reciprocal symbiosis model, each resource agent benefits from the activities of the other resource agents, resulting in an increase in environmental capacity. (4) When the symbiotic model of the ecosystem is a competitive model, different resource agents are damaged by each other’s activities, and the environmental capacity is less than the environmental capacity of independent development. (5) When the symbiotic model of the smart elderly care service ecosystem is a parasitic model, the population size of the parasitic resource agent is bigger than that of an independent development, and the size of the other resource agent is smaller than that of an independent development. (6) The strategic choice of resource agent has an important impact on the evolution of the value creation of the smart elderly care service ecosystem. When there is no revenue regulator in the system that can adjust the corresponding revenue distribution rules, the resource agent (in the interest of marketization) will take actions that benefit itself. Therefore, regulation is needed to ensure the relative fairness of the distribution of value co-creation in the smart elderly care service ecosystem, especially for resource agents that have short-term returns. (7) The case of JAG shows that it is reasonable to use the symbiotic evolution model constructed in this article to analyze the symbiotic relationship between the key resource agents of the smart elderly care service ecosystem.
The symbiosis of multiple resources is an inevitable product of the development of the smart elderly care service ecosystem, up to a certain stage. This ecosystem is a complex system of economic factors and social factors interacting together. Under the action of many factors, the evolution of this ecosystem appears as a complex behavior and trajectory. Therefore, in the next step of this research, we plan to study the following aspects: (1) We will use game theory and system dynamics theory to study the benefit allocation criteria of multiple resource agents in the smart elderly care service ecosystem, and verify the effectiveness of the model of dynamic symbiotic evolution constructed in this paper. (2) In the future, we will study the impact of strategy changes by introducing a mutation mechanism and then obtain a continuous replicator-dynamic mutant model. (3) The smart elderly care service ecosystem needs certain institutional support to maximize its system benefits; that is, the institutions and institutional arrangements in the smart elderly care service ecosystem are of great significance for studying the value co-creation and symbiosis of multiple resource agents. Social network analysis can be used in the future to study how the relationship between different social situations and reward and punishment mechanisms affect the behavior of multiple resource agents, and how the behavior of resource agents further affects the results of value co-creation.

Author Contributions

Conceptualization, C.Z. (Chi Zhang), C.L. and C.Z. (Chao Zhang); methodology, C.Z. (Chi Zhang) and C.Z. (Chao Zhang); investigation, C.Z. (Chi Zhang) and Y.M.; formal analysis, C.Z. (Chi Zhang), C.L. and C.Z. (Chao Zhang); writing—original draft preparation, C.Z. (Chi Zhang) and C.Z. (Chao Zhang); writing—review and editing, C.Z. (Chi Zhang) and Y.M.; funding acquisition, C.L. and C.Z. (Chao Zhang). All authors have read and agreed to the published version of the manuscript.

Funding

This paper is supported by the National Natural Science Foundation of China (71771075), Research on Humanities and Social Sciences of the Ministry of Education (20YJC630203), and Project of the Natural Science Foundation of Anhui Province (2008085QC340).

Data Availability Statement

The data presented in this study are available on request from the corresponding author. The data are not publicly available due to third-party, commercial, or privacy restrictions.

Conflicts of Interest

The authors declare that they have no conflict of interest.

References

  1. World Health Organization. World Health Statistics; World Health Organization: Geneva, Switzerland, 2015. [Google Scholar]
  2. Chen, L.; Zhang, J.; Fu, W. Health-promoting lifestyles and their related influences among nursing assistants in nursing homes in China. Appl. Nurs. Res. 2018, 39, 97–102. [Google Scholar] [CrossRef] [PubMed]
  3. Jiang, Q.B.; Sanchexz-Barricarte, J.J. The 4-2-1 family structure in China: A survival analysis based on life tables. Eur. J. Ageing 2011, 8, 119–127. [Google Scholar] [CrossRef] [PubMed] [Green Version]
  4. Li, M. Pension institution situation and investigation. J. Work. Guide 2016, 1, 43–47. [Google Scholar]
  5. Kuo, M.-H.; Wang, S.-L.; Chen, W.-T. Using information and mobile technology improved elderly home care services. Health Policy Technol. 2016, 5, 131–142. [Google Scholar] [CrossRef]
  6. Pekkarinen, S.; Melkas, H. Digitalisation in health care and elderly care services: From potholes to innovation opportunities. Int. J. Inf. Syst. Soc. Chang. 2017, 8, 24–45. [Google Scholar] [CrossRef]
  7. Janse, B.; Huijsman, R.; De Kuyper, R.D.M.; Fabbricotti, I.N. Do integrated care structures foster processes of integration? A quasi-experimental study in frail elderly care from the professional perspective. Int. J. Qual. Health Care 2016, 28, 376–383. [Google Scholar] [CrossRef] [PubMed] [Green Version]
  8. Lusch, R.F.; Vargo, S.L. Service-Dominant Logic: Premises, Perspectives, Possibilities; Cambridge University Press: Cambridge, UK, 2014. [Google Scholar]
  9. Vargo, S.L.; Lusch, R.F. Institutions and axioms: An extension and update of service dominant logic. J. Acad. Mark. Sci. 2016, 44, 5–23. [Google Scholar] [CrossRef]
  10. Lusch, R.F.; Nambisan, S. Service innovation: A service-dominant logic perspective. Manag. Inf. Syst. Q. 2015, 39, 155–171. [Google Scholar] [CrossRef] [Green Version]
  11. Landi, F.; Onder, G.; Russo, A. A new model of integrated home care for the elderly: Impact on hospital use. J. Clin. Epidemiol. 2001, 54, 968–970. [Google Scholar] [CrossRef]
  12. Pinho, N.; Beirão, G.; Patrício, L.; Fisk, R.P. Understanding value co-creation in complex services with many actors. J. Serv. Manag. 2014, 25, 470–493. [Google Scholar] [CrossRef]
  13. Goodman, C.; Dening, T.; Gordon, A.L.; Davies, S.L.; Meyer, J.; Martin, F.C.; Gladman, J.R.F.; Bowman, C.; Victor, C.; Handley, M.; et al. Effective health care for older people living and dying in care homes: A realist review. BMC Health Serv. Res. 2016, 16, 269. [Google Scholar] [CrossRef]
  14. Vargo, S.L.; Lusch, R.F. From repeat patronage to value co-creation in service ecosystems: A Transcending conceptualization of relationship. J. Bus. Mark. Manag. 2010, 4, 169. [Google Scholar] [CrossRef]
  15. Schoonover, H.A.; Grêt-Regamey, A.; Metzger, M.J.; Ruiz-Frau, A.; Santos-Reis, M.; Scholte, S.S.K.; Walz, A.; Nicholas, K.A. Creating space, aligning motivations, and building trust: A practical framework for stakeholder engagement based on experience in 12 ecosystem services case studies. Ecol. Soc. 2019, 24, 11. [Google Scholar] [CrossRef]
  16. Piso, Z.; Goralnik, L.; Libarkin, J.C.; Lopez, M.C. Types of urban agricultural stakeholders and their understandings of governance. Ecol. Soc. 2019, 24, 18. [Google Scholar] [CrossRef] [Green Version]
  17. Ostrom, E. Beyond Markets and States: Polycentric Governance of Complex Economic Systems. Am. Econ. Rev. 2010, 100, 641–672. [Google Scholar] [CrossRef] [Green Version]
  18. Amit, K.A.; Arun, K.K.; Zillur, R. Co-creation of social value through integration of stakeholders. Procedia Soc. Behav. Sci. 2015, 189, 442–448. [Google Scholar]
  19. Pera, R.; Occhiocupo, N.; Clarke, J. Motives and resources for value co-creation in a multi-stakeholder ecosystem: A managerial perspective. J. Bus. Res. 2016, 69, 4033–4041. [Google Scholar] [CrossRef]
  20. Kazadi, K.; Lievens, A.; Mahr, D. Stakeholder co-creation during the innovation process: Identifying capabilities for knowledge creation among multiple stakeholders. J. Bus. Res. 2016, 69, 525–540. [Google Scholar] [CrossRef]
  21. Mayangsaria, L.; Novania, S. Multi-stakeholder co-creation analysis in smart city management: An experience from Bandung, Indonesia. Procedia Manuf. 2015, 4, 315–321. [Google Scholar] [CrossRef] [Green Version]
  22. Singaraju, S.P.; Nguyen, Q.A.; Niininen, O.; Sullivan-Mort, G. Social media and value co-creation in multi-stakeholder systems: A resource integration approach. Ind. Mark. Manag. 2016, 54, 44–55. [Google Scholar] [CrossRef]
  23. Nudurupati, S.S.; Bhattacharya, A.; Lascelles, D.; Caton, N. Strategic sourcing with multi-stakeholders through value co-creation: An evidence from global health care company. Int. J. Prod. Econ. 2015, 166, 248–257. [Google Scholar] [CrossRef] [Green Version]
  24. Vargo, S.L.; Lusch, R.F. It’s all B2B and beyond: Toward a systems perspective of the market. Ind. Mark. Manag. 2011, 40, 181–187. [Google Scholar] [CrossRef]
  25. Akaka, M.A.; Vargo, S.L.; Lusch, R.F. The complexity of context: A service ecosystems approach for international marketing. J. Int. Mark. 2013, 21, 1–20. [Google Scholar] [CrossRef]
  26. Akaka, M.A.; Vargo, S.L. Technology as an operant resource in service (eco) systems. Inf. Syst. E Bus. Manag. 2014, 12, 367–384. [Google Scholar] [CrossRef]
  27. Akaka, M.A.; Vargo, S.L. Extending the context of service: From encounters to ecosystems. J. Serv. Mark. 2015, 29, 453–462. [Google Scholar] [CrossRef] [Green Version]
  28. McColl-Kennedy, J.R.; Cheung, L.; Ferrier, E. Co-creating service experience practices. J. Serv. Manag. 2015, 26, 249–275. [Google Scholar] [CrossRef]
  29. Freeman, E.R. Strategic Management: A Stakeholder Approach; Pitman: Boston, MA, USA, 1984. [Google Scholar]
  30. Anik, M.C.; Giguere, E.F.; Holroyd-Leduc, J.M. Key stakeholders’ views on the quality of care and services available to frail seniors in Canada. BMC Geriatr. 2018, 18, 290. [Google Scholar]
  31. Higgins, J. Social Control Theories of Social Policy. J. Soc. Policy 1980, 9, 1–23. [Google Scholar] [CrossRef]
  32. Friedman, M. The Social Responsibility of Business Is to Increase Its Profits. Corporate Ethics and Corporate Governance 2007, 13, 173–178. [Google Scholar] [CrossRef]
  33. Freeman, R.E.; Phillips, R.A. Stakeholder theory: A libertarian defense. Bus. Ethics Q. 2002, 12, 332–347. [Google Scholar] [CrossRef]
  34. Fama, E.F. Agency problems and the theory of the firm. J. Political Econ. 1980, 88, 34–62. [Google Scholar] [CrossRef]
  35. Grossman, S.J.; Hart, O.D. The costs and benefits of ownership: A theory of vertical and lateral integration. J. Political Econ. 1986, 94, 691–719. [Google Scholar] [CrossRef] [Green Version]
  36. Williamson, O.E. The Economic Institutions of Capitalism: Firms, Markets, Relational Contracting; Free Press: New York, NY, USA, 1985. [Google Scholar]
  37. Mitchell, A.; Wood, D. Toward a theory of stakeholder identification and salience: Defining the principle of who and what really counts. Acad. Manag. Rev. 1997, 22, 853–886. [Google Scholar] [CrossRef]
  38. Kelly, G.; Gamble, A. Owners and Citizens. Political Q. 1998, 69, 344–353. [Google Scholar] [CrossRef]
  39. Ireland, N.J.; Aoki, M. The Co-operative Game Theory of the Firm. Econ. J. 1985, 95, 1109. [Google Scholar] [CrossRef]
  40. O’Connor, M.A. The human capital era: Reconceptualizing corporate law to facilitate labor-management cooperation. Cornell Law Rev. 2003, 78, 899–965. [Google Scholar]
  41. Abdel-Khalik, A.R. Reforming corporate governance post Enron: Shareholder’s Board of Trustees and the auditor. J. Account. Public Policy 2002, 21, 97–103. [Google Scholar] [CrossRef]
  42. Perry, T.; Peyer, U. Board seat accumulation by executives: A shareholder’s perspective. J. Financ. 2005, 60, 2083–2123. [Google Scholar] [CrossRef]
  43. Choi, A.H.; Min, G. Contractarian theory and unilateral bylaw amendments. Iowa Law Rev. 2018, 104, 1–44. [Google Scholar]
  44. Panigrahi, S.K. Economic value added and traditional accounting measures for shareholder’s wealth creation. Asian J. Account. Gov. 2017, 8, 125–136. [Google Scholar]
  45. Romero-Torres, A. Asymmetry of stakeholders’ perceptions as an obstacle for collaboration in inter-organizational projects: The case of medicine traceability projects. Int. J. Manag. Proj. Bus. 2020, 13, 467–482. [Google Scholar] [CrossRef]
  46. Hansen, M.; Fyall, A.; Spyriadis, T.; Rogers, D.; Brander-Brown, J. Motivating stakeholder collaboration within the aerial adventure industry. Int. J. Tour. Res. 2019, 21, 311–322. [Google Scholar] [CrossRef]
  47. Xiaoqian, S.; Yong, G. Social network analysis on industrial symbiosis: A case of Gujiao eco-industrial park. J. Clean. Prod. 2018, 193, 414–423. [Google Scholar]
  48. Jie, X.; Sheng, N.T. Modelling and analysis of a symbiotic waste management system. Int. J. Prod. Res. 2017, 55, 5355–5377. [Google Scholar]
  49. Junnian, W.; Rong, J. Exploring the impact of symbiotic measures on the evolution of structure and function of the iron and steel industrial symbiosis network. J. Clean. Prod. 2020, 273, 122990. [Google Scholar]
  50. Verhulst, P.F. Notice sur la loi que la population suit dans son accroissement. Curr. Math. Phys. 1838, 10, 113. [Google Scholar]
  51. Tsoularis, A.; Wallace, J. Analysis of logistic growth models. Math. Biosci. 2002, 179, 21–55. [Google Scholar] [CrossRef] [Green Version]
  52. Vincent, T.L.; Brown, J.S. Evolutionary Game Theory, Natural Selection, and Darwinian Dynamics; Cambridge University Press: Cambridge, UK, 2005. [Google Scholar]
  53. Pinheiro, S. Optimal harvesting for a logistic growth model with predation and a constant elasticity of variance. Ann. Oper. Res. 2016, 260, 461–480. [Google Scholar] [CrossRef]
  54. Hsieh, S.-C. Analyzing urbanization data using rural–urban interaction model and logistic growth model. Comput. Environ. Urban Syst. 2014, 45, 89–100. [Google Scholar] [CrossRef]
  55. Fisher, T.C.; Fry, R.H. A simple substitution model of technological change. Technol. Forecast. Soc. Chang. 1971, 3, 75. [Google Scholar]
  56. Marchetti, C.; Nakicenovic, N. The Dynamics of Energy Systems and the Logistic Substitution Model; International Institute for Applied Systems Analysis: Laxenburg, Austria, 1980. [Google Scholar]
  57. Herman, R.; Montroll, E.W. A manner of characterizing the development of countries. Proc. Nat. Acad. Sci. USA 1972, 69, 3019–3023. [Google Scholar] [CrossRef] [Green Version]
  58. Neven, L. By any means? Questioning the link between gerontechnological innovation and older people’s wish to live at home. Technol. Forecast. Soc. Chang. 2015, 93, 32–43. [Google Scholar] [CrossRef]
  59. Verdegem, P.; Marezl, D. Rethinking determinants of ICT acceptance: Towards an integrated and comprehensive overview. Technovation 2011, 31, 411–423. [Google Scholar] [CrossRef] [Green Version]
  60. Sobhy, D.; El-Sonbaty, Y.; Elnasr, M.A. MedCloud: Healthcare cloud computing system. Internet Technology and Secured Transactions. In Proceedings of the 2012 International Conference for Internet Technology and Secured Transactions, London, UK, 10–12 December 2012; IEEE: New York, NY, USA, 2012; pp. 161–166. [Google Scholar]
  61. Giles, L.C.; Glonek, G.F.V.; Luszcz, M.A.; Andrews, G.R. Do social networks affect the use of residential aged care among older Australians? BMC Geriatr. 2007, 7, 24. [Google Scholar] [CrossRef] [PubMed] [Green Version]
  62. Chan, M.; Campo, E.; Estève, D. Assessment of activity of elderly people using a home monitoring system. Int. J. Rehabil. Res. 2005, 28, 69–76. [Google Scholar] [CrossRef]
  63. Godfrey, M.; Johnson, O. Digital circles of support: Meeting the information needs of older people. Comput. Hum. Behav. 2009, 25, 633–642. [Google Scholar] [CrossRef]
  64. Koopman-Boyden, P.G.; Reid, S.L. Internet/E-mail usage and well-being among 65–84 year olds in New Zealand: Policy implications. Educ. Gerontol. 2009, 35, 990–1007. [Google Scholar] [CrossRef]
  65. Nurkholipah, N.S.; Amarti, Z.; Anggriani, N.; Supriatna, A.K. A fuzzy mathematical model of West Java population with logistic growth model. IOP Conf. Ser. Mater. Sci. Eng. 2018, 1, 332. [Google Scholar] [CrossRef] [Green Version]
  66. Zhu, W.D.; Zhang, C.; Wu, Y.; Ku, Q.; Zhang, F. Research on Evolving Dynamic Model of Labor-Capital Symbiotic Between Employees and Shareholders: Based on Value-Added and Stakeholder Theory. J. Manag. Sci. China 2019, 22, 112–126. (In Chinese) [Google Scholar]
  67. Wang, D.; Zhu, W.; Zhang, C.; Li, H.; Wu, A.Y. Stakeholder Symbiosis in the Context of Corporate Social Responsibility. Symmetry 2020, 12, 1897. [Google Scholar] [CrossRef]
  68. Castle, N.G.; Lowe, T.J. Report cards and nursing homes. Gerontologist 2005, 45, 48–67. [Google Scholar] [CrossRef] [Green Version]
  69. Mukamel, D.B.; Amin, A.; Weimer, D.L.; Sharit, J.; Ladd, H.; Sorkin, D.H. When patients customize nursing home ratings, choices and rankings differ from the government’s version. Health Aff. 2016, 35, 714–719. [Google Scholar] [CrossRef] [PubMed]
  70. Kirsebom, M.; Hedström, M.; Pöder, U.; Wadensten, B. General practitioners’ experiences as nursing home medical consultants. Scand. J. Caring Sci. 2017, 31, 37–44. [Google Scholar] [CrossRef] [PubMed] [Green Version]
  71. World Bank. Live Long and Prosper: Aging in East. Asia and Pacific; World Bank: Washington, DC, USA, 2016. [Google Scholar]
  72. Matsuda, S.; Yamamoto, M. Long-term care insurance and integrated care for the aged in Japan. Int. J. Integr. Care 2001, 1, e28. [Google Scholar] [CrossRef] [PubMed] [Green Version]
  73. Lu, B.; Mi, H.; Zhu, Y.; Piggott, J. A Sustainable Long-Term Health Care System for Aging China: A Case Study of Regional Practice. Health Syst. Reform 2017, 3, 182–190. [Google Scholar] [CrossRef] [PubMed] [Green Version]
Figure 1. The independent symbiotic model. (a) α i = 0 , (b) α j = 0 .
Symmetry 13 00570 g001
Figure 2. One of the parasitic symbiosis models; the value is (3, −3).
Symmetry 13 00570 g002
Figure 3. One of the parasitic symbiosis models; the value is (−3, 2).
Symmetry 13 00570 g003
Figure 4. The competitive symbiosis model; the value is (−0.3, −0.8).
Symmetry 13 00570 g004
Figure 5. One of the partial harm symbiosis models; the value is (0, −3).
Symmetry 13 00570 g005
Figure 6. One of the partial harm symbiosis models; the value is (−3, 0).
Symmetry 13 00570 g006
Figure 7. One of the partial benefit symbiosis models; the value is (0, 1).
Symmetry 13 00570 g007
Figure 8. One of the partial benefit symbiosis models; the value is (0.5, 0).
Symmetry 13 00570 g008
Figure 9. One of the asymmetric reciprocal symbiosis models; the value is (1.2, 0.8).
Symmetry 13 00570 g009
Figure 10. One of the asymmetric reciprocal symbiosis models; the value is (0.6, 1.2).
Symmetry 13 00570 g010
Figure 11. One of the similar reciprocal symbiosis models; the value is (0.5, 0.3).
Symmetry 13 00570 g011
Figure 12. One of the similar reciprocal symbiosis models; the value is (0.3, 0.5).
Symmetry 13 00570 g012
Figure 13. The symmetric reciprocal symbiosis model; the value is (0.3, 0.3).
Symmetry 13 00570 g013
Figure 14. The multiple resources symbiotic behavior model.
Symmetry 13 00570 g014
Figure 15. The population density function curves of nursing homes and hospitals.
Symmetry 13 00570 g015
Figure 16. Change of incomes under the dynamic evolution of the hospital–nursing home symbiotic relationship.
Symmetry 13 00570 g016
Table 1. Two resource agents′ symbiosis behavior modes under different values of interdependence coefficients.
Interdependence CoefficientEquilibrium PointsSymbiosis Behavior ModeRemarks
α i , α j 0 α i = 0 , α j = 0 ( k i , k j ) Independent symbiosis Cannot exist in the long term
α i = 0 , α j > 0 ( k i , k j ( 1 + α j ) )Partial benefit symbiosis
α i > 0 , α j = 0 ( k i ( 1 + α i ) , k j )
α j > 1 , α i < 1 , and α i α j < 1 ( k i ( 1 + α i ) 1 α i α j , k j ( 1 + α j ) 1 α i α j )Asymmetric reciprocal symbiosisAsynchronous evolutions; instability
α j < 1 , α i > 1 , and α i α j < 1
α i , α j < 1 and α i α j Similar reciprocal symbiosisSimilar to equilibrium
α i , α j < 1 and α i = α j Symmetric reciprocal symbiosisSynchronized evolutions
α i , α j 0 α i = 0 , α j < 0 ( k i , k j ( 1 + α j ) )Partial harm symbiosisNon-cooperative win–win model
α i < 0 , α j = 0 ( k i ( 1 + α i ) , k j )
α i > 0 , α j < 0 ( k i ( 1 + α i ) 1 α i α j , k j ( 1 + α j ) 1 α i α j )Parasitic symbiosis
α i < 0 , α j > 0
α i < 0 , α j < 0 Competitive symbiosis
Table 2. Analysis of the symbiotic behavior mode between hospitals and nursing homes.
Year α i α j Interdependence CoefficientSymbiosis Behavior ModeComment
20120.7031.279 0 < α i < 1 , α j > 1 Asymmetric reciprocal symbiosisBeneficial to hospitals
20130.5881.528 0 < α i < 1 , α j > 1 Asymmetric reciprocal symbiosisBeneficial to hospitals
20140.6521.379 0 < α i < 1 , α j > 1 Asymmetric reciprocal symbiosisBeneficial to hospitals
20150.7001.284 0 < α i < 1 , α j > 1 Asymmetric reciprocal symbiosisBeneficial to hospitals
20160.8011.122 0 < α i < 1 , α j > 1 Asymmetric reciprocal symbiosisBeneficial to hospitals
20170.9250.971 0 < α i α j < 1 Similar reciprocal symbiosisSimilar to a balanced
20181.0030.896 α i > 1 , α j < 1 Asymmetric reciprocal symbiosisBeneficial to nursing homes
20190.7731.162 0 < α i < 1 , α j > 1 Asymmetric reciprocal symbiosisBeneficial to hospitals
Publisher’s Note: MDPI stays neutral with regard to jurisdictional claims in published maps and institutional affiliations.

