
A Continuous Cuffless Blood Pressure Estimation Using Tree-Based Pipeline Optimization Tool


Abstract
:1. Introduction
2. Background and Related Works
3. Methods
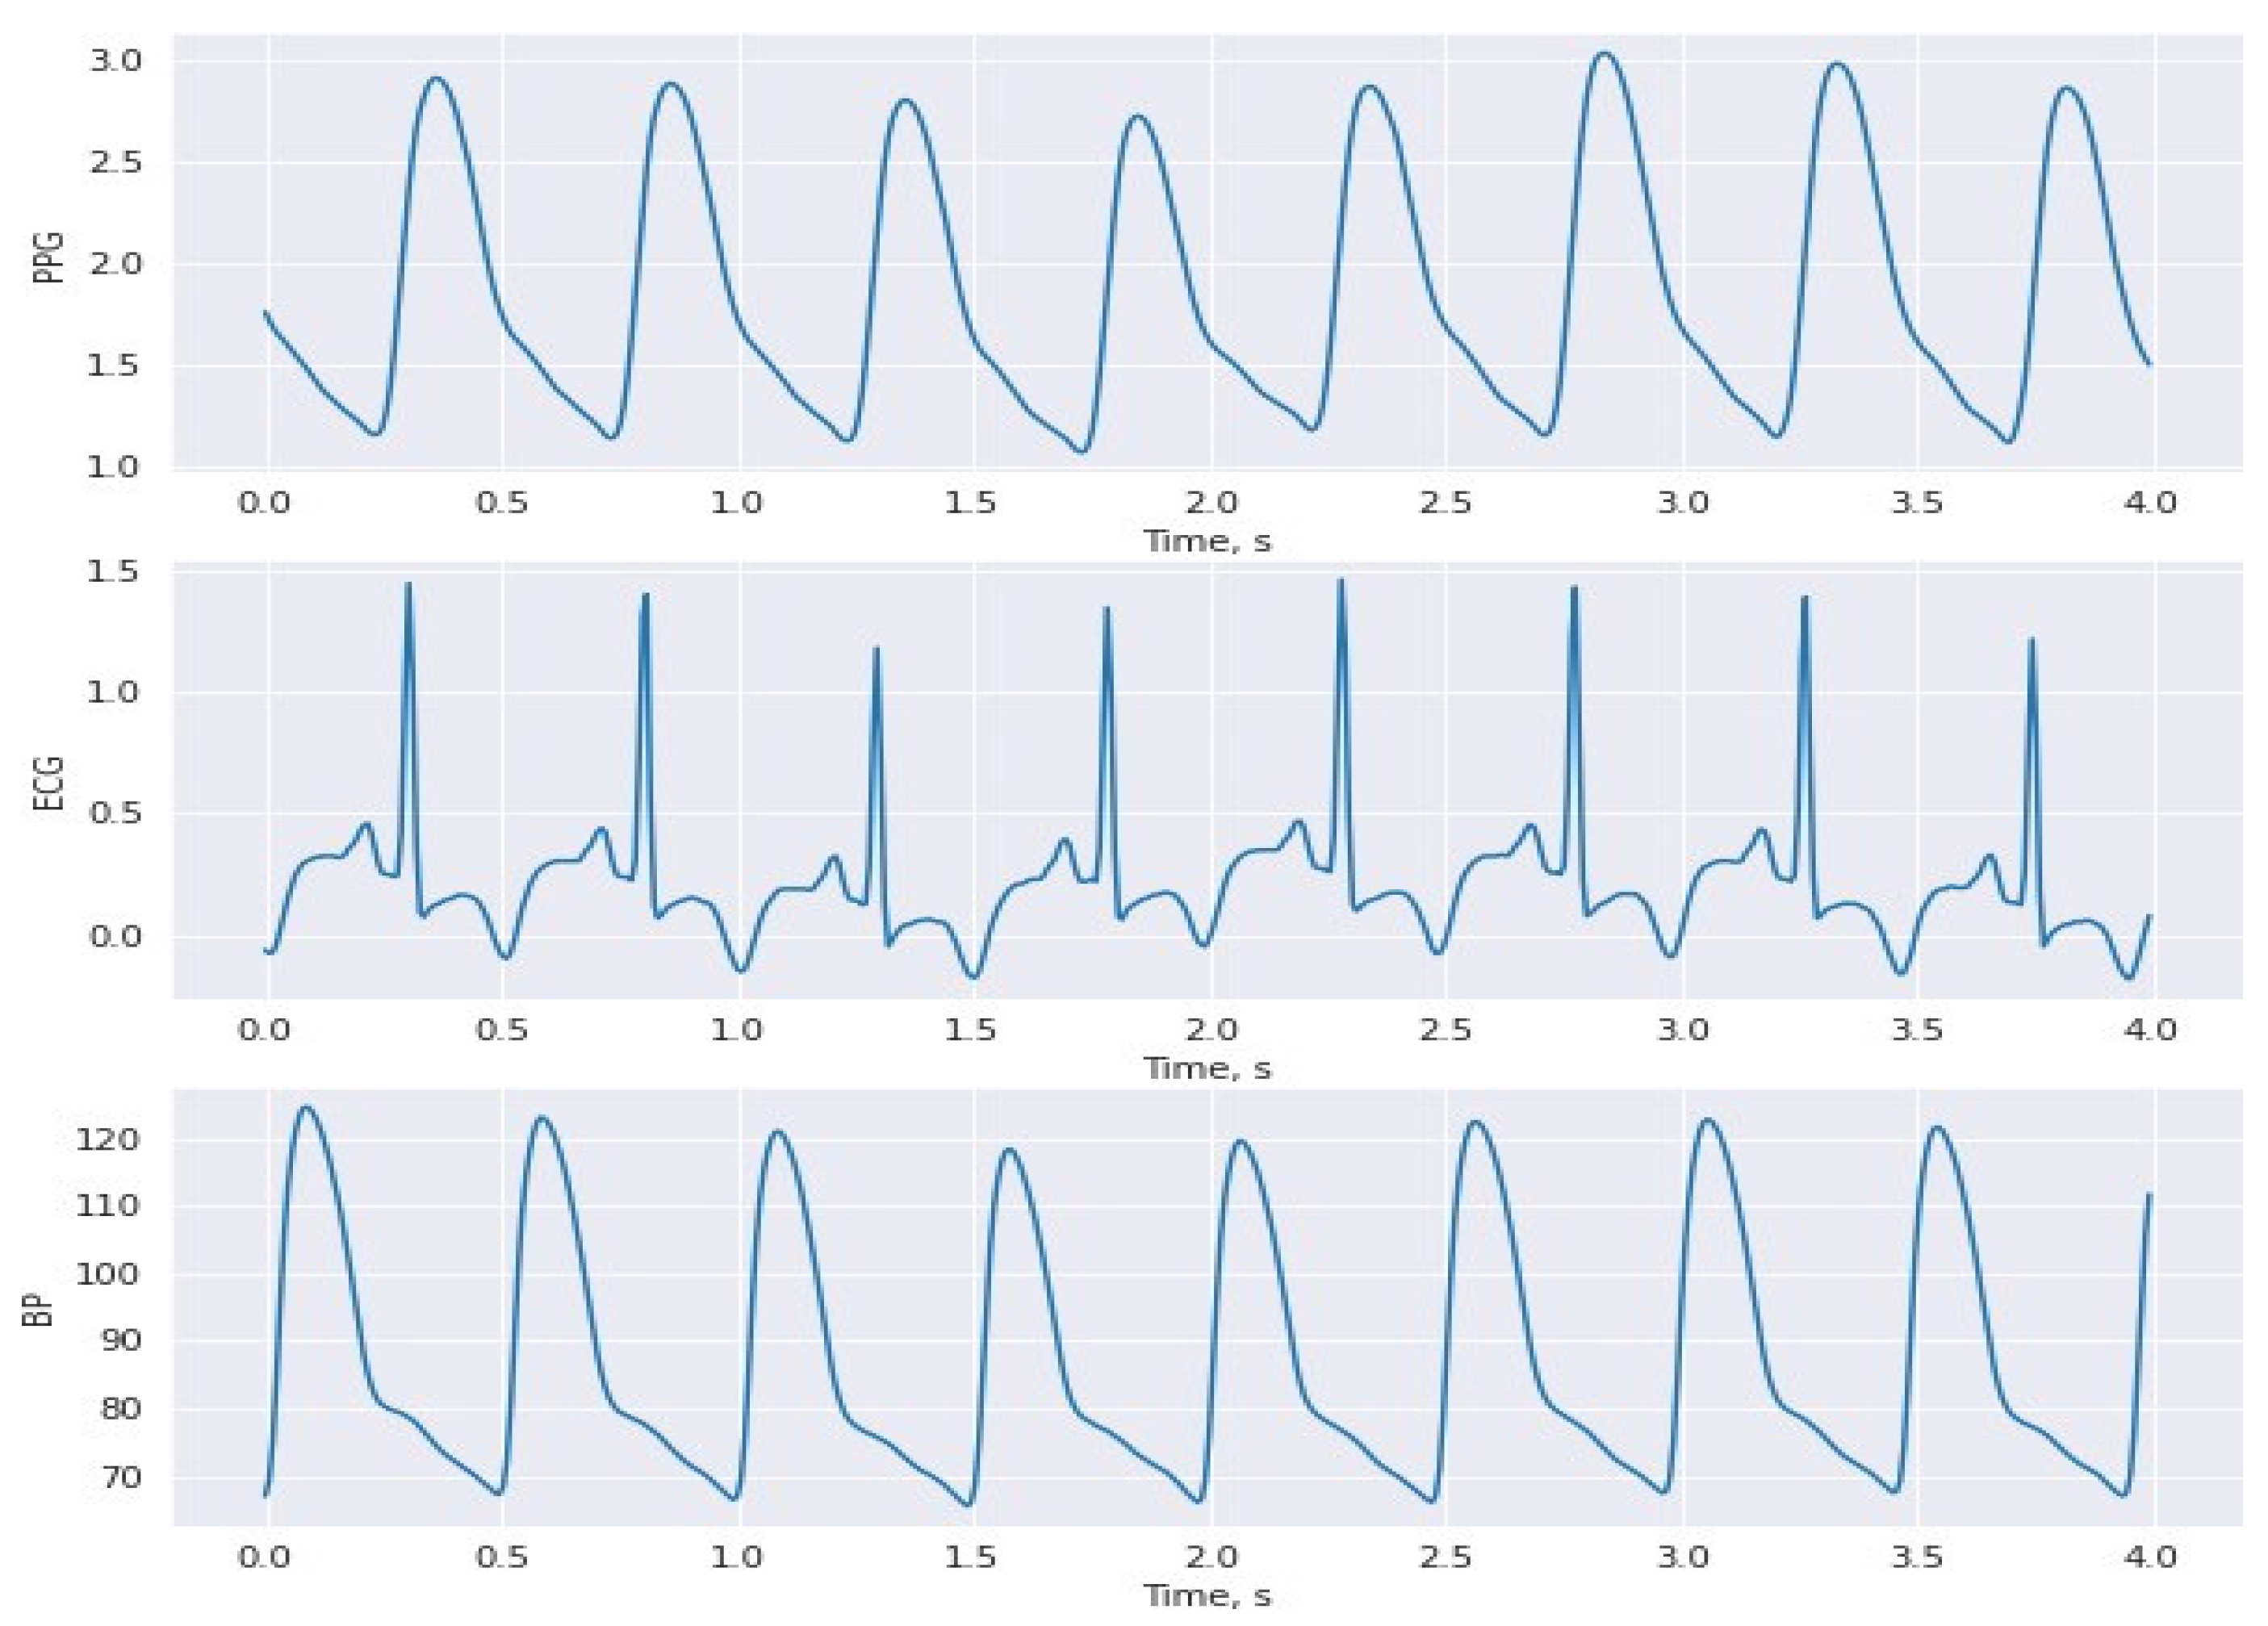
3.1. Dataset
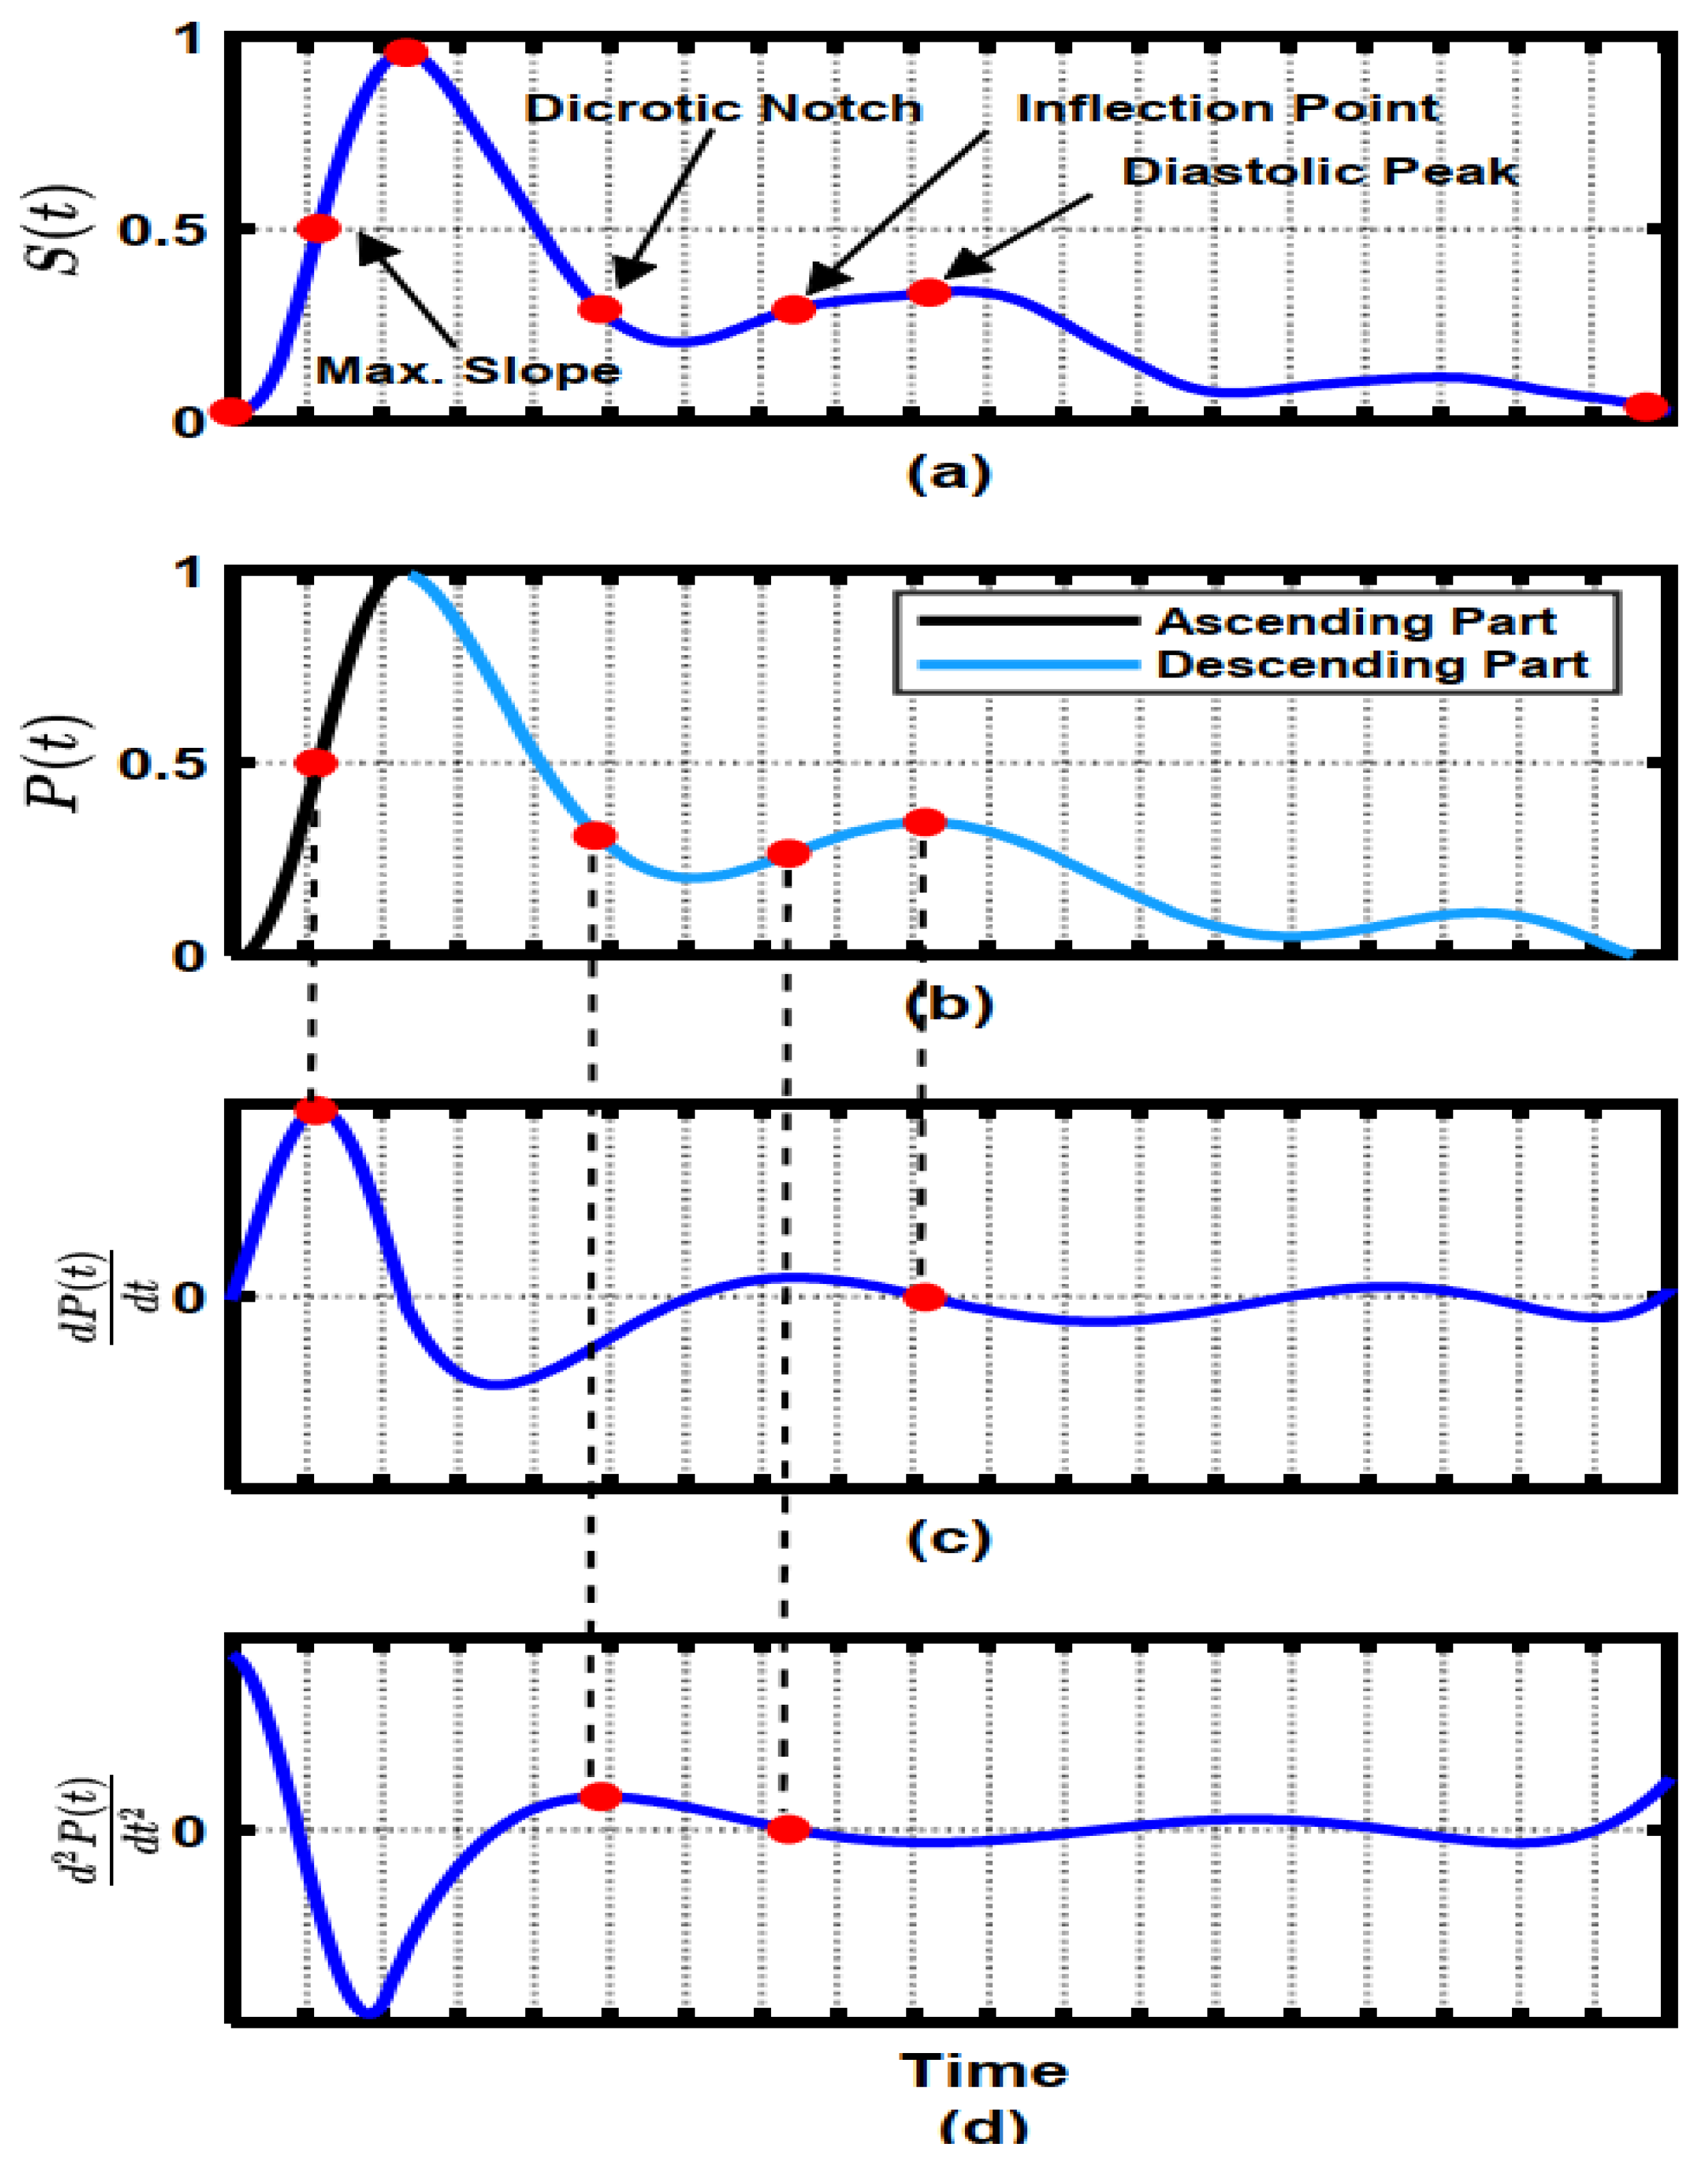
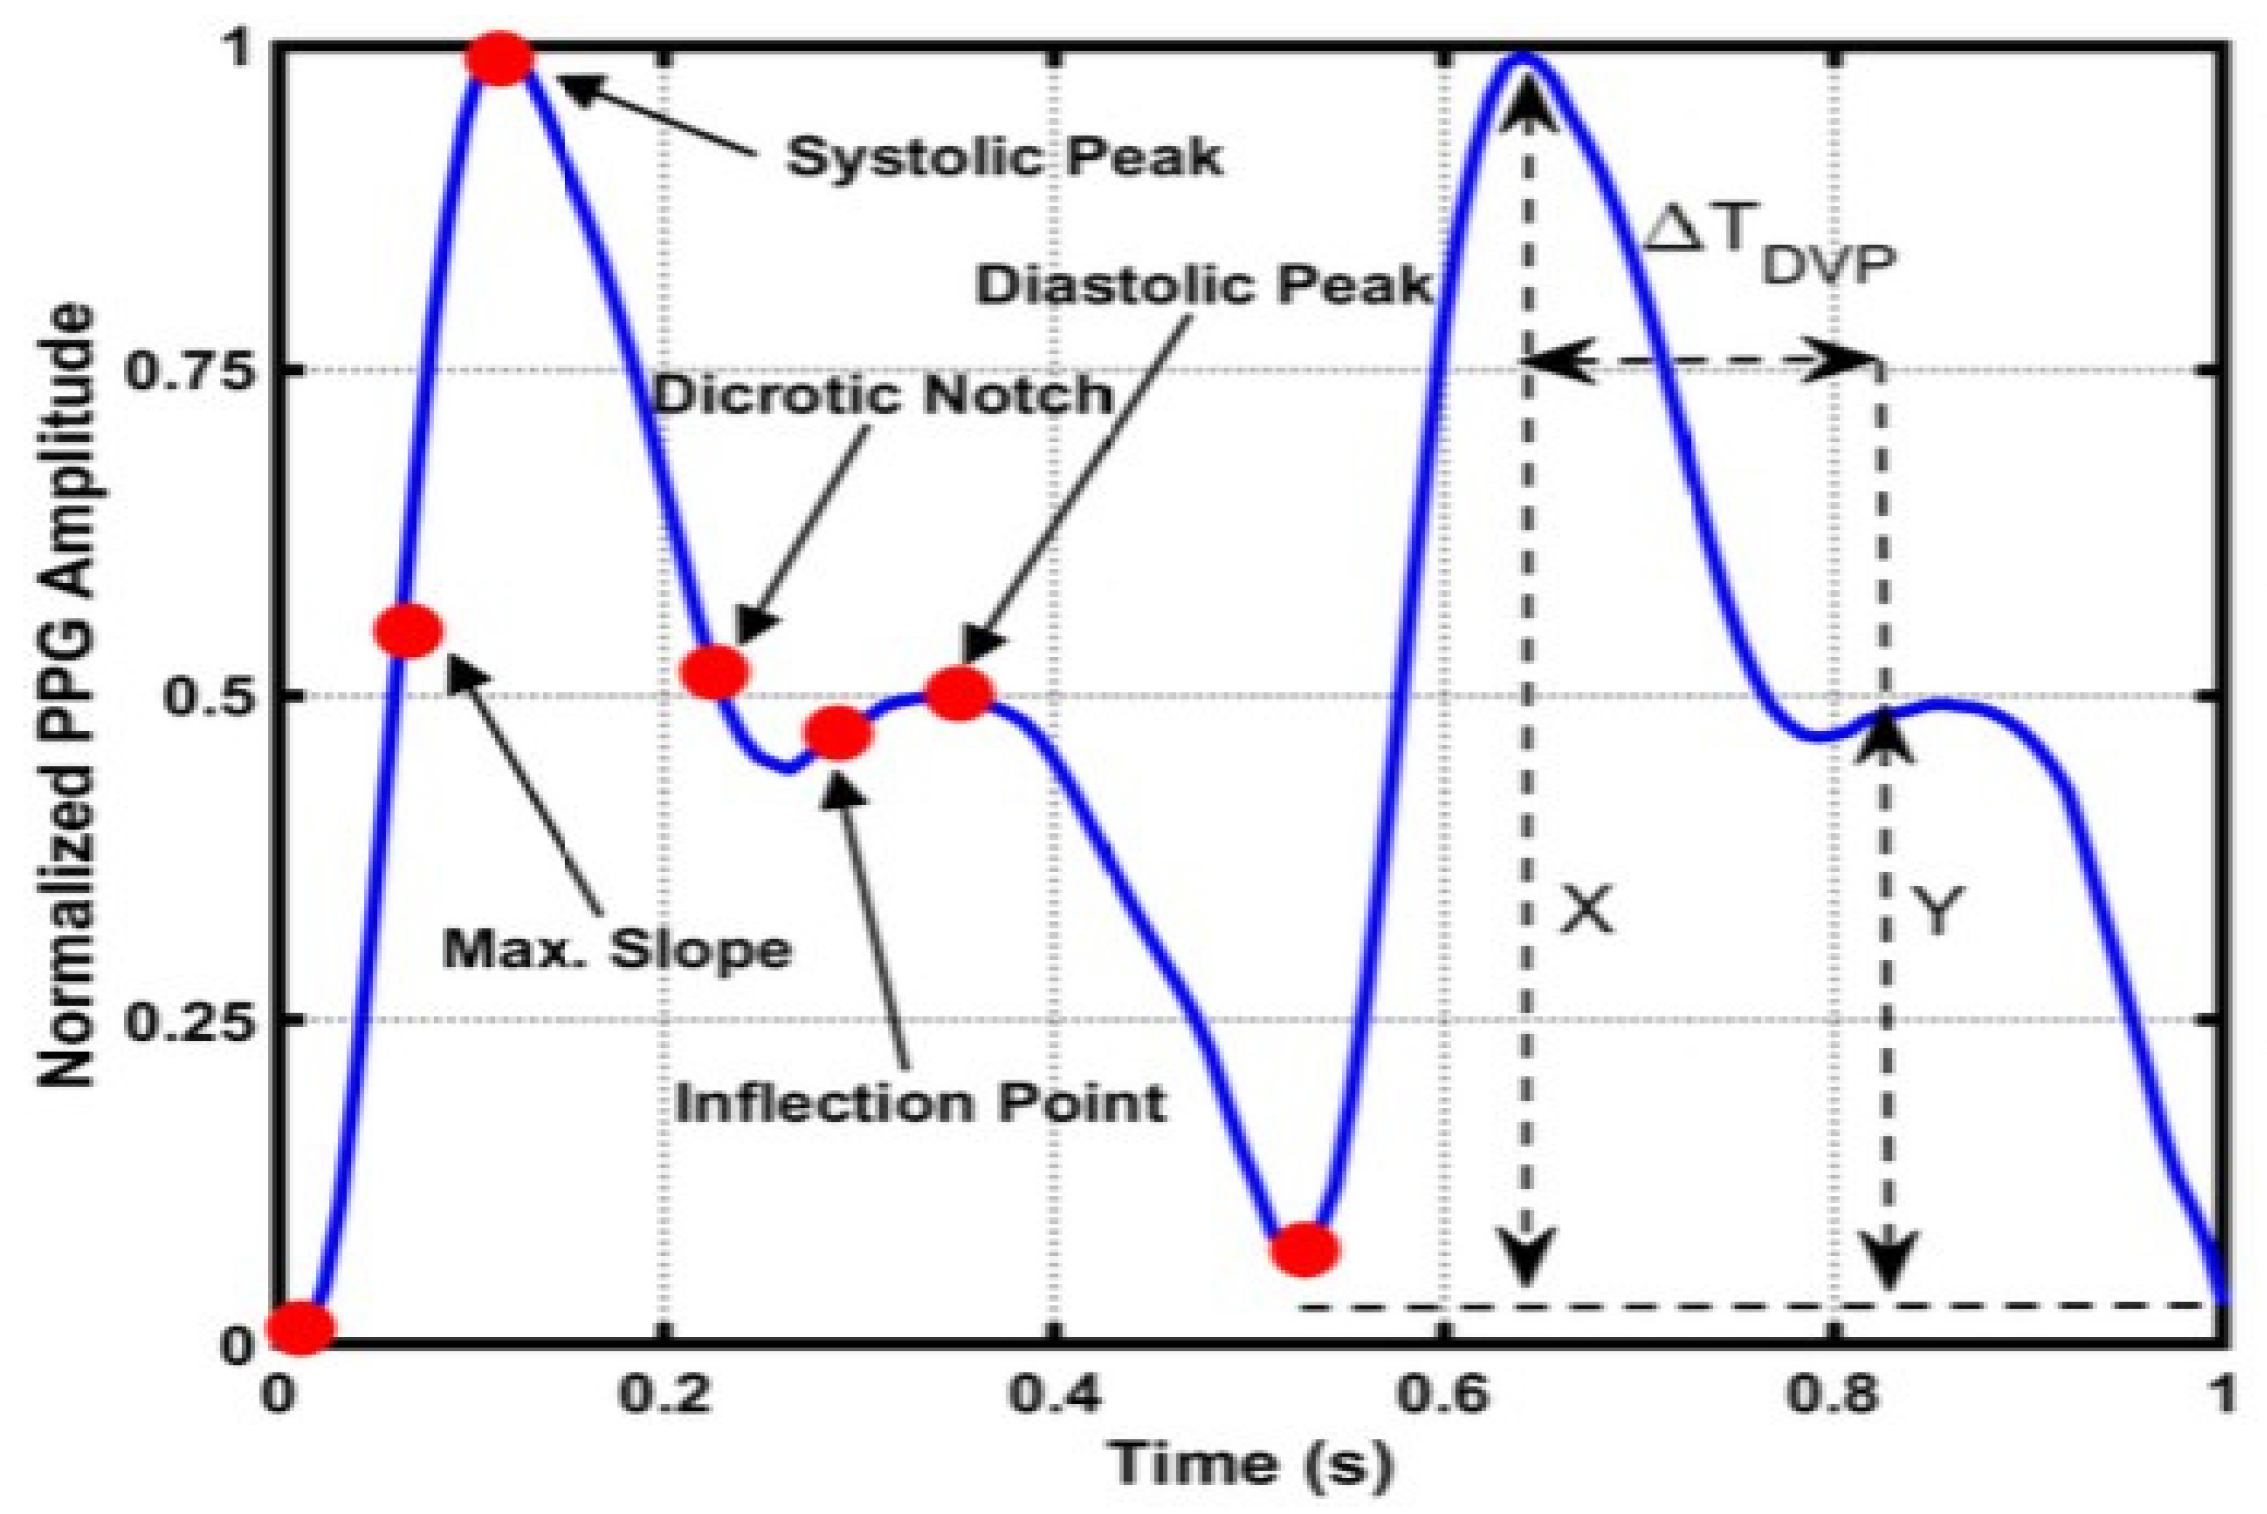
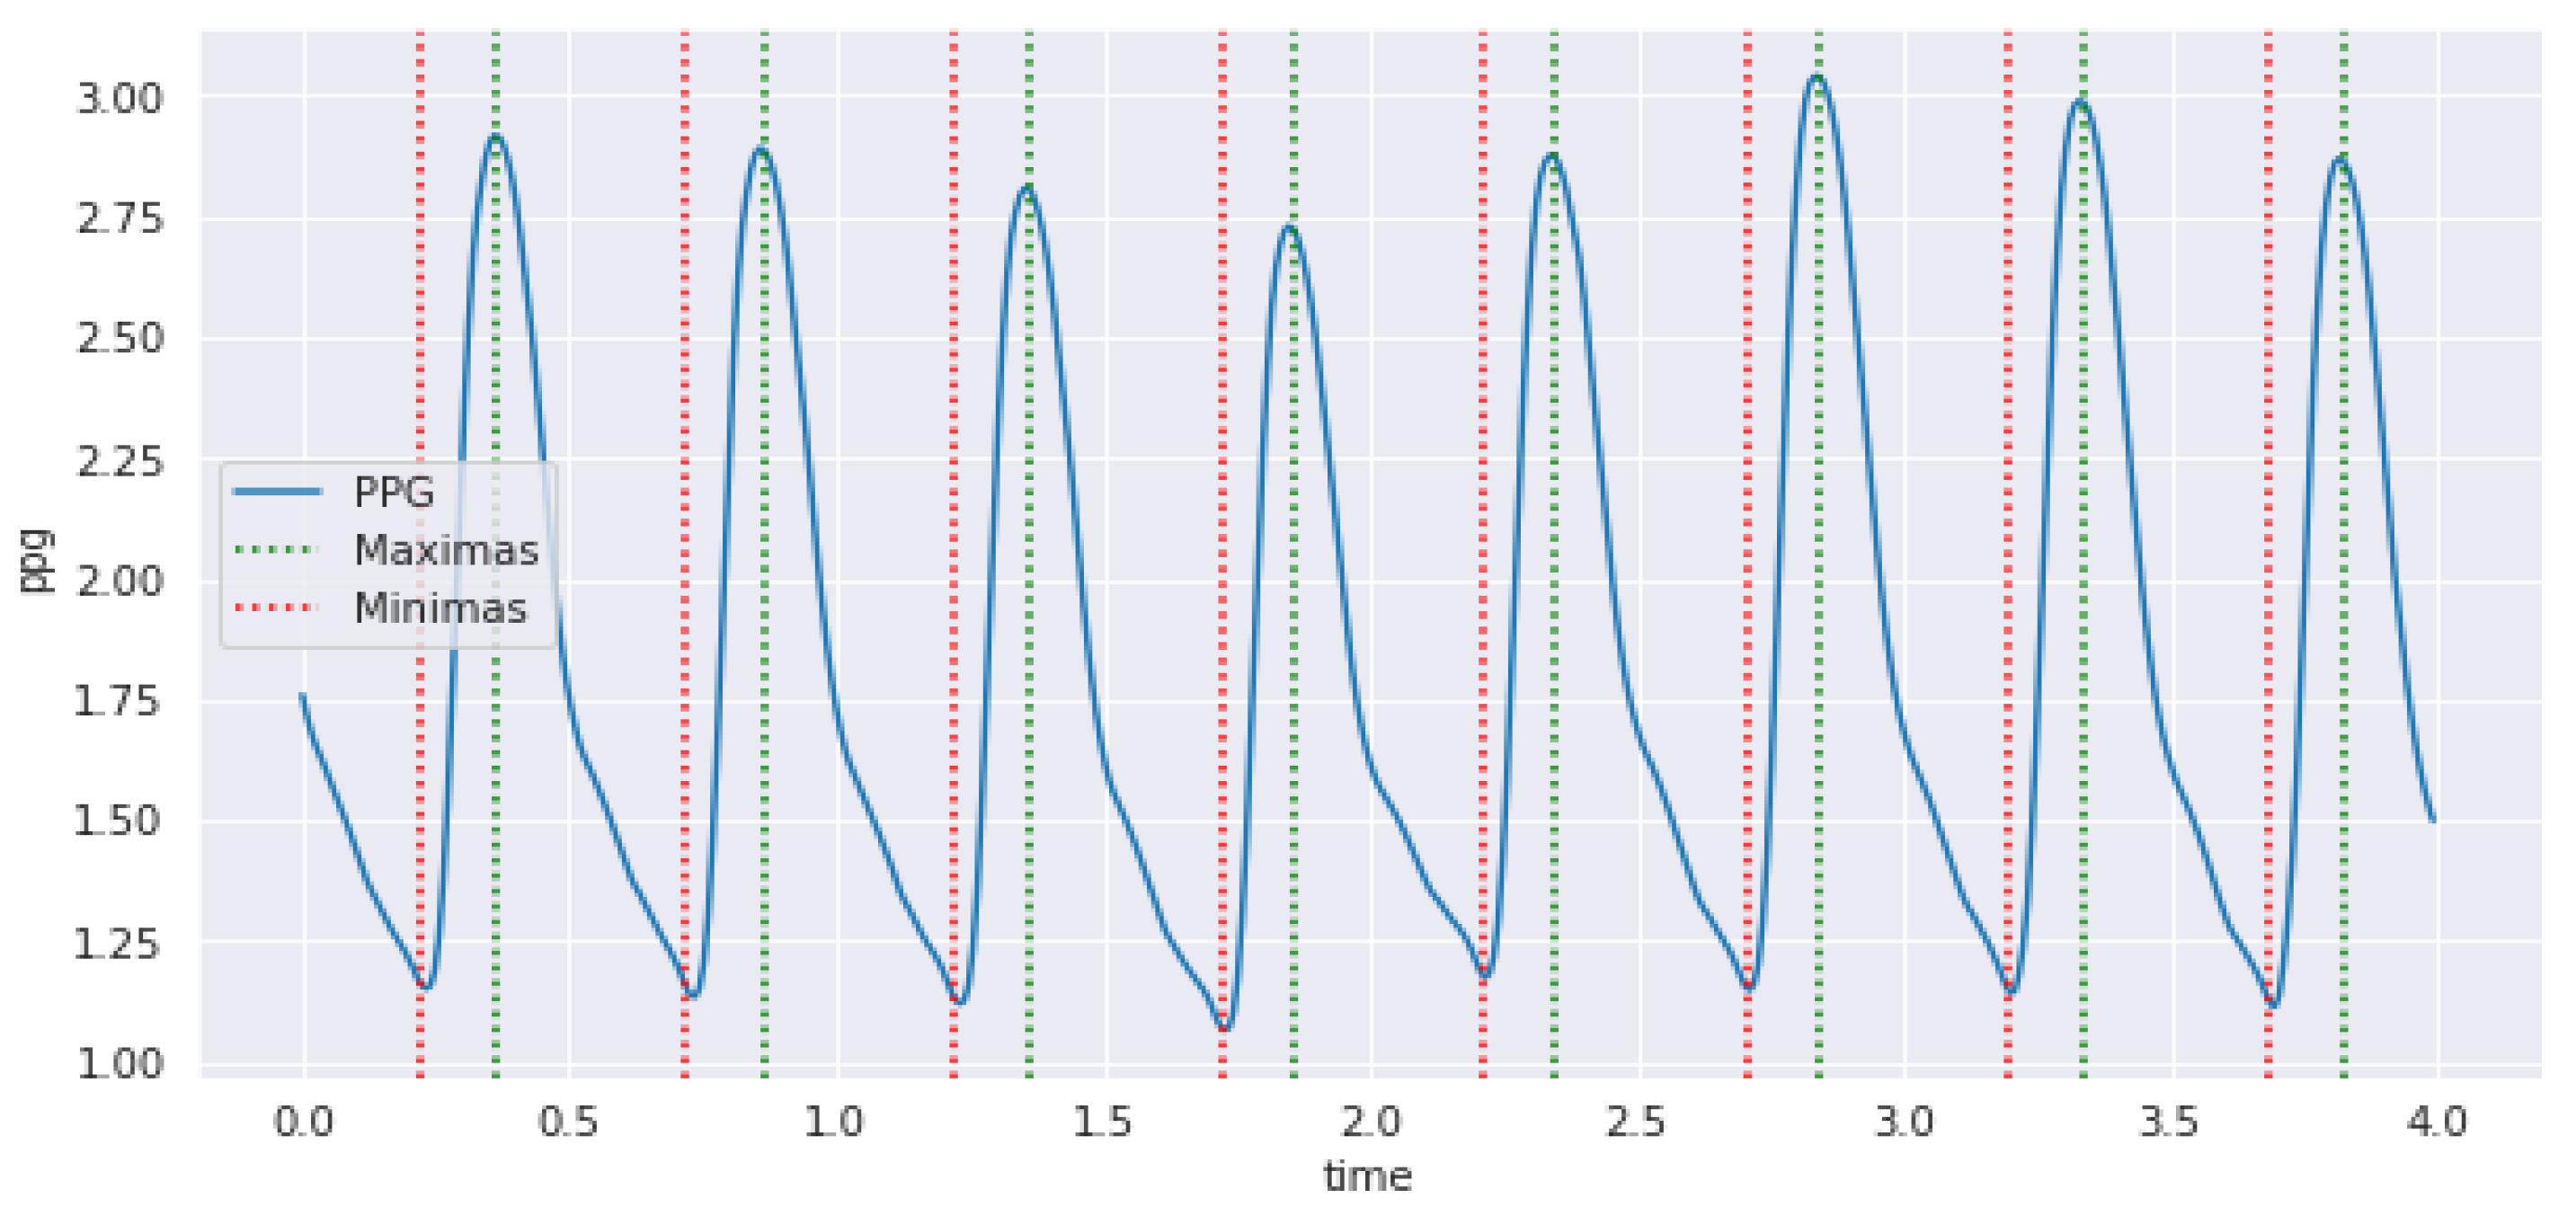
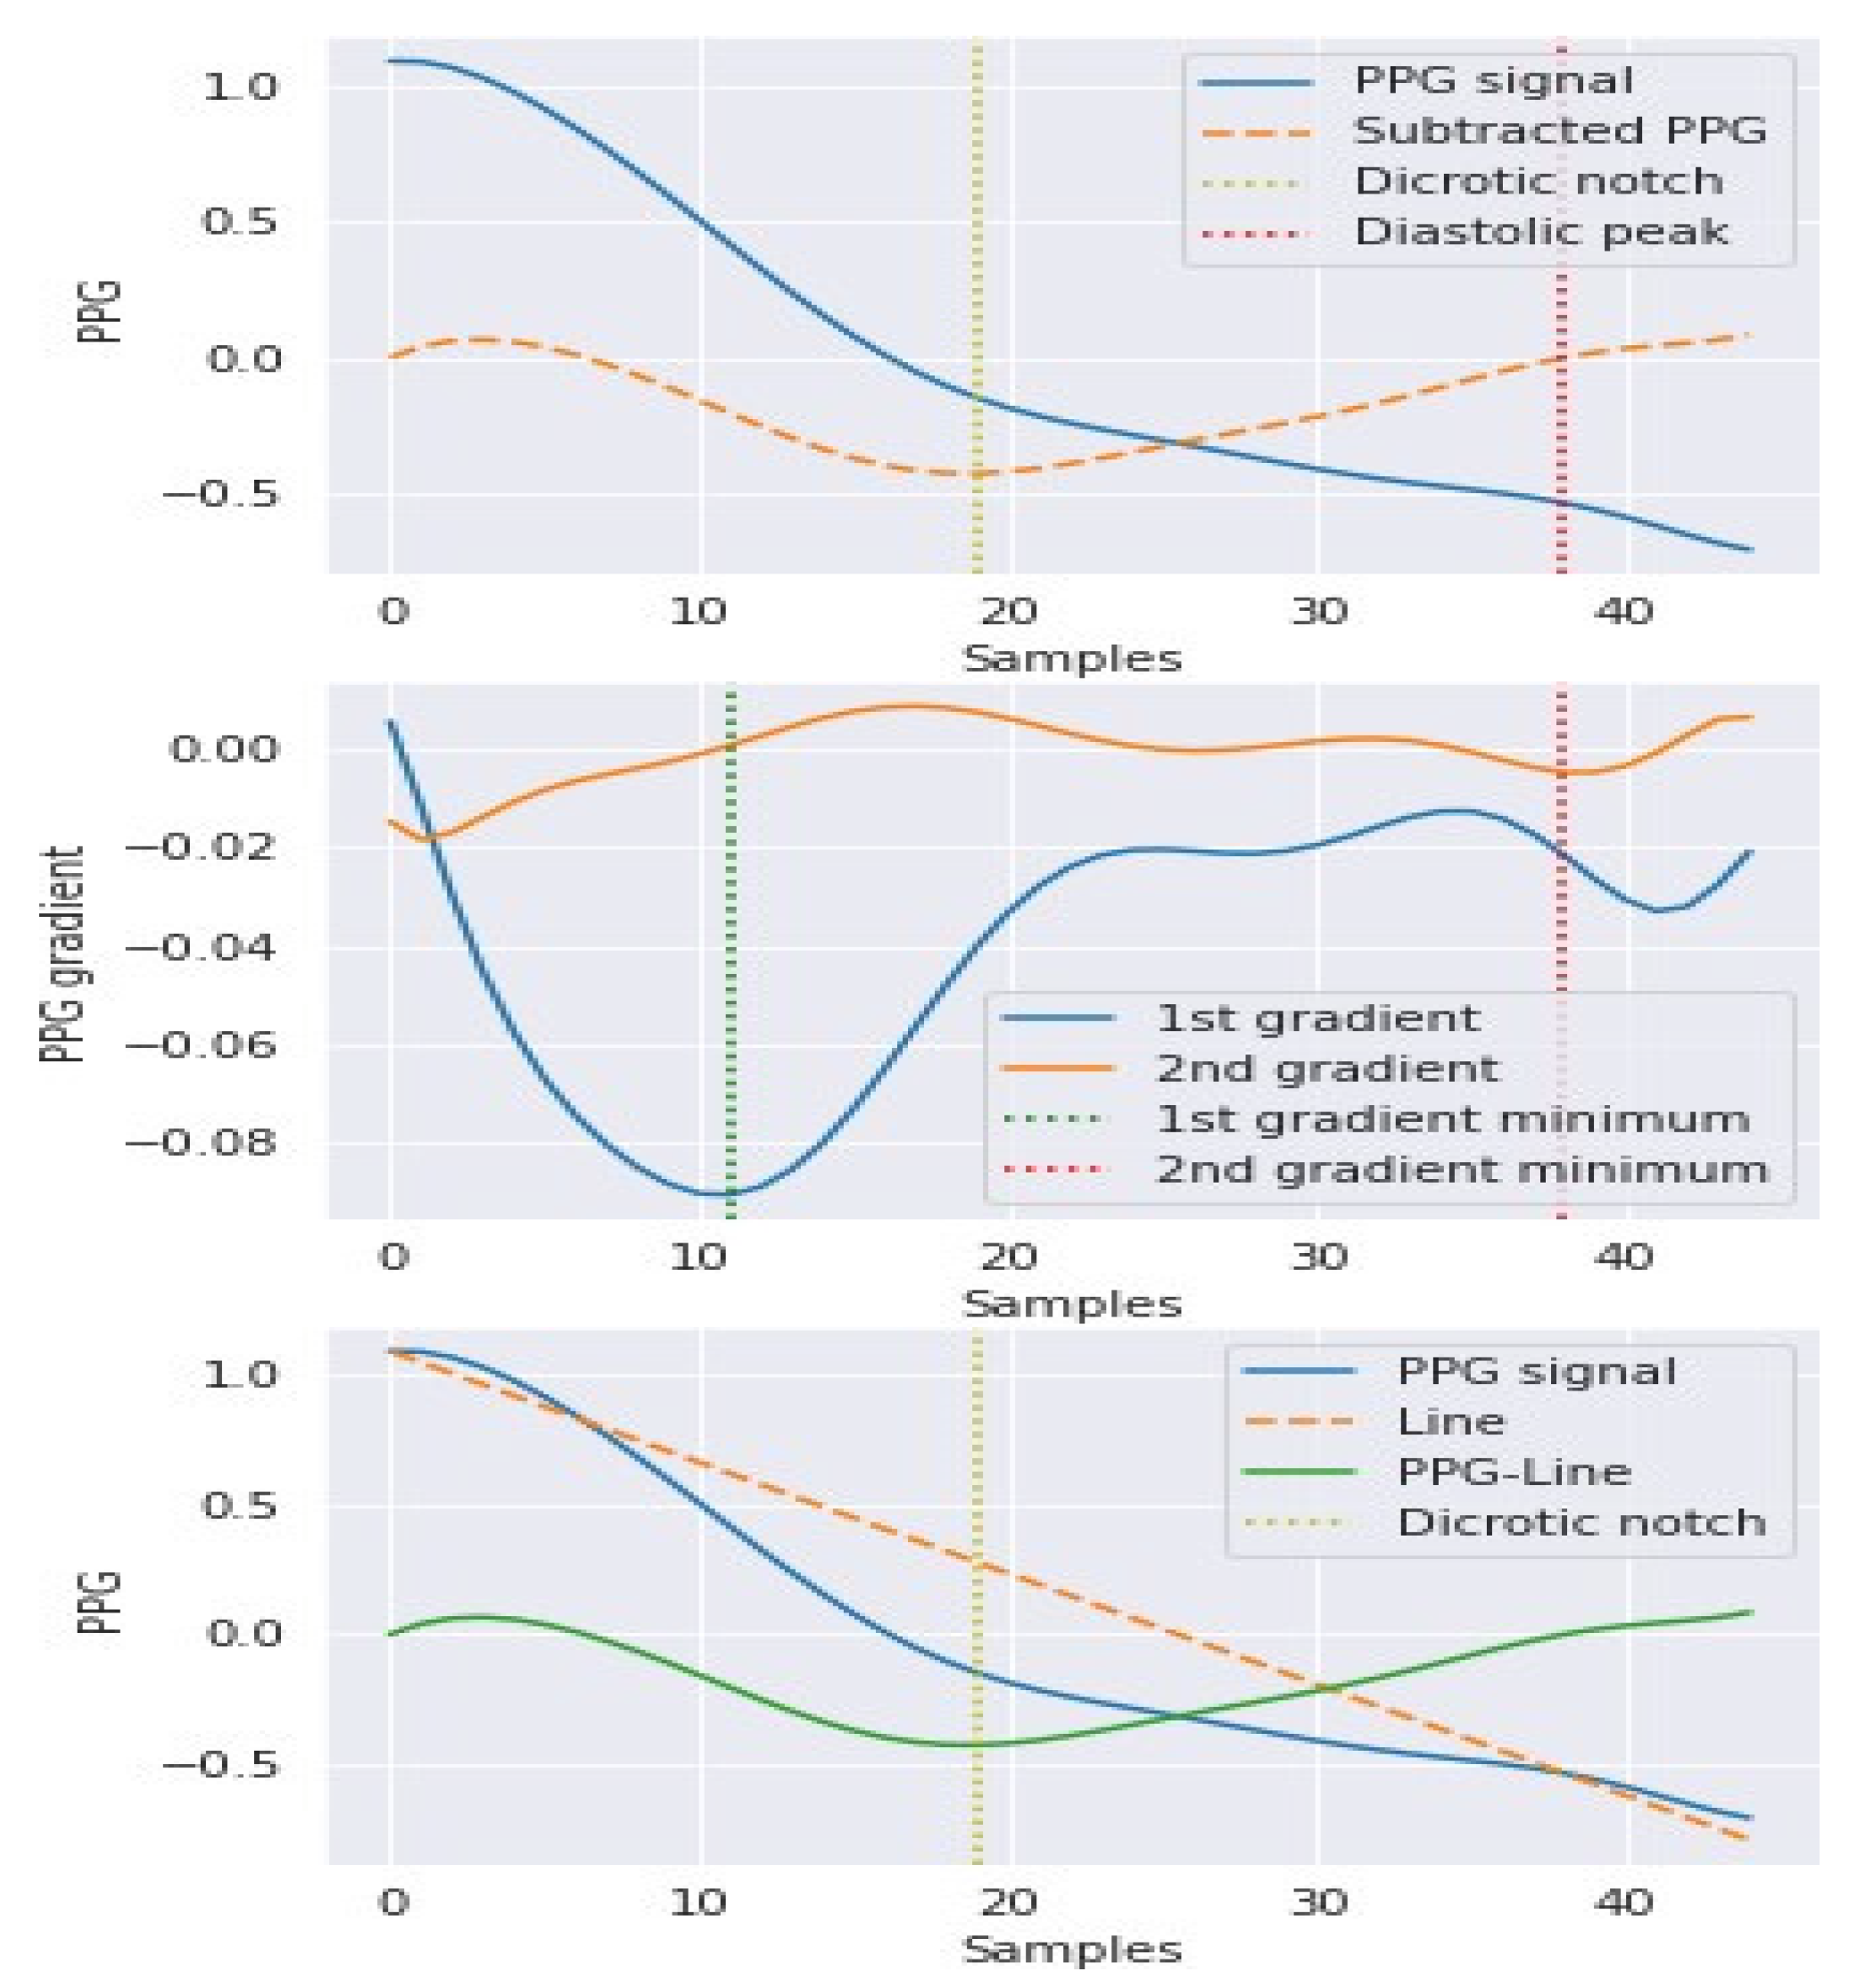
3.2. Hybrid Pre-Processing Stage
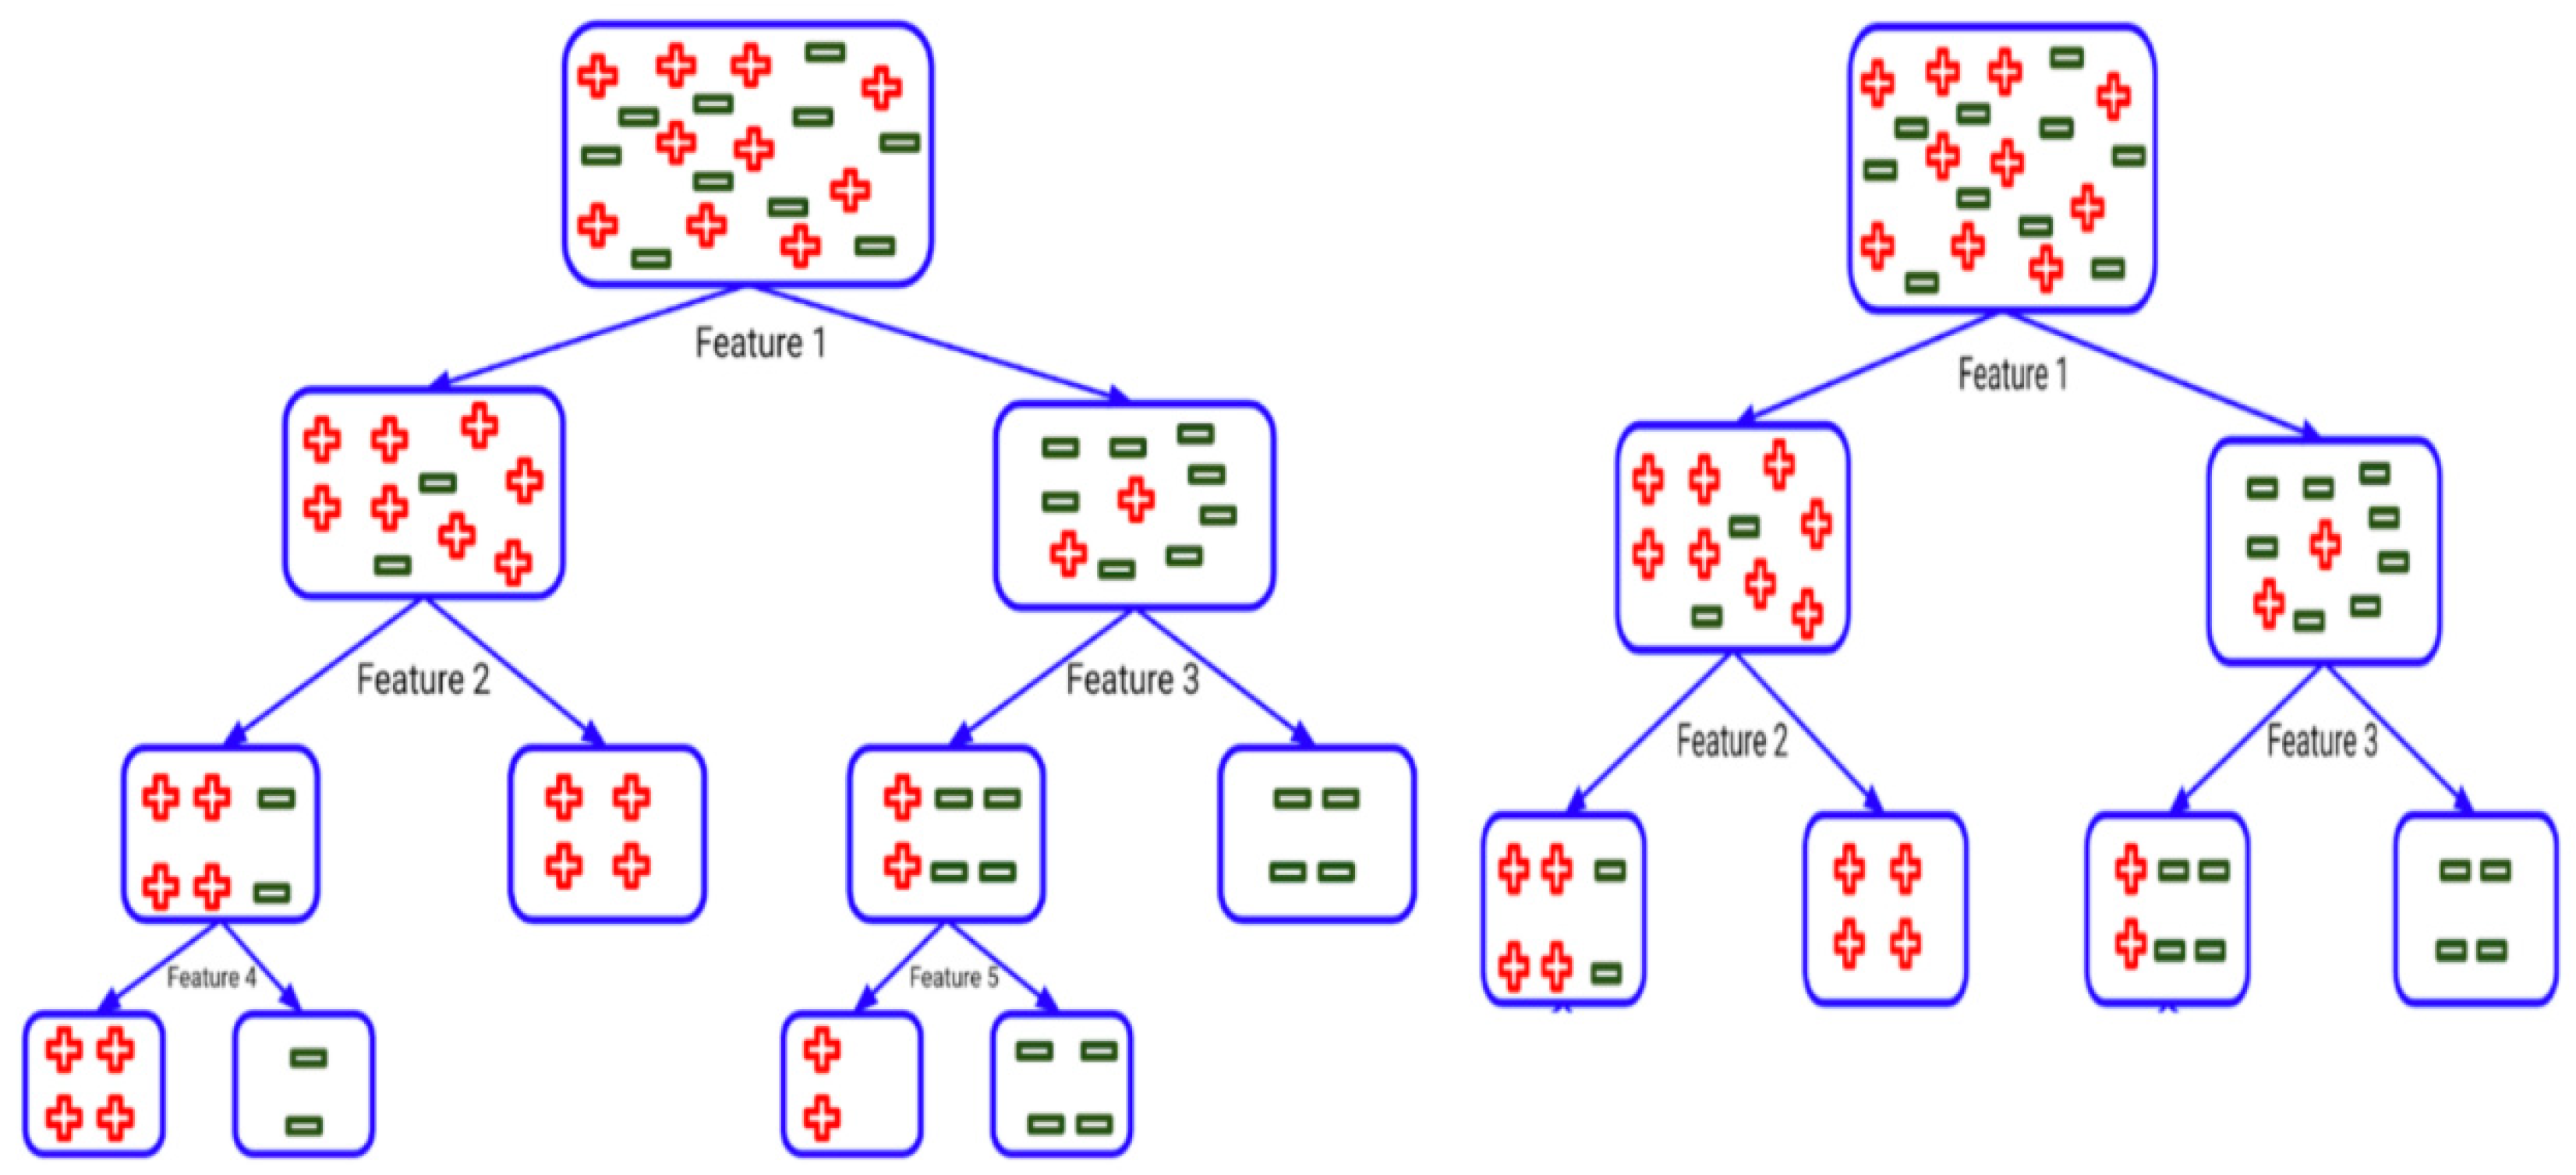
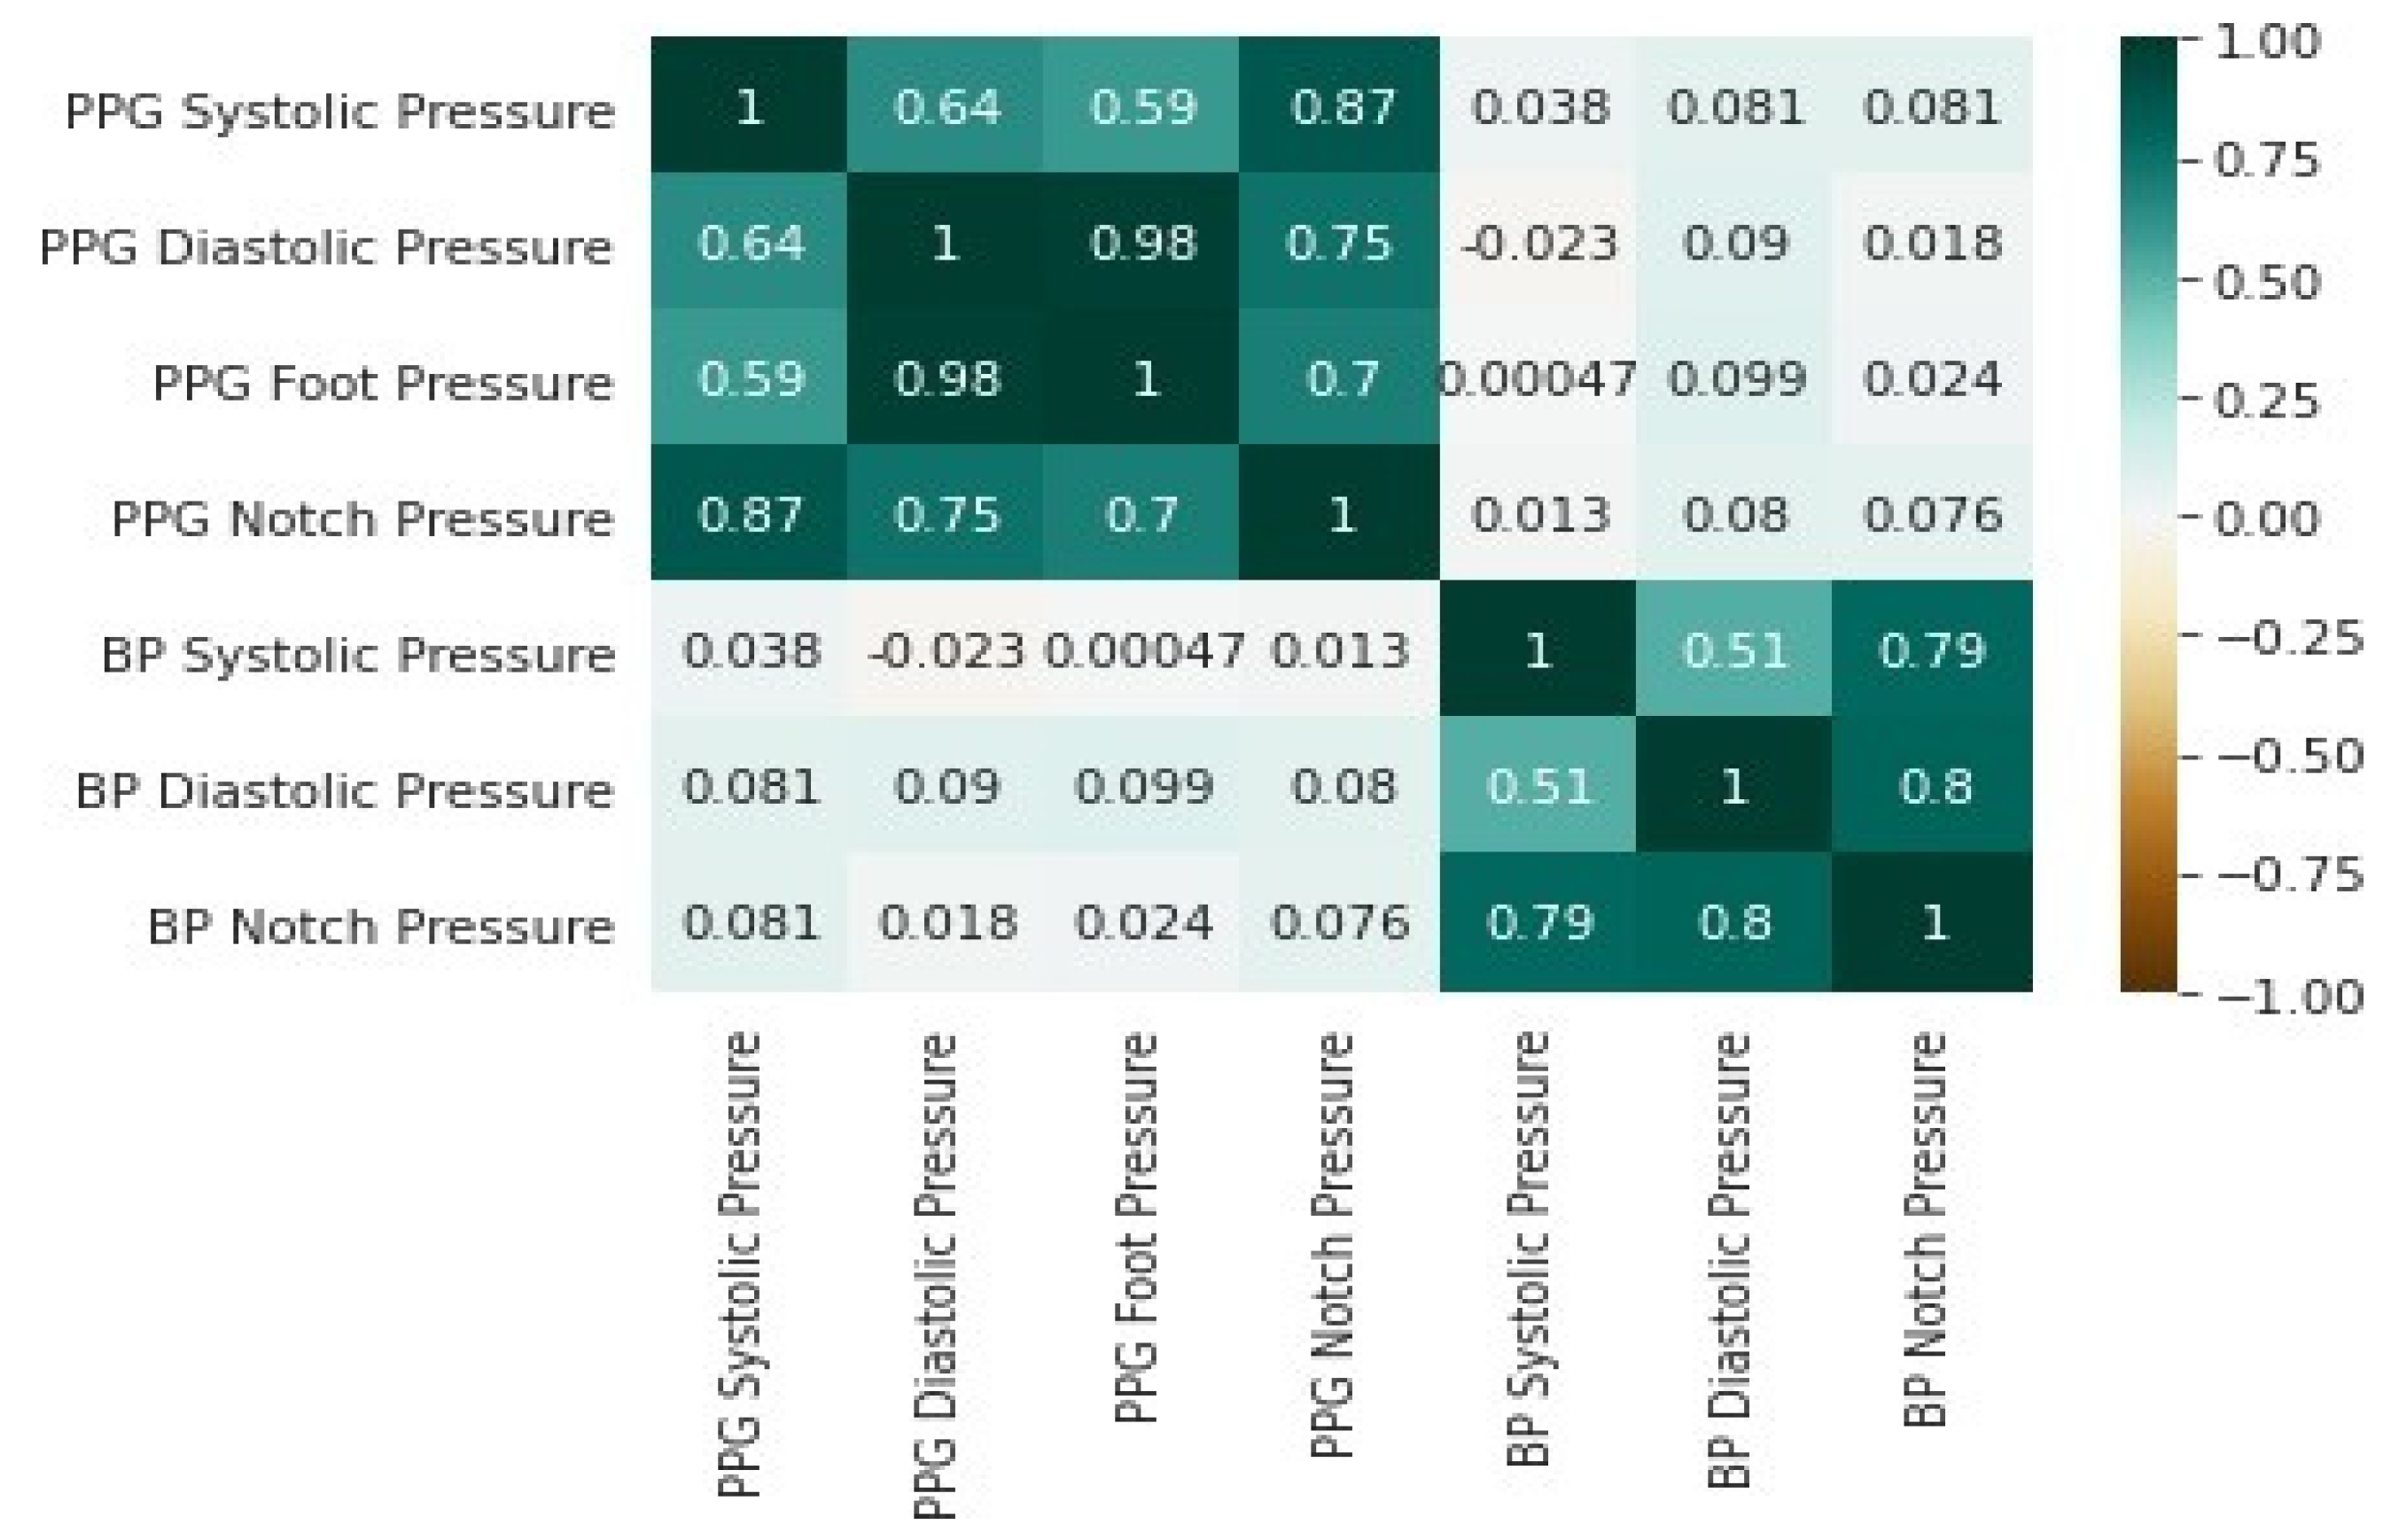
3.3. Features Selection Methods
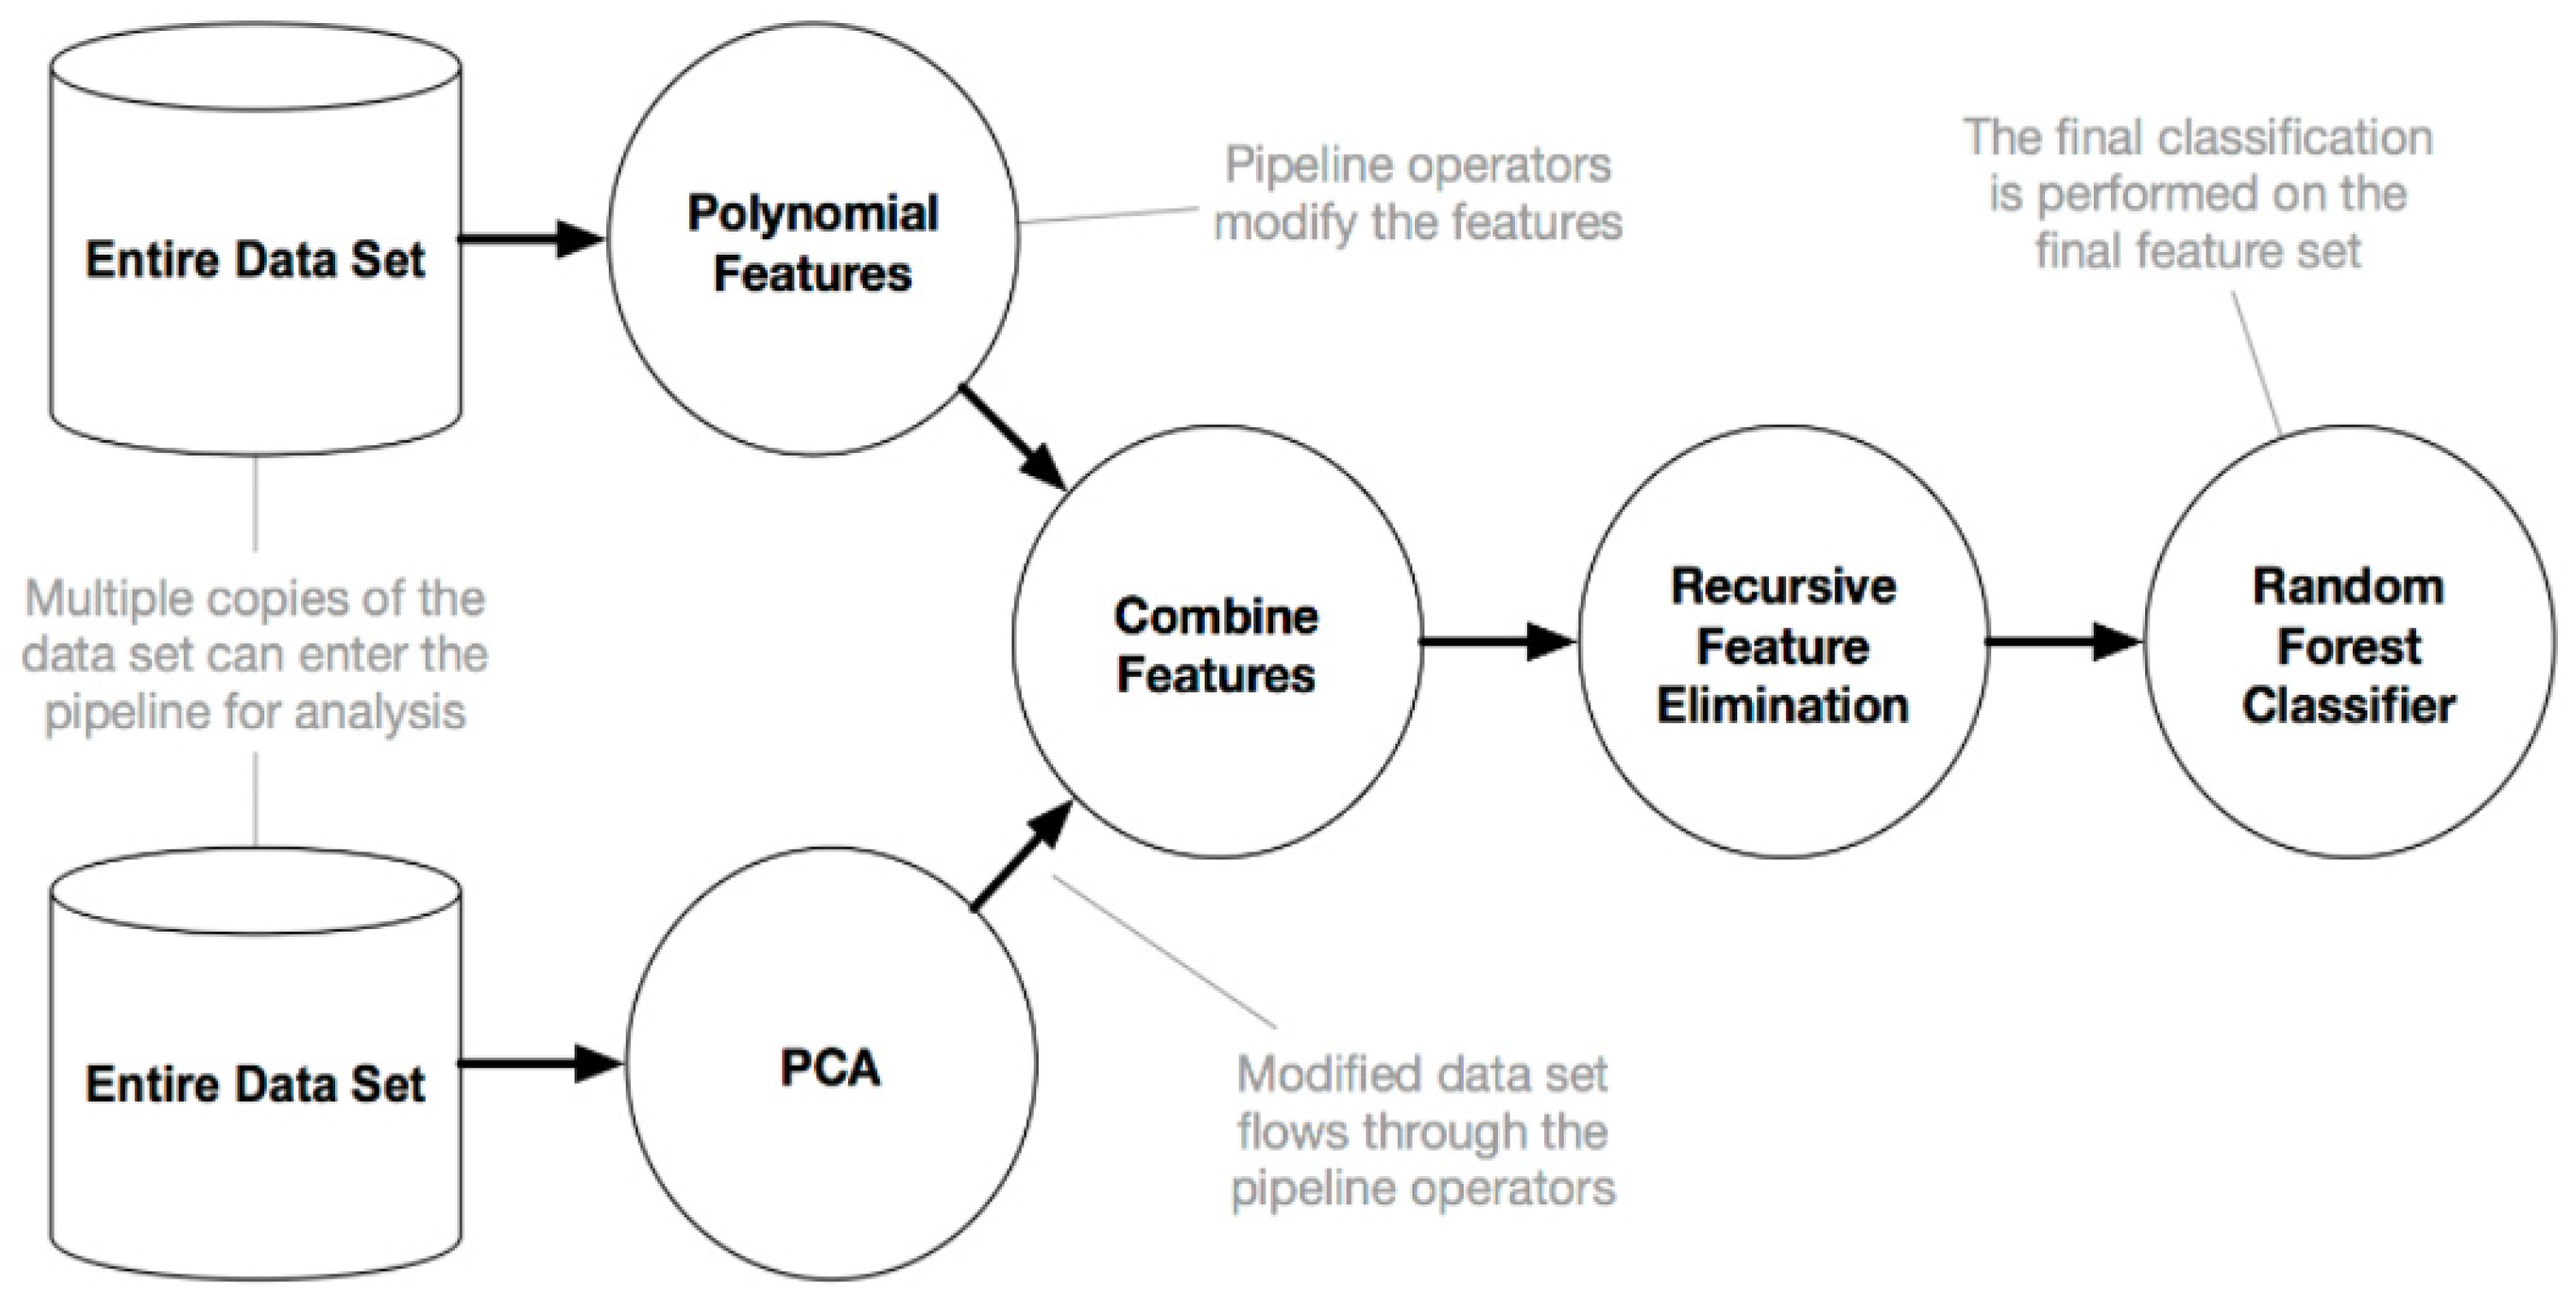
3.4. Automated Machine Learning
- Selection: At every generation, each solution is evaluated.
- Crossover: The most fit solution is selected, and crossover occurs to create a new population.
- Mutation: The children from the new population are mutated randomly, and the process is repeated once more to obtain the best solution.
- ⯀
- Whiten data.
- ⯀
- Randomize the initial weight vector w.
- ⯀
- Select a non-quadratic function, for example:
3.5. Evaluation Metrics
- Mean absolute error (MAE): Absolute error is the sum of error expected. The mean absolute error is the mean for all absolute errors.
- Mean squared error (MSE): MSE measures the squared number of errors. MSE is a risk function that corresponds to the estimated value of the squared error loss. MSE includes both the variance and bias of the estimator.
- Correlation coefficient (R): A statistical technique that calculates how closely connected two variables are (predictors and the predictions). It also informs us how close the prediction is to the trend line.
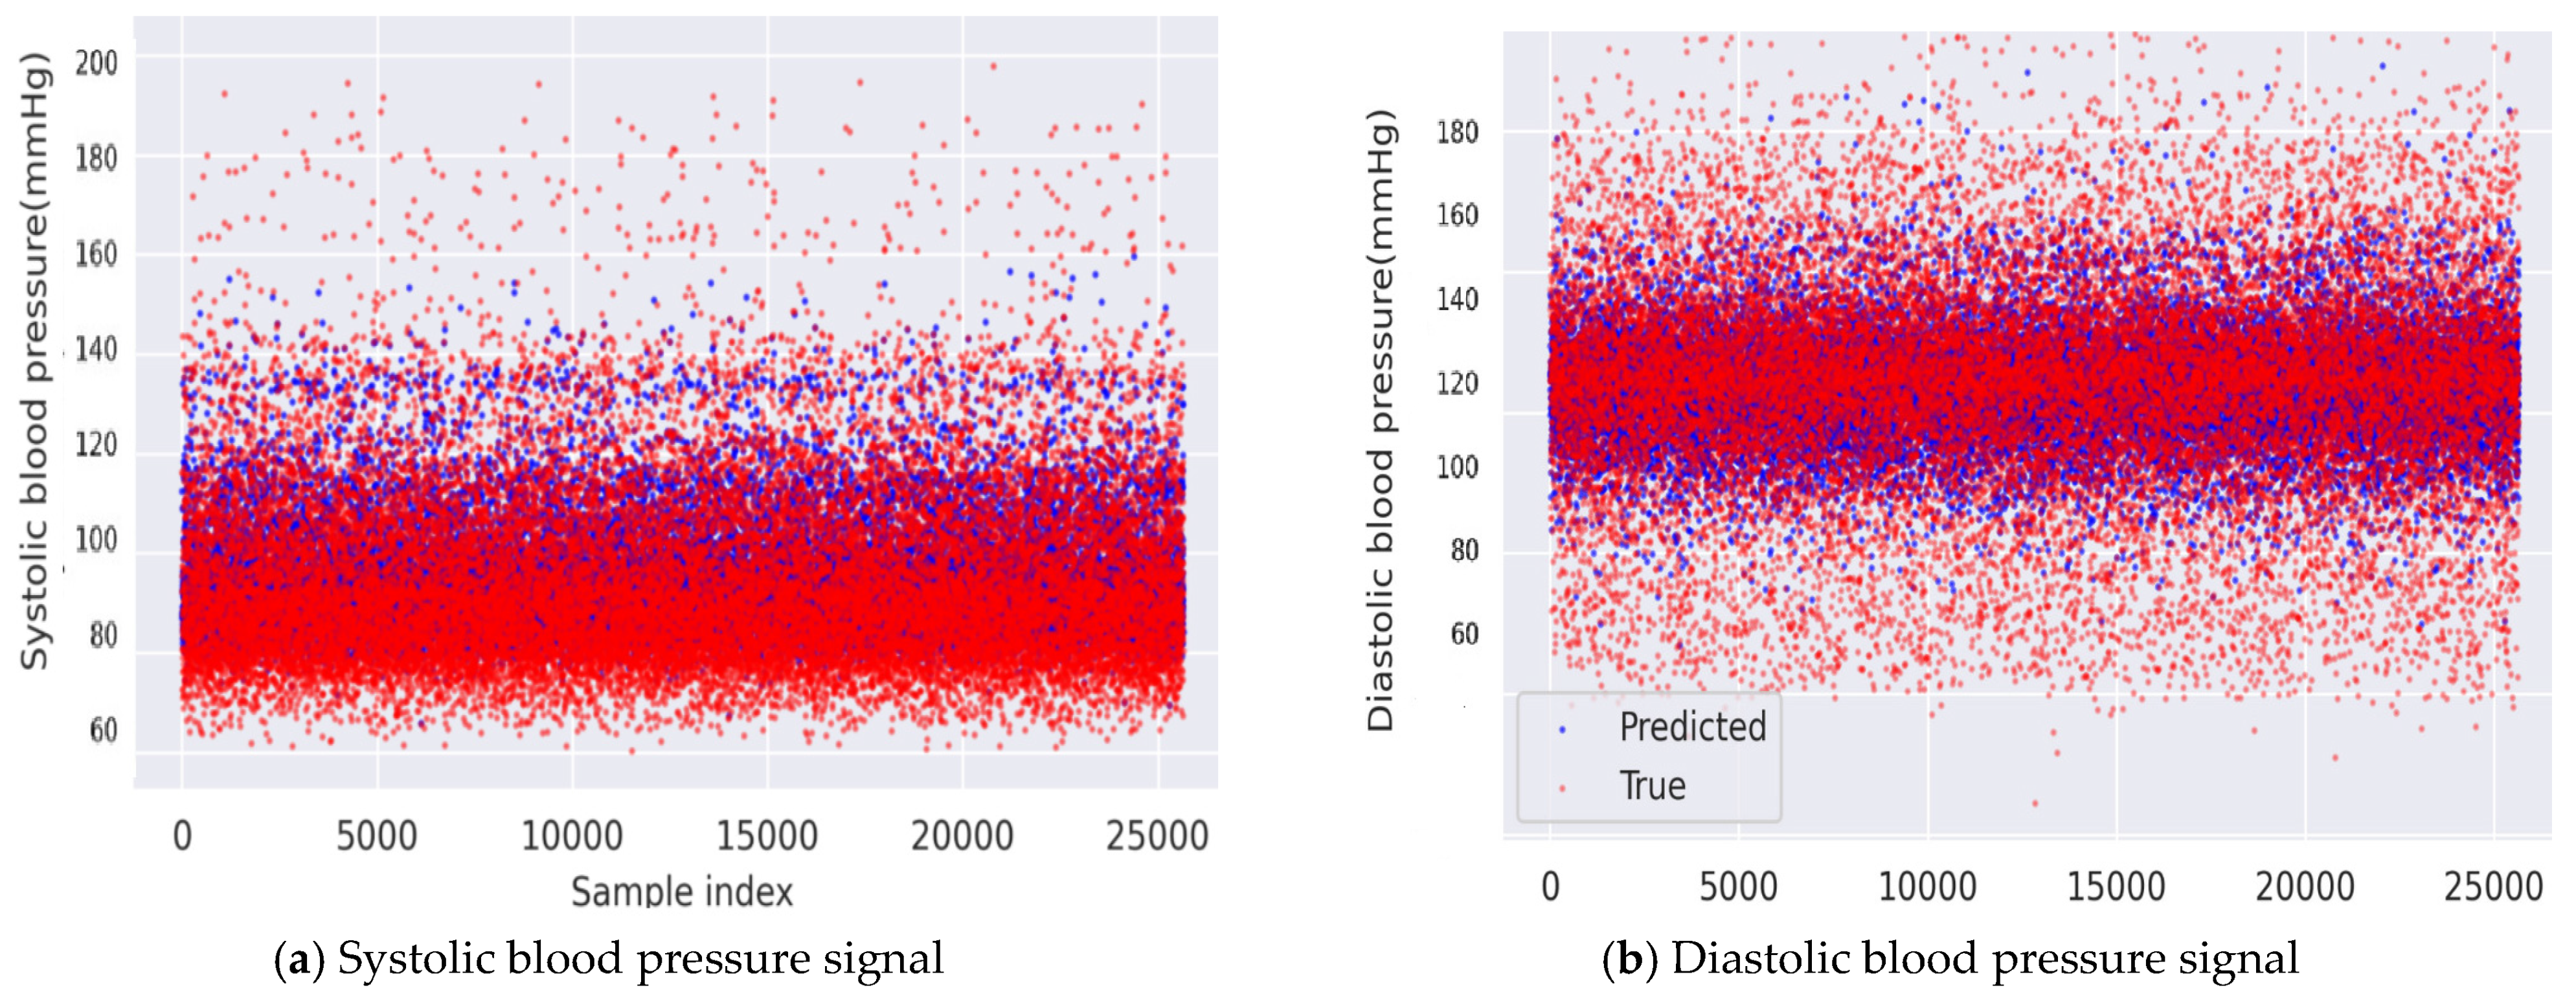
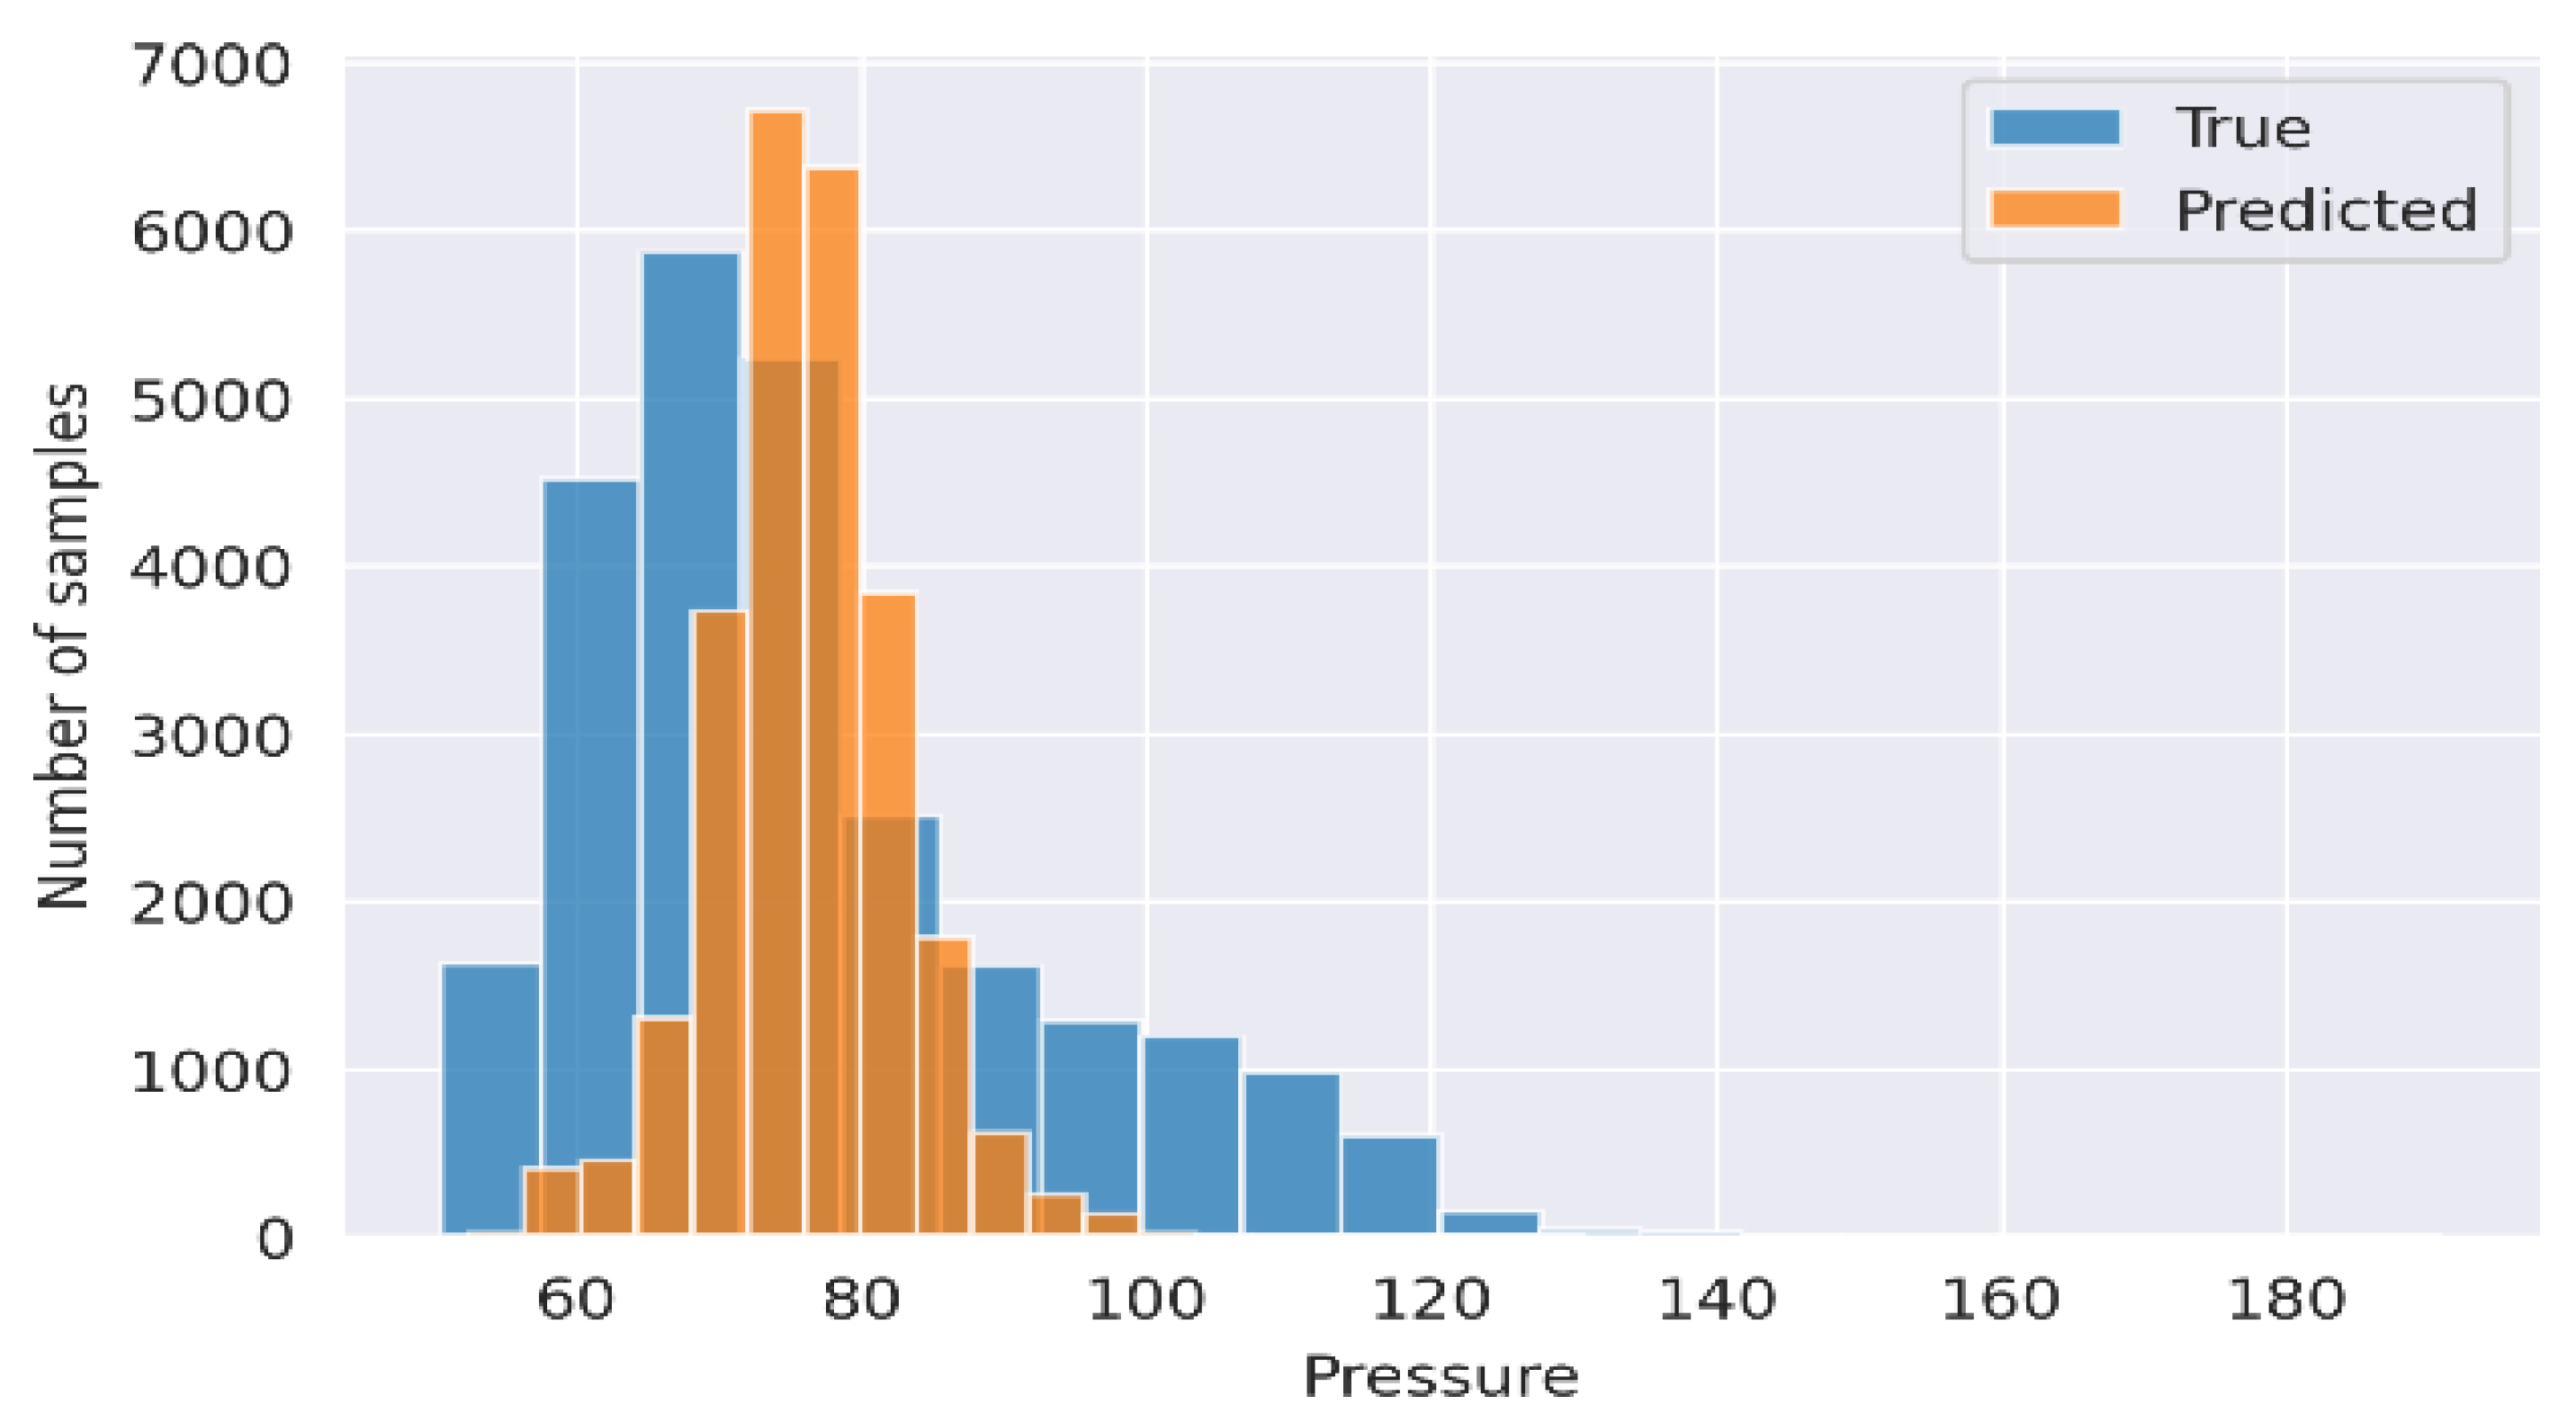
4. Results and Analysis
Comparison with Literature
5. Conclusions
Author Contributions
Funding
Data Availability Statement
Conflicts of Interest
References
- Chowdhury, M.H.; Shuzan, M.N.I.; Chowdhury, M.E.; Mahbub, Z.B.; Uddin, M.M.; Khandakar, A.; Reaz, M.B.I. Estimating Blood Pressure from the Photoplethysmogram Signal and Demographic Features Using Machine Learning Techniques. Sensors 2020, 20, 3127. [Google Scholar] [CrossRef]
- Muneer, A.; Fati, S.M.; Fuddah, S. Smart health monitoring system using IoT based smart fitness mirror. Telkomnika 2020, 18, 317–331. [Google Scholar] [CrossRef]
- Muneer, A.; Fati, S.M. Automated Health Monitoring System Using Advanced Technology. J. Inf. Technol. Res. 2019, 12, 104–132. [Google Scholar] [CrossRef] [Green Version]
- Haddadin, Y.; Annamaraju, P.; Regunath, H. Central line associated blood stream infections (CLABSI). StatPearls [Internet] 2020. Available online: https://www.ncbi.nlm.nih.gov/books/NBK430891/ (accessed on 18 January 2021).
- Ling, M.L.; Apisarnthanarak, A.; Jaggi, N.; Harrington, G.; Morikane, K.; Thu, L.T.A.; Ching, P.; Villanueva, V.; Zong, Z.; Jeong, J.S.; et al. APSIC guide for prevention of Central Line Associated Bloodstream Infections (CLABSI). Antimicrob. Resist. Infect. Control 2016, 5, 16. [Google Scholar] [CrossRef] [Green Version]
- Meidert, A.S.; Saugel, B. Techniques for Non-Invasive Monitoring of Arterial Blood Pressure. Front. Med. 2018, 4, 231. [Google Scholar] [CrossRef]
- Ribezzo, S.; Spina, E.; Di Bartolomeo, S.; Sanson, G. Noninvasive Techniques for Blood Pressure Measurement Are Not a Reliable Alternative to Direct Measurement: A Randomized Crossover Trial in ICU. Sci. World J. 2014, 2014, 1–8. [Google Scholar] [CrossRef]
- Patel, A.R.; Patel, A.R.; Singh, S.; Singh, S.; Khawaja, I. Central Line Catheters and Associated Complications: A Review. Cureus 2019, 11, e4717. [Google Scholar] [CrossRef] [Green Version]
- O’Brien, E.; Waeber, B.; Parati, G.; Staessen, J.; Myers, M.G. Blood pressure measuring devices: Recommendations of the European Society of Hypertension. BMJ 2001, 322, 531–536. [Google Scholar] [CrossRef] [PubMed] [Green Version]
- Kario, K. Management of Hypertension in the Digital Era: Small Wearable Monitoring Devices for Remote Blood Pressure Monitoring. Hypertension 2020, 76, 640–650. [Google Scholar] [CrossRef] [PubMed]
- Subasi, A. Practical Guide for Biomedical Signals Analysis Using Machine Learning Techniques: A Matlab Based Approach; Academic Press: New York, NY, USA, 2019. [Google Scholar]
- Allen, J.; Murray, A. Modelling the relationship between peripheral blood pressure and blood volume pulses using linear and neural network system identification techniques. Physiol. Meas. 1999, 20, 287. [Google Scholar] [CrossRef]
- Guyon, I.; Bennett, K.; Cawley, G.; Escalante, H.J.; Escalera, S.; Ho, T.K.; Macia, N.; Ray, B.; Saeed, M.; Statnikov, A.; et al. Design of the 2015 chalearn automl challenge. In Proceedings of the 2015 International Joint Conference on Neural Networks (IJCNN), Killarney, Ireland, 12–17 July 2015; pp. 1–8. [Google Scholar]
- Datta, S.; Banerjee, R.; Choudhury, A.D.; Sinha, A.; Pal, A. Blood pressure estimation from photoplethysmogram using latent parameters. In Proceedings of the 2016 IEEE International Conference on Communications (ICC), Kuala Lumpur, Malaysia, 23–27 May 2016; pp. 1–7. [Google Scholar]
- Choudhury, A.D.; Banerjee, R.; Sinha, A.; Kundu, S. Estimating blood pressure using Windkessel model on photoplethysmogram. In Proceedings of the 2014 36th Annual International Conference of the IEEE Engineering in Medicine and Biology Society, Chicago, IL, USA, 26–30 August 2014; pp. 4567–4570. [Google Scholar]
- Fujita, D.; Suzuki, A.; Ryu, K. PPG-Based Systolic Blood Pressure Estimation Method Using PLS and Level-Crossing Feature. Appl. Sci. 2019, 9, 304. [Google Scholar] [CrossRef] [Green Version]
- Frey, B.; Waldvogel, K.; Balmer, C. Clinical applications of photoplethysmography in paediatric intensive care. Intensiv. Care Med. 2007, 34, 578–582. [Google Scholar] [CrossRef] [Green Version]
- Aoyagi, T. Pulse oximetry: Its invention, theory, and future. J. Anesth. 2003, 17, 259–266. [Google Scholar] [CrossRef]
- Yoshiya, I.; Shimada, Y.; Tanaka, K. Spectrophotometric monitoring of arterial oxygen saturation in the fingertip. Med. Biol. Eng. Comput. 1980, 18, 27–32. [Google Scholar] [CrossRef]
- Xing, X.; Sun, M. Optical blood pressure estimation with photoplethysmography and FFT-based neural networks. Biomed. Opt. Express 2016, 7, 3007–3020. [Google Scholar]
- Lee, H.; Kim, E.; Lee, Y.; Kim, H.; Lee, J.; Kim, M.; Yoo, H.Y.; Yoo, S. Toward all-day wearable health monitoring: An ultralow-power, reflective organic pulse oximetry sensing patch. Sci. Adv. 2018, 4, eaas9530. [Google Scholar]
- Chandrasekhar, A.; Kim, C.-S.; Naji, M.; Natarajan, K.; Hahn, J.-O.; Mukkamala, R. Smartphone-based blood pressure monitoring via the oscillometric finger-pressing method. Sci. Transl. Med. 2018, 10, eaap8674. [Google Scholar] [CrossRef] [PubMed] [Green Version]
- Liang, Y.; Chen, Z.; Ward, R.; Elgendi, M. Hypertension assessment using photoplethysmography: A risk stratification approach. J. Clin. Med. 2019, 8, 12. [Google Scholar]
- Liang, Y.; Chen, Z.; Ward, R.; Elgendi, M. Photoplethysmography and Deep Learning: Enhancing Hypertension Risk Stratification. Biosensors 2018, 8, 101. [Google Scholar] [CrossRef] [PubMed] [Green Version]
- Elgendi, M.; Fletcher, R.; Liang, Y.; Howard, N.; Lovell, N.H.; Abbott, D.; Lim, K.; Ward, R. The use of photoplethysmography for assessing hypertension. NPJ Digit. Med. 2019, 2, 1–11. [Google Scholar]
- Millasseau, S.C.; Guigui, F.G.; Kelly, R.P.; Prasad, K.; Cockcroft, J.R.; Ritter, J.M.; Chowienczyk, P.J. Noninvasive assessment of the digital volume pulse: Comparison with the peripheral pressure pulse. Hypertension 2000, 36, 952–956. [Google Scholar] [CrossRef] [PubMed] [Green Version]
- Kavsaoğlu, A.R.; Polat, K.; Hariharan, M. Non-invasive prediction of hemoglobin level using machine learning techniques with the PPG signal’s characteristics features. Appl. Soft Comput. 2015, 37, 983–991. [Google Scholar] [CrossRef]
- Kılıçkaya, S.; Güner, A.; Dal, B. Comparison of Different Machine Learning Techniques for the Cuffless Estimation of Blood Pressure using PPG Signals. In Proceedings of the 2020 International Congress on Human-Computer Interaction, Optimization and Robotic Applications (HORA), Turkey, Ankara, 26–27 June 2020; pp. 1–6. [Google Scholar]
- Romano, J.D.; Le, T.T.; Fu, W.; Moore, J.H. TPOT-NN: Augmenting tree-based automated machine learning with neural network estimators. Genet. Program. Evolv. Mach. 2021, 1–21, 8. [Google Scholar]
- Xie, Q.; Wang, G.; Peng, Z.; Lian, Y. Machine learning methods for real-time blood pressure measurement based on photoplethysmography. In Proceedings of the 2018 IEEE 23rd International Conference on Digital Signal Processing (DSP), Shanghai, China, 19–21 November 2018; pp. 1–5. [Google Scholar]
- Yang, S.; Zaki, W.S.; Morgan, S.P.; Cho, S.Y.; Correia, R.; Wen, L.; Zhang, Y. Blood Pressure Estimation from Photoplethysmogram and Electrocardiogram Signals Using Machine Learning; IET: Washington, DC, USA, 2018; pp. 1–5. [Google Scholar]
- Waring, J.; Lindvall, C.; Umeton, R. Automated machine learning: Review of the state-of-the-art and opportunities for healthcare. Artif. Intell. Med. 2020, 104, 101822. [Google Scholar] [CrossRef] [PubMed]
- Olson, R.S.; Moore, J.H. TPOT: A Tree-Based Pipeline Optimization Tool for Automating Machine Learning. In Automated Machine Learning; Springer: Cham, Switzerland, 2019; pp. 151–160. [Google Scholar]
- Rajkomar, A.; Dean, J.; Kohane, I. Machine Learning in Medicine. N. Engl. J. Med. 2019, 380, 1347–1358. [Google Scholar] [CrossRef] [PubMed]
- Beam, A.L.; Kohane, I.S. Big Data and Machine Learning in Health Care. JAMA 2018, 319, 1317–1318. [Google Scholar] [CrossRef]
- Auffray, C.; Balling, R.; Barroso, I.; Bencze, L.; Benson, M.; Bergeron, J.; Bernal-Delgado, E.; Blomberg, N.; Bock, C.; Conesa, A.; et al. Making sense of big data in health research: Towards an EU action plan. Genome Med. 2016, 8, 1–13. [Google Scholar] [CrossRef] [PubMed]
- Xing, X.; Ma, Z.; Zhang, M.; Zhou, Y.; Dong, W.; Song, M. An Unobtrusive and Calibration-free Blood pressure estimation Method using photoplethysmography and Biometrics. Sci. Rep. 2019, 9, 1–8. [Google Scholar] [CrossRef] [Green Version]
- Rundo, F.; Ortis, A.; Battiato, S.; Conoci, S. Advanced bio-inspired system for noninvasive cuff-less blood pressure estimation from physiological signal analysis. Computation 2018, 6, 46. [Google Scholar] [CrossRef] [Green Version]
- Slapničar, G.; Mlakar, N.; Luštrek, M. Blood Pressure Estimation from Photoplethysmogram Using a Spectro-Temporal Deep Neural Network. Sensors 2019, 19, 3420. [Google Scholar] [CrossRef] [Green Version]
- Kim, J.Y.; Cho, B.H.; Im, S.M.; Jeon, M.J.; Kim, I.Y.; Kim, S.I. Comparative study on artificial neural network with multiple regressions for continuous estimation of blood pressure. In Proceedings of the 2005 IEEE Engineering in Medicine and Biology 27th Annual Conference, Shanghai, China, 17–18 January 2006; pp. 6942–6945. [Google Scholar]
- Kachuee, M.; Kiani, M.M.; Mohammadzade, H.; Shabany, M. Cuff-less high-accuracy calibration-free blood pressure estimation using pulse transit time. In Proceedings of the 2015 IEEE International Symposium on Circuits and Systems (ISCAS), Lisbon, Portugal, 24–27 May 2015; pp. 1006–1009. [Google Scholar]
- Cattivelli, F.S.; Garudadri, H. Noninvasive cuffless estimation of blood pressure from pulse arrival time and heart rate with adaptive calibration. In Proceedings of the 2009 Sixth International Workshop on Wearable and Implantable Body Sensor Networks, Berkeley, CA, USA, 3–5 June 2009; pp. 114–119. [Google Scholar]
- Elgendi, M. On the analysis of fingertip photoplethysmogram signals. Curr. Cardiol. Rev. 2012, 8, 14–25. [Google Scholar] [CrossRef] [PubMed]
- Kavsaoğlu, A.R.; Polat, K.; Bozkurt, M.R. A novel feature ranking algorithm for biometric recognition with PPG signals. Comput. Biol. Med. 2014, 49, 1–14. [Google Scholar] [CrossRef]
- Yang, S.; Zhang, Y.; Cho, S.-Y.; Morgan, S.P.; Correia, R.; Wen, L. Cuff-less blood pressure measurement using fingertip photoplethysmogram signals and physiological characteristics. In Proceedings of the Optics in Health Care and Biomedical Optics VIII, Beijing, China, 23 October 2018; p. 1082036. [Google Scholar]
- Thornton, C.; Hutter, F.; Hoos, H.H.; Leyton-Brown, K. Auto-WEKA: Combined selection and hyperparameter optimization of classification algorithms. In Proceedings of the 19th ACM SIGKDD International Conference on Knowledge Discovery and Data Mining, Chicago, IL, USA, 11–14 August 2013; pp. 847–855. [Google Scholar]
- Gotlibovych, I.; Crawford, S.; Goyal, D.; Liu, J.; Kerem, Y.; Benaron, D.; Yilmaz, D.; Marcus, G.; Li, Y. End-to-end deep learning from raw sensor data: Atrial fibrillation detection using wearables. arXiv 2018, arXiv:1807.10707. [Google Scholar]
- Zhang, Y.; Feng, Z. A SVM method for continuous blood pressure estimation from a PPG signal. In Proceedings of the 9th International Conference on Machine Learning and Computing, Singapore, 24–26 February 2017; pp. 128–132. [Google Scholar]
- Su, P.; Ding, X.R.; Zhang, Y.T.; Liu, J.; Miao, F.; Zhao, N. Long-term blood pressure prediction with deep recurrent neural networks. In Proceedings of the 2018 IEEE EMBS International Conference on Biomedical & Health Informatics (BHI), Las Vegas, NV, USA, 4–7 March 2018; pp. 323–328. [Google Scholar]
- Kachuee, M.; Kiani, M.M.; Mohammadzade, H.; Shabany, M. Cuffless blood pressure estimation algorithms for continuous healthcare monitoring. IEEE Trans. Biomed. Eng. 2017, 64, 859–869. [Google Scholar] [CrossRef] [PubMed]
- Cosoli, G.; Spinsante, S.; Scalise, L. Wrist-worn and chest-strap wearable devices: Systematic review on accuracy and metrological characteristics. Measurement 2020, 159, 107789. [Google Scholar] [CrossRef]
- Nachman, D.; Gepner, Y.; Goldstein, N.; Kabakov, E.; Ishay, A.B.; Littman, R.; Azmon, Y.; Jaffe, E.; Eisenkraft, A. Comparing blood pressure measurements between a photoplethysmography-based and a standard cuff-based manometry device. Sci. Rep. 2020, 10, 1–9. [Google Scholar] [CrossRef] [PubMed]
- Scalise, L.; Cosoli, G.; Casacanditella, L.; Casaccia, S.; Rohrbaugh, J.W. The measurement of blood pressure without contact: An LDV-based technique. In Proceedings of the 2017 IEEE International Symposium on Medical Measurements and Applications (MeMeA), Rochester, MN, USA, 7–10 May 2017; pp. 245–250. [Google Scholar]
- Bell, A.J.; Sejnowski, T.J. An information-maximization approach to blind separation and blind deconvolution. Neural Comput. 1995, 7, 1129–1159. [Google Scholar] [CrossRef]
- Kurylyak, Y.; Lamonaca, F.; Grimaldi, D. A Neural Network-based method for continuous blood pressure estimation from a PPG signal. In Proceedings of the 2013 IEEE International Instrumentation and Measurement Technology Conference (I2MTC), Minneapolis, MN, USA, 6–9 May 2013; pp. 280–283. [Google Scholar]
- Aguirre, N.; Grall-Maës, E.; Cymberknop, L.J.; Armentano, R.L. Blood Pressure Morphology Assessment from Photoplethysmogram and Demographic Information Using Deep Learning with Attention Mechanism. Sensors 2021, 21, 2167. [Google Scholar] [CrossRef]
- Fortin, F.A.; De Rainville, F.M.; Gardner, M.A.G.; Parizeau, M.; Gagné, C. DEAP: Evolutionary algorithms made easy. J. Mach. Learn. Res. 2012, 13, 2171–2175. [Google Scholar]
- Miao, F.; Wen, B.; Hu, Z.; Fortino, G.; Li, Y. Continuous Blood Pressure Measurement from One-Channel Electrocardiogram Signal Using Deep-Learning Techniques. Artif. Intell. Med. 2020, 108, 101919. [Google Scholar] [CrossRef]
- Hasanzadeh, N.; Ahmadi, M.M.; Mohammadzade, H. Blood Pressure Estimation Using Photoplethysmogram Signal and Its Morphological Features. IEEE Sens. J. 2019, 20, 4300–4310. [Google Scholar] [CrossRef]
- Piskorowski, J. Suppressing harmonic powerline interference using multiple-notch filtering methods with improved transient behavior. Measurement 2012, 45, 1350–1361. [Google Scholar] [CrossRef]
- Moraes, J.L.; Rocha, M.X.; Vasconcelos, G.G.; Vasconcelos Filho, J.E.; De Albuquerque, V.H.C.; Alexandria, A.R. Advances in Photopletysmography Signal Analysis for Biomedical Applications. Sensors 2018, 18, 1894. [Google Scholar] [CrossRef] [Green Version]
- De-Cheveigné, A.; Nelken, I. Filters: When, why, and how (not) to use them. Neuron 2019, 102, 280–293. [Google Scholar] [CrossRef] [PubMed] [Green Version]
- Hyvarinen, A. Fast and robust fixed-point algorithms for independent component analysis. IEEE Trans. Neural Netw. 1999, 10, 626–634. [Google Scholar] [CrossRef] [Green Version]
- Oja, E.; Yuan, Z. The FastICA Algorithm Revisited: Convergence Analysis. IEEE Trans. Neural Netw. 2006, 17, 1370–1381. [Google Scholar] [CrossRef]
- Haider, A.W.; Larson, M.G.; Franklin, S.S.; Levy, D. Systolic Blood Pressure, Diastolic Blood Pressure, and Pulse Pressure as Predictors of Risk for Congestive Heart Failure in the Framingham Heart Study. Ann. Intern. Med. 2003, 138, 10–16. [Google Scholar] [CrossRef] [PubMed]
- Jolliffe, I.T.; Cadima, J. Principal component analysis: A review and recent developments. Philos. Trans. R. Soc. A Math. Phys. Eng. Sci. 2016, 374, 20150202. [Google Scholar] [CrossRef] [PubMed]
- Madhav, K.V.; Ram, M.R.; Krishna, E.H.; Reddy, K.N.; Reddy, K.A. Estimation of respiratory rate from principal components of photoplethysmographic signals. In Proceedings of the 2010 IEEE EMBS Conference on Biomedical Engineering and Sciences (IECBES), Kuala Lumpur, Malaysia, 30 November–2 December 2010; pp. 311–314. [Google Scholar]
- Muneer, A.; Fati, S.M. A Comparative Analysis of Machine Learning Techniques for Cyberbullying Detection on Twitter. Future Internet 2020, 12, 187. [Google Scholar] [CrossRef]
- Akbar, N.A.; Sunyoto, A.; Rudyanto Arief, M.; Caesarendra, W. Improvement of decision tree classifier accuracy for healthcare insurance fraud prediction by using Extreme Gradient Boosting algorithm. In Proceedings of the 2020 International Conference on Informatics, Multimedia, Cyber and Information System (ICIMCIS), Multimedia, Cyber, 19–20 November 2020. [Google Scholar] [CrossRef]
- Imandoust, S.B.; Bolandraftar, M. Application of k-nearest neighbor (knn) approach for predicting economic events: Theoretical background. Int. J. Eng. Res. Appl. 2013, 3, 605–610. [Google Scholar]
- Čisar, P.; Čisar, S.M. Skewness and kurtosis in function of selection of network traffic distribution. Acta Polytech. Hung. 2010, 7, 95–106. [Google Scholar]
- Tjahjadi, H.; Ramli, K. Non-invasive blood pressure classification based on Photoplethysmography using K-Nearest Neighbors algorithm: A feasibility study. Information 2020, 11, 93. [Google Scholar] [CrossRef] [Green Version]
- Wall, M.E.; Rechtsteiner, A.; Rocha, L.M. Singular value decomposition and principal component analysis. In A Practical Approach to Microarray Data Analysis; Springer: Boston, MA, USA, 2003; pp. 91–109. [Google Scholar]
- Al-Ghobari, M.; Muneer, A.; Fati, S.M. Location-Aware Personalized Traveler Recommender System (LAPTA) Using Collaborative Filtering KNN. Comput. Mater. Continu. 2021, 68. [Google Scholar]
- Alsharif, M.H.; Kelechi, A.H.; Yahya, K.; Chaudhry, S.A. Machine learning algorithms for smart data analysis in internet of things environment: Taxonomies and research trends. Symmetry 2020, 12, 88. [Google Scholar] [CrossRef] [Green Version]
- Wu, H.; Ji, Z.; Li, M. Non-Invasive Continuous Blood-Pressure Monitoring Models Based on Photoplethysmography and Electrocardiography. Sensors 2019, 19, 5543. [Google Scholar] [CrossRef] [PubMed] [Green Version]
- Atkins, N. The British Hypertension Society protocol for the evaluation of automated and semi-automated blood pressure measuring devices with special reference to ambulatory systems. J. Hypertens. 1990, 8, 607–619. [Google Scholar]
- Association for the Advancement Instrumentation. American National Standard for Electronic or Automated Sphygmomanometers; ANSI/AAMI SP 10 2002; AAMI: Arlington, VA, USA, 2002. [Google Scholar]
- Rastegar, S.; GholamHosseini, H.; Lowe, A. Non-invasive continuous blood pressure monitoring systems: Current and proposed technology issues and challenges. Phys. Eng. Sci. Med. 2020, 43, 11–28. [Google Scholar] [CrossRef]


| Parameters | PPG Systolic Pressure | PPG Diastolic Pressure | PPG Foot Pressure |
PPG Notch Pressure | BP Systolic Pressure | BP Diastolic Pressure | BP Notch Pressure |
|---|---|---|---|---|---|---|---|
| count | 64,121.000 | 64,121.000 | 64,121.000 | 64,121.000 | 64,115.000 | 64,115.000 | 64,115.000 |
| mean | 2.2417 | 1.1376 | 1.0870 | 1.5180 | 119.9480 | 76.3792 | 92.0488 |
| std | 0.5049 | 0.2259 | 0.2125 | 0.3397 | 21.9371 | 16.0327 | 18.3158 |
| min | 0.4017 | 0.1766 | 0.15109 | 0.2873 | 59.7634 | 50.5536 | 56.0053 |
| 25 | 1.9758 | 1.0685 | 1.0360 | 1.3684 | 104.7578 | 64.9357 | 77.7494 |
| 50 | 2.2089 | 1.1306 | 1.0804 | 1.4968 | 116.7934 | 72.6420 | 87.9682 |
| 75 | 2.6065 | 1.2331 | 1.1671 | 1.7008 | 133.4375 | 83.5564 | 105.1952 |
| Max | 3.5698 | 2.3116 | 2.3096 | 2.8044 | 197.5693 | 190.8637 | 191.5196 |
| BP Classification | MAE (mmHg) | MSE (mmHg) |
|---|---|---|
| Systolic Validation (mmHg) | 6.52 | 7.48 |
| Diastolic Validation (mmHg) | 4.19 | 5.13 |
| Study | Evaluation Metrics | Results Obtained | Method |
|---|---|---|---|
| Miao et al. [58] | SBP (7.10) DBP (4.61) | Res-LSTM | |
| Kachuee et al. [50] | MAE | SBP (11.17) DBP (5.35) | Adaboosting |
| Slapnicar, Mlakar, and Luštrek [39] | MAE | SBP (9.43) DBP (6.88) | DNN |
| Kurylyak, Lamonaca, Grimaldi [55] | MAE | 3.80 ± 3.46 for SBP 2.21 ± 2.09 for DBP | ANN |
| Our study | MAE | SBP (6.52) DBP (4.19) | AutoML (TPOT) |
Publisher’s Note: MDPI stays neutral with regard to jurisdictional claims in published maps and institutional affiliations. |
© 2021 by the authors. Licensee MDPI, Basel, Switzerland. This article is an open access article distributed under the terms and conditions of the Creative Commons Attribution (CC BY) license (https://creativecommons.org/licenses/by/4.0/).
Share and Cite
Fati, S.M.; Muneer, A.; Akbar, N.A.; Taib, S.M. A Continuous Cuffless Blood Pressure Estimation Using Tree-Based Pipeline Optimization Tool. Symmetry 2021, 13, 686. https://doi.org/10.3390/sym13040686
Fati SM, Muneer A, Akbar NA, Taib SM. A Continuous Cuffless Blood Pressure Estimation Using Tree-Based Pipeline Optimization Tool. Symmetry. 2021; 13(4):686. https://doi.org/10.3390/sym13040686
Chicago/Turabian StyleFati, Suliman Mohamed, Amgad Muneer, Nur Arifin Akbar, and Shakirah Mohd Taib. 2021. "A Continuous Cuffless Blood Pressure Estimation Using Tree-Based Pipeline Optimization Tool" Symmetry 13, no. 4: 686. https://doi.org/10.3390/sym13040686